Abstract
The production of heterologous proteins for medical use is an important area of interest. The optimization of the bioprocesses includes the improvement of time, costs, and unit operations. Our study shows that a lectin fraction from Tepary bean (Phaseolus acutifolius) (TBLF) has cytotoxic effects on colon cancer cells and in vivo antitumorigenic activity. However, the low-yield, time-consuming, and expensive process made us focus on the development of a strategy to obtain a recombinant lectin using engineered Pichia pastoris yeast. Pure glycerol is one of the most expensive supplies; therefore, we worked on process optimization using crude glycerol from biodiesel production. Recombinant lectin (rTBL-1) production and purification were evaluated for the first time by an experimental design where crude glycerol (G65) was used and compared against pure glycerol (G99) in a controlled stirred-tank bioreactor with a fed-batch system. The recombinant lectin was detected and identified by SDS-PAGE, Western blot, and UHPLC–ESI–QTOF/MS analysis. The results show that the recombinant lectin can be produced from G65 with no significant differences with respect to G99: the reaction rates were 2.04 and 1.43 mg L−1 h−1, and the yields were 264.95 and 274.67 mgL−1, respectively. The current low cost of crude glycerol and our results show the possibility of producing heterologous proteins using this substrate with high productivity.
1. Introduction
Lectins are mainly glycoproteins that have been considered as potential anticancer molecules due to their specific ability to recognize cancer cell membrane carbohydrates, provoking cell death by apoptosis induction [1]. A semipure lectin fraction from the Tepary bean (TBLF), with at least two glycoproteins (TBL-1 and TBL-2), specifically recognizes colon cancer cells with a differential cytotoxic effect between nonmalignant and malignant cell lines [2]. The effect of TBLF on cancer cells is related with apoptosis induction and cell cycle arrest [3]. TBLF exhibits low toxicity and inhibits early tumorigenesis in rats with chemically induced colon cancer [4,5]. The observed results for TBLF suggest its use as a therapeutic agent against colon cancer; however, the extraction of TBLF is expensive, time consuming, and has low yield. Therefore, a process to obtain a recombinant lectin from the Tepary bean (rTBL-1) was developed using engineered Pichia pastoris yeast [6].
P. pastoris is a methylotrophic yeast that has been used for the high-yield expression of proteins either by secretion to the culture medium or by intracellular localization [7,8]. The promising features of P. pastoris are giving rise to covering different aspects that may improve the efficiency of the whole bioprocess. The most commonly used method for heterologous protein production takes advantage of the AOX1 promoter that is repressed in cells grown on glycerol. It is induced about 1000-fold when methanol is used as a sole carbon source in the medium [9]. However, it is important to select a promoter that does not repress P. pastoris growth when it is cultivated in glycerol, as was the methanol-free GAP promoter [6]. It has been observed that recombinant proteins produced by P. pastoris are commonly well folded, and this microorganism does not contain toxic cell wall pyrogens (as found in Escherichia coli), viral nucleic acids, or potential oncogenes (as sometimes found in mammalian cells) [10,11]. For P. pastoris fermentations, glycerol is commonly used as the main initial carbon source.
Crude glycerol is a byproduct of biodiesel production that can be found in abundance at lower prices than glucose; therefore, it is attractive to use crude glycerol as a carbon source for P. pastoris bioprocesses. Biodiesel’s expanding market, with an annual growth of 42%, has increased glycerol availability and decreased its cost [12], making crude glycerol a useful substrate for recombinant protein production.
The optimization of the expression systems for heterologous protein production must consider several crucial steps that include the genetic modification of a microorganism, the expression cassette, fermentative process control that achieves a high/stable titer/concentration of the recombinant products, and the recovery of the targeted products. For bioprocess optimization, fed-batch is the dominating mode of operation in cultures with a high cell density of P. pastoris, where one of the most important and difficult tasks is satisfying the high oxygen demand. Bioprocess design requires identifying the optimum conditions for biomass growth-product formation, suitable nutrient and oxygen supplies, pH, and temperature. [13].
In this work, we report a novel optimization of the original process [6] using crude glycerol for high expression of the rTBL-1 by an experimental design that varies operational conditions such as pH, aeration, agitation, and temperature using engineered P. pastoris yeast. The goals are: (1) To use crude glycerol as a byproduct of biodiesel to produce biomolecules of economic interest; (2) to produce the rTBL-1; and (3) to detect and identify the rTBL-1 by SDS-PAGE, Western blot, and UHPLC–ESI–QTOF/MS.
2. Materials and Methods
2.1. Yeast Strain and Chemicals
The recombinant yeast strain P. pastoris SMD1168H was provided by Dr. Elaine Fitches, Department of Biosciences, Durham University, Durham DH1 3LE, UK and contains a constitutive pGAPZαB vector for lectin rTBL-1 production [6]. The recombinant lectin is expressed and exported to the medium supernatant without a precipitate. P. pastoris cells were grown on minimal glycerol (MG) plates containing a 1.34% (w/v) yeast nitrogen base without amino acids (YNB), 4 × 10⁻⁵% (w/v) biotin, 2% (w/v) glycerol, and 2% (w/v) zeocin agar, and stored at 4 °C. Long-term stocks were prepared as recommended by Invitrogen (Pichia Expression Kit, Version M) and stored at −80 °C.
Analytical grade glycerol (86–89% w/v purity) and pure glycerol (≥99.5% w/v purity) were purchased from Sigma-Aldrich (Munich, Germany). Semicrude and crude biodiesel glycerol were kindly donated by M.C. Saúl López Ordaz (Bioenergetic Laboratory, Autonomous University of Queretaro, Mexico). Crude glycerol (G65) was obtained from the transesterification reaction after biodiesel separation and neutralization with sodium hydroxide (1% w/v) followed by simple centrifugation (4000 rpm for 20 min). After removing the solid phase with sodium sulfate, the obtained glycerol was used as the substrate. The semicrude glycerol (G80) was extracted from G65 by evaporating the ethanol at 80 °C for 20 min with a majority amount of water. Table 1 shows the purity of the glycerol used as a substrate in this study.

Table 1.
Glycerol purity level.
2.2. Inoculum Preparation
One P. pastoris colony was inoculated in 5 mL in yeast peptone dextrose YPD (yeast extract 12.5 g L−1, peptone 25 g L−1, dextrose 15 g L−1, biotin 0.4 mg L−1, and potassium phosphate 0.1 mol L−1; pH 6.0) as a starter medium for preinoculum preparation. The culture was grown overnight at 30 °C in 100 mL of buffered minimal glycerol (BMG) (potassium phosphate 100 mM, pH 6.0, yeast nitrogen base (YNB) 1.34% (w/v), biotin 4 × 10⁻⁵% (w/v), and glycerol 1% (v/v)) in a 0.5 L baffled flask; inoculated with 0.5 mL of the overnight culture; and incubated at 30 °C to 200 rpm until the culture reached an OD600 of ≥20. This culture was used to inoculate 1.1 L of fermentation medium.
2.3. Fermentation Conditions
2.3.1. Optimization of Glycerol Concentration in Flask Fermentation
To find the optimum glycerol concentration, P. pastoris was grown in 250 mL Erlenmeyer flasks filled with 100 mL of minimum salt medium (MSM), with (20–100 g L−1) of G99 at 200 rpm and at 30 °C for 168 h. Once the optimum glycerol concentration was found (40 g L−1), cultures were grown using G99, G86, G80, or G65 glycerol in Erlenmeyer flasks at 200 rpm, 30 °C, and initial pH 3 for 168 h.
Fermentations were carried out in a 2.1 L working volume using an In-Control (Applikon, Delft, The Netherlands) with the Luccullus PIMS Lite software version 3.7.2 (Applikon). The starting volume (sterilized inside the reactor) was 1.1 L of MSM (CaSO4·2H2O 0.93 g L−1, K2SO4 18.2 g L−1, MgSO4·7H2O 15 g L−1, KOH 4.13 g L−1, H3PO4 27 mL L−1, glycerol 40 g L−1) and 0.5 mL of antifoam VRF-30. For the nitrogen source and pH control, ammonium hydroxide 15% (v/v) was used; pH was monitored using a pH electrode (Applikon Biotechnology). PTM1 trace salts (CuSO4·5H2O 6.0 g L−1, NaI 0.08 g L−1, MnSO4·H2O 3.0 g L−1, Na2MoO4·2H2O 0.2 g L−1, boric acid 0.02 g L−1, CoCl2 0.9 g L−1, ZnCl2 20 g L−1, FeSO4·7H2O 65 g L−1, biotin 0.2 g L−1, sulfuric acid 5 mL L−1) were aseptically added at 4.35 mL L−1 after sterilization and prior to inoculation.
2.3.2. Optimization of pH in Batch Fermentation
Batch cultures were carried out using a 3-L stirred tank bioreactor, using only 1-L of 40 g L−1 of G99 or G65 as the carbon source medium. The operating conditions were 400 rpm, compressed air continuously sparged into the culture at an aeration rate of 1 vvm, and absolute air pressure of 1 bar. The operating pressure was set by the manipulation of the inlet compressed air and the regulatory valve position in the exit gas line. The short interruption of aeration allowed the determination of the specific oxygen uptake (qO2) rate at exponential phase for G65 and G99 glycerol. All measurements were performed in triplicate at 30 °C.
2.3.3. Operation Parameter Optimization in Fed-Batch Fermentation
To produce the bioreactor inoculum, individual colonies of P. pastoris yeast were selected, inoculated (100 mL of liquid BMG medium), and cultivated in a shaker (30 °C, 200 rpm, 24 h). The inoculum was served into a sterilized bioreactor containing MSM medium, and dissolved oxygen (DO) was maintained at 30% (v/v) of saturation monitored using an electrode (Applikon Biotechnology) through a cascade of air flow and agitation. The batch and fed-batch phase were performed until the glycerol was depleted, as indicated by a sharp rise in DO (DO spike). Samples were taken at intervals 24 and 12-h for batch and feed-batch, respectively; wet cell weight (WCW) and dry cell weight (DCW) were used as cell density determination. The secreted proteins were separated by centrifugation (30 min, 7500× g, 4 °C). The oxygen mass transfer coefficient (kLa) was determined using a dissolved oxygen electrode (AppLiSens Z010032520, Applikon, CA, USA) [14]. Dissolved oxygen concentrations were measured every 5 s by an oxygen electrode attached to a controller in-control (Applikon, CA, USA) and the kLa determination was carried out [15].
The fed-batch fermentation was carried out in the previously described reactor with an absolute air pressure of 1 bar. The optimization parameters were performed at 25–37 °C and pH 3.0–6.0, pH was controlled using an ammonium hydroxide solution. Air-flow rate was of 0.5–1.5 vvm and agitation was of 500–1000 rpm. In this part of the study, a three-stage fermentation protocol was used. The first stage was a G65 (40 g L−1) batch fermentation for 24 h. In the second stage, the process was switched to fed-batch using G65-MSM 50% v/v added to the bioreactor with a constant feeding flow rate (F) of 0.06 mL min−1 and dilution rate (D) ranging from 0.02 to 0.007 h−1 according to the equation F = DV0eDt, where F is the feed rate, D is the dilution rate, V0 is the culture volume when the medium feed started, and t is the time. The medium was pumped into the reactor using a high-pressure pump (MasterFlex). In the third stage, at about 96 h of the fed-batch phase, the process was switched to batch mode using G65 (40 g L−1) for 24 h. A DO-Stat was used to control the feeding rate. During the feeding phase of all the fed-batch fermentations, the residual glycerol concentration was found to be below 5 g L−1. A triplicate analysis was performed using optimal operating conditions with G99.
2.4. Purification of rTBL-1
The culture supernatant was separated from the cells by centrifugation (30 min at 7500× g, 4 °C); filtered through GF/D and GF/F glass fiber membranes (Whatman, Sigma-Aldrich, Munich, Germany); and adjusted to 0.02 M sodium phosphate buffer, 0.4 M sodium chloride, pH 7.4, by adding 4× concentrated stock. rTBL-1, which contains a hexa-histidine tail, was purified from the clarified culture supernatant by nickel affinity chromatography using precharged Ni Sepharose 6 fast flow columns (Amersham Biosciences, Little Chalfont, UK) with a flow rate of 2 mL min−1. After loading, the columns were washed with 0.02 M sodium phosphate buffer, 0.4 M sodium chloride, pH 7.4, and the bound protein was eluted with 0.2 M imidazole in the same buffer. Eluted proteins were checked for purity by SDS-PAGE, dialyzed against deionized water using multiple changes to remove all small molecules, then freeze-dried and stored at −20 °C [6].
2.5. rTBL-1 Identification
Aliquots from the soluble and insoluble fractions were assayed for protein content using the Bradford method [16] and using bovine serum albumin as a protein concentration standard. Culture supernatant samples and rTBL-1 fractions were analyzed by SDS-PAGE in 13% (w/v) polyacrylamide gels under denaturing conditions according to standard protocols [17]. All the SDS-PAGE analyses were performed using 25 µL of cleared supernatant, and the gels were stained with Coomassie-based stain (SimplyBlue SafeStain, Invitrogen, MA, USA), and the electrophoresis procedure was carried out according to the manufacturer’s instructions. rTBL-1 was estimated using image densitometry software ImageJ [18], where the gels were scanned using an HP ScanJet and protein bands were selected, plotted, and compared using the ImageJ software. The presence of rTBL-1 was confirmed using periodic acid-Schiff [19] staining for the presence of glycoproteins and identified by Western blot. Briefly, transference to nitrocellulose membranes (Bio Rad) was conducted at 4 °C and 15 V for 20 min in a Trans-Blot® SD Semi-Dry Electrophoretic Transfer Cell (Bio Rad, USA). The membrane was blocked with blocking buffer TTBS (tween-20 0.05% (w/v) and 5% skim milk (w/v)) overnight at 4 °C under shaking (420 rpm). The membrane was incubated for 60 min at room temperature under constant agitation with a polyclonal anti-rTBL-1 antibody [20] 1:30,000 in 1× TTBS with 2% (w/v) skim milk, followed by several washes with 1× TTBS. The membrane was blocked again with blocking buffer for 1 h at room temperature under constant agitation and incubated with the secondary antibody (antirabbit IgG, H+L) conjugated with horseradish peroxidase (Jackson Immune Research, Baltimore, MD, USA) 1:15,000 for 1 h at room temperature. The membrane was rewashed with 1× TTBS and immunodetection was achieved using the AmershamTM ECLTM prime Western blotting detection reagent (GE Healthcare, Little Chalfont, Bucks, UK).
2.6. UHPLC-ESI-QTOF/MS Analysis
rTBL-1 was analyzed by mass spectrometry [20] using an ultra-high-performance liquid chromatograph (UHPLC) (ACQUITY Class H, Waters Corporation, Milford, MA, USA) coupled to a high-resolution mass spectrometer with a time of flight and electrospray ion source (ESI-QTOF) (model Xevo G2 QTOF, Waters Corporation, Milford, MA, USA), and a C8 column (2.1 × 100 mm, 1.7 µm, Waters Corporation, Milford, MA, USA). The injection volume was 20 µL.
2.7. Comparison between rTBL-1 and the Native Lectin Genetic Sequence and Cytotoxicity Assay
The coverage percentage of identity between the mature sequences of rTBL-1 and the native lectin was determined using the ESPript Versión 3.0 software (http://espript.ibcp.fr/ESPript/ESPript/. Lyon, France. Accessed on February 2021). The native lectin sequence was obtained from Torres-Arteaga et al. [21], and the rTBL-1 sequence, from Martínez-Alarcón et al. [6].
A homologation between rTBL-1 and the native lectin from Tepary bean (Phaseolus acutifolius), Tepary bean lectin fraction (TBLF), was carried out by 13% (w/v) polyacrylamide SDS-PAGE [17] and the protein bands were quantified by densitometry using ImageJ software [18]. When the rTBL-1 concentration was calculated, a dose–response curve was performed [2,3]. Briefly, HT-29 colon cancer cells (ATCC HTB-38) were seeded (3 × 10⁴ cells/well) using 24-well plates in Dulbecco’s modified Eagle medium (DMEM, 12100-046, Gibco, MA, USA) supplemented with 10% (v/v) fetal bovine serum (FBS, P30-3306, PAN Biotech, Aidenbach, Germany) for 48 h. Cells were synchronized for 24 h with 2% (v/v) FBS DMEM and different concentrations of rTBL-1 were added in DMEM with 0.5% (w/v) bovine serum albumin (ASB). After incubation for 8 h, cells were harvested with 1 mM ethylenediaminetetraacetic acid (EDTA) in phosphate buffer solution for 5 min and then with trypsin/EDTA (0.15 mM/0.5 M, respectively), and a direct count was performed with a Neubauer chamber (Merck (BRAND®), Darmstadt, Germany) [3]. The lethal concentration (LC50) was obtained by simple linear regression using the log10 of concentration vs. survival percentage.
2.8. Statistical Analysis
Comparisons between treatments were analyzed by one-way ANOVA for glycerol concentration and pH optimization (Tukey, p ≤ 0.05) and for the rTBL-1 cytotoxic effect (Dunnett, p ≤ 0.05). To study the effect of four operational variables (aeration, agitation rates, temperature, and pH) (Table 2) on three independent factors (oxygen mass transfer coefficient (kLa), dry cell weight, and rTBL-1), a robust-model process-optimization experimental design was used [22]. Experiments of the three independent factors, each one at four levels with two center points and eight replicates, were performed, resulting 26 experiments for G65. For response surface methodology (RSM) experiments, the “Fusion Pro” experiment design software (Version 6.7.0, CA, USA) was used for regression and graphical analysis of the experimental results. Linear and quadratic models were obtained.

Table 2.
Operational variables used for the study of the independent factors.
3. Results and Discussion
3.1. Effect of Glycerol Concentration on rTBL-1 Production in Batch Cultures
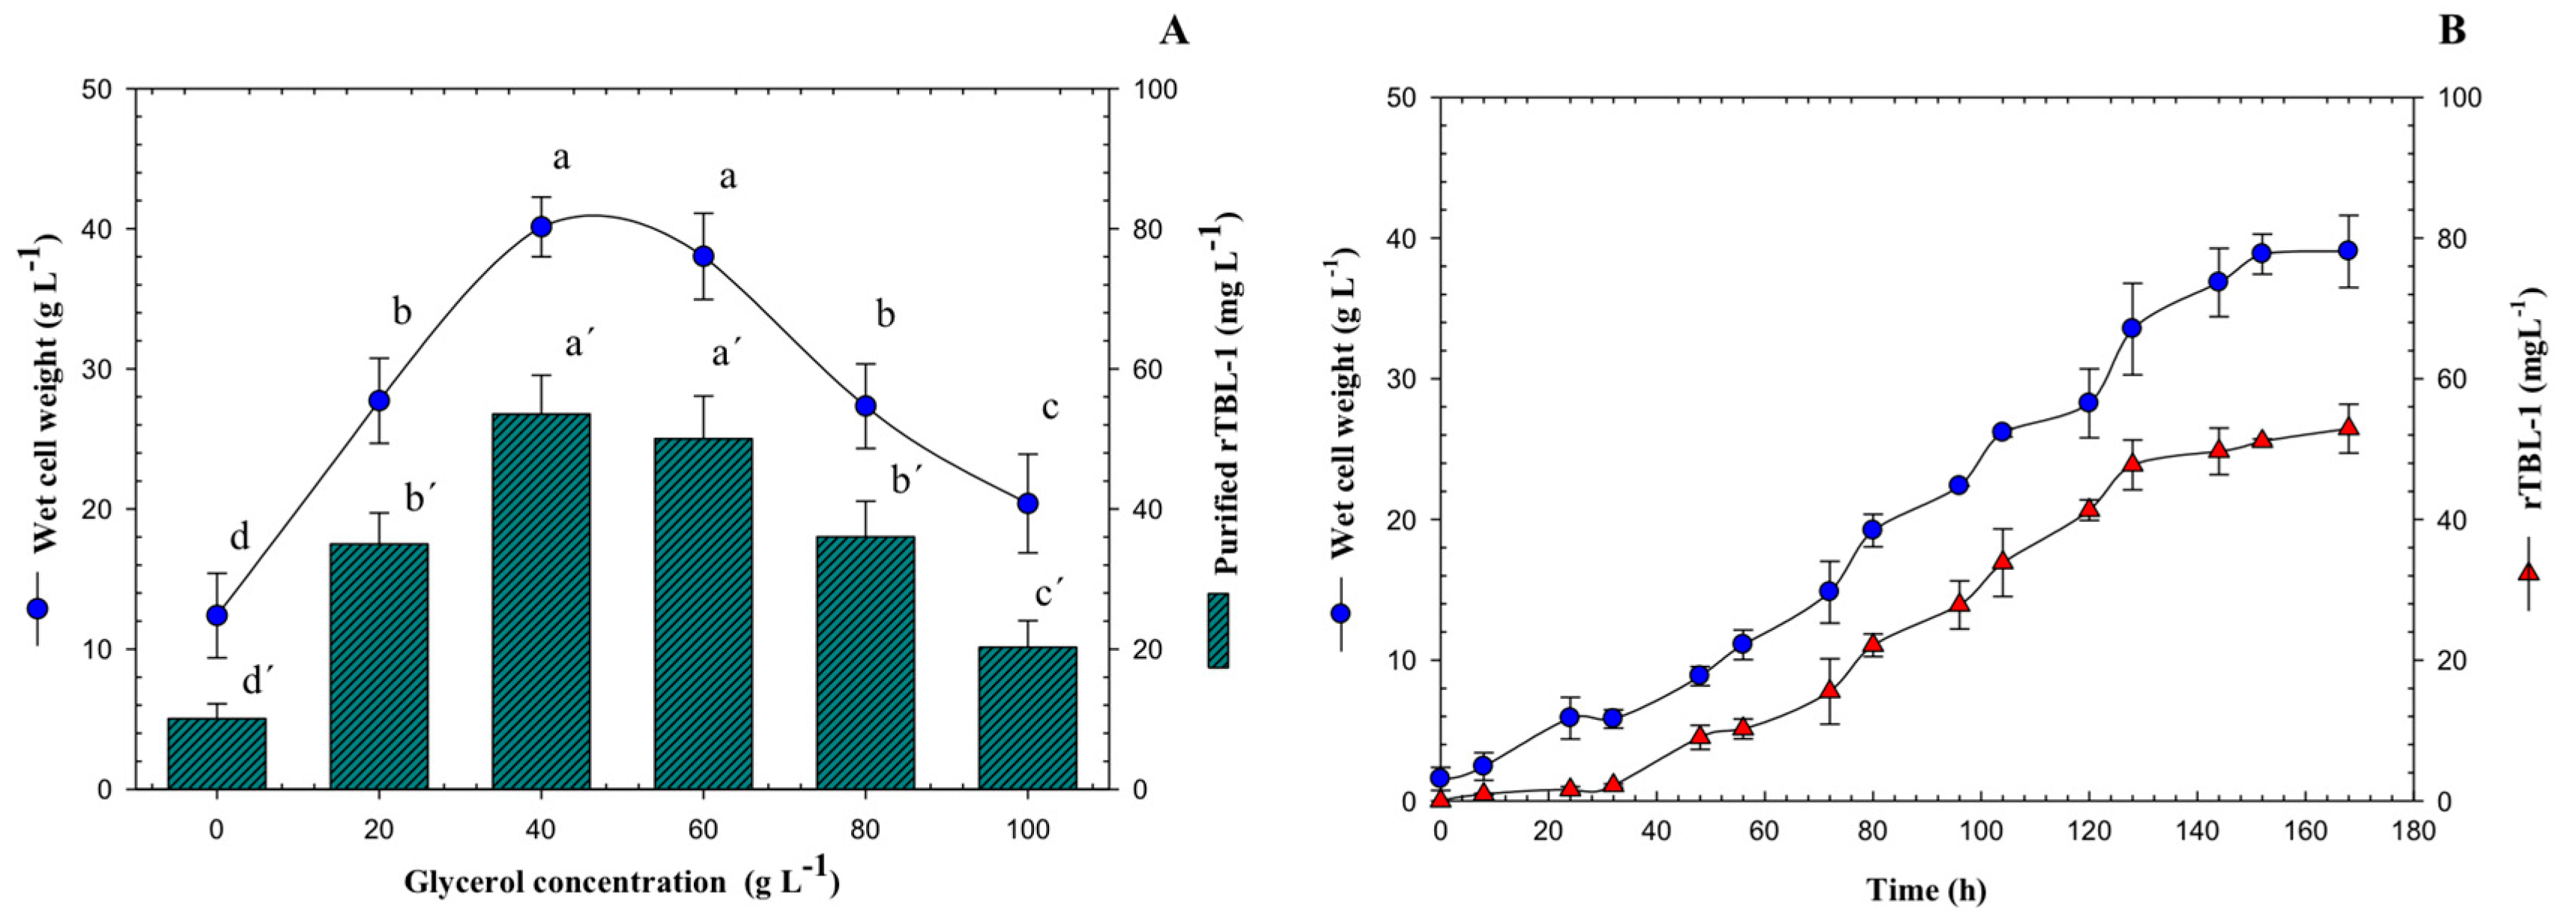
A critical parameter that needs to be controlled with precision in bioprocesses is glycerol concentration. Growth kinetics and quantitation of rTBL-1 were obtained for each glycerol concentration (data shown only for 40 g L−1). To find the optimal glycerol concentration, 20–100 g L−1 were tested using a batch system and rTBL-1 production was measured after 168 h. Results are shown in Figure 1A. rTBL-1 production was higher at a concentration of 40 g L−1 with G99, reaching 53.5 mg L−1. Biomass accumulation was similar at glycerol concentrations of 40 and 60 g L−1, starting from >40 g WCW L−1 at induction to >38 g WCW L−1. At a glycerol concentration of 100 g L−1, the lowest amount of rTBL-1 was produced (20.27 mg L−1). The cells grew very slowly, reaching >20.39 g WCW L−1. The growth-limiting level of glycerol for P. pastoris cells must be related with the observed slow growth and low protein expression.
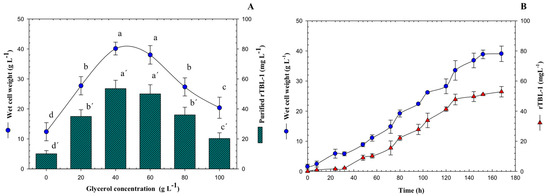
Figure 1.
(A) Kinetic profile of wet cell weight and rTBL-1 production using 40 g L−1 of G99 in batch culture. (B) Effect of substrate concentration on rTBL-1 and wet cell weight production of P. pastoris in batch culture using G99 after 168 h of growth at the following operating conditions: 30 °C and 200 rpm, Erlenmeyer flask level. Error bars correspond to the standard deviation of three independent determinations. Different letters represent significant differences (p ≤ 0.05; Tukey, SAS System Version 9, NC, USA) between treatments for wet cell weight or for rTBL-1.
Figure 1B shows the production of wet cell weight and the quantification of rTBL-1 with an initial concentration of 40 g L−1 of G99. The maximum concentration of recombinant lectin was reached by starting the stationary growth phase of the yeast P. pastoris, for which the process was stopped at 168 h, and the extraction and purification of the lectin was prepared.
3.2. Comparison of the Four Purity Levels of Glycerol as Substrate in Batch Cultures
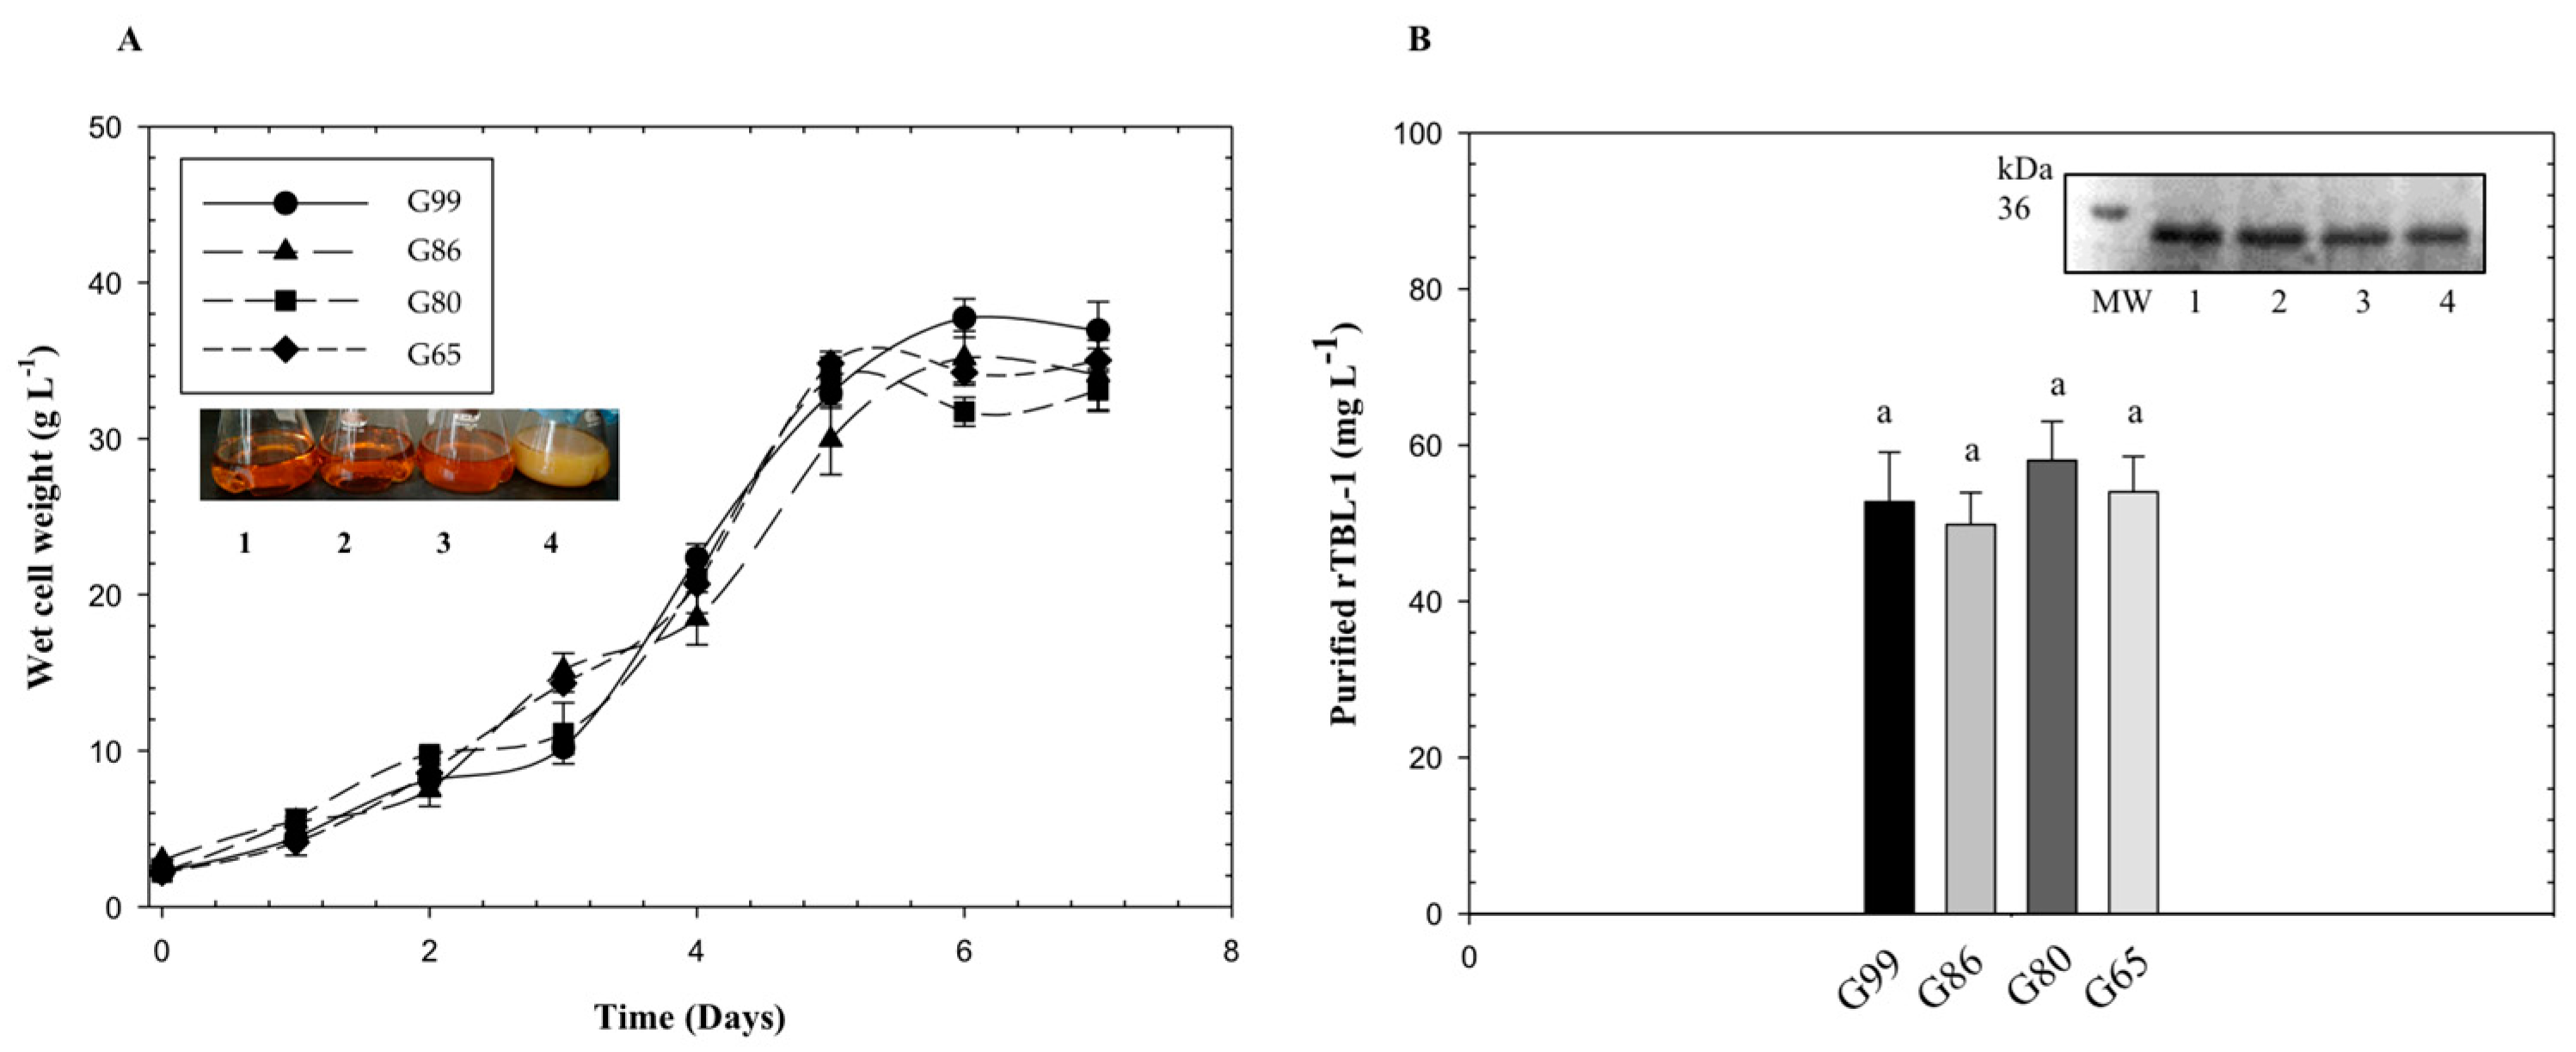
It has been reported that the level of expression of heterologous proteins by P. pastoris with the pGAP vector is dependent on the carbon source and the foreign protein [23]. In this study, four levels of glycerol purity were tested in parallel experiments for P. pastoris cultures: G99, G86, G80, and G65. The results are displayed in Figure 2. The data show the average four identical batches. In similar flask experiments, crude glycerol and pure glycerol do not show significant differences [24]. After five days, glycerol depletion resulted in a plateau of cell growth and protein production with a final cell density of 37 g L−1 and protein level of 58 mg L−1.
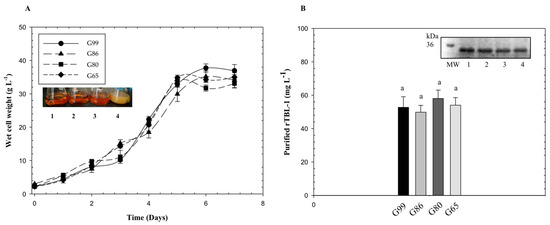
Figure 2.
Growth curves and rTBL-1 production using different purity levels of glycerol with P. pastoris yeast. (A) Growth of Pichia pastoris for different sources of glycerol; (B) rTBL-1 production and purification. SDS-PAGE: lane 1, G99; lane 2, G86; lane 3, G80; lane 4, G65. M, molecular weight marker. Erlenmeyer flask level, 30 °C, 200 rpm. Glycerol initial concentration was 40 g L−1. Same letters represent no significant differences between treatments (p ≤ 0.05; Tukey, SAS System Version 9).
In a recent study, crude glycerol impurities such as methyl ester, grease, glycerol, methanol, and metal ions Na+, Ca2+, and Fe3+ were determined on lipase production in P. pastoris yeast. Impurities sped up the stationary phase and, under the same fermentation conditions, cell growth and enzyme activity increased using crude glycerol instead of pure glycerol. These results suggest that impurities can accelerate P. pastoris growth [25]. In our study, no inhibition was observed by the impurities possibly present in crude and semicrude glycerol.
3.3. Effect of pH on rTBL-1 Production in Batch Cultures
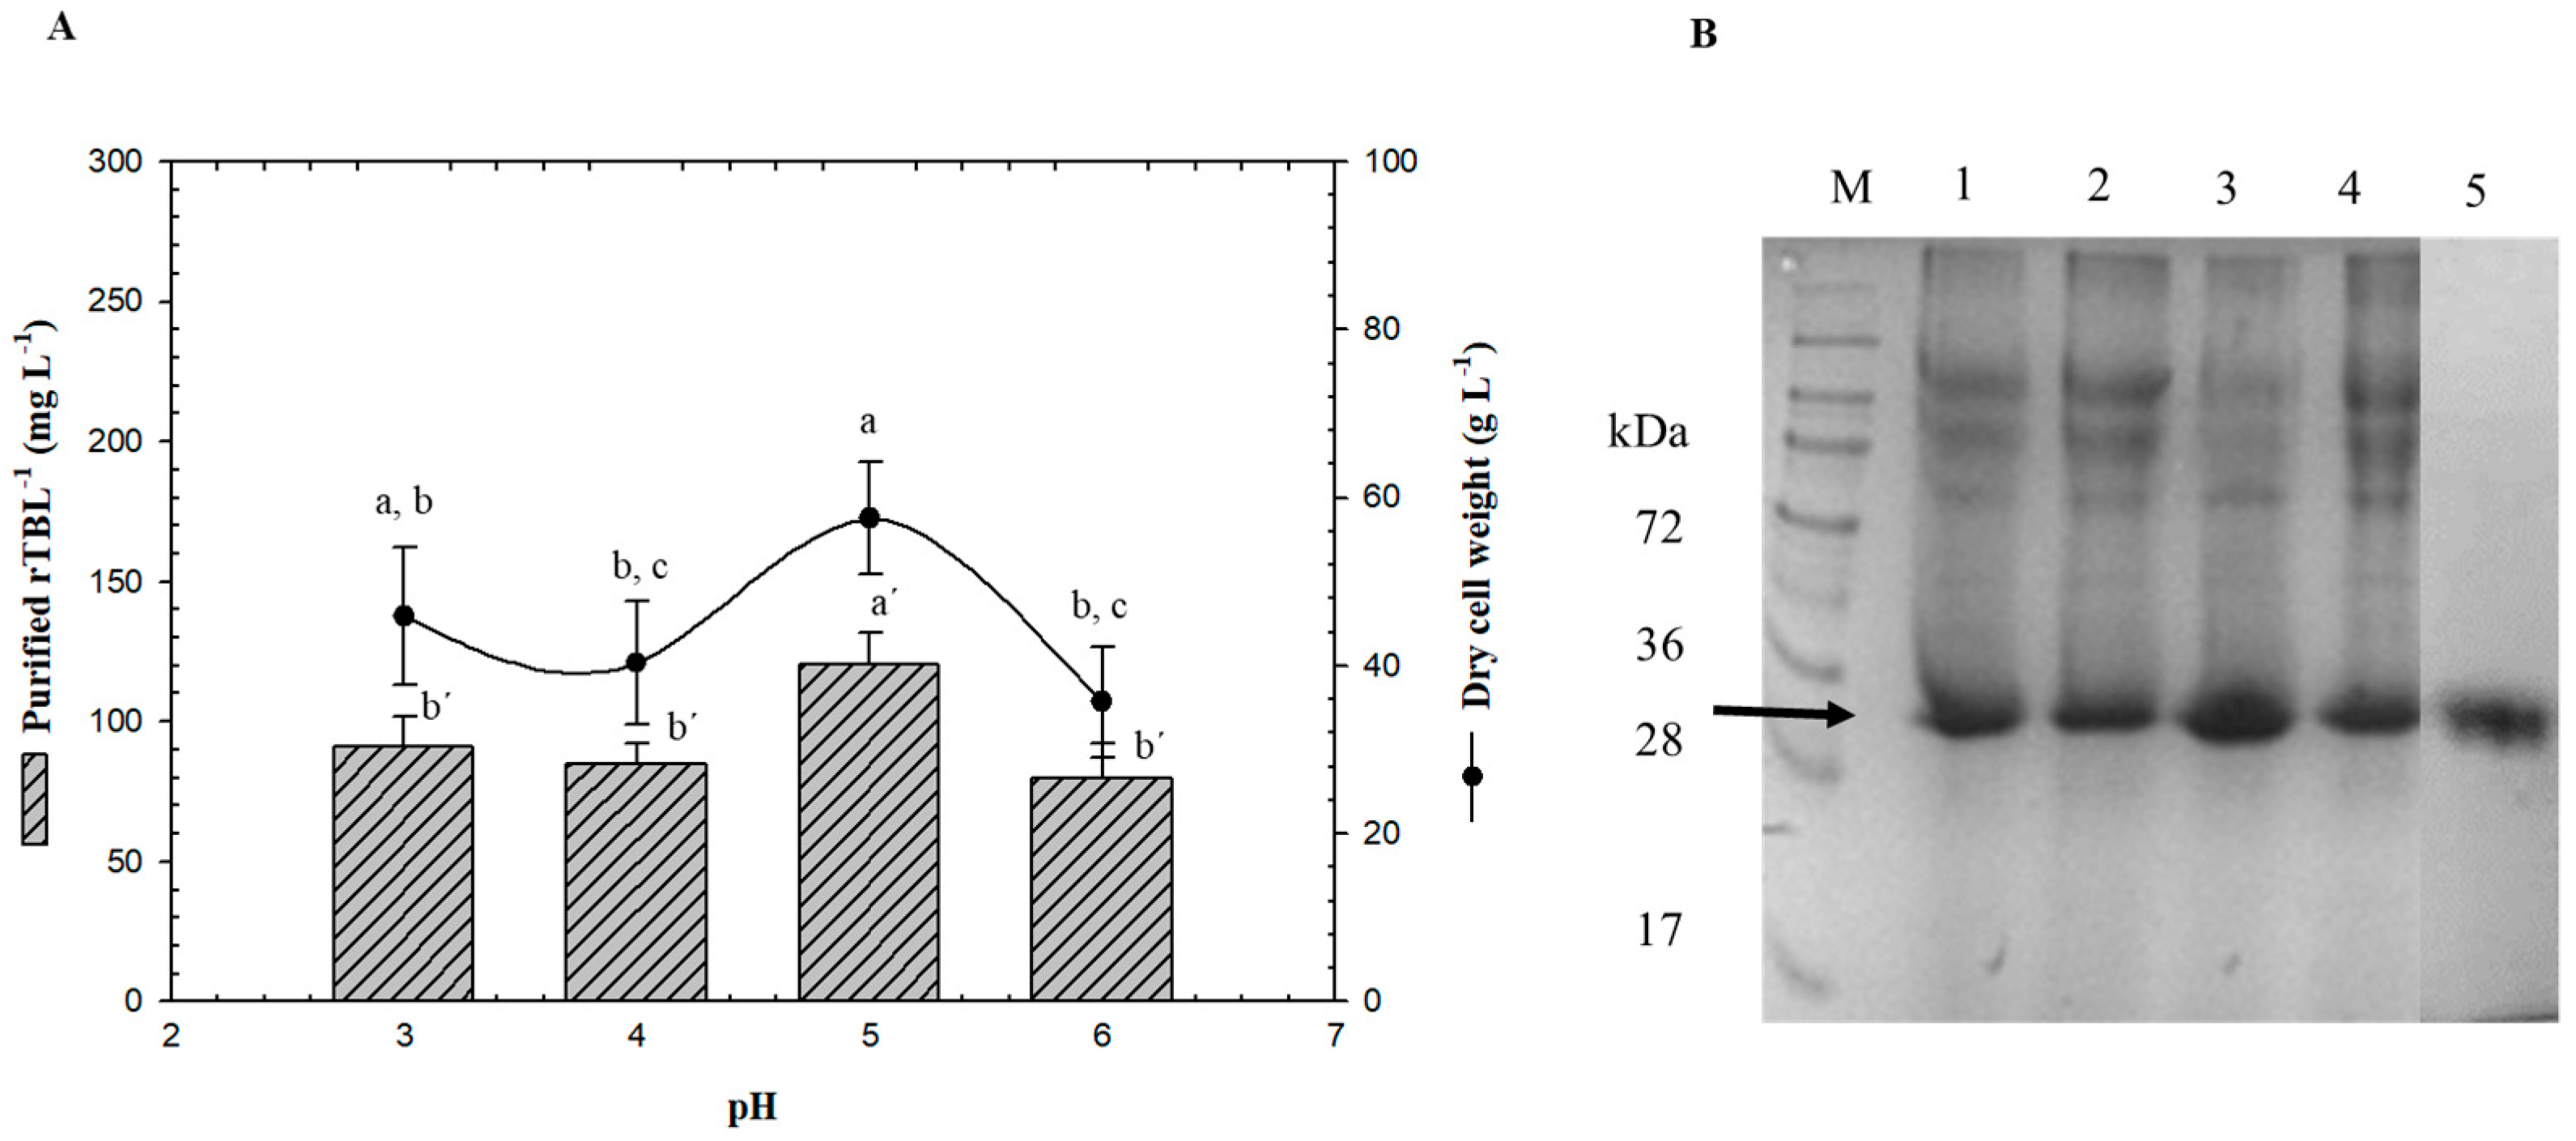
Batch experiments were conducted in a 3-L bioreactor using only G99 to study the effect of pH in the bioprocess (Figure 3). The initial carbon source concentration in the MSM medium was 40 g L−1, pH of the broth was controlled with ammonium hydroxide, and the dissolved oxygen level was maintained above 30% (v/v). Compared to the shake flasks, an increase in biomass and protein production was observed, which can be related to the aerobic environment. The batch system showed better results than baffled flasks with maximum specific growth rate values of 41% more, biomass yield of 34% more, and protein product yield of 44% or more. No cell growth inhibitory effects caused by fermentative byproducts were detected when glycerol was used as the substrate in P. pastoris [26].
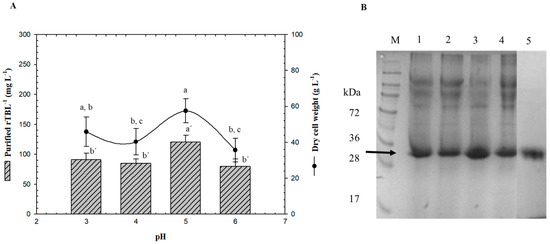
Figure 3.
Effect of pH on rTBL-1 and biomass production. (A) Production in a batch system over 96 h with G99, (B) SDS-PAGE analysis of fermentation samples (96 h) at different pH. Lane 1, pH 3; lane 2, pH 4; lane 3, pH 5; lane 4, pH 6; lane 5, purified rTBL-1. M, molecular weight marker. rTBL-1 band is indicated by arrow (b). Error bars correspond to the standard deviation of three independent determinations. Different letters represent significant differences (p ≤ 0.05; Tukey, SAS System Version 9) between treatments for wet cell weight or for rTBL-1.
It is known that P. pastoris is capable of growth over a broad pH range; therefore, rTBL-1 production was evaluated from pH 3 to 6. It has been reported that this range of pH has little or no effect on the cell growth [27]; nevertheless, it can affect recombinant protein secretion since the activity of certain enzymes such as proteases in the fermentation medium is affected by pH [28]. A strategy used for optimization studies consists of changing the medium pH to 5 because it is optimum for cell growth [27,29]. However, the optimum pH for shake flask culture may not necessarily be the same for fermentation. Dehnavi et al. [30] reported that the optimum pH for β-xylosidase production in shake flask culture was 4.8, but during fermentation, the optimum was 6. pH was the most significant factor affecting the rTBL-1 production with a minimum point between 3, 4, and 6 (Figure 3A).
The low response may be due to proteolytic degradation in this pH range due to the presence of host proteases in Pichia fermentation [31]. P. pastoris has a growth range of pH from 3 to 7, therefore, it is possible that protein production would decrease as the pH increases. Based on our results, optimum rTBL-1 production should occur between 4 and 5 to avoid proteolytic degradation (Figure 3B).
3.4. Operation Parameter Optimization Using G65 by Fed-Batch Fermentation
Most fermentation processes using Pichia yeast are carried out at an optimum temperature of 30 °C [25], although the effect of temperature on recombinant protein production in P. pastoris has not been reported. In our experimental design, the temperature ranged from 25 to 37 °C. The model suggests that temperatures above 30 °C are not adequate for rTBL-1 production. It was observed that temperatures above 32 °C could decrease protein expression and provoke cell death [32] due to cell lysis and high protease activity in cultures. Our results suggest that temperatures between 25 and 30 °C are optimum for rTBL-1 production.
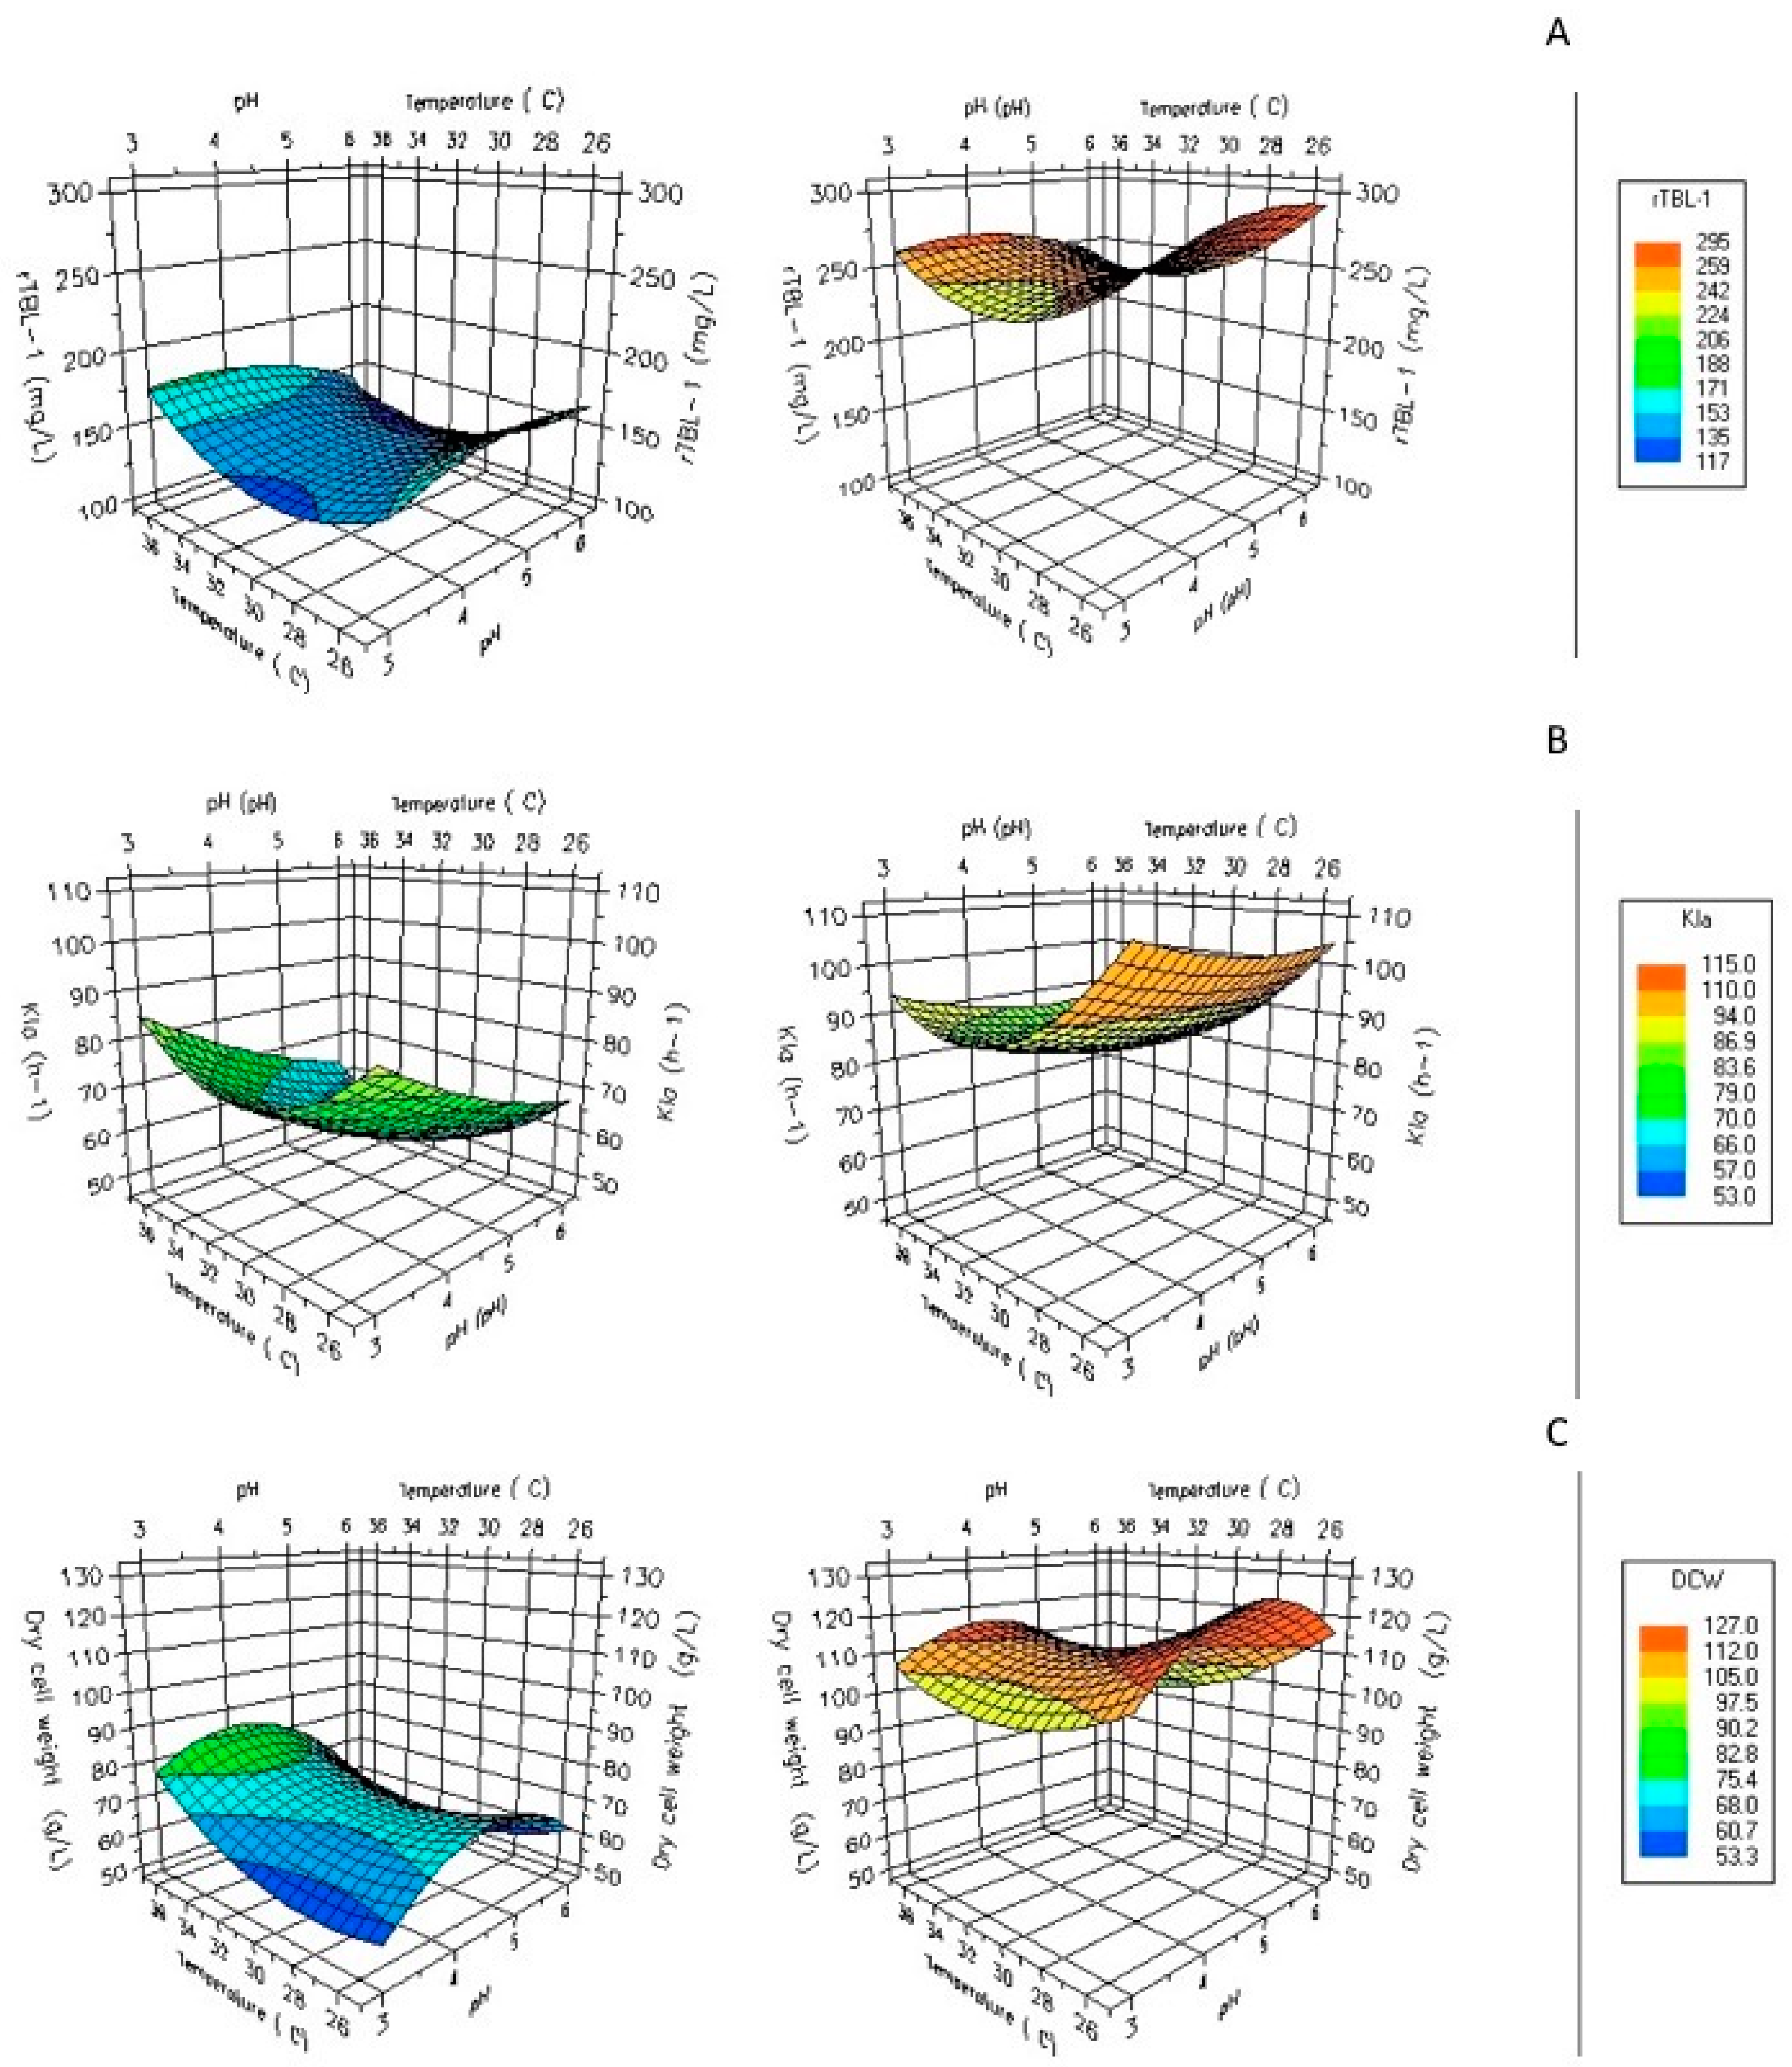
The effects of glycerol on rTBL-1 expression in fed-batch fermentations using G65 are shown in Figure 4A. The fermentation profile showed that production of recombinant protein was associated to biomass formation. Glycerol from G65 was entirely consumed in about 96 h, less than in shake flasks. In addition, the volumetric mass oxygen transfer coefficient (kLa) has been reported to have an essential role in other yeasts growing on glycerol [33].
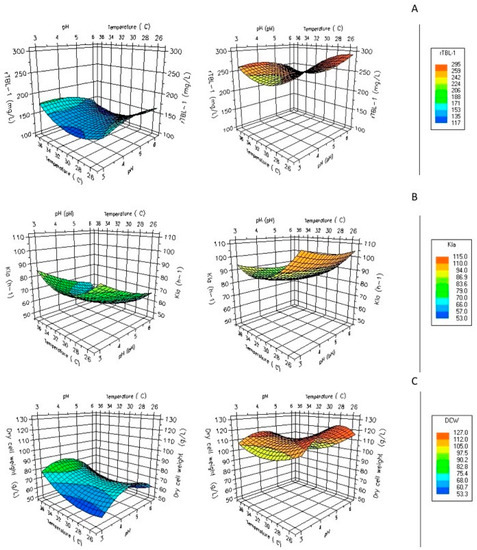
Figure 4.
Effect of pH and temperature, aeration, and agitation rates on measured purified r-TBL-1 yield using G65 as the carbon source. Maximum and minimum values obtained from (A) purified rTBL-1 values, (B) kLa, (C) dry cell weight. Measured at 1000 rpm and 1 vvm of operation for G65 in fed-batch system.
The kLa increased accordingly with superficial gas velocity and decreased with cellular density. The increase in initial kLa from 65 h−1 to 115 h−1 led to a 4.6-fold increase in rTBL-1′s final concentration (Figure 4B). On the other hand, experiments were also performed with controlled dissolved oxygen (DO). Setting an optimal kLa instead of controlled DO suggests that kLa is a good parameter for the rTBL-1 production using crude glycerol in P. pastoris fermentations and it is necessary considering it in bioprocess scale-ups. A second-order polynomial model provided the best fit to the experimental data obtained for rTBL-1:
rTBL-1 = 234.29 + 4.43 (X1) + 27.32 (X2) − 10.62 (X3) − 3.86 (X4) − 47.72 (X1)2 − 13.62 (X2)2 + 29.74 (X3)2 − 12.99 (X4)2 + 0.11 (X1 × X2) − 4.72 (X1 × X3) − 4.90 (X1 × X4) − 3.90 (X2 × X3) + 5.30 (X2 × X4) − 11.08 (X3 × X4), where X1 is aeration, X2 is agitation, X3 is temperature, and X4 is pH.
Of the two models for rTBL-1 (Fisher’s test), the one that presented the best fit was the polynomial quadratic model. Statistical data are shown in Table 3.

Table 3.
Statistical data of the obtained models for (rTBL-1).
According to the results obtained by the experimental design, it was shown that the parameter with the greatest significance for the models was agitation, followed by pH and temperature. The most significant parameters expressed by the Pareto diagram for rTBL-1 production were agitation and temperature. On the other hand, for biomass production, the significant parameter continued to be agitation, as well as temperature and pH for the oxygen transfer coefficient.
Figure 4C shows that the metabolism of glycerol in P. pastoris is aerobic, with 0.5–1.6 vvm flux, even at high glycerol concentrations using fed-batch systems, considering that glycerol is a low fermentative carbon source. The experimental conditions used in this work show that an aeration rate rise of up to 1 vvm is adequate for the fed-batch cultivation of P. pastoris.
3.5. Comparison of Process Parameters Using G99 and G65 by Fed-Batch Fermentation
Due to the importance of using the byproducts of biodiesel as a carbon source for rTBL-1 production, and the fact that there were no differences between the four carbon sources used, only G99 and G65 were selected for the optimization of fermentation parameters. P. pastoris exhibited high demand on dissolved oxygen, the use of bioreactors allows a higher transfer rate with faster consumption of the carbon source. Comparative results between G99 and G65 glycerol production parameters are shown in Table 4, where the potential application of glycerol derived from biodiesel production in P. pastoris fermentations shows good potential to generate value-added products.

Table 4.
Substrate effect on rTBL-1 production using P. pastoris in a fed-batch system at 1000 rpm, pH 4.5, and 1 vvm using G99 or G65.
In a previous study, Martinez-Alarcón et al. [6] worked with the same strain using pure glycerol under the following operating conditions: 30 °C, pH 5, and a fed-batch system. The authors obtained 316 mg recombinant lectin L−1; here, we obtained 275 and 265 mg recombinant lectin L−1 through a production optimization with G99 and G65, respectively. Differences in yield between pure glycerol systems may be due to the standardization between different laboratory conditions and the equipment used since Martinez-Alarcon used an Applikon bioreactor of 7 L. In our study, we used a 3-L bioreactor. However, we show that no differences were obtained between G99 and G65 substrates and that it is important to standardize the production for a larger equipment.
Several studies have shown the utilization of glycerol for the production of heterologous proteins. Different glycerol preparations were assayed for P. pastoris growth and recombinant erythropoietin production [13]. A 1.5-fold improvement in cell concentration using glycerol from canola oil when compared to pure glycerol was observed. However, glycerol derived from soybean was not suitable due to simple precipitation. The recombinant yeast had the heterologous gene under the inducible pAOX1 promoter control, which supposes two steps: to obtain high cell density and to induce heterologous gene production by methanol addition. In this study, a single step was carried out for both biomass and heterologous protein production. The constitutive production of a phytase encoding gene cloned under the control of the constitutive pGAP promoter using glucose and glycerol as substrates has been reported [26]. In these conditions, P. pastoris showed a 30% increase in cell growth and a 10% increase in recombinant protein production; however, the authors reported that it was a necessary glycerol pretreatment. Therefore, as far as we know, our study is the first to report the experimental design and utilization of crude glycerol without any pretreatment for the efficient production of a recombinant protein; in this case, the rTBL-1.
Recombinant protein production in fermenter cultures of P. pastoris is generally performed using a two-stage process [34]. In the first stage, the culture grows in a batch phase with a repressing carbon source—in this case, glycerol—for biomass production. When the initial carbon source has been fully consumed, a growth-limiting amount of the repressing carbon source is fed that allows a phase change in which biomass production increases. In our study, we found that this resulted in a biomass accumulation of >60 g WCW L−1 prior to feed.
For P. pastoris bioprocesses, pH is a critical parameter for cell growth, productivity, and product quality. To optimize the process, an experimental design was tested for pH and temperature, maintaining aeration and agitation rates set points. The initial biomass at the start of induction was around 5 g L−1 WCW. During the growth phase, glycerol was fed exponentially for 48 h with a feed rate ranging from 0.02 to 0.007 h−1. Harvest was performed 72 h post-feed, and the products were purified and analyzed through protein chromatography. The results show that the yield increased as the aeration and agitation rate increased. On the other hand, increases in pH and temperature resulted in decreased yield. To achieve a high yield, the preferred set points were temperatures between 25 and 30 °C, high agitation and aeration rate, and low pH. According to the DoE results, the optimal pH and temperature for both productivity and product quality would be pH 4.5 and 25 °C. When experiments were performed under these conditions, no significant differences for yield between G99 and G65 were observed (Table 5). The temperature and DO were kept constant, with the pH set at 4.5. Ye et al. [35] demonstrated the production of an antibody by P. pastoris through an optimization design, showing that, at 26 °C and pH 6.3, they reached their maximum yield.

Table 5.
Kinetic parameters of rTBL-1 production using P. pastoris in a fed-batch system at 1000 rpm, pH 4.5, and 1 vvm using G99 or G65 glycerol.
Our results suggest that the bioprocess was not inhibited by free fatty acids from crude glycerol. The fastest glycerol consumption rate was observed for G99 (1.82 mg L−1 h−1), contrary to a study where pure glycerol had the slowest carbon source utilization rate [36]. Nevertheless, P. pastoris growing on G65 showed no significant differences when compared to G99 fermentation with a glycerol utilization rate of 1.65 mg L−1 h−1.
Some reports have mentioned that the oil type and catalyst used for biodiesel production may result in crude glycerol with a diversity of impurities such as fatty acids, methanol, salts, and heavy metals [37,38]. High unsaturated fatty acids in crude glycerol may exhibit an inhibitory effect on C. pasteurianum [38], but some reports show that yeasts can tolerate the presence of impurities in crude glycerol more effectively than bacteria. In particular, ethanol production from Pachysolen tannophilus was not inhibited by the three experimented crude glycerol batches derived from rapeseed oil [39]. It has been reported that yeasts isolated from soil [40] and Candida sp. [41] grew efficiently in crude glycerol for the production of chemicals and lipids, respectively. Further, P. pastoris has been utilized for recombinant proteins production using crude glycerol [42,43].
3.6. UHPLC-ESI-QTOF/MS Analysis and Purification of rTBL-1
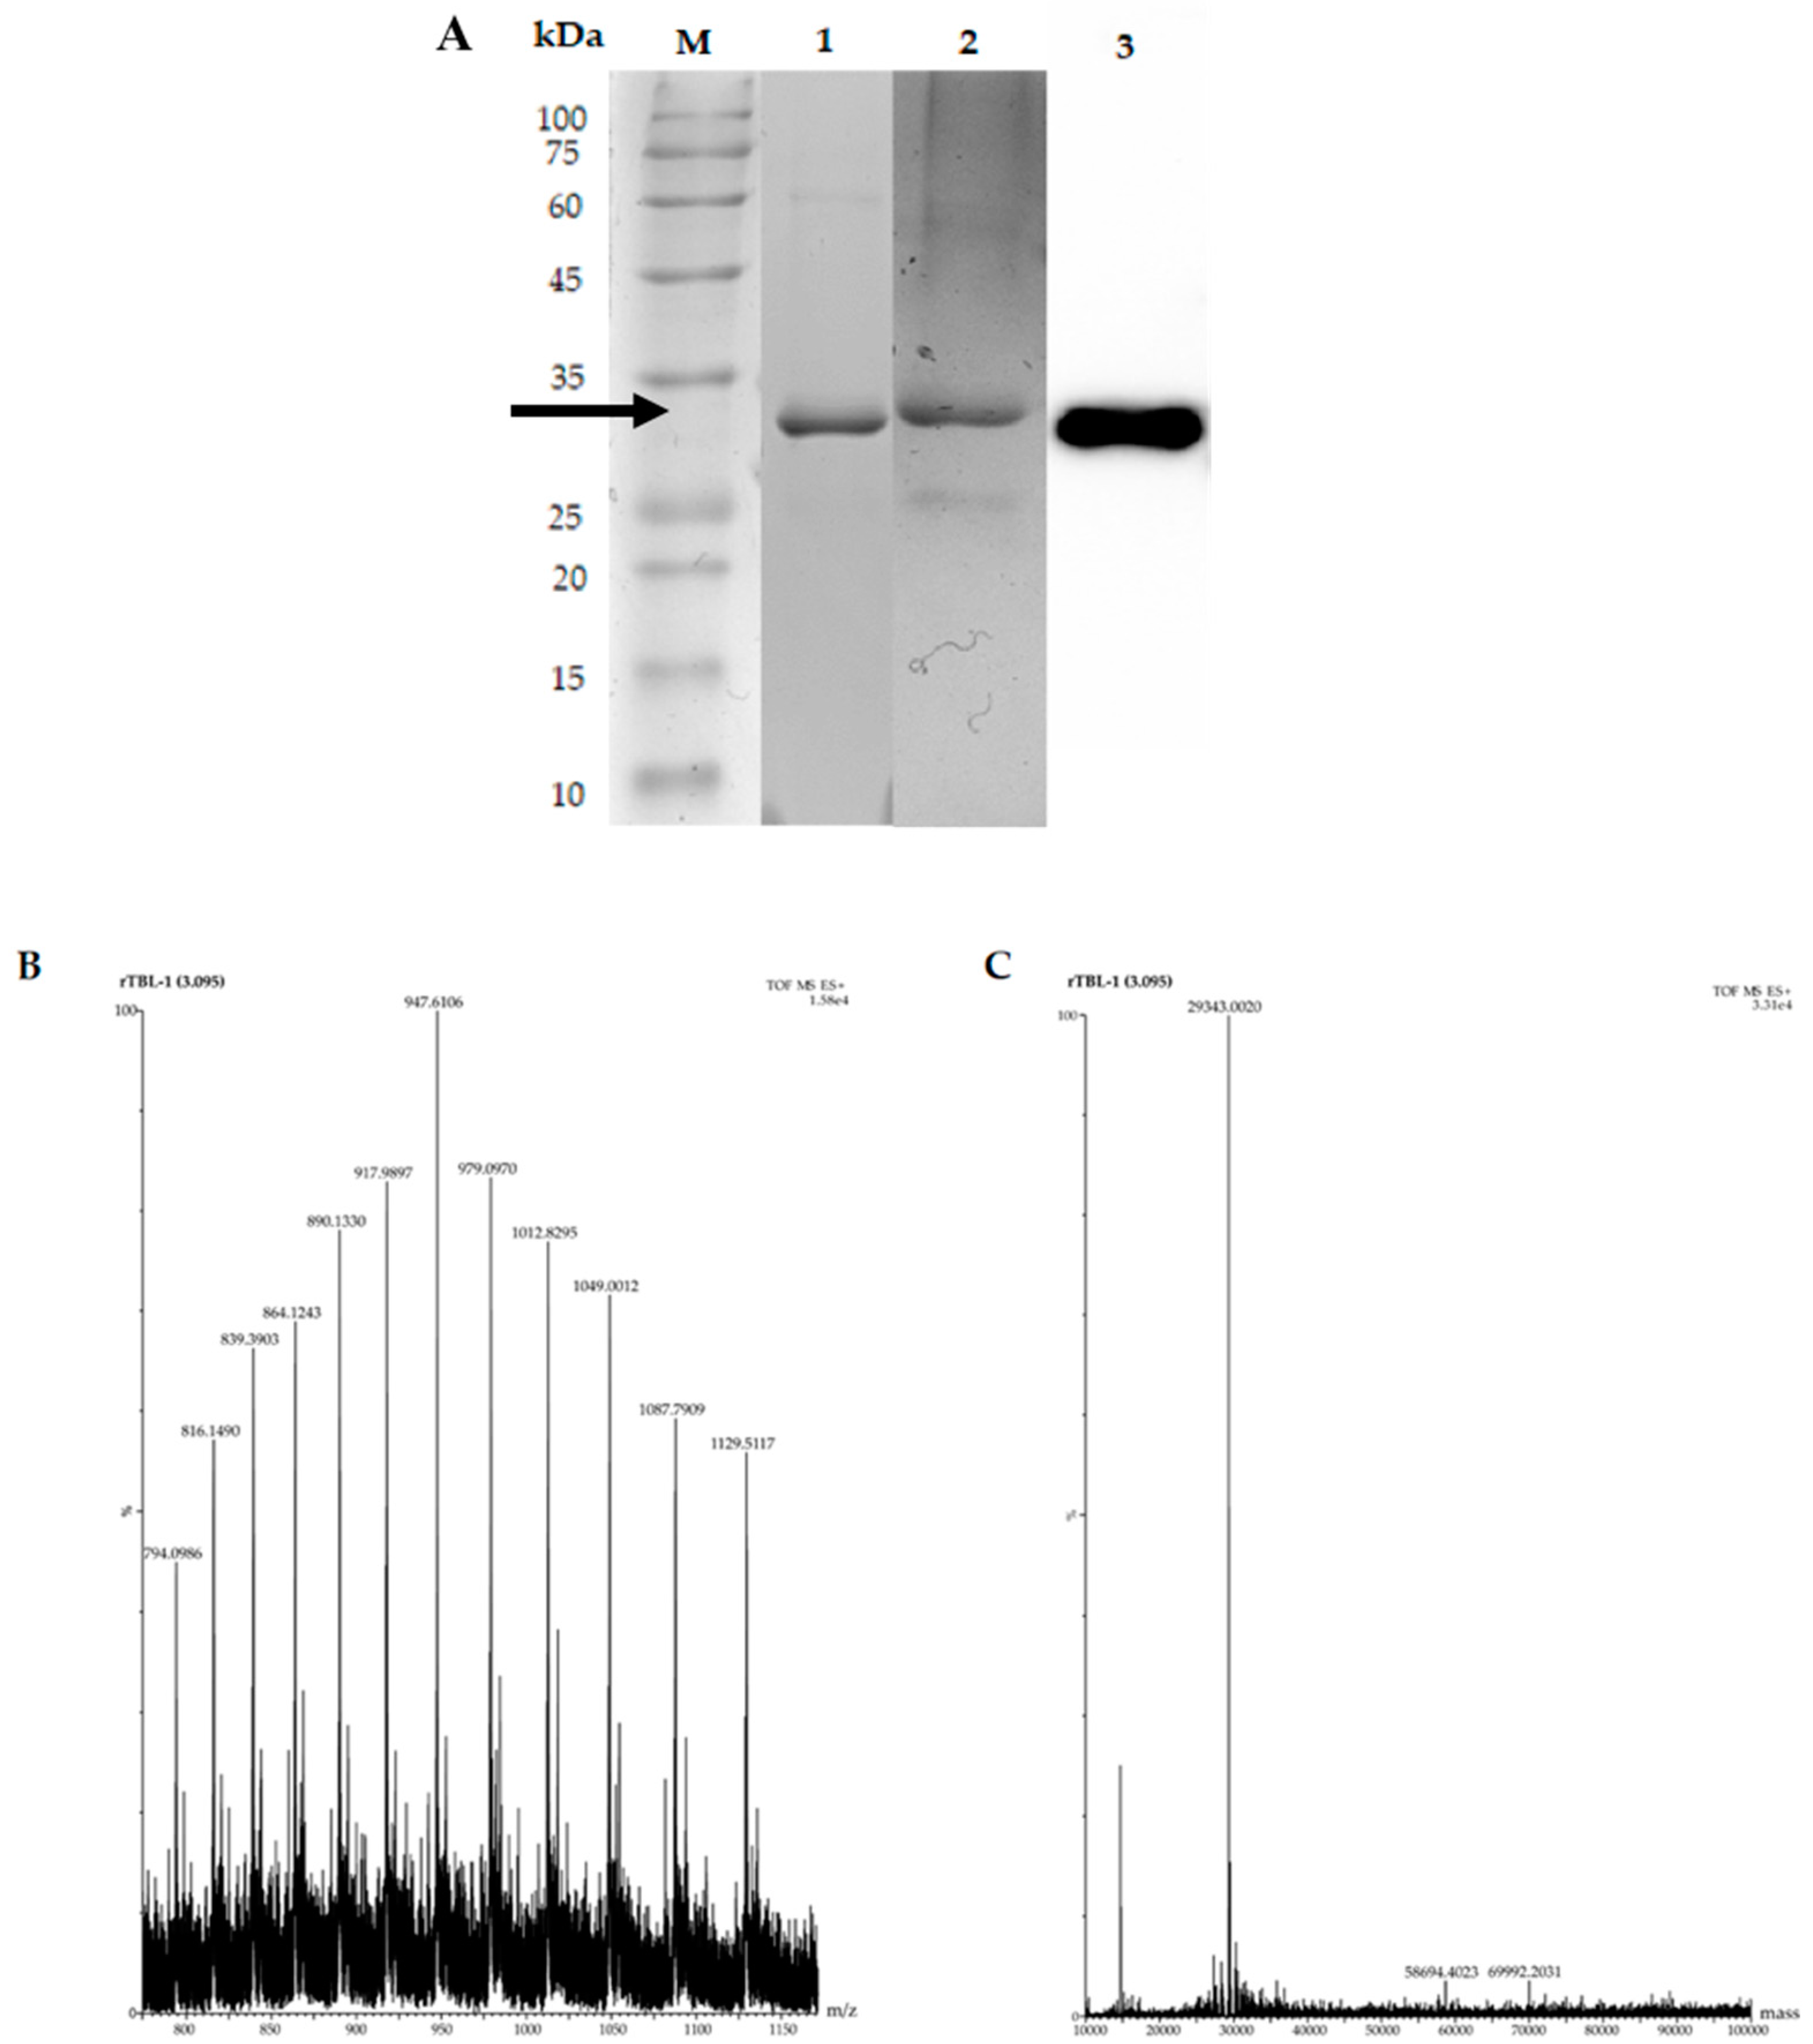
Figure 5 shows the rTBL-1 electrophoresis detection and mass spectra after the optimization process using G65 as substrate. SDS-PAGE showed the presence of a single band of ~30 that was stained by Schiff-PAS and identified by Western blot (Figure 5A). The rTBL-1 mass spectrometry (UHPLC–ESI–QTOF/MS) at 3.095 min is shown with a major peak at 947.6 m/z (Figure 5B). The deconvolution spectrum of this peak showed a single peak with a molecular mass of 29,343.0020 Da (Figure 5C).
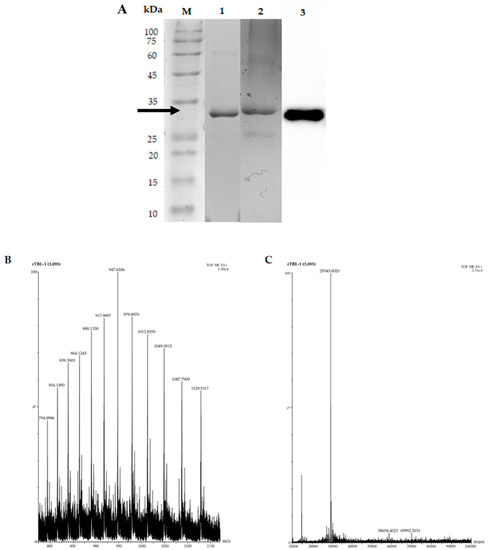
Figure 5.
Electrophoretic profile and mass spectrum of rTBL-1 using G65 as the carbon source. (A) Lane 1, rTBL-1 SDS-PAGE; lane 2, Schiff-PAS staining for glycoprotein detection; lane 3, Western blot. M, molecular weight marker. The rTBL-1 band is indicated by the arrow. (B) Mass spectrum with a range of 800–1150 m/z. (C) Deconvolution spectrum with a range of 10,000:100,000.
3.7. Comparison Between rTBL-1 and the Native Lectin and Cytotoxic Effect
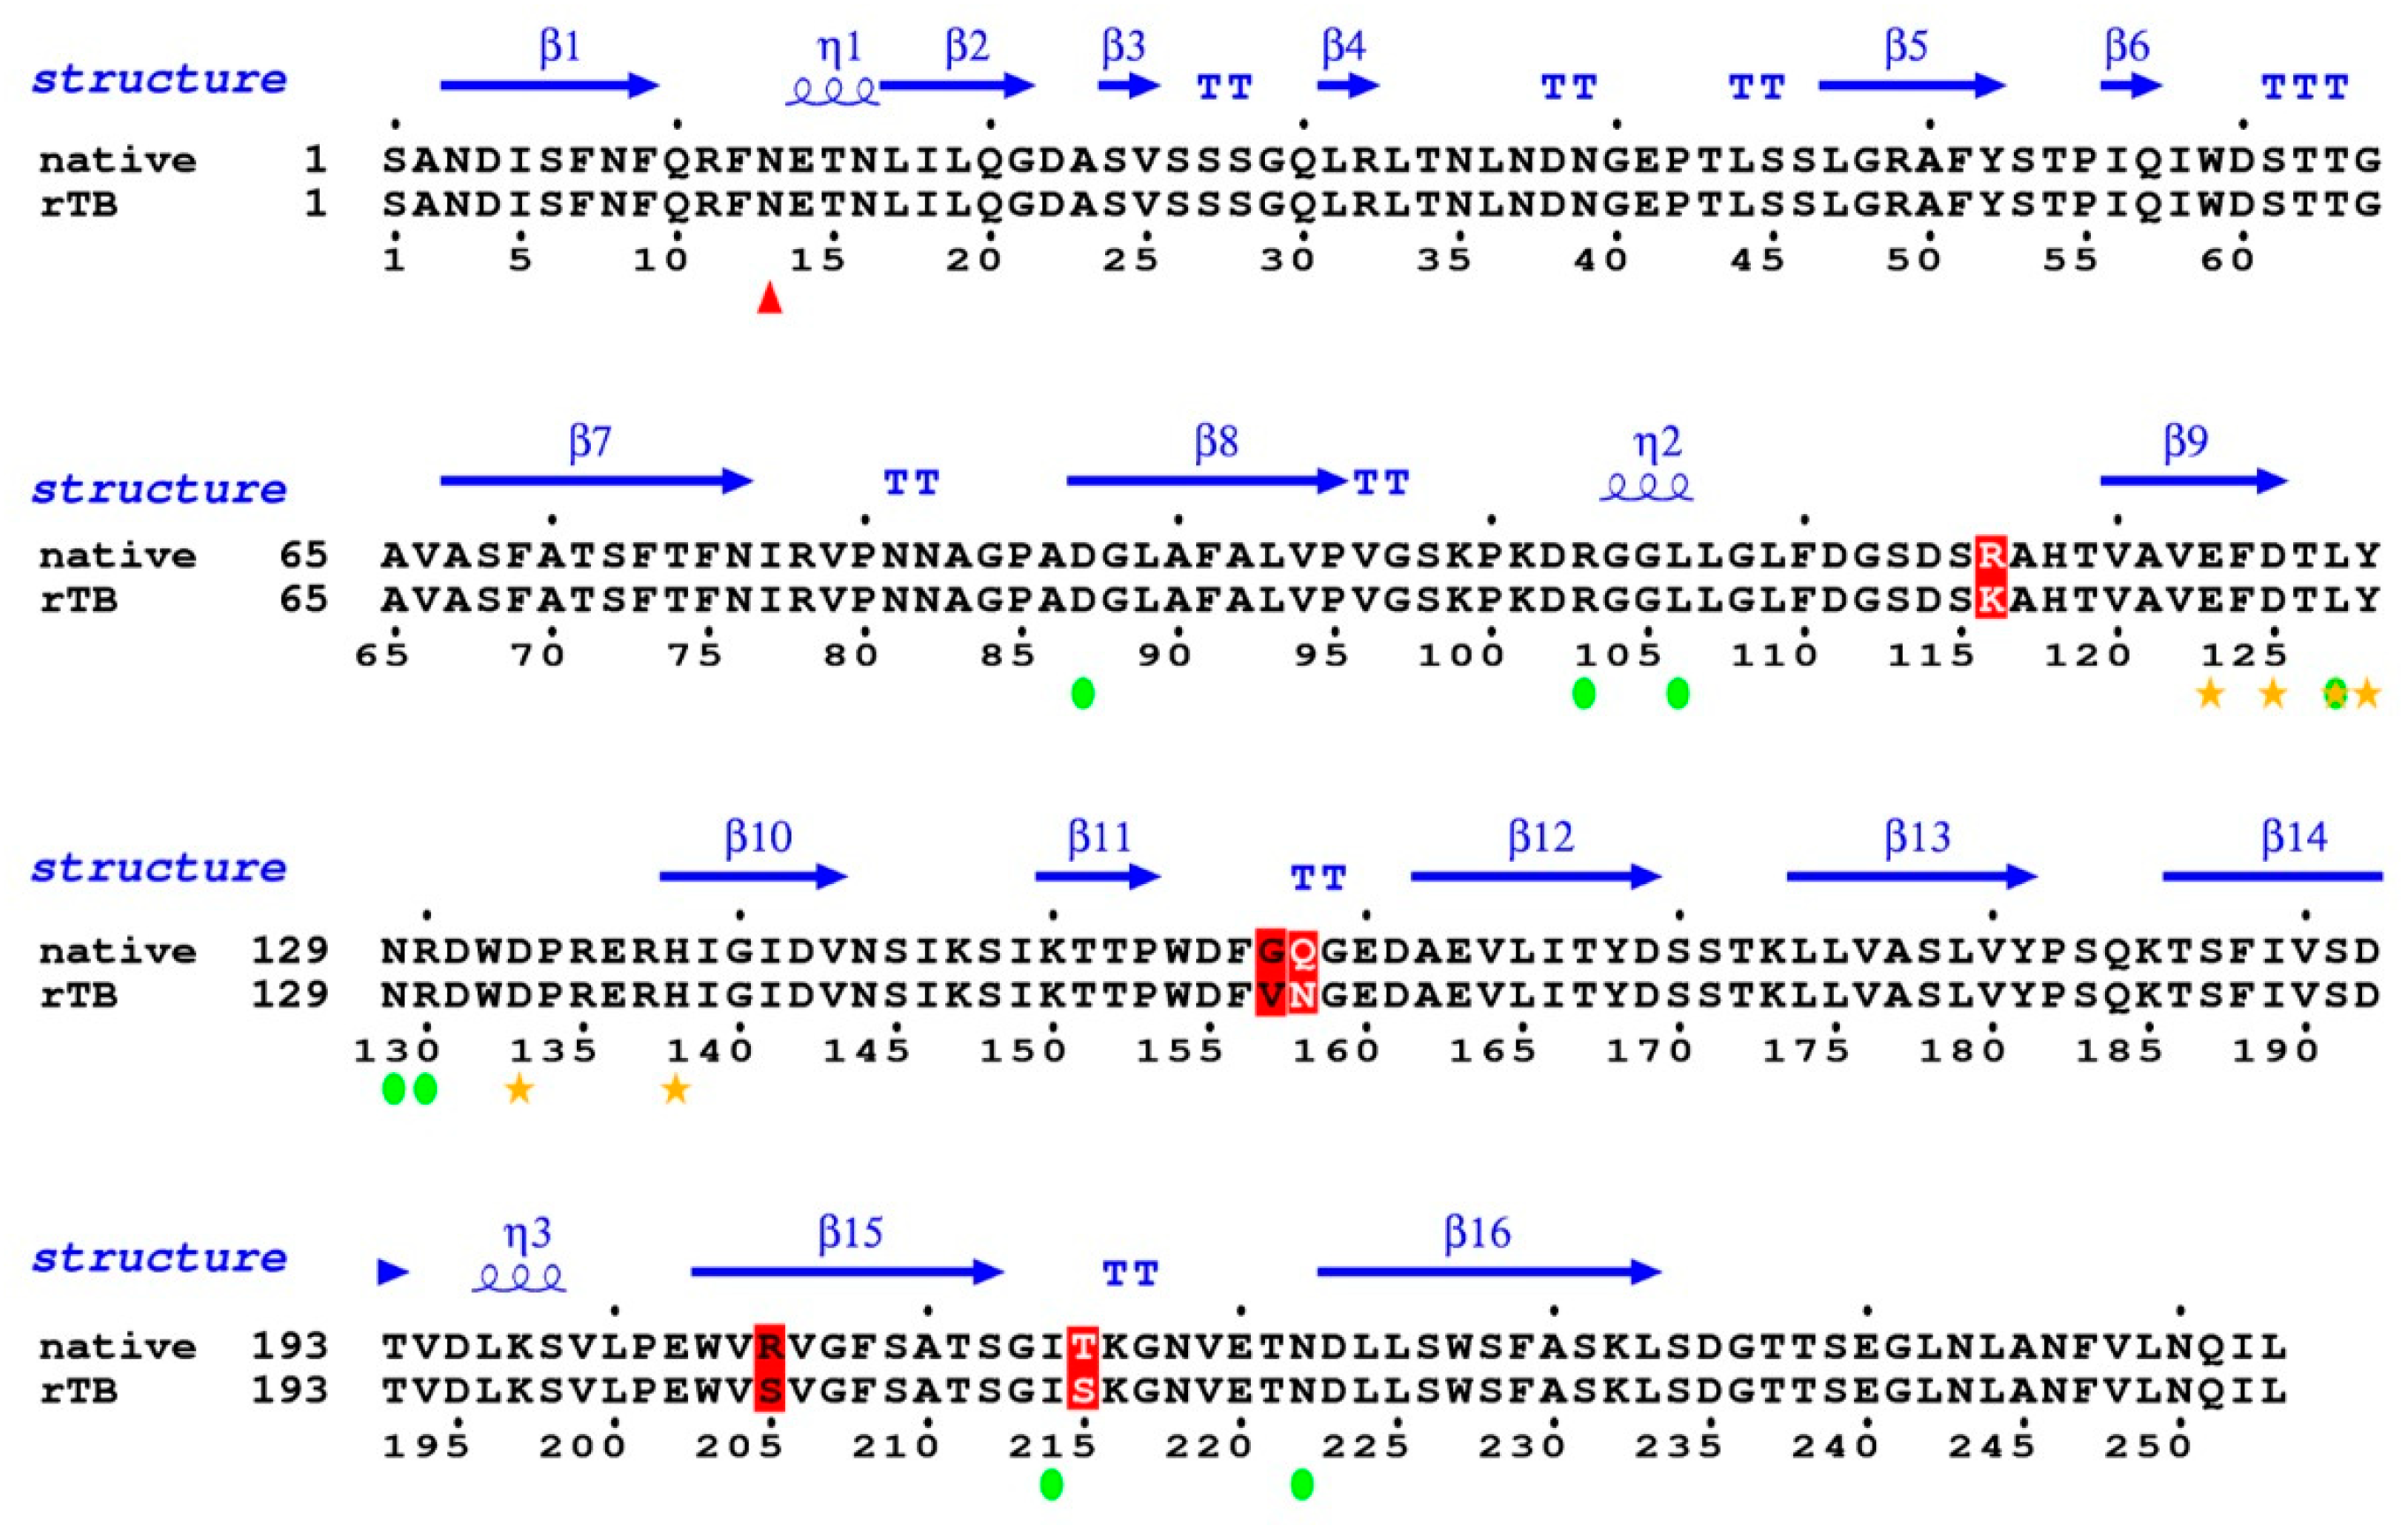
The coverage percentage of identity between the mature sequences of rTBL-1 and the Tepary bean native lectin [21] was 96.24%, with only five amino acid mismatches (Figure 6). In position 116, R changed to K; in position 157–158, GQ changed to VN; in position 205, R changed to S; and in position 215, T changed to S. Most of the mismatches are located between loops that serve as blade connectors. None of them are located in the proximity of the glycosylation site (red triangle), nor do they correspond to any of the amino acids involved in the coordination bonding with the ions (yellow stars). Furthermore, none of them correspond to the residues predicted to be involved in carbohydrate binding (green circles). It is not expected that these slight variations have an influence on the folding or activity of the protein.
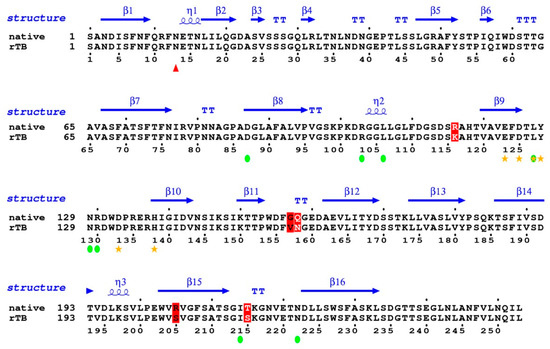
Figure 6.
Coverage percentage of identity between the mature sequences of rTBL-1 and the Tepary bean native lectin. Sequences were analyzed by ESPript Versión 3.0 (Lyon, France) (http://espript.ibcp.fr/ESPript/ESPript/ last access on February 2021). Red triangle shows the glycosylation site; yellow stars show amino acids involved in metal coordination; green circles show the carbohydrate binding site. Changes are shown in red color.
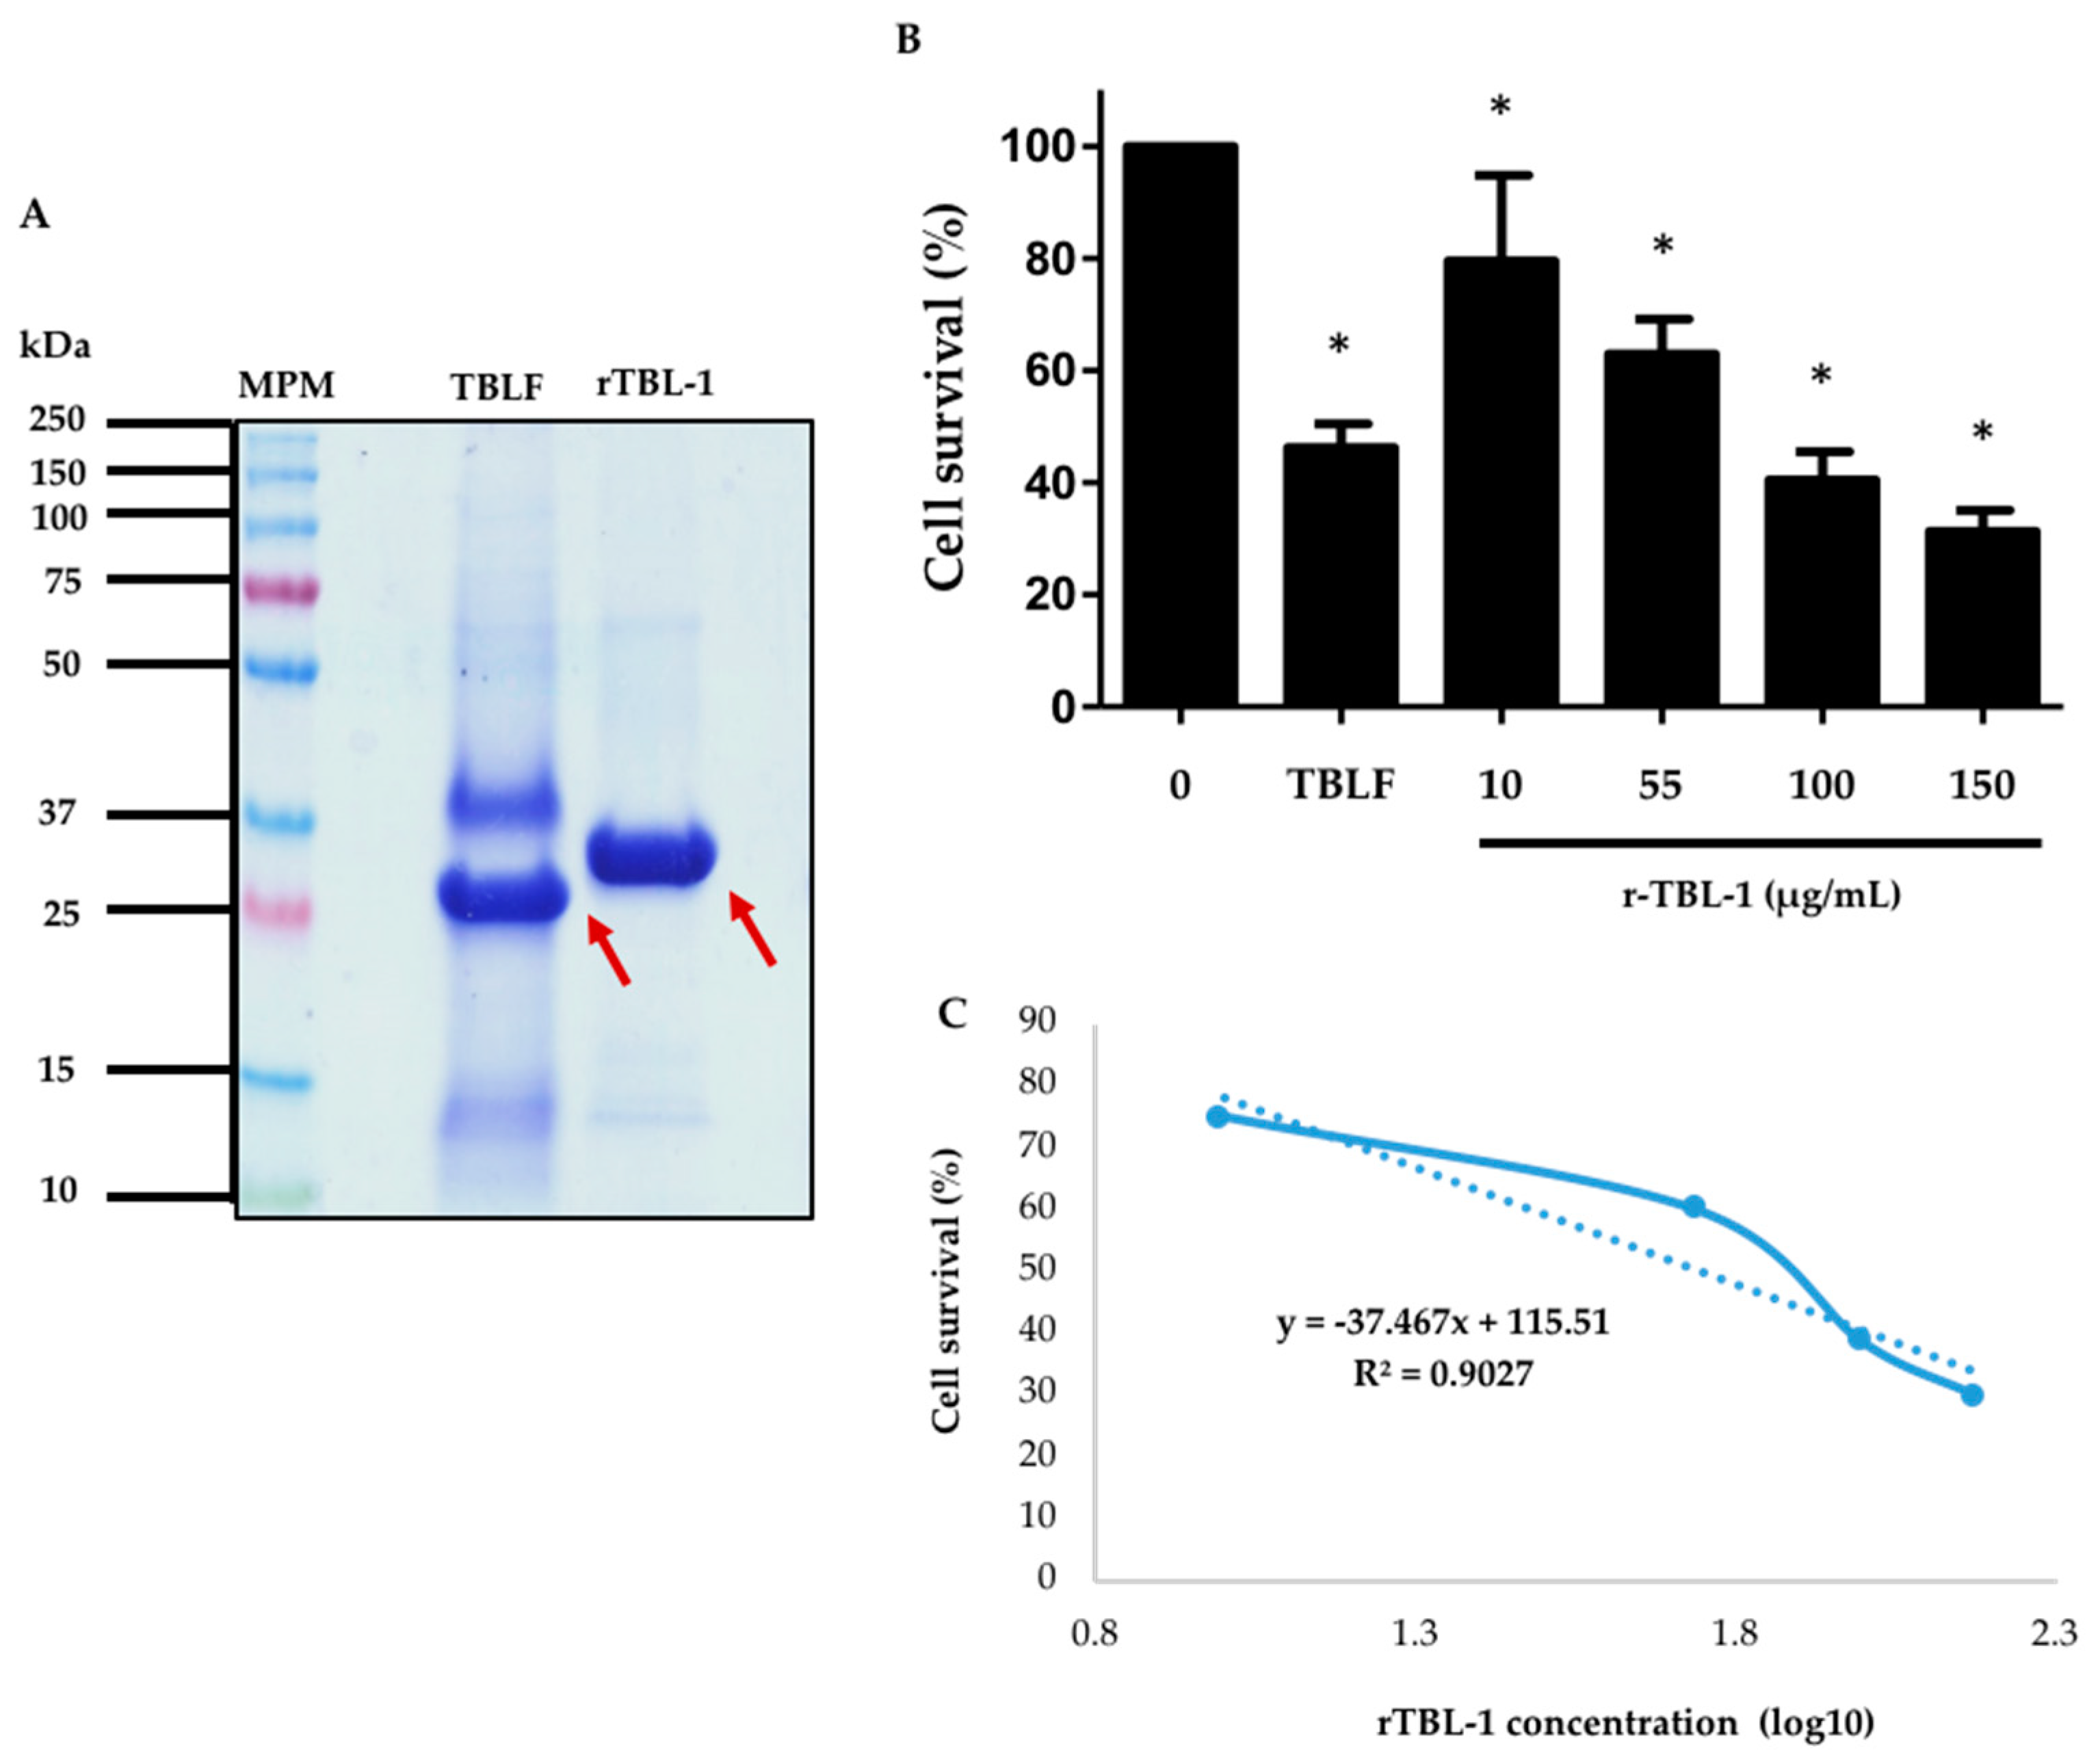
rTBL-1 quantitation with respect to the native lectin from TBLF was carried out by protein band densitometry after 13% (w/v) polyacrylamide SDS-PAGE (Figure 7A). The difference in molecular weight between the native lectin and the rTBL-1 is due to the hexa-histidine tail. It was observed that the native lectin corresponded to approximately 30% of all the proteins present in the TBLF lyophilized product, while the rTBL-1 corresponded to 80% of the total protein in the lyophilized product, and it was equivalent to 63% of the total TBLF protein. The protein concentration of rTBL-1 was adjusted to assess the cytotoxic effect of rTBL-1 with respect to the TBLF LC50 (402 μg/mL, 55 μg native lectin/mL) [3].
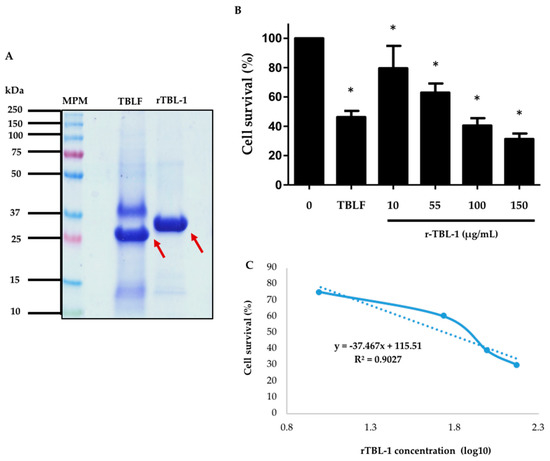
Figure 7.
Comparison between the recombinant lectin and native lectin and cytotoxic effect of rTBL-1 on HT-29 colon cancer cells. (A) SDS-PAGE. Molecular weight marker, MPM; Tepary bean lectin fraction, TBLF; rTBL-1. Arrows point to both the native and recombinant lectins. (B) Dose–response curve after 8 h treatment with rTBL-1. TBLF treatment corresponds to its LC50. (C) Concentration-response curve. The experiment was carried out in four independent assays. The asterisks (*) show significant differences between each rTBL-1 concentration with respect to the control ± S.D. (Dunnett, p ≤ 0.05).
The dose–response curve resulted in an LC50 of 56 μg of rTBL-1 protein/mL (Figure 7B). These results show that the rTBL-1 maintains the biological effect observed for the TBLF. The cytotoxic effect is observed to be a function of the rTBL-1 concentration, and the LC50 is similar to that observed for TBLF (56 and 55 μg of lectin protein, respectively) [3]. Therefore, experiments for the study of the mechanisms of action and in vivo toxicology and anticancer effects will be performed using the rTBL-1 to advance the development of a new molecule for treating colon cancer.
4. Conclusions
In this study, we optimized the rTBL-1 production using crude glycerol by adjusting temperature induction, agitation, aeration, and pH in P. pastoris. This is the first report, to our knowledge, concerning the production of rTBL-1 by this strategy. The production of rTBL-1 using a fed-batch fermentation process was achieved using an experimental design with a maximum yield of 265 ± 13 mgL−1 in the fed-batch fermentation, as predicted by the model. Yeast grown in crude glycerol did not show statistically significant differences with respect to yeast grown in pure glycerol in a batch and fed-batch system. Aeration rate had positive growth effects of this yeast with crude glycerol. The significant increase in productivity using moderate aeration and the availability and low cost of crude glycerol from biodiesel production give an opportunity for designing low-cost biotechnological processes using glycerol as a substrate. The resulting recombinant lectin was identified by SDS-PAGE, Western blot, and MS analysis. The genetic sequence showed high homology with respect to the native lectin, and the recombinant protein showed similar cytotoxic effects with respect to the previously determined Tepary bean lectin fraction. Our system using crude glycerol offers efficient production of a recombinant lectin, improving costs and process times, that will allow rTBL-1 production for the study of its anticancer potential in in vitro and in vivo assays.
Author Contributions
D.P.-C., J.L.D.-B., L.J.V.-R. and A.E.-R.: investigation, methodology, and validation; D.P.-C. and T.G.-G.: project administration, conceptualization, supervision, writing—review and editing, funding acquisition, formal analysis, visualization, analysis, and discussion; D.M.-A. and A.B.-L.: discussion, review, and editing. All authors have read and agreed to the published version of the manuscript.
Funding
This research was funded by Fondo para el Desarrollo del Conocimiento-Universidad Autonoma de Queretaro (FONDEC-UAQ-2019, grant number FNN-2020-03), CONACYT Ciencia de Frontera (grant number 171873), and PROFEXCE federal funding.
Institutional Review Board Statement
The study was conducted according to the guidelines of the Declaration of Helsinki, and approved by the Ethics Committee of the Faculty of Natural Sciences, Autonomous University of Querétaro (protocol code 44FCN2015, date of approval May 2015 and 45FCN2018, date of approval August 2019).
Informed Consent Statement
Not applicable.
Acknowledgments
The authors thank M.C. Saúl López Ordaz (UAQ, Chemistry Faculty) for his technical assistance and for providing crude and semicrude glycerol.
Conflicts of Interest
The authors declare no conflict of interest.
References
- Estrada-Martínez, L.E.; Moreno-Celis, U.; Cervantes-Jiménez, R.; Ferriz-Martínez, R.A.; Blanco-Labra, A.; García-Gasca, T. Plant Lectins as Medical Tools against Digestive System Cancers. Int. J. Mol. Sci. 2017, 18, 1403. [Google Scholar] [CrossRef]
- García-Gasca, T.; García-Cruz, M.; Hernandez-Rivera, E.; López-Matínez, J.; Castañeda-Cuevas, A.L.; Yllescas-Gasca, L.; Rodríguez-Méndez, A.J.; Mendiola-Olaya, E.; Castro-Guillén, J.L.; Blanco-Labra, A. Effects of Tepary Bean (Phaseolus acutifolius) Protease Inhibitor and Semipure Lectin Fractions on Cancer Cells. Nutr. Cancer 2012, 64, 1269–1278. [Google Scholar] [CrossRef] [PubMed]
- Moreno-Celis, U.; López-Martínez, F.J.; Cervantes-Jiménez, R.; Ferríz-Martínez, R.A.; Blanco-Labra, A.; García-Gasca, T. Tepary Bean (Phaseolus acutifolius) Lectins Induce Apoptosis and Cell Arrest in G0/G1 by P53(Ser46) Phosphorylation in Colon Cancer Cells. Mol. 2020, 25, 1021. [Google Scholar] [CrossRef] [PubMed]
- Ferriz-Martínez, R.; García-García, K.; Torres-Arteaga, I.; Rodriguez-Mendez, A.J.; Guerrero-Carrillo, M.D.J.; Moreno-Celis, U.; Ángeles-Zaragoza, M.V.; Blanco-Labra, A.; Gallegos-Corona, M.A.; Robles-Álvarez, J.P.; et al. Tolerability assessment of a lectin fraction from Tepary bean seeds (Phaseolus acutifolius) orally administered to rats. Toxicol. Rep. 2015, 2, 63–69. [Google Scholar] [CrossRef] [PubMed]
- Moreno-Celis, U.; López-Martínez, J.; Blanco-Labra, A.; Cervantes-Jiménez, R.; Estrada-Martínez, L.E.; García-Pascalin, A.E.; Guerrero-Carrillo, M.D.J.; Rodríguez-Méndez, A.J.; Mejía, C.; Ferríz-Martínez, R.A.; et al. Phaseolus acutifolius Lectin Fractions Exhibit Apoptotic Effects on Colon Cancer: Preclinical Studies Using Dimethilhydrazine or Azoxi-Methane as Cancer Induction Agents. Molecules 2017, 22, 1670. [Google Scholar] [CrossRef]
- Martínez-Alarcón, D.; Varrot, A.; Fitches, E.; Gatehouse, J.A.; Cao, M.; Pyati, P.; Blanco-Labra, A.; Garcia-Gasca, T. Recombinant Lectin from Tepary Bean (Phaseolus acutifolius) with Specific Recognition for Cancer-Associated Glycans: Production, Structural Characterization, and Target Identification. Biomolecules 2020, 10, 654. [Google Scholar] [CrossRef]
- Gellissen, G. Heterologous protein production in methylotrophic yeasts. Appl. Microbiol. Biotechnol. 2000, 54, 741–750. [Google Scholar] [CrossRef]
- Barrero, J.J.; Casler, J.C.; Valero, F.; Ferrer, P.; Glick, B.S. An improved secretion signal enhances the secretion of model proteins from Pichia pastoris. Microb. Cell Factories 2018, 17, 1–13. [Google Scholar] [CrossRef] [PubMed]
- Daly, R.; Hearn, M.T.W. Expression of heterologous proteins in Pichia pastoris: A useful experimental tool in protein engineering and production. J. Mol. Recognit. 2004, 18, 119–138. [Google Scholar] [CrossRef]
- Yin, J.; Li, G.; Ren, X.; Herrler, G. Select what you need: A comparative evaluation of the advantages and limitations of frequently used expression systems for foreign genes. J. Biotechnol. 2007, 127, 335–347. [Google Scholar] [CrossRef] [PubMed]
- Jahic, M.; Knoblechner, J.; Charoenrat, T.; Enfors, S.-O.; Veide, A. Interfacing Pichia pastoris cultivation with expanded bed adsorption. Biotechnol. Bioeng. 2006, 93, 1040–1049. [Google Scholar] [CrossRef] [PubMed]
- Kosamia, N.M.; Samavi, M.; Uprety, B.K.; Rakshit, S.K. Valorization of Biodiesel Byproduct Crude Glycerol for the Production of Bioenergy and Biochemicals. Catalysts 2020, 10, 609. [Google Scholar] [CrossRef]
- Looser, V.; Bruhlmann, B.; Bumbak, F.; Stenger, C.; Costa, M.; Camattari, A.; Fotiadis, D.; Kovar, K. Cultivation strategies to enhance productivity of Pichia pastoris: A review. Biotechnol. Adv. 2015, 33, 1177–1193. [Google Scholar] [CrossRef] [PubMed]
- Koizumi, J.; Aiba, S. Reassessment of the dynamic KL a method. Biotechnol. Bioeng. 1984, 26, 1131–1133. [Google Scholar] [CrossRef]
- Fuchs, R.; Ryu, D.D.Y.; Humphrey, A.E. Effect of Surface Aeration on Scale-Up Procedures for Fermentation Processes. Ind. Eng. Chem. Process. Des. Dev. 1971, 10, 190–196. [Google Scholar] [CrossRef]
- Bradford, M.M. A rapid and sensitive method for the quantitation of microgram quantities of protein utilizing the principle of protein-Dye binding. Anal. Biochem. 1976, 72, 248–254. [Google Scholar] [CrossRef]
- Laemmli, U.K. Cleavage of structural proteins during the assembly of the head of bacteriophage T4. Nature 1970, 227, 680–685. [Google Scholar] [CrossRef]
- Rueden, C.T.; Schindelin, J.; Hiner, M.C.; Dezonia, B.E.; Walter, A.E.; Arena, E.T.; Eliceiri, K.W. ImageJ2: ImageJ for the next generation of scientific image data. BMC Bioinform. 2017, 18, 529. [Google Scholar] [CrossRef]
- Packer, N.H.; Ball, M.S.; Devine, P.L.; Link, A.J. Glycoprotein Detection of 2-D Separated Proteins. 2-D Proteome Anal. Protoc. 2003, 112, 341–352. [Google Scholar] [CrossRef]
- Vega-Rojas, L.J.; Luzardo-Ocampo, I.; Mosqueda, J.; Palmerín-Carreño, D.M.; Escobedo-Reyes, A.; Blanco-Labra, A.; Escobar-García, K.; García-Gasca, T. Bioaccessibility and In Vitro Intestinal Permeability of a Recombinant Lectin from Tepary Bean (Phaseolus acutifolius) Using the Everted Intestine Assay. Int. J. Mol. Sci. 2021, 22, 1049. [Google Scholar] [CrossRef]
- Arteaga, I.T.; Guillen, J.L.C.; Mendiola-Olaya, E.; Garcia-Gasca, T.; Zaragoza, M.A.; Santoyo, V.G.; Castillo, J.A.T.; Aguirre, C.; Phinney, B.; Blanco-Labra, A. Characterization of Two Non-Fetuin-Binding Lectins from Tepary Bean (Phaseolus acutifolius) Seeds with Differential Cytotoxicity on Colon Cancer Cells. J. Glycobiol. 2016, 5, 1–7. [Google Scholar] [CrossRef]
- Preece, D.A.; Montgomery, D.C. Design and Analysis of Experiments; John Wiley & Sons: Hoboken, NJ, USA, 1978. [Google Scholar]
- Pal, Y.; Khushoo, A.; Mukherjee, K.J. Process optimization of constitutive human granulocyte–macrophage colony-stimulating factor (hGM-CSF) expression in Pichia pastoris fed-batch culture. Appl. Microbiol. Biotechnol. 2006, 69, 650–657. [Google Scholar] [CrossRef] [PubMed]
- Lopes, M.; Belo, I.; Mota, M. Batch and fed-batch growth of Pichia pastoris under increased air pressure. Bioprocess Biosyst. Eng. 2012, 36, 1267–1275. [Google Scholar] [CrossRef] [PubMed][Green Version]
- Tian, M.; Wang, Z.-Y.; Fu, J.-Y.; Li, H.-W.; Zhang, J.; Zhang, X.-F.; Luo, W.; Lv, P.-M. Crude glycerol impurities improve Rhizomucor miehei lipase production by Pichia pastoris. Prep. Biochem. Biotechnol. 2021, 1–11. [Google Scholar] [CrossRef]
- Tang, S.; Boehme, L.; Lam, H.; Zhang, Z. Pichia pastoris fermentation for phytase production using crude glycerol from biodiesel production as the sole carbon source. Biochem. Eng. J. 2009, 43, 157–162. [Google Scholar] [CrossRef]
- Wegner, E.H. Biochemical Conversions by Yeast Fermentation at High-Cell Densities. U.S. Patent 4,414,329, 8 November 1983. [Google Scholar]
- Charoenrat, T.; Khumruaengsri, N.; Promdonkoy, P.; Rattanaphan, N.; Eurwilaichitr, L.; Tanapongpipat, S.; Roongsawang, N. Improvement of recombinant endoglucanase produced in Pichia pastoris KM71 through the use of synthetic medium for inoculum and pH control of proteolysis. J. Biosci. Bioeng. 2013, 116, 193–198. [Google Scholar] [CrossRef] [PubMed]
- Yang, Z.; Zhang, Z. Engineering strategies for enhanced production of protein and bio-products in Pichia pastoris: A review. Biotechnol. Adv. 2018, 36, 182–195. [Google Scholar] [CrossRef]
- Dehnavi, E.; Siadat, S.O.R.; Roudsari, M.F.; Khajeh, K. Cloning and high-level expression of β-xylosidase from Selenomonas ruminantium in Pichia pastoris by optimizing of pH, methanol concentration and temperature conditions. Protein Expr. Purif. 2016, 124, 55–61. [Google Scholar] [CrossRef]
- Gonçalves, A.M.G.; Pedro, A.; Maia, C.; Sousa, F.; Queiroz, J.A.; Passarinha, L.A. Pichia pastoris: A Recombinant Microfactory for Antibodies and Human Membrane Proteins. J. Microbiol. Biotechnol. 2013, 23, 587–601. [Google Scholar] [CrossRef]
- Zhong, Y.; Yang, L.; Guo, Y.; Fang, F.; Wang, D.; Li, R.; Jiang, M.; Kang, W.; Ma, J.; Sun, J.; et al. High-temperature cultivation of recombinant Pichia pastorisincreases endoplasmic reticulum stress and decreases production of human interleukin-10. Microb. Cell Factories 2014, 13, 1–10. [Google Scholar] [CrossRef] [PubMed]
- Ferreira, P.; Lopes, M.; Mota, M.; Belo, I. Oxygen mass transfer impact on citric acid production by Yarrowia lipolytica from crude glycerol. Biochem. Eng. J. 2016, 110, 35–42. [Google Scholar] [CrossRef]
- Ahmad, M.; Hirz, M.; Pichler, H.; Schwab, H. Protein expression in Pichia pastoris: Recent achievements and perspectives for heterologous protein production. Appl. Microbiol. Biotechnol. 2014, 98, 5301–5317. [Google Scholar] [CrossRef]
- Ye, J.; Ly, J.; Watts, K.; Hsu, A.; Walker, A.; McLaughlin, K.; Berdichevsky, M.; Prinz, B.; Kersey, D.S.; D’Anjou, M.; et al. Optimization of a glycoengineered Pichia pastoris cultivation process for commercial antibody production. Biotechnol. Prog. 2011, 27, 1744–1750. [Google Scholar] [CrossRef]
- Çelik, E.; Çalık, P.; Oliver, S.G. Fed-batch methanol feeding strategy for recombinant protein production by Pichia pastorisin the presence of co-substrate sorbitol. Yeast 2009, 26, 473–484. [Google Scholar] [CrossRef] [PubMed]
- Chatzifragkou, A.; Papanikolaou, S. Effect of impurities in biodiesel-derived waste glycerol on the performance and feasibility of biotechnological processes. Appl. Microbiol. Biotechnol. 2012, 95, 13–27. [Google Scholar] [CrossRef] [PubMed]
- Venkataramanan, K.P.; Boatman, J.J.; Kurniawan, Y.; Taconi, K.A.; Bothun, G.D.; Scholz, C. Impact of impurities in biodiesel-derived crude glycerol on the fermentation by Clostridium pasteurianum ATCC 6013. Appl. Microbiol. Biotechnol. 2012, 93, 1325–1335. [Google Scholar] [CrossRef] [PubMed]
- Liu, X.; Jensen, P.R.; Workman, M. Bioconversion of crude glycerol feedstocks into ethanol by Pachysolen tannophilus. Bioresour. Technol. 2012, 104, 579–586. [Google Scholar] [CrossRef]
- Vivek, N.; Sindhu, R.; Madhavan, A.; Anju, A.J.; Castro, E.; Faraco, V.; Pandey, A.; Binod, P. Recent advances in the production of value added chemicals and lipids utilizing biodiesel industry generated crude glycerol as a substrate—Metabolic aspects, challenges and possibilities: An overview. Bioresour. Technol. 2017, 239, 507–517. [Google Scholar] [CrossRef] [PubMed]
- Duarte, S.H.; Ghiselli, G.; Maugeri, F. Influence of culture conditions on lipid production by Candida sp. LEB-M3 using glycerol from biodiesel synthesis. Biocatal. Agric. Biotechnol. 2013, 2, 339–343. [Google Scholar] [CrossRef]
- Robert, J.M.; Lattari, F.S.; Machado, A.C.; De Castro, A.M.; Almeida, R.; Torres, F.A.G.; Valero, F.; Freire, D.M.G. Production of recombinant lipase B from Candida antarctica in Pichia pastoris under control of the promoter PGK using crude glycerol from biodiesel production as carbon source. Biochem. Eng. J. 2017, 118, 123–131. [Google Scholar] [CrossRef]
- Anastácio, G.; Santos, K.; Suarez, P.; Torres, F.; De Marco, J.; Parachin, N. Utilization of glycerin byproduct derived from soybean oil biodiesel as a carbon source for heterologous protein production in Pichia pastoris. Bioresour. Technol. 2014, 152, 505–510. [Google Scholar] [CrossRef] [PubMed]
Publisher’s Note: MDPI stays neutral with regard to jurisdictional claims in published maps and institutional affiliations. |
© 2021 by the authors. Licensee MDPI, Basel, Switzerland. This article is an open access article distributed under the terms and conditions of the Creative Commons Attribution (CC BY) license (https://creativecommons.org/licenses/by/4.0/).

