Article

Low Ozone Concentrations Affect the Structural and Functional Features of Jurkat T Cells

1
Department of Neurosciences, Biomedicine and Movement Sciences, Anatomy and Histology Section, University of Verona, I-37134 Verona, Italy
2
San Rocco Clinic, I-25018 Montichiari, Italy
*
Author to whom correspondence should be addressed.
These authors contributed equally to this work.
Processes 2021, 9(6), 1030; https://doi.org/10.3390/pr9061030
Submission received: 26 May 2021 / Revised: 4 June 2021 / Accepted: 9 June 2021 / Published: 11 June 2021
(This article belongs to the Special Issue Basic, Biological and Therapeutic Processes of Ozone Therapy)

Abstract

:
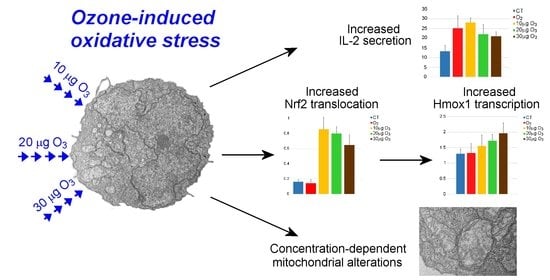
Autohemotherapy is the most used method to administer O2-O3 systemically. It consists in exposing a limited amount of blood to a gaseous O2-O3 and reinfusing it, thus activating a cascade of biochemical pathways involving plasma and blood cells that gives rise to antioxidant and anti-inflammatory responses. The therapeutic effects strictly depend on the O3 dose; it is therefore necessary to understand the relationship between the O3 concentration and the effects on blood cells involved in antioxidant and immune response. Here we performed a basic study on the effects of the low O3 concentrations used for autohemotherapy on the structural and functional features of the human T-lymphocyte-derived Jurkat cells. Ultrastructural, biomolecular, and bioanalytic techniques were used. Our findings showed that 10, 20, and 30 µg O3 concentrations were able to trigger Nrf2-induced antioxidant response and increase IL-2 secretion. However, viability and proliferation tests as well as ultrastructural observations revealed stress signs after treatment with 20 and 30 µg O3, thus designating 10 µg O3 as the optimal concentration in combining cell safety and efficient antioxidant and immune response in our in vitro system. These data offer novel evidence of the fine regulatory role played by the oxidative stress level in the hormetic response of T lymphocytes to O2-O3 administration.

Graphical Abstract

1. Introduction

Oxygen-ozone (O2-O3) therapy is an adjuvant medical treatment successfully used in patients affected by various diseases (reviews in [1,2,3,4]).
The most used method to administer O2-O3 systemically is the so-called autohemotherapy. It classically consists in drawing a limited volume of blood (100–200 mL), exposing it ex vivo to a gaseous mixture of O2-O3 for a few minutes and finally re-infusing it into the patient. This procedure activates a cascade of biochemical pathways involving both plasma and blood cells that gives rise to antioxidant and anti-inflammatory responses (reviewed in [3,5]), which account for the therapeutic effects of the O2-O3 treatment. These effects strictly depend on the O3 dose; in fact, high dosages, by causing a strong oxidative stress, activate the nuclear transcriptional factor kappa B and induce inflammation and tissue damage, whereas low dosages activate, through mild oxidative stress, the nuclear factor erythroid 2-related factor 2 (Nrf2) and, in turn, several antioxidant enzymes, thus promoting a cytoprotective and anti-inflammatory response [4,5]. Accordingly, in the last years, O3 dosages have been progressively lowered [6], relying on their therapeutic efficacy for the hormetic dose-response relationship [7,8]. By contrast, some authors consider the O3-dependent activation of Nrf2 as potentially detrimental in oncologic patients since it has been reported that hyperactivated Nrf2 may support cancer progression through many pathways (e.g., [4,9,10,11,12]). However, recent experimental evidence exists that low O3 concentrations are unable to alter motility and proliferation of cancer cells in vitro [13] and the question remains controversial.
The clinical practice highlighted a strong heterogeneity in the antioxidant and anti-inflammatory response of patients treated with autohemotherapy. For an effective and targeted application of O2-O3 therapy, it is therefore necessary to understand the relationship between the O3 concentration and the effects on blood cells involved in antioxidant and immune response.
In this view, we performed a basic study by investigating the effects of the low O3 concentrations mostly used for major autohemotherapy on the structural and functional features of the human T-lymphocyte-derived Jurkat cells [14]. Jurkat cells are a suitable immortalized model to analyze T cell responses associated with signaling pathways; moreover, unlike other T cell lines, they can be activated and led to synthesize and secrete IL-2 and IFN-γ (e.g., [15,16]). This in vitro model allowed us to investigate the molecular and cellular changes induced by O3 treatment under controlled experimental conditions, avoiding the complex interactions with multiple factors as it occurs in a living organism. In addition, a stabilized T cell line ensures standardized samples in comparison to primary cultured lymphocytes, thus making our model fully compliant with the highly sensitive ultrastructural, biomolecular, and bioanalytic techniques used in the present work.

2. Materials and Methods

2.1. Cell Culture and Treatment

Jurkat cells were grown and kept to the final concentration of 4 × 10⁵ cells/mL on 75 cm2 plastic flasks (Sarstedt, Nümbrecht, Germany) in RPMI 1640 medium supplemented with 10% (v/v) fetal bovine serum, 1% (w/v) glutamine, 100 U of penicillin and 100 μg/mL streptomycin (Gibco, Walthem, MA, USA), at 37 °C in a 5% CO2 humidified atmosphere. Cells were treated in suspension with O2-O3 gas mixtures produced from medical-grade O2 by an OZO2 FUTURA apparatus (Alnitec s.r.l., Cremosano, CR, Italy). The following O3 concentrations were used: 10, 20, and 30 µg O3/mL O2. In previous experimental studies in vitro, 10 µg O3 proved to be the lowest O3 concentration able to modulate nuclear activity [17] through Nrf2 activation [18,19,20], while 20 and 30 µg O3 are the most used concentrations in major autohemotherapy.
As previously reported [12], samples of 4 × 10⁶ cells suspended in 10 mL medium were collected into a 20 mL polypropylene syringe, then 10 mL of gas was added in the syringe by using a sterile filter (Alnitec s.r.l.). The cell suspension was gently mixed with the gas for 10 min to allow the full reaction of cells with O3 [21]. Some samples were exposed to pure O2 to distinguish between O3 and O2 effects, while other samples were exposed to air as controls.
After gas exposure, Jurkat cells were seeded in plastic flasks and analyzed at increasing times to evaluate some structural and functional features (see below).
In order to verify if the activation state of T lymphocytes may influence the effects of gas treatment on cytokine secretion, Jurkat cells were pre-incubated with 1 µg/mL phytohemagglutinin (PHA) + 50 ng/mL phorbol 12-myristate 13-acetate (PMA) for 24 h, as previously reported [22,23,24]. Then, the cells were treated as described above.

2.2. Cell Viability

To assess the effect of gas treatment on cell viability, the trypan blue exclusion test was used. This test is based on the principle that the dye is excluded from live cells, which have intact plasma membranes, whereas it easily enters dead cells [25]. Cell death rate was estimated after 2 h, 24 h, and 48 h from gas treatment by incubating the cells for 2 min with 0.1% trypan blue in the culture medium. The cells were counted in three randomly chosen microscope fields (20×) with a Leica DM IL inverted microscope (Leica Microsystems, Wetzlar, Germany), and the percentage of cells stained with trypan blue was estimated. Three independent experiments were performed.
For a proper interpretation of data on cytokine secretion, cell viability was also assessed for PHA/PMA-activated Jurkat cells.

2.3. Cell Growth

To evaluate cell growth, 4 × 10⁵ cells/mL were seeded in T25 plastic flasks and the total cell number was evaluated after 2 h, 24 h and 48 h from the treatment by counting viable cells in a Burker hemocytometer in the presence of 0.1% trypan blue in the culture medium. Three independent experiments were performed.
For a proper interpretation of data on cytokines secretion, cell growth was also evaluated for PHA/PMA-activated Jurkat cells.

2.4. Transmission Electron Microscopy

Morphological and immunocytochemical analyses were carried out at transmission electron microscopy in order to analyze the effects of the exposure to low O3 concentrations on the fine cell features and Nrf2 nuclear translocation. Based on our previous investigations [19], the effects were evaluated after 24 h from treatment in order to clearly detect morphological changes and Nrf2 translocation.
To avoid possible morphological alterations due to pre-fixation cell handling, Jurkat cells were fixed in their culture medium by adding an equal amount of a fixative solution made of 5% glutaraldehyde and 4% paraformaldehyde in phosphate buffered saline (PBS). In detail, cell samples were fixed for 2 h at 4 °C; then, cell suspensions were centrifuged, the supernatant was removed, and the samples were processed as cell pellets. After rinsing with PBS, the samples were post-fixed with 1% OsO4 and 1.5% K4Fe(CN)6 for 2 h at 4 °C, dehydrated in acetone, and embedded in Epon resin.
For ultrastructural morphology, ultrathin sections were collected on copper grids coated with a Formvar layer and stained with Reynolds lead citrate.
For immunocytochemistry, ultrathin sections were collected on nickel grids coated with a Formvar-carbon layer. Before immunostaining, the sections were treated with a 0.2 M aqueous solution of NaIO4 for 60 min to improve the immune reaction [26,27]. Sections were then briefly floated on normal goat serum diluted 1:100 in PBS, incubated overnight at 4 °C with the anti-Nrf2 antibody (Abcam #ab62352, Cambridge, United Kingdom) diluted 1:5 with PBS containing 0.1% bovine serum albumin (Fluka, Buchs, Switzerland) and 0.05% Tween 20. Sections were then floated on normal goat serum and incubated for 30 min with a goat anti-rabbit IgG secondary antibody conjugated with 12-nm gold particles (Jackson ImmunoResearch Laboratories Inc., West Grove, PA, USA), diluted 1:20 in PBS. After rinsing with PBS and water, the sections were finally air-dried. As immunostaining controls, the primary antibody was omitted.
The samples were observed in a Philips Morgagni transmission electron microscope (FEI Company Italia Srl, Milan, Italy) operating at 80 kV; a Megaview III camera (FEI Company Italia Srl) was used for image acquisition.
Quantitation of anti-Nrf2 immunolabeling was performed by estimating the gold particle density on sections treated in the same run: the area of nucleoplasmic regions and resin regions (as an intra-sample negative control) was measured on 30 micrographs (28,000×) per sample. In samples treated with 30 µg O3, obviously necrotic cells were not considered. Background evaluation was performed in sections processed for immunocytochemistry without the primary antibody. In each measured area, the gold particles were counted manually and the labeling density (i.e., the number of gold particles/μm2 of nucleoplasm) was calculated.

2.5. Quantitative Real-Time Polymerase Chain Reaction

RNA was extracted from Jurkat cell samples after 24 h from gas exposure by using the Qiagen RNAeasy Plus mini kit (ref. 74134). cDNA was generated by SuperScript™ III Reverse Transcriptase (Invitrogen, cat. no. 18080093) and amplified at qPCR with Applied Biosystems™ SYBR™ Green PCR Master Mix (Applied Biosystems™ 4309155) using 2 distinct sets of primers specific for human Hmox1 (primers set 1: Forw: CCTAAACTTCAGAGGGGGCG, Rev: GACAGCTGCCACATTAGGGT; primers set 2: Forw: AGTCTTCGCCCCTGTCTACT, Rev: CTTCACATAGCGCTGCATGG). The Applied Biosystems Step-One Real-Time PCR (RT-PCR) System (Thermo Fisher Scientific, Waltham, MA, USA) was used for amplification.

2.6. IL-2 and IFN-γ Secretion

The amount of interleukin (IL)-2 and interferon (IFN)-γ secretion was evaluated in the culture medium after 24 h from the gas treatment, when the peak concentration after PHA/PMA stimulation is known to occur [23,28,29]. For each sample, 4 × 10⁵ cells/mL were treated with gas as described above; experiments were performed four times per sample. The samples were centrifuged at 200 g for 8 min, the media were collected from the cell pellet, centrifuged again at 1500 g for 15 min, and the supernatants were finally stored at −80 °C. Quantitation of IL-2 and IFN-γ was conducted on a Luminex Biorad Bio-Plex 100 instrument (Bio-Rad Laboratories S.r.l., Segrate, MI, Italy) coupled to Bio-Plex Manager software v6.0, which allows measuring multiple proteins in a single well. Briefly, 50 μL aliquots of undiluted cell medium were put in a 96-well plate (samples were run in duplicate). Superparamagnetic microspheres (beads) conjugated with fluorophores and antibodies against IL-2 and IFN-γ were added to the assay wells. Incubation and washing steps were performed as per manufacturer’s recommendations, then the plate was loaded into the Luminex system for reading and signal quantitation.

2.7. Statistical Analyses

Data for each variable were presented as mean ± standard deviation of the mean (SD). Statistical comparison was performed by either the analysis of variance (ANOVA) test for linear trend (for RT-PCR) or the one-way ANOVA followed by Bonferroni’s post-hoc test (for all other variables); p ≤ 0.05 was considered as statistically significant.

3. Results

3.1. Cell Viability

Death rate was similar in control and treated (O2, 10 µg O3, 20 µg O3, 30 µg O3) Jurkat cell samples at all the time points considered (2, 24 and 48 h), with the exception of the sample treated with 30 µg O3 that, after 48 h, showed a significantly higher number of dead cells vs. control samples (Figure 1).

3.2. Cell Growth

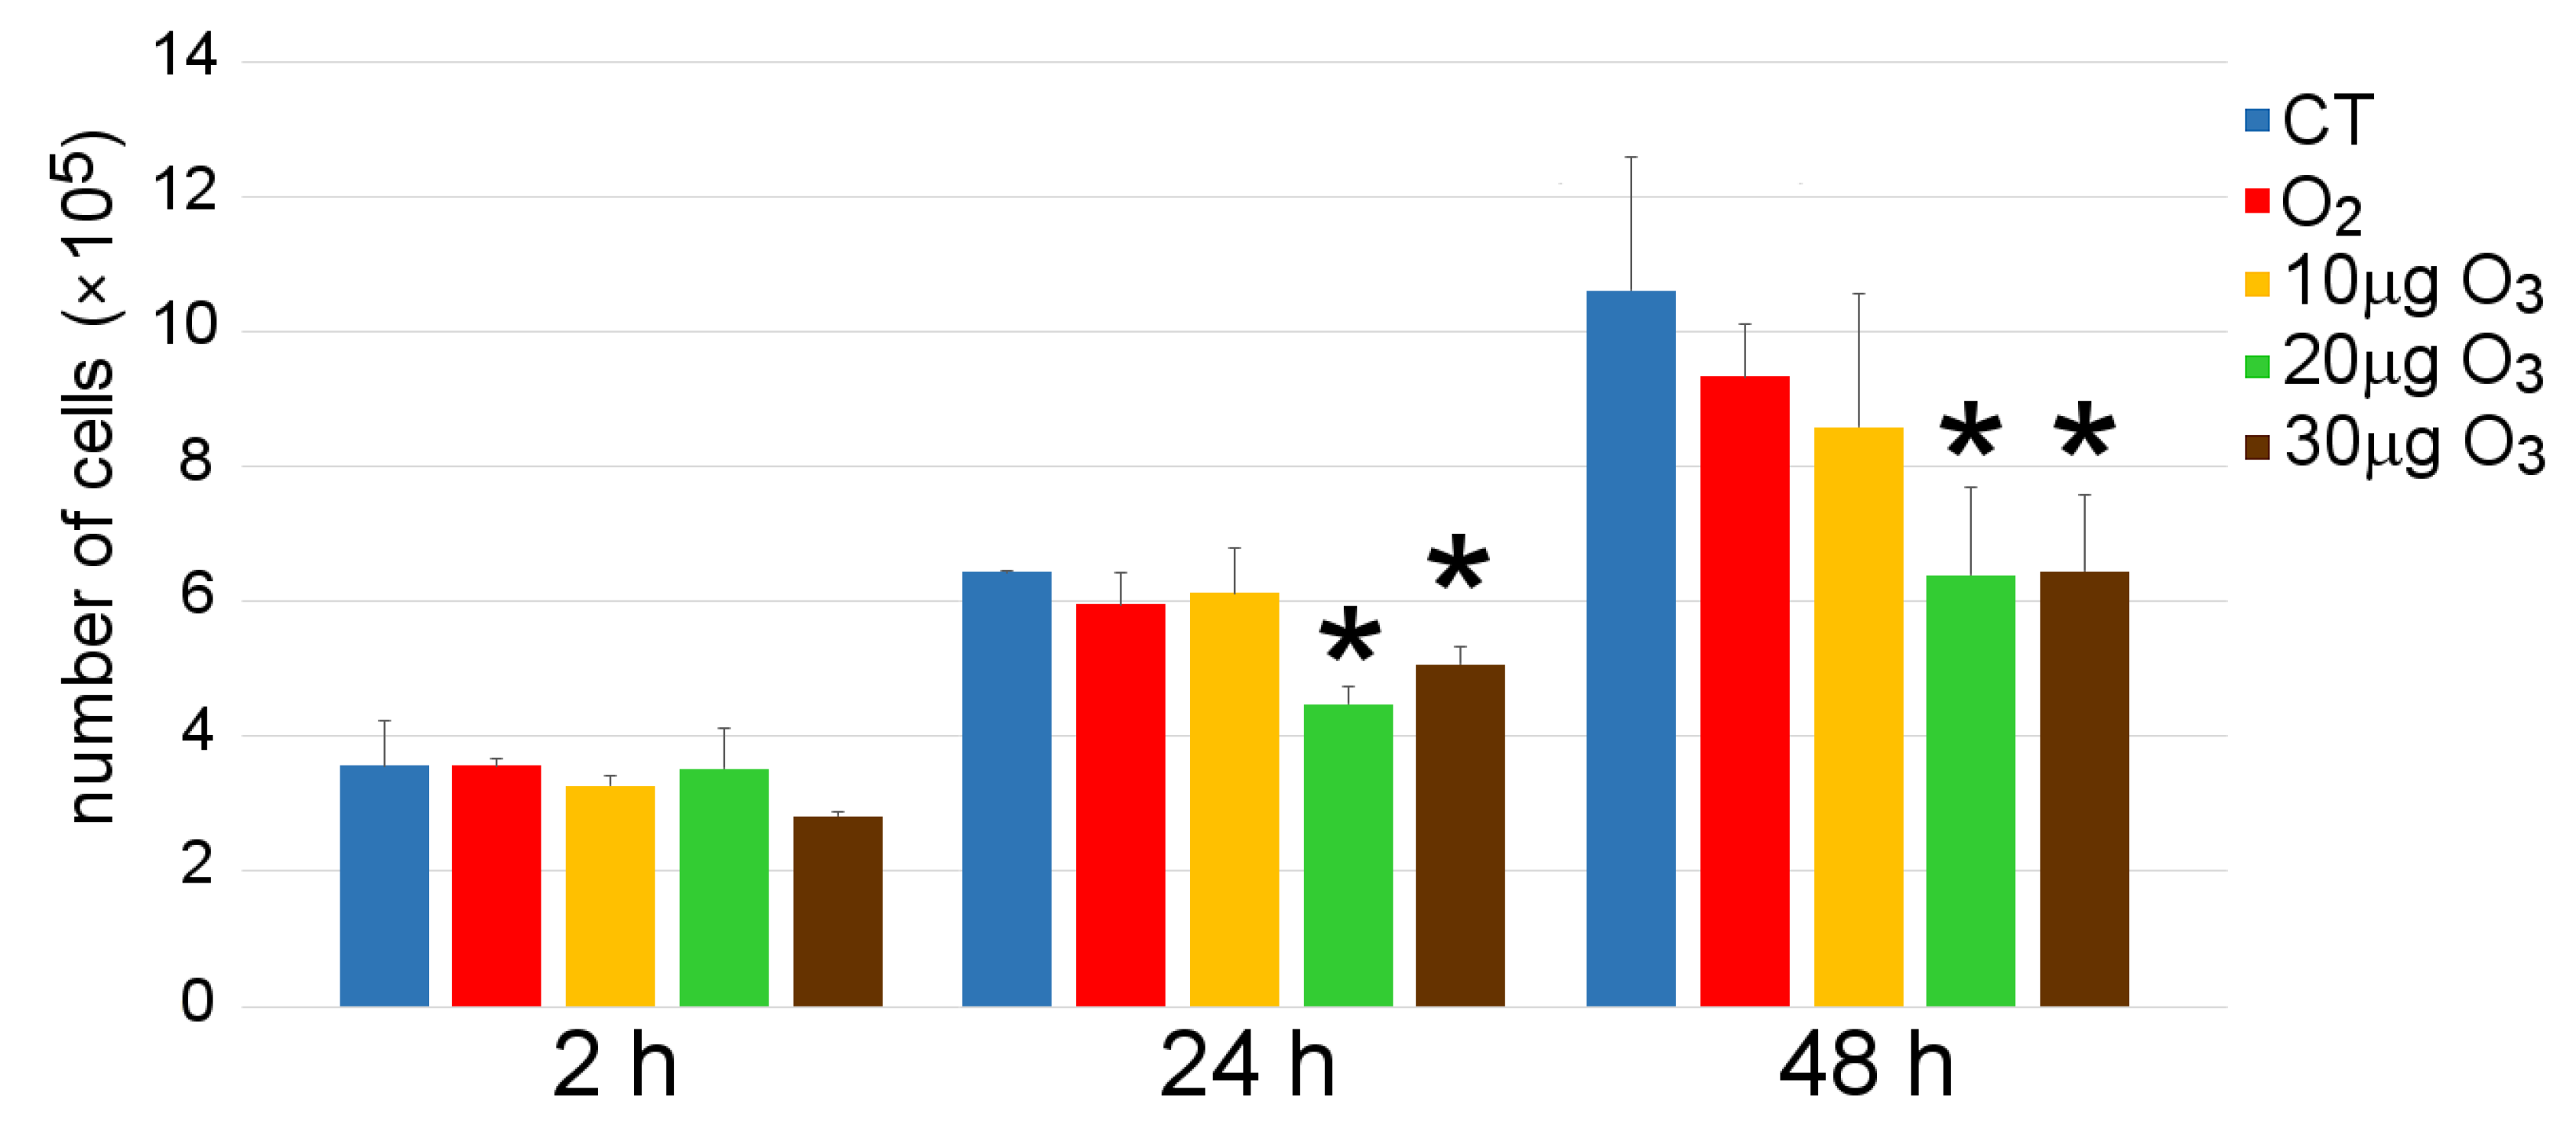
The number of Jurkat cells significantly decreased after 24 and 48 h from treatment with 20 µg O3 and 30 µg O3 in comparison to the respective controls (Figure 2).

3.3. Transmission Electron Microscopy

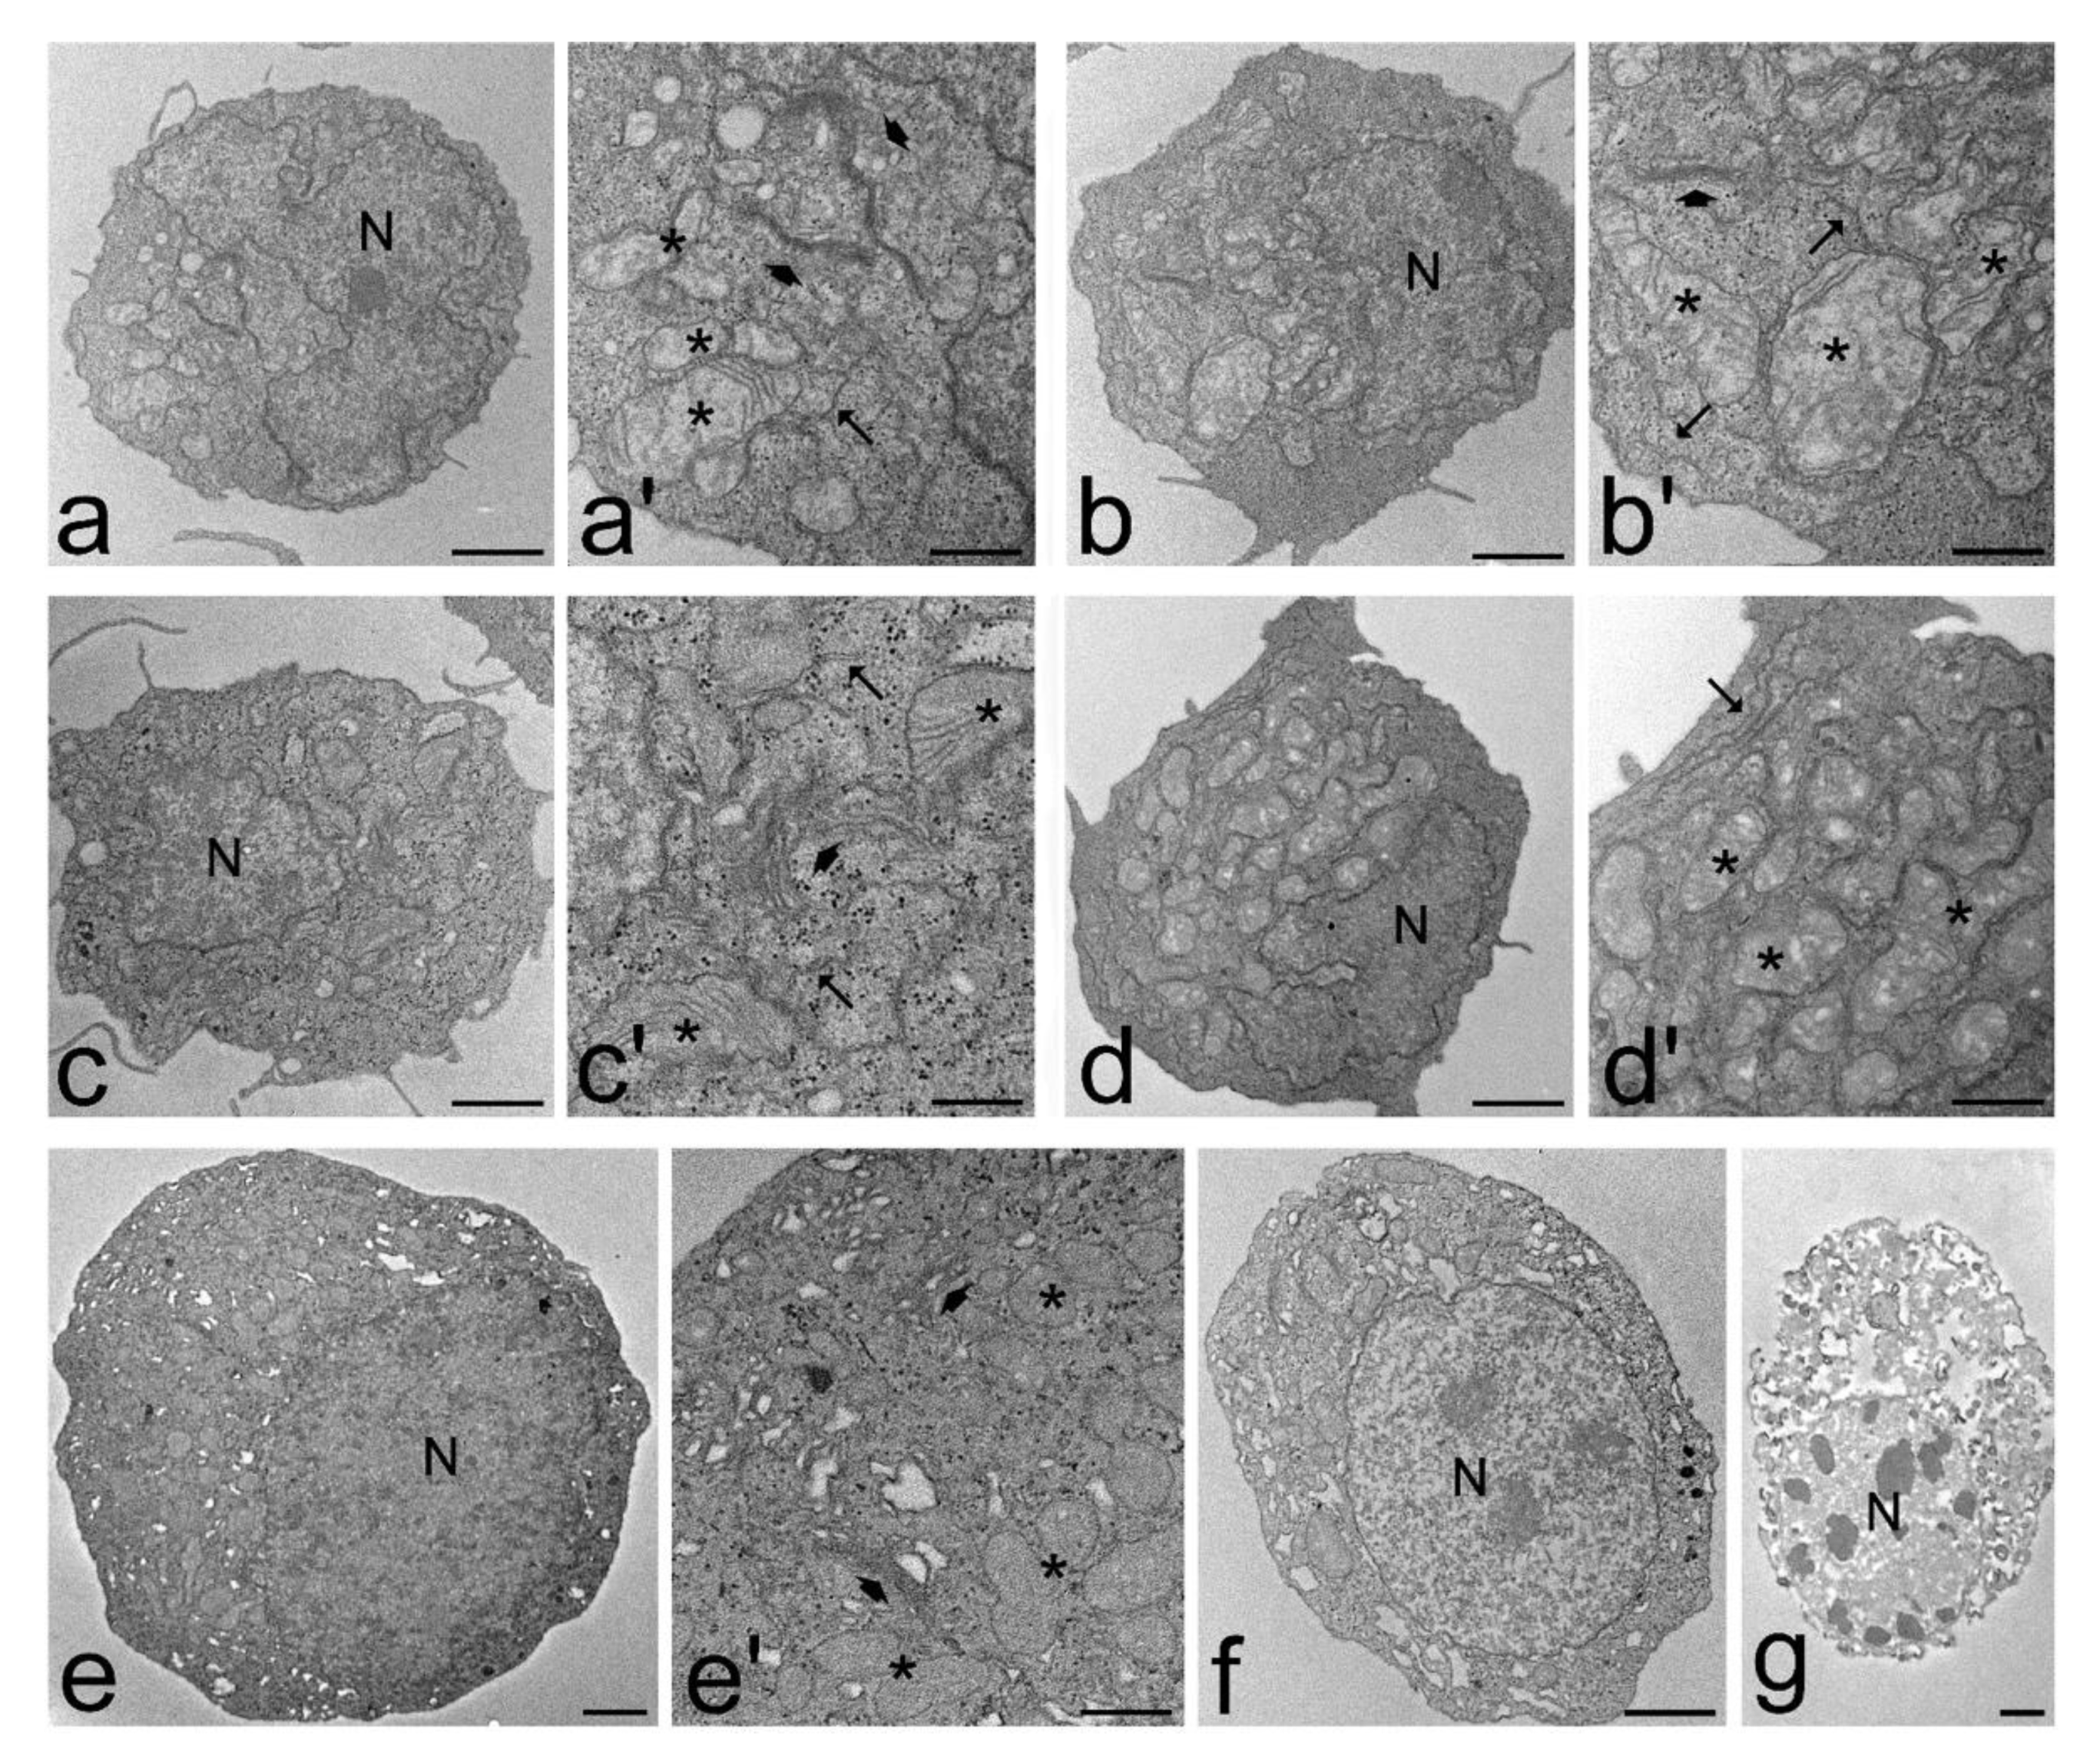
At TEM, control Jurkat cells showed a roundish shape, many microvilli on their surface, and one large nucleus of irregular shape (Figure 3a). In the cytoplasm, ovoid mitochondria with lamellar cristae were numerous, the Golgi apparatus and the rough endoplasmic reticulum were well developed, and large amounts of free ribosomes were scattered in the cytosol (Figure 3a’). Conversely, the smooth endoplasmic reticulum and secondary lysosomes/residual bodies were quite rare. After treatment with O2, the cells appeared unaltered, apart from the presence of some swollen mitochondria with scarce cristae (Figure 3b,b’). After exposure to 10 µg O3, the cells maintained ultrastructural features quite similar to the controls (Figure 3c,c’). After treatment with 20 µg O3, the cells showed altered mitochondria with dense matrix and enlarged cristae, while the other cell structural components were unaffected (Figure 3d,d’). After treatment with 30 µg O3, most cells showed loss of microvilli, roundish nuclei, cytoplasmic vacuolization, and mitochondria with dense matrix and hardly visible cristae, whereas the other cytoplasmic organelles did not undergo evident alterations (Figure 3e,e’,f). In addition, some necrotic cells were found (Figure 3g), whereas apoptotic cells were never observed.
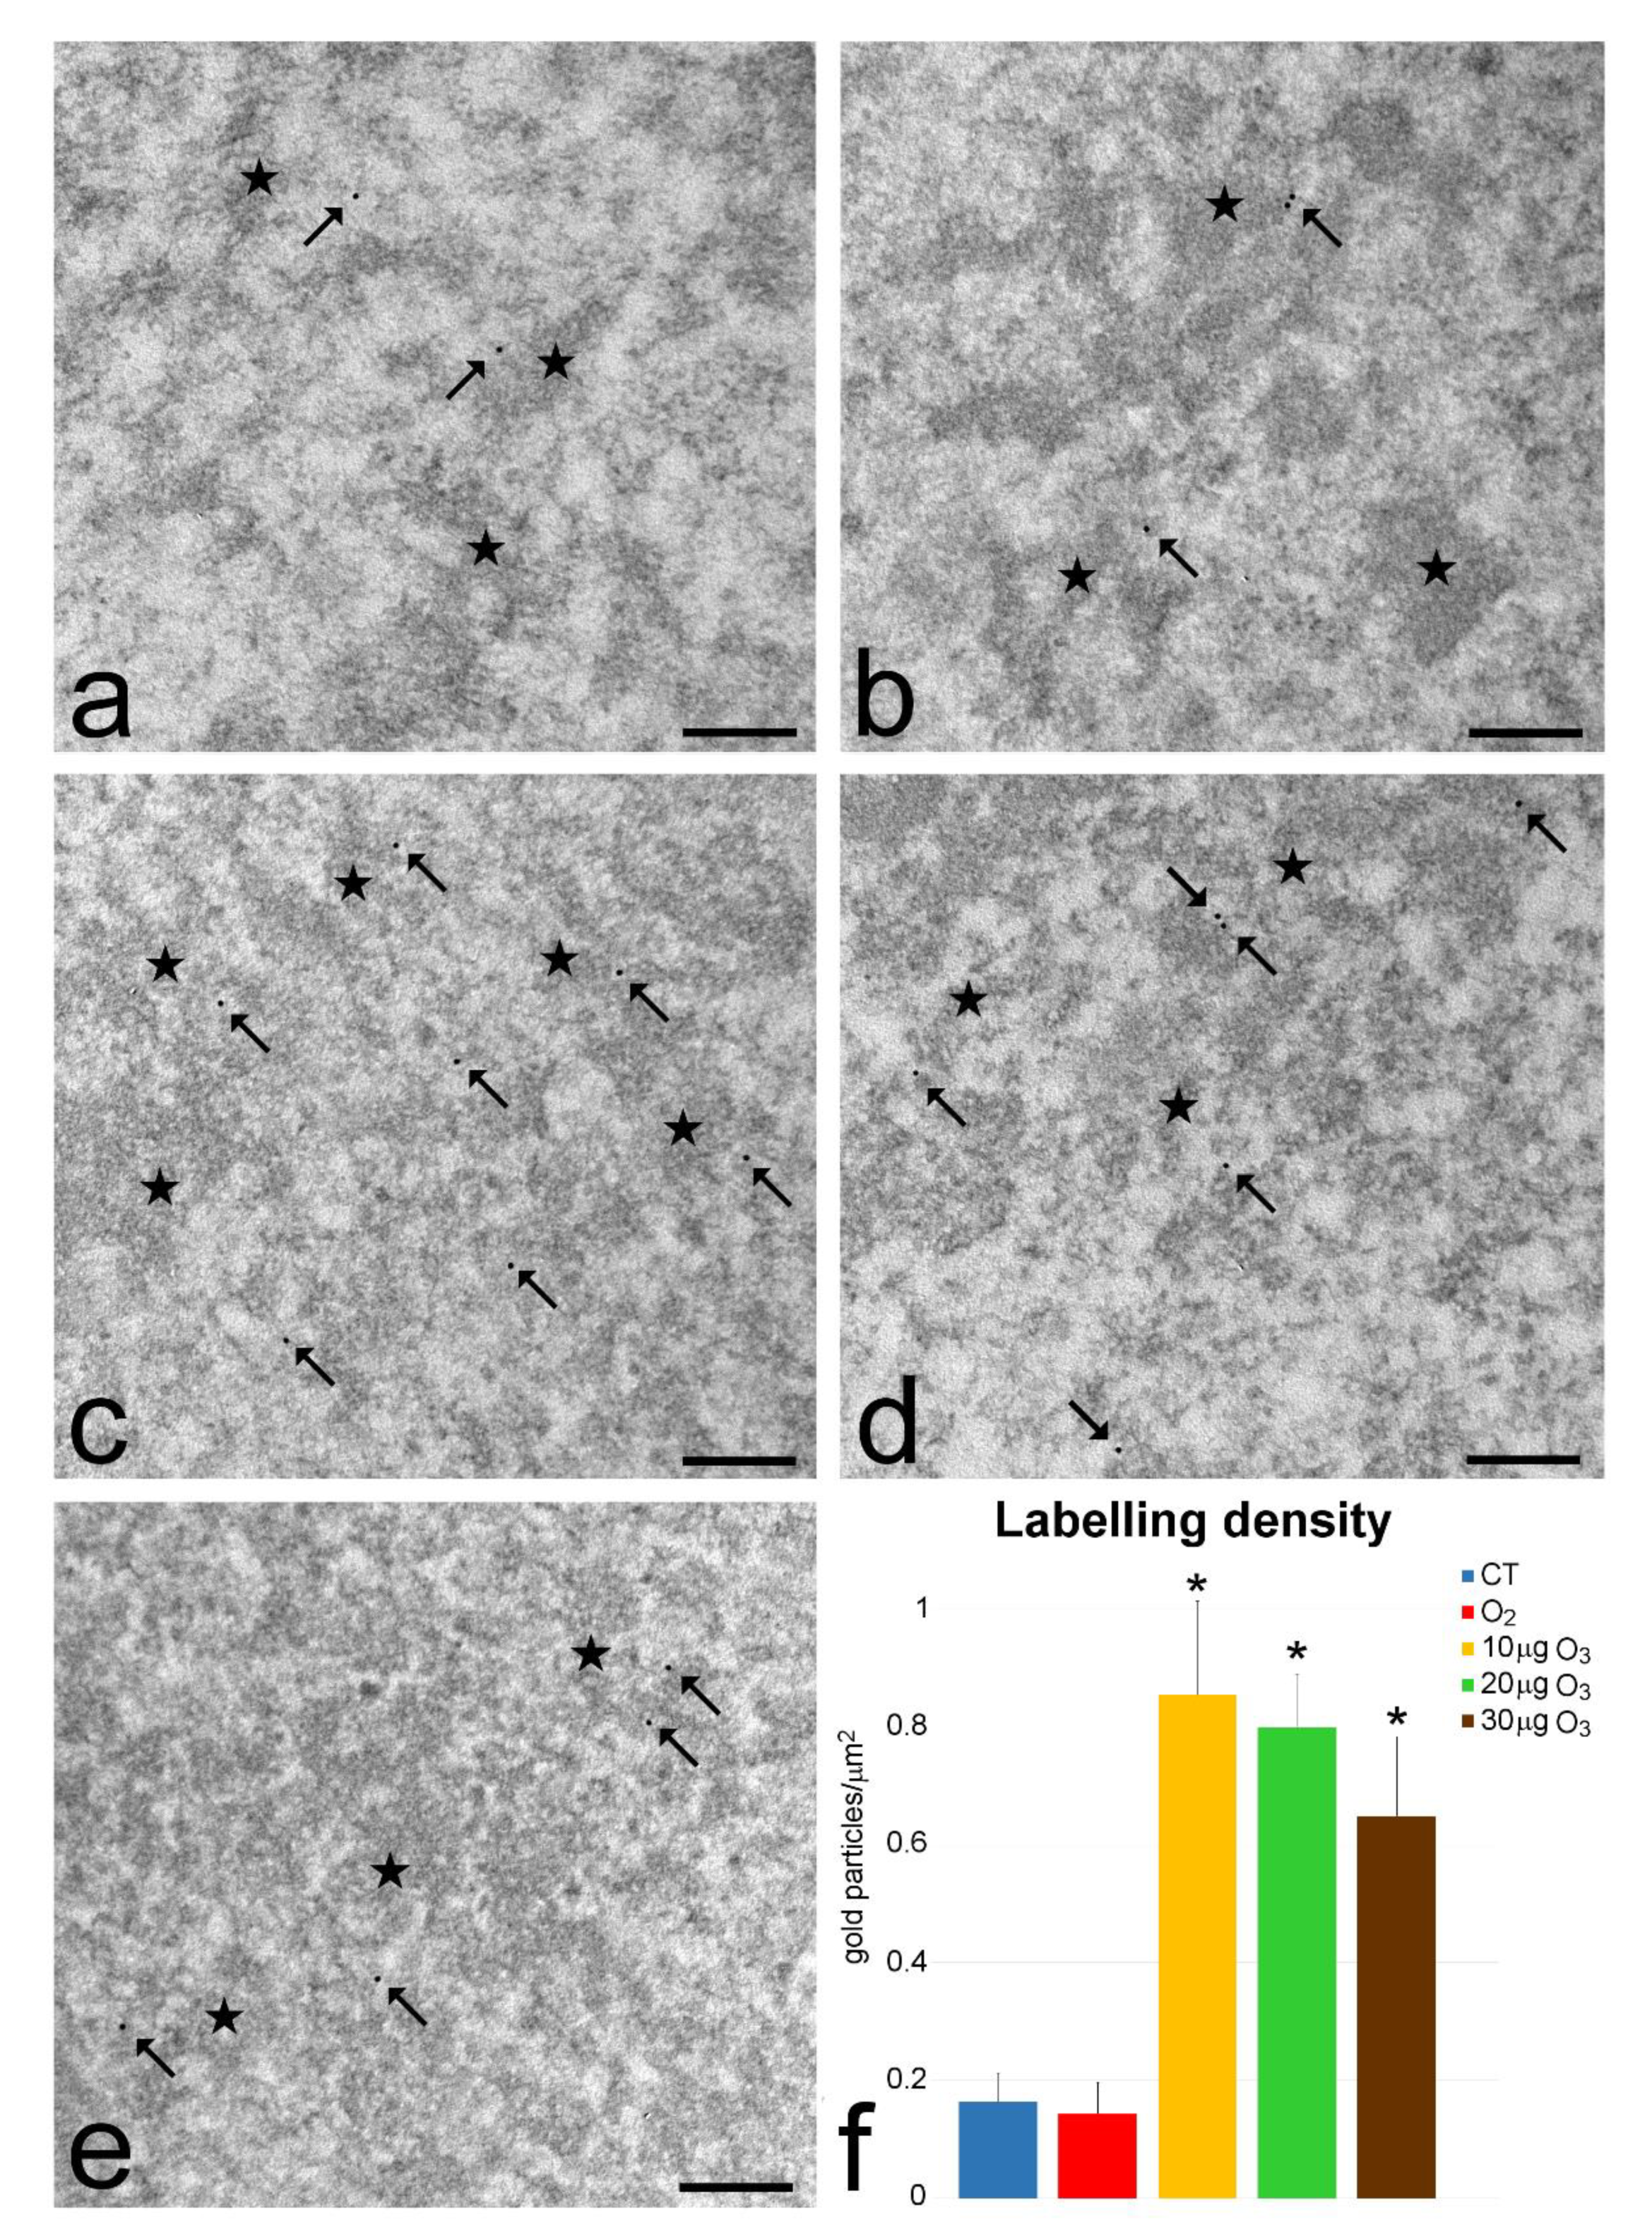
To assess whether the O3 treatment might affect the nuclear distribution of Nrf2, we investigated the ultrastructural immunostaining of Jurkat cell nuclei. In all samples, Nrf2 was specifically located along the borders of the heterochromatin clumps (Figure 4a–e). Quantitative evaluation revealed a statistically significant increase in nucleoplasmic anti-Nrf2 labeling density (p < 0.001, one-way ANOVA) in all cell samples treated with O3 in comparison to control, while O2-treated cells showed values similar to control (Figure 4f). Background was negligible (0.03 ± 0.09 gold particles/µm2).

3.4. Quantitative Real-Time Polymerase Chain Reaction

qPCR demonstrated a significant upregulation of Hmox1 in Jurkat cells treated with O3 in comparison to control and O2-treated cells. In particular, Hmox1 increased in proportion to the O3 concentration, as demonstrated by the ANOVA test for linear trend in Figure 5.

3.5. IL-2 and IFN-γ Secretion

The amount of IL-2 and IFN-γ was assessed in the culture medium of both non-activated and activated Jurkat cells (Figure 6).
In non-activated cells, the amount of IL-2 significantly increased in the medium of all treated cells in comparison to control. After activation, the amount of IL-2 detected in the medium of activated control cells was significantly higher in comparison to the non-activated control samples (p < 0.001), but no significant modification due to gas treatment was detected among the activated cells samples.
The amount of IFN-γ was lower than the detection limit in all the samples.
For a correct interpretation of the results on IL-2 and IFN-γ secretion, cell death and growth were assessed also after PHA/PMA activation. The results were quite similar to those obtained with non-activated cells.
The death rate of PHA/PMA-activated Jurkat cells did not differ in control and treated samples (O2, 10 µg O3, 20 µg O3, 30 µg O3) at all the considered time points (2, 24, and 48 h), apart from the sample treated with 30 µg O3 that showed a significantly higher number of dead cells after 48 h (Figure 7).
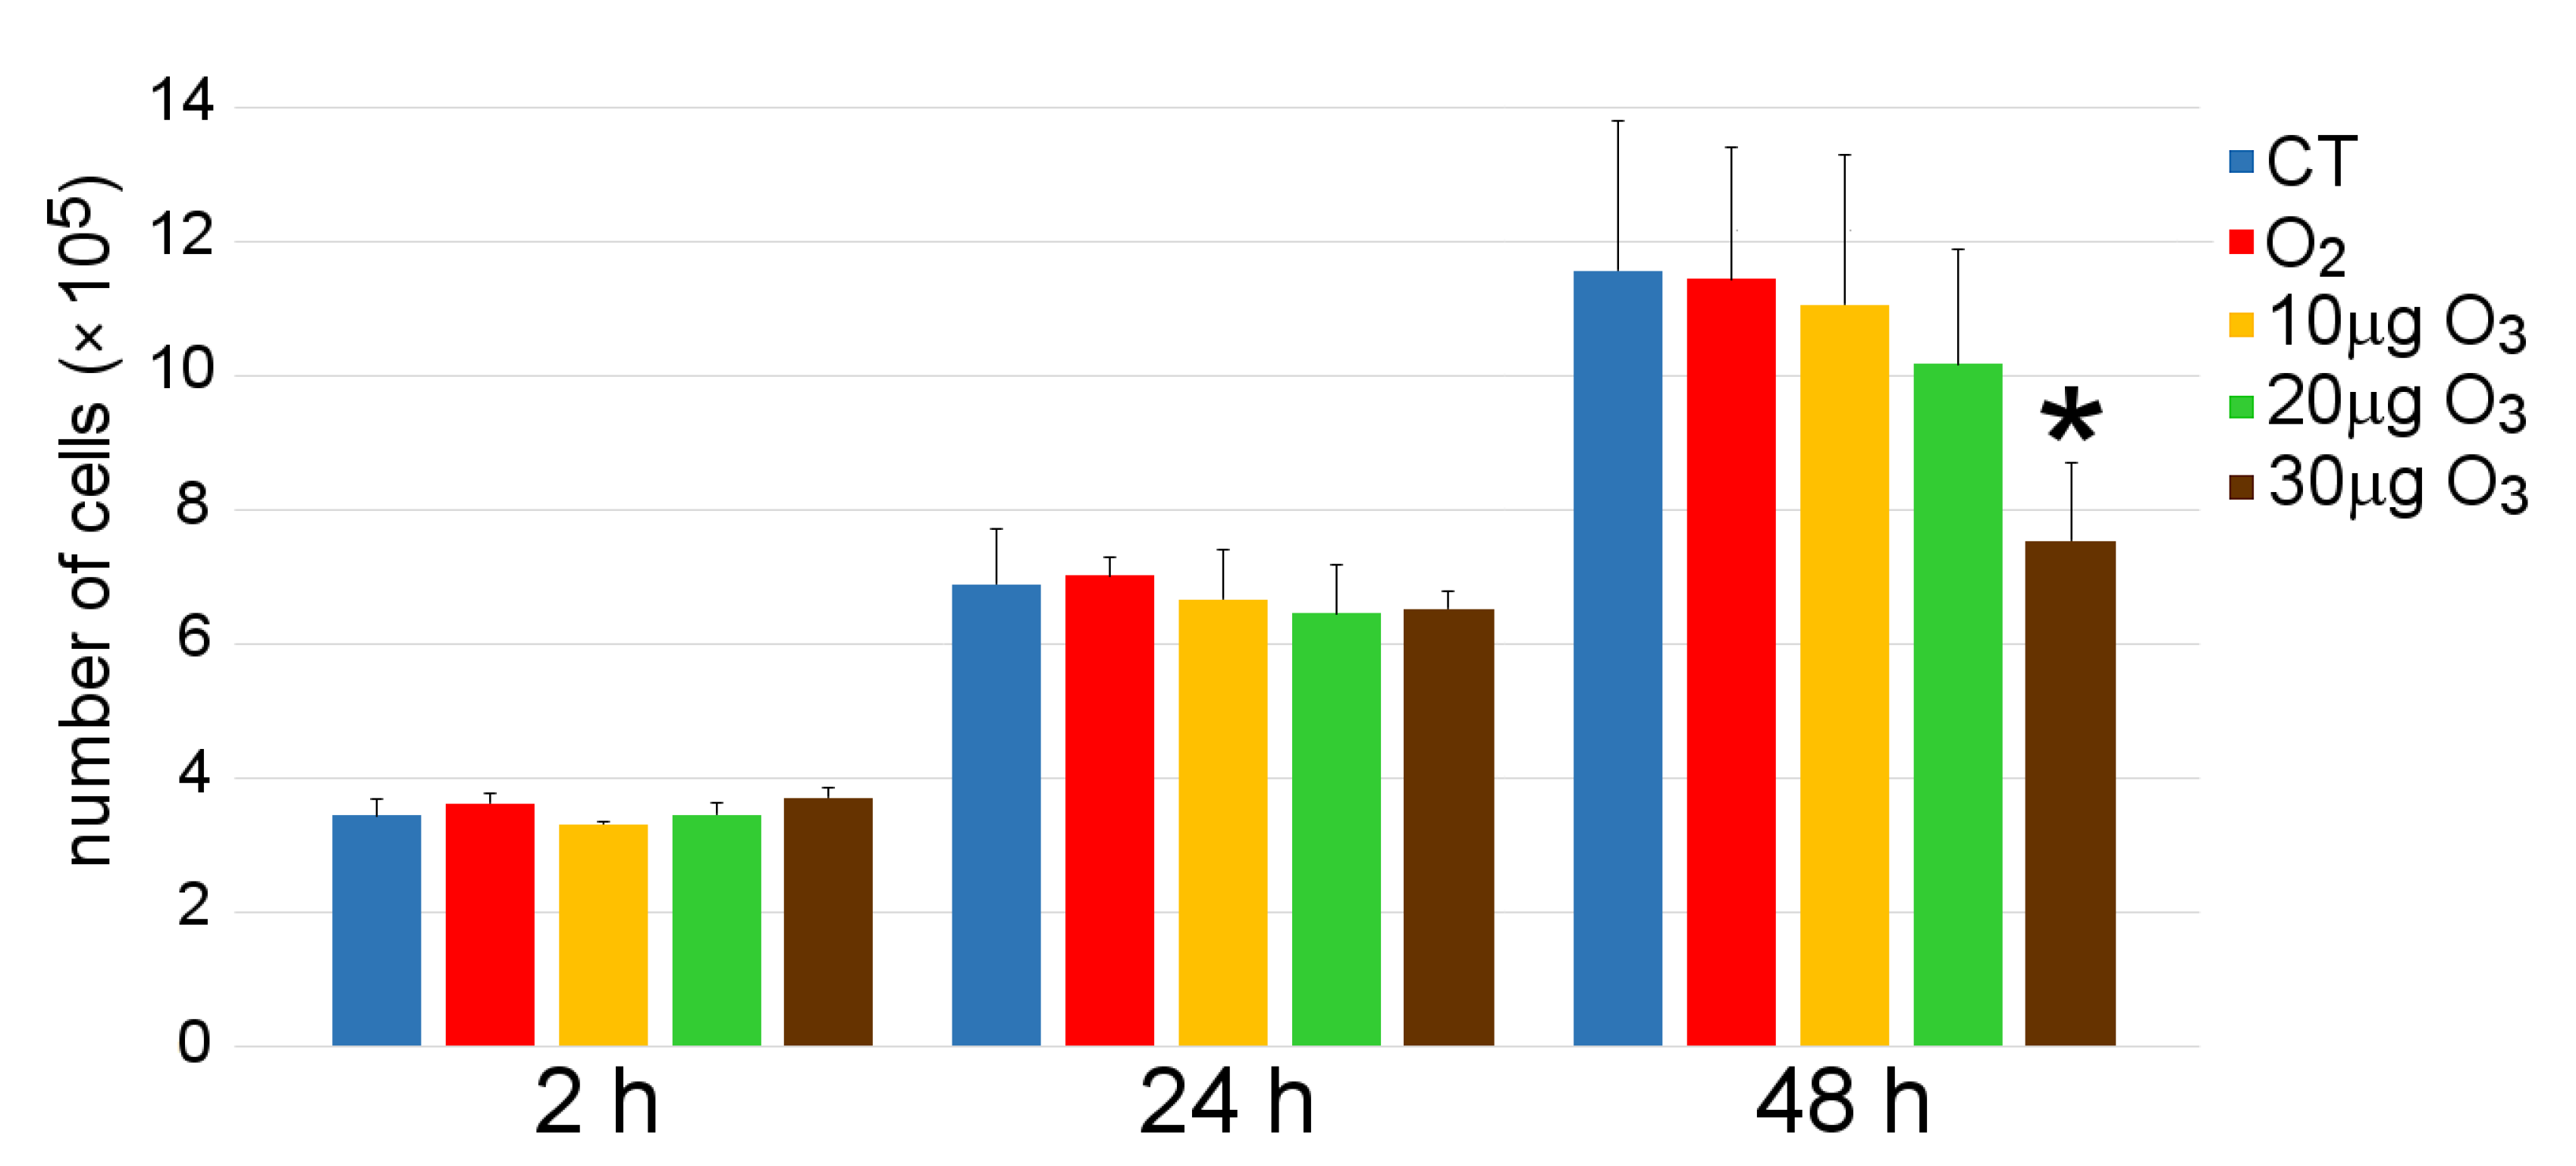
After activation with PHA/PMA, the number of Jurkat cells did not change, apart from the sample treated with 30 µg O3, where cell population significantly decreased after 48 h (Figure 8).

4. Discussion

In this study, Jurkat cells were treated with gaseous O2-O3 mixtures at the O3 concentrations currently used for systemic administration by major autohemotherapy, with the aim of investigating their differential effects on some structural and functional features of T lymphocytes. Jurkat cells are from a cell line derived from a patient affected by acute lymphoblastic leukemia and leukemic transformed non-Hodgkin lymphoma [14]; however, during the last several decades it has been widely used as reliable in vitro model for scientific studies not only on T cell leukemia but also on T cell signaling and response to various stimuli, including antioxidant and anti-inflammatory compounds e.g., [30,31,32,33,34] as well as ozonation [21]. On this basis, Jurkat cells were chosen for the present study as a suitable in vitro model to investigate the molecular and cellular effects of low O3 concentrations, with special focus on the capability of O3 to influence IL-2 and IFN-γ secretion in both non-activated and activated T cells. In fact, the knowledge of the relationship between O3 dose and T lymphocyte response in term of antioxidant activity and immune activation may give a significant contribution to improve the curative potential of major autohemotherapy.
The trypan blue exclusion test revealed that, under our experimental conditions, the gas exposure (O2, 10 µg O3, 20 µg O3, and 30 µg O3) did not induce significant alteration in Jurkat cell viability at both short (2 h) and medium (24 h) term. However, at 48 h post-treatment, exposure to 30 µg O3 resulted in a significant increase of cell death, whereas the other gases (O2, 10 µg O3, and 20 µg O3) confirmed their safety at long term. These data demonstrate that the treatment with 10 or 20 μg O3 does not induce appreciable cell death in T lymphocytes in vitro, consistently with previous findings in different cultured cells [17,18,35] as well as in explanted adipose tissue [20]. In addition, these data suggest that cell death induced by the exposure to 30 μg O3 is not an acute event but probably occurs due to the cellular failure to repair the damages caused by the initial stress. This hypothesis is consistent with the finding that in samples treated with 30 μg O3, the cell population significantly decreased after 24 h from the gas exposure (indicating a reduced cell proliferation in the absence of cell death) and further declined after 48 h (when the increased death rate contributed to cell loss).
Interestingly, the treatment with 20 μg O3 also induced a significant decrease in cell population after both 24 and 48 h, suggesting the occurrence of some cell stress responsible for a reduction in cell proliferation but not in cell viability. Our data on cell proliferation are consistent with previous findings on Jurkat cells [21] as well as on peripheral blood mononuclear cells [36] demonstrating that proliferation rate is inversely related to O3 concentration.
According to the results on cell viability and proliferation, TEM observations showed that, after 24 h post-treatment with 20 μg O3, Jurkat cells were vital but showed mitochondrial alterations, while after exposure to 30 μg O3, many vacuoles also occurred in most cells. Moreover, in 30 μg O3-treated samples some necrotic cells were found, demonstrating cell stress and damage, whereas no sign of apoptosis was found consistently with previous studies excluding apoptogenic effects of low O3 concentrations [17,18,20].
Mitochondrial damage usually occurs when respiratory capability is reduced or altered [32], and reactive oxygen species regulate mitochondrial functions (review in [37,38]). Therefore, the oxidative stress due to 20 μg O3 and 30 μg O3 could induce various degrees of functional alterations that could also explain the lowering in cell population observed in 20 μg O3 and 30 μg O3-treated samples at long incubation times. Some mitochondrial alterations were also found in cells treated with pure O2, probably due again to an excessive oxidative stress; however mitochondrial damage was less frequent than in O3-treated cells and was not accompanied by a decrease in cell viability or proliferation at any time point considered. On the other hand, no ultrastructural alteration was ever found in 10 μg O3-treated cells up to 48 h, indicating that, under our experimental conditions, this O3 concentration was the safest for T lymphocytes. Moreover, experimental evidence proved that appropriate O3 concentrations might even improve mitochondrial activity [39,40].
Nrf2 is a transcription factor and its presence along the border of heterochromatin clumps is consistent with its functional role since this nuclear region contains perichromatin fibrils i.e., the in situ form of transcription, splicing, and 3′-end processing of pre-mRNAs [41,42,43]. Interestingly, the amount of Nrf2 markedly increased in the nuclei of all O3-treated cell samples in comparison to control, whereas no modification occurred in O2-treated samples. It has been demonstrated that the mild oxidative stress caused by the exposure to low O3 concentrations induces the dissociation of Nrf2 from its negative regulator Keap1; then, Nrf2 rapidly moves from the cytoplasm into the nucleus, where it activates the expression of antioxidant response elements (ARE)-driven genes [19,44]. This mechanism ensures an efficient transcription of antioxidant genes through the mobilization of the cytoplasmic Nrf2, avoiding its de novo synthesis. The exposure to 10, 20, and 30 μg O3 therefore proved to stimulate in Jurkat cells a stronger nuclear translocation of Nrf2 than treatment with pure O2. The expression of Hmox1 i.e., the gene encoding for the stress-protective protein heme oxygenase-1 involved in the regulatory pathways of antioxidant response, inflammation, apoptosis and angiogenesis [45], proved to be upregulated following exposure to low O3 concentrations [28]. Consistently, Hmox1 expression significantly increased in O3-treated Jurkat cells in dose-dependent manner in comparison to control, whereas pure O2 had no effect. This finding is consistent with the O3 dose-dependent increase of some antioxidant enzyme activity previously reported in Jurkat cells [21].
Gas treatments proved also to increase the secretion of IL-2 in Jurkat cells. IL-2 is a cytokine secreted by antigen-activated T cells and is characterized by a wide range of actions, including the ability to stimulate the proliferation of T cells [46], improve the cytolytic activity of natural killer (NK) cells and tumor-infiltrating lymphocytes, increase immunoglobulin production by activated B cells, and act on innate lymphoid cells, memory T cells, effector T cells, and monocytes (review in [47]). In particular, IL-2 plays a key role in the control of the immune response by opposite functions: it promotes effector T cells (as an immunostimulatory factor) and maintains homeostatic proliferation of regulatory T cells (as an immunoinhibitory factor). In this view, both pure O2 and O2-O3 mixtures with low ozone concentrations may be envisaged as a stimulating factor of T lymphocytes, likely due to their ability to induce oxidative stress. It is in fact known that reactive oxygen species, through the Nrf2-dependent activation of ARE-dependent genes [44], may act as regulators of the inflammatory process by triggering several signaling cascades, which involve the expression of several antioxidant enzymes, the inhibition of pro-inflammatory and the stimulation of anti-inflammatory cytokines and, in particular, the activation of T cells [48,49,50]. This finding is consistent with clinical and experimental evidence that the O2-O3 therapy contributes in modulating inflammatory cytokines in various pathological conditions (recent reviews in [51,52,53,54,55,56,57]).
In the frame of its multiple roles in immune response, IL-2 is involved also in wound healing, by acting both systemically and at the wound site. In particular, IL-2 signaling is fundamental at the early phase by drawing the immune mediators necessary to start the wound healing, by limiting microbial infections and promoting epithelial and endothelial cell proliferation, while later the decrease of IL-2 plays an anti-inflammatory effect by attracting and stimulating regulatory T cells, thus avoiding scar formation (review in [58]). The stimulating effect on IL-2 secretion by O2-O3 gas treatments therefore provides a scientific support to the success of O2-O3 therapy in improving healing in various pathological conditions, such as skin and oral diseases, diabetic foot, and peripheral arterial disease (reviews in [53,57,59,60,61,62]).
On the other hand, gas treatments were unable to affect the secretion of IFN-γ, whose levels remained always below the detection limit. Probably, the level of reactive oxygen species necessary for stimulating Jurkat cells to secrete IFN-γ must be higher than the mild oxidation induced in our experiments, as suggested by experiments with ionizing radiations [63].
In sum, the present findings provide evidence that the cytoprotective mechanisms promoted by a mild oxidative stress includes the activation of T lymphocytes, which are stimulated to secrete IL-2, but not IFN-γ. However, if Jurkat cells were previously activated with PHA/PMA, gas treatments had no effect on IL-2 and IFN-γ secretion. It is worth noting that activated Jurkat cells behaved similarly to non-activated cells in response to gas treatments as they did to cell viability and growth, suggesting that activation does not alter T lymphocyte sensitivity to oxidative stress.
As expected, PHA/PMA-activated control Jurkat cells secreted significantly higher amounts of IL-2 than non-activated control, but all gas-treated activated Jurkat cells showed a secretory activity similar to activated control. This suggests that, under our experimental conditions, the mild oxidative stress caused by gas treatments was unable to promote further IL-2 secretion by already activated T cells, thus avoiding exacerbation of the immune response. As for IFN-γ, the PHA/PMA stimulation was unable to increase the secretion of this cytokine by Jurkat cells, according to previous observations [28]. Similarly, gas treatments were ineffective in stimulating IFN-γ secretion by activated cells, probably because of the too weak oxidative stress induced as supposed for IL-2.

5. Conclusions

In our in vitro study, we tested on Jurkat cells the effects of the O2-O3 mixtures usually administered for major autohemotherapy in humans. Our findings demonstrate that 10, 20, and 30 µg O3 concentrations are all able to trigger the Nrf2-induced activation of antioxidant cytoprotective mechanisms. Moreover, all O2-O3 mixtures tested as well as pure O2 proved to increase the secretion of IL-2, suggesting that T lymphocyte activation may be induced by a mild oxidative stress irrespective of the presence of O3. Importantly, the mild oxidative stress induced by these gas treatments do not exert stimulating effects in already activated Jurkat cells; this evidence suggests that the O3-induced lymphocyte hyperactivation is unlikely to occur.
However, the viability and proliferation tests as well as the fine morphological analysis at transmission electron microscopy revealed cell alterations and damage after exposure to 30 µg O3 and, at a lesser extent, to 20 µg O3, thus designating 10 µg O3 as the most suitable O3 concentration to combine cell safety and efficient antioxidant and immune response in Jurkat cells.
Although in the patient, the effects of O3 are mediated by many blood and tissue factors, our basic study offers novel evidence of the fine regulatory role played by the oxidative stress level in the hormetic response of T lymphocytes to O2-O3 administration. Further research is necessary to fully elucidate the correlation between O3 concentration and the modulation of immune cell activity with the aim of obtaining the best therapeutic effects while avoiding cell damage. Achieving this knowledge would pave the way to the development of specific protocols for different inflammatory conditions and to personalized applications of O2-O3 therapy.

Author Contributions

Conceptualization, O.A., G.T., and M.M.; methodology, E.C. and M.C.; investigation, E.C., M.C., M.G., L.C., and M.M.; writing—original draft preparation, M.M.; writing—review and editing, O.A., G.T., and M.M.; supervision, M.M.; project administration, M.M.; funding acquisition, M.M. All authors have read and agreed to the published version of the manuscript.

Funding

This research was funded by the University of Verona (Joint Projects 2019) and by Tecnoline S.p.a. (Concordia sulla Secchia, MO, Italy).

Institutional Review Board Statement

Not applicable.

Informed Consent Statement

Not applicable.

Data Availability Statement

Not applicable.

Conflicts of Interest

The authors declare no conflict of interest.

References

  1. Re, L.; Mawsouf, M.N.; Menéndez, S.; León, O.S.; Sánchez, G.M.; Hernández, F. Ozone therapy: Clinical and basic evidence of its therapeutic potential. Arch. Med. Res. 2008, 39, 17–26. [Google Scholar] [CrossRef] [PubMed]
  2. Elvis, A.M.; Ekta, J.S. Ozone therapy: A clinical review. J. Nat. Sc. Biol. Med. 2011, 2, 66–70. [Google Scholar] [CrossRef] [PubMed] [Green Version]
  3. Bocci, V. How a calculated oxidative stress can yield multiple therapeutic effects. Free Radic. Res. 2012, 46, 1068–1075. [Google Scholar] [CrossRef] [PubMed]
  4. Galiè, M.; Covi, V.; Tabaracci, G.; Malatesta, M. The Role of Nrf2 in the Antioxidant Cellular Response to Medical Ozone Exposure. Int. J. Mol. Sci. 2019, 20, 4009. [Google Scholar] [CrossRef] [PubMed] [Green Version]
  5. Sagai, M.; Bocci, V. Mechanisms of action involved in ozone therapy: Is healing induced via a mild oxidative stress? Med. Gas. Res. 2011, 1, 29. [Google Scholar] [CrossRef] [Green Version]
  6. Viebahn-Hansler, R.; Leon Fernandez, O.S.; Fahmy, Z. Ozone in medicine: The low dose ozone concept—Guidelines and treatment strategies. Ozone Sci. Eng. 2012, 34, 408–424. [Google Scholar] [CrossRef]
  7. Goldman, M. Cancer risk of low-level exposure. Science 1996, 271, 1821–1822. [Google Scholar] [CrossRef]
  8. Bocci, V.A.; Zanardi, I.; Travagli, V. Ozone acting on human blood yields a hormetic dose-response relationship. J. Transl. Med. 2011, 9, 66. [Google Scholar] [CrossRef] [Green Version]
  9. Menegon, S.; Columbano, A.; Giordano, S. The Dual Roles of NRF2 in Cancer. Trends Mol. Med. 2016, 22, 578–593. [Google Scholar] [CrossRef]
  10. Hojo, T.; Maishi, N.; Towfik, A.M.; Akiyama, K.; Ohga, N.; Shindoh, M.; Hida, Y.; Minowa, K.; Fujisawa, T.; Hida, K. ROS enhance angiogenic properties via regulation of NRF2 in tumor endothelial cells. Oncotarget 2017, 8, 45484–45495. [Google Scholar] [CrossRef] [Green Version]
  11. Kang, K.A.; Hyun, J.W. Oxidative Stress, Nrf2, and Epigenetic Modification Contribute to Anticancer Drug Resistance. Toxicol. Res. 2017, 33, 1–5. [Google Scholar] [CrossRef] [Green Version]
  12. Rojo de la Vega, M.; Chapman, E.; Zhang, D.D. NRF2 and the Hallmarks of Cancer. Cancer Cell 2018, 34, 21–43. [Google Scholar] [CrossRef]
  13. Costanzo, M.; Romeo, A.; Cisterna, B.; Calderan, L.; Bernardi, P.; Covi, V.; Tabaracci, G.; Malatesta, M. Ozone at low concentrations does not affect motility and proliferation of cancer cells in vitro. Eur. J. Histochem. 2020, 64, 3119. [Google Scholar] [CrossRef] [Green Version]
  14. Schneider, U.; Schwenk, H.U.; Bornkamm, G. Characterization of EBV-Genome Negative “Null” and “T” Cell Lines Derived from Children with Acute Lymphoblastic Leukemia and Leukemic Transformed Non-Hodgkin Lymphoma. Int. J. Cancer 1977, 19, 621–626. [Google Scholar] [CrossRef] [PubMed]
  15. Levine, B.L.; May, W.S.; Tyler, P.G.; Hesse, A.D. Response of Jurkat T Cells to Phorbol Ester and Bryostatin. Development of Sublines with Distinct Functional Responses and Changes in Protein Kinase C Activity. J. Immunol. 1991, 147, 3474–3481. [Google Scholar] [PubMed]
  16. Abraham, R.T.; Weiss, A. Jurkat T Cells and Development of the T-Cell Receptor Signalling Paradigm. Nat. Rev. Immunol. 2004, 4, 301–308. [Google Scholar] [CrossRef] [PubMed]
  17. Costanzo, M.; Cisterna, B.; Vella, A.; Cestari, T.; Covi, V.; Tabaracci, G.; Malatesta, M. Low ozone concentrations stimulate cytoskeletal organization, mitochondrial activity and nuclear transcription. Eur. J. Histochem. 2015, 59, 2515. [Google Scholar] [CrossRef] [PubMed] [Green Version]
  18. Scassellati, C.; Costanzo, M.; Cisterna, B.; Nodari, A.; Galiè, M.; Cattaneo, A.; Covi, V.; Tabaracci, G.; Bonvicini, C.; Malatesta, M. Effects of mild ozonisation on gene expression and nuclear domains organization in vitro. Toxicol. In Vitro 2017, 44, 100–110. [Google Scholar] [CrossRef] [Green Version]
  19. Galiè, M.; Costanzo, M.; Nodari, A.; Boschi, F.; Calderan, L.; Mannucci, S.; Covi, V.; Tabaracci, G.; Malatesta, M. Mild ozonisation activates antioxidant cell response by the Keap1/Nrf2 dependent pathway. Free Radic. Biol. Med. 2018, 124, 114–121. [Google Scholar] [CrossRef]
  20. Cisterna, B.; Costanzo, M.; Nodari, A.; Galiè, M.; Zanzoni, S.; Bernardi, P.; Covi, V.; Tabaracci, G.; Malatesta, M. Ozone Activates the Nrf2 Pathway and Improves Preservation of Explanted Adipose Tissue In Vitro. Antioxidants (Basel) 2020, 9, 989. [Google Scholar] [CrossRef]
  21. Larini, A.; Bianchi, L.; Bocci, V. The ozone tolerance: I) Enhancement of antioxidant enzymes is ozone dose-dependent in Jurkat cells. Free Radical Res. 2003, 37, 1163–1168. [Google Scholar] [CrossRef] [PubMed]
  22. Weiss, A.; Wiskocil, R.L.; Stobo, J.D. The role of T3 surface molecules in the activation of human T cells: A two-stimulus requirement for IL 2 production reflects events occurring at a pre-translational level. J. Immunol. 1984, 133, 123–128. [Google Scholar] [CrossRef] [PubMed] [Green Version]
  23. Wiskocil, R.; Weiss, A.; Imboden, J.; Kamin-Lewis, R.; Stobo, J. Activation of a human T cell line: A two-stimulus requirement in the pretranslational events involved in the coordinate expression of interleukin 2 and gamma-interferon genes. J. Immunol. 1985, 134, 1599–1603. [Google Scholar] [PubMed]
  24. Manger, B.; Hardy, K.J.; Weiss, A.; Stobo, J.D. Differential effect of cyclosporin A on activation signaling in human T cell lines. J. Clin. Investig. 1986, 77, 1501–1506. [Google Scholar] [CrossRef] [Green Version]
  25. Strober, W. Trypan Blue Exclusion Test of Cell Viability. Curr. Protoc. Immunol. 2015, 111, A3.B.1–A3.B.3. [Google Scholar] [CrossRef]
  26. Bendayan, M.; Zollinger, M. Ultrastructural localization of antigenic sites on osmium-fixed tissues applying the protein A-gold technique. J. Histochem. Cytochem. 1983, 31, 101–109. [Google Scholar] [CrossRef] [Green Version]
  27. Malatesta, M.; Furlan, S.; Mariotti, R.; Zancanaro, C.; Nobile, C. Distribution of the epilepsy-related Lgi1 protein in rat cortical neurons. Histochem. Cell Biol. 2009, 132, 505–513. [Google Scholar] [CrossRef] [PubMed]
  28. Hanlon, P.R.; Robbins, M.G.; Scholl, C.; Barnes, D.M. Aqueous extracts from dietary supplements influence the production of inflammatory cytokines in immortalized and primary T lymphocytes. BMC Complement. Altern. Med. 2009, 9, 51. [Google Scholar] [CrossRef] [Green Version]
  29. Liu, M.; Yasmeen, R.; Fukagawa, N.K.; Yu, L.; Kim, Y.S.; Wang, T.T.Y. Dose-Dependent Responses of I3C and DIM on T-Cell Activation in the Human T Lymphocyte Jurkat Cell Line. Int. J. Mol. Sci. 2017, 18, 1409. [Google Scholar] [CrossRef] [Green Version]
  30. Erba, D.; Riso, P.; Criscuoli, F.; Testolin, G. Malondialdehyde production in Jurkat T cells subjected to oxidative stress. Nutrition 2003, 19, 545–548. [Google Scholar] [CrossRef]
  31. Chkhikvishvili, I.; Sanikidze, T.; Gogia, N.; Mchedlishvili, T.; Enukidze, M.; Machavariani, M.; Vinokur, Y.; Rodov, V. Rosmarinic acid-rich extracts of summer savory (Satureja hortensis L.) protect Jurkat T cells against oxidative stress. Oxid. Med. Cell. Longev. 2013, 2013, 456253. [Google Scholar] [CrossRef] [Green Version]
  32. Kucinska, M.; Piotrowska, H.; Luczak, M.W.; Mikula-Pietrasik, J.; Ksiazek, K.; Wozniak, M.; Wierzchowski, M.; Dudka, J.; Jäger, W.; Murias, M. Effects of hydroxylated resveratrol analogs on oxidative stress and cancer cells death in human acute T cell leukemia cell line: Prooxidative potential of hydroxylated resveratrol analogs. Chem. Biol. Interact. 2014, 209, 96–110. [Google Scholar] [CrossRef]
  33. Chkhikvishvili, I.; Sanikidze, T.; Gogia, N.; Enukidze, M.; Machavariani, M.; Kipiani, N.; Vinokur, Y.; Rodov, V. Constituents of French Marigold (Tagetes patula L.) Flowers Protect Jurkat T-Cells against Oxidative Stress. Oxid. Med. Cell. Longev. 2016, 2016, 4216285. [Google Scholar] [CrossRef] [PubMed] [Green Version]
  34. Xie, H.; Tuo, X.; Zhang, F.; Bowen, L.; Zhao, W.; Xu, Y. Dietary cucurbitacin E reduces high-strength altitude training induced oxidative stress, inflammation and immunosuppression. An. Acad. Bras. Cienc. 2020, 92, e20200012. [Google Scholar] [CrossRef] [PubMed]
  35. Costanzo, M.; Boschi, F.; Carton, F.; Conti, G.; Covi, V.; Tabaracci, G.; Sbarbati, A.; Malatesta, M. Low ozone concentrations promote adipogenesis in human adipose-derived adult stem cells. Eur. J. Histochem. 2018, 62, 2969. [Google Scholar] [CrossRef]
  36. Larini, A.; Bocci, V. Effects of ozone on isolated peripheral blood mononuclear cells. Toxicol. In Vitro 2005, 19, 55–61. [Google Scholar] [CrossRef]
  37. Leveille, C.F.; Mikhaeil, J.S.; Turner, K.D.; Silvera, S.; Wilkinson, J.; Fajardo, V.A. Mitochondrial cristae density: A dynamic entity that is critical for energy production and metabolic power in skeletal muscle. J. Physiol. 2017, 595, 2779–2780. [Google Scholar] [CrossRef] [PubMed]
  38. Mailloux, R.J.; Jin, X.; Willmore, W.G. Redox regulation of mitochondrial function with emphasis on cysteine oxidation reactions. Redox Biol. 2014, 2, 123–139. [Google Scholar] [CrossRef] [Green Version]
  39. Madej, P.; Plewka, A.; Madej, J.A.; Plewka, D.; Mroczka, W.; Wilk, K.; Dobrosz, Z. Ozone therapy in induced endotoxemic shock. II. The effect of ozone therapy upon selected histochemical reactions in organs of rats in endotoxemic shock. Inflammation 2007, 30, 69–86. [Google Scholar] [CrossRef]
  40. Lintas, G.; Molinari, F.; Simonetti, V.; Franzini, M.; Liboni, W. Time and time-frequency analysis of near-infrared signals for the assessment of ozone autohemotherapy long-term effects in multiple sclerosis. Conf. Proc. IEEE Eng. Med. Biol. Soc. 2013, 2013, 6171–6174. [Google Scholar] [CrossRef] [Green Version]
  41. Cmarko, D.; Verschure, P.J.; Martin, T.E.; Dahmus, M.E.; Krause, S.; Fu, X.D.; van Driel, R.; Fakan, S. Ultrastructural analysis of transcription and splicing in the cell nucleus after bromo-UTP microinjection. Mol. Biol. Cell. 1999, 10, 211–223. [Google Scholar] [CrossRef] [Green Version]
  42. Fakan, S. Ultrastructural cytochemical analyses of nuclear functional architecture. Eur. J. Histochem. 2004, 48, 5–14. [Google Scholar]
  43. Cardinale, S.; Cisterna, B.; Bonetti, P.; Aringhieri, C.; Biggiogera, M.; Barabino, S.M.L. Subnuclear localization and dynamics of the pre-mRNA 3′ end processing factor CFIm68. Mol. Biol. Cell. 2007, 18, 1282–1292. [Google Scholar] [CrossRef] [PubMed] [Green Version]
  44. Itoh, K.; Wakabayashi, N.; Katoh, Y.; Ishii, T.; O’Connor, T.; Yamamoto, M. Keap1 regulates both cytoplasmic-nuclear shuttling and degradation of Nrf2 in response to electrophiles. Genes Cells 2003, 8, 379–391. [Google Scholar] [CrossRef] [PubMed]
  45. Loboda, A.; Damulewicz, M.; Pyza, E.; Jozkowicz, A.; Dulak, J. Role of Nrf2/HO-1 system in development, oxidative stress response and diseases: An evolutionarily conserved mechanism. Cell. Mol. Life Sci. 2016, 73, 3221–3247. [Google Scholar] [CrossRef] [Green Version]
  46. Morgan, D.A.; Ruscetti, F.W.; Gallo, R. Selective in vitro growth of T lymphocytes from normal human bone marrows. Science 1976, 193, 1007–1008. [Google Scholar] [CrossRef] [PubMed]
  47. Liao, W.; Lin, J.X.; Leonard, W.J. Interleukin-2 at the crossroads of effector responses, tolerance, and immunotherapy. Immunity 2013, 38, 13–25. [Google Scholar] [CrossRef] [Green Version]
  48. Asehnoune, K.; Strassheim, D.; Mitra, S.; Kim, J.Y.; Abraham, E. Involvement of reactive oxygen species in Toll-like receptor 4-dependent activation of NF-kappa B. J. Immunol. 2004, 172, 2522–2529. [Google Scholar] [CrossRef] [PubMed] [Green Version]
  49. Thimmulappa, R.K.; Lee, H.; Rangasamy, T.; Reddy, S.P.; Yamamoto, M.; Kensler, T.W.; Biswal, S. Nrf2 is a critical regulator of the innate immune response and survival during experimental sepsis. J. Clin. Investig. 2006, 116, 984–995. [Google Scholar] [CrossRef] [Green Version]
  50. Ahmed, S.M.; Luo, L.; Namani, A.; Wang, X.J.; Tang, X. Nrf2 signaling pathway: Pivotal roles in inflammation. Biochim. Biophys. Acta Mol. Basis Dis. 2017, 1863, 585–597. [Google Scholar] [CrossRef]
  51. Karatieieva, S.Y.; Semenenko, S.B.; Bakun, O.V.; Yurkiv, O.I.; Slobodian, K.V. Application of ozone therapy in surgical practice. Wiad. Lek. 2018, 71, 1076–1079. [Google Scholar] [PubMed]
  52. Manoto, S.L.; Maepa, M.J.; Motaung, S.K. Medical ozone therapy as a potential treatment modality for regeneration of damaged articular cartilage in osteoarthritis. Saudi.J. Biol. Sci. 2018, 25, 672–679. [Google Scholar] [CrossRef] [PubMed] [Green Version]
  53. Zeng, J.; Lu, J. Mechanisms of action involved in ozone-therapy in skin diseases. Int. Immunopharmacol. 2018, 56, 235–241. [Google Scholar] [CrossRef]
  54. Rowen, R.J.; Robins, H. Ozone Therapy for Complex Regional Pain Syndrome: Review and Case Report. Curr. Pain Headache Rep. 2019, 23, 41. [Google Scholar] [CrossRef] [Green Version]
  55. Martínez-Sánchez, G.; Schwartz, A.; Donna, V.D. Potential Cytoprotective Activity of Ozone Therapy in SARS-CoV-2/COVID-19. Antioxidants (Basel) 2020, 9, 389. [Google Scholar] [CrossRef] [PubMed]
  56. Scassellati, C.; Ciani, M.; Galoforo, A.C.; Zanardini, R.; Bonvicini, C.; Geroldi, C. Molecular mechanisms in cognitive frailty: Potential therapeutic targets for oxygen-ozone treatment. Mech. Ageing Dev. 2020, 186, 111210. [Google Scholar] [CrossRef] [PubMed]
  57. Wen, Q.; Chen, Q. An Overview of Ozone Therapy for Treating Foot Ulcers in Patients With Diabetes. Am. J. Med. Sci. 2020, 360, 112–119. [Google Scholar] [CrossRef]
  58. Doersch, K.M.; DelloStritto, D.J.; Newell-Rogers, M.K. The contribution of interleukin-2 to effective wound healing. Exp. Biol. Med. (Maywood) 2017, 242, 384–396. [Google Scholar] [CrossRef] [Green Version]
  59. Bocci, V. The case for oxygen-ozonetherapy. Br. J. Biomed. Sci. 2007, 64, 44–49. [Google Scholar] [CrossRef]
  60. Kushmakov, R.; Gandhi, J.; Seyam, O.; Jiang, W.; Joshi, G.; Smith, N.L.; Khan, S.A. Ozone therapy for diabetic foot. Med. Gas. Res. 2018, 8, 111–115. [Google Scholar] [CrossRef]
  61. Suh, Y.; Patel, S.; Kaitlyn, R.; Gandhi, J.; Joshi, G.; Smith, N.L.; Khan, S.A. Clinical utility of ozone therapy in dental and oral medicine. Med. Gas. Res. 2019, 9, 163–167. [Google Scholar] [CrossRef] [PubMed]
  62. Juchniewicz, H.; Lubkowska, A. Oxygen-Ozone (O(2)-O(3)) Therapy in Peripheral Arterial Disease (PAD): A Review Study. Ther. Clin. Risk Manag. 2020, 16, 579–594. [Google Scholar] [CrossRef] [PubMed]
  63. Voos, P.; Fuck, S.; Weipert, F.; Babel, L.; Tandl, D.; Meckel, T.; Hehlgans, S.; Fournier, C.; Moroni, A.; Rödel, F.; et al. Ionizing Radiation Induces Morphological Changes and Immunological Modulation of Jurkat Cells. Front. Immunol. 2018, 9, 922. [Google Scholar] [CrossRef] [PubMed] [Green Version]
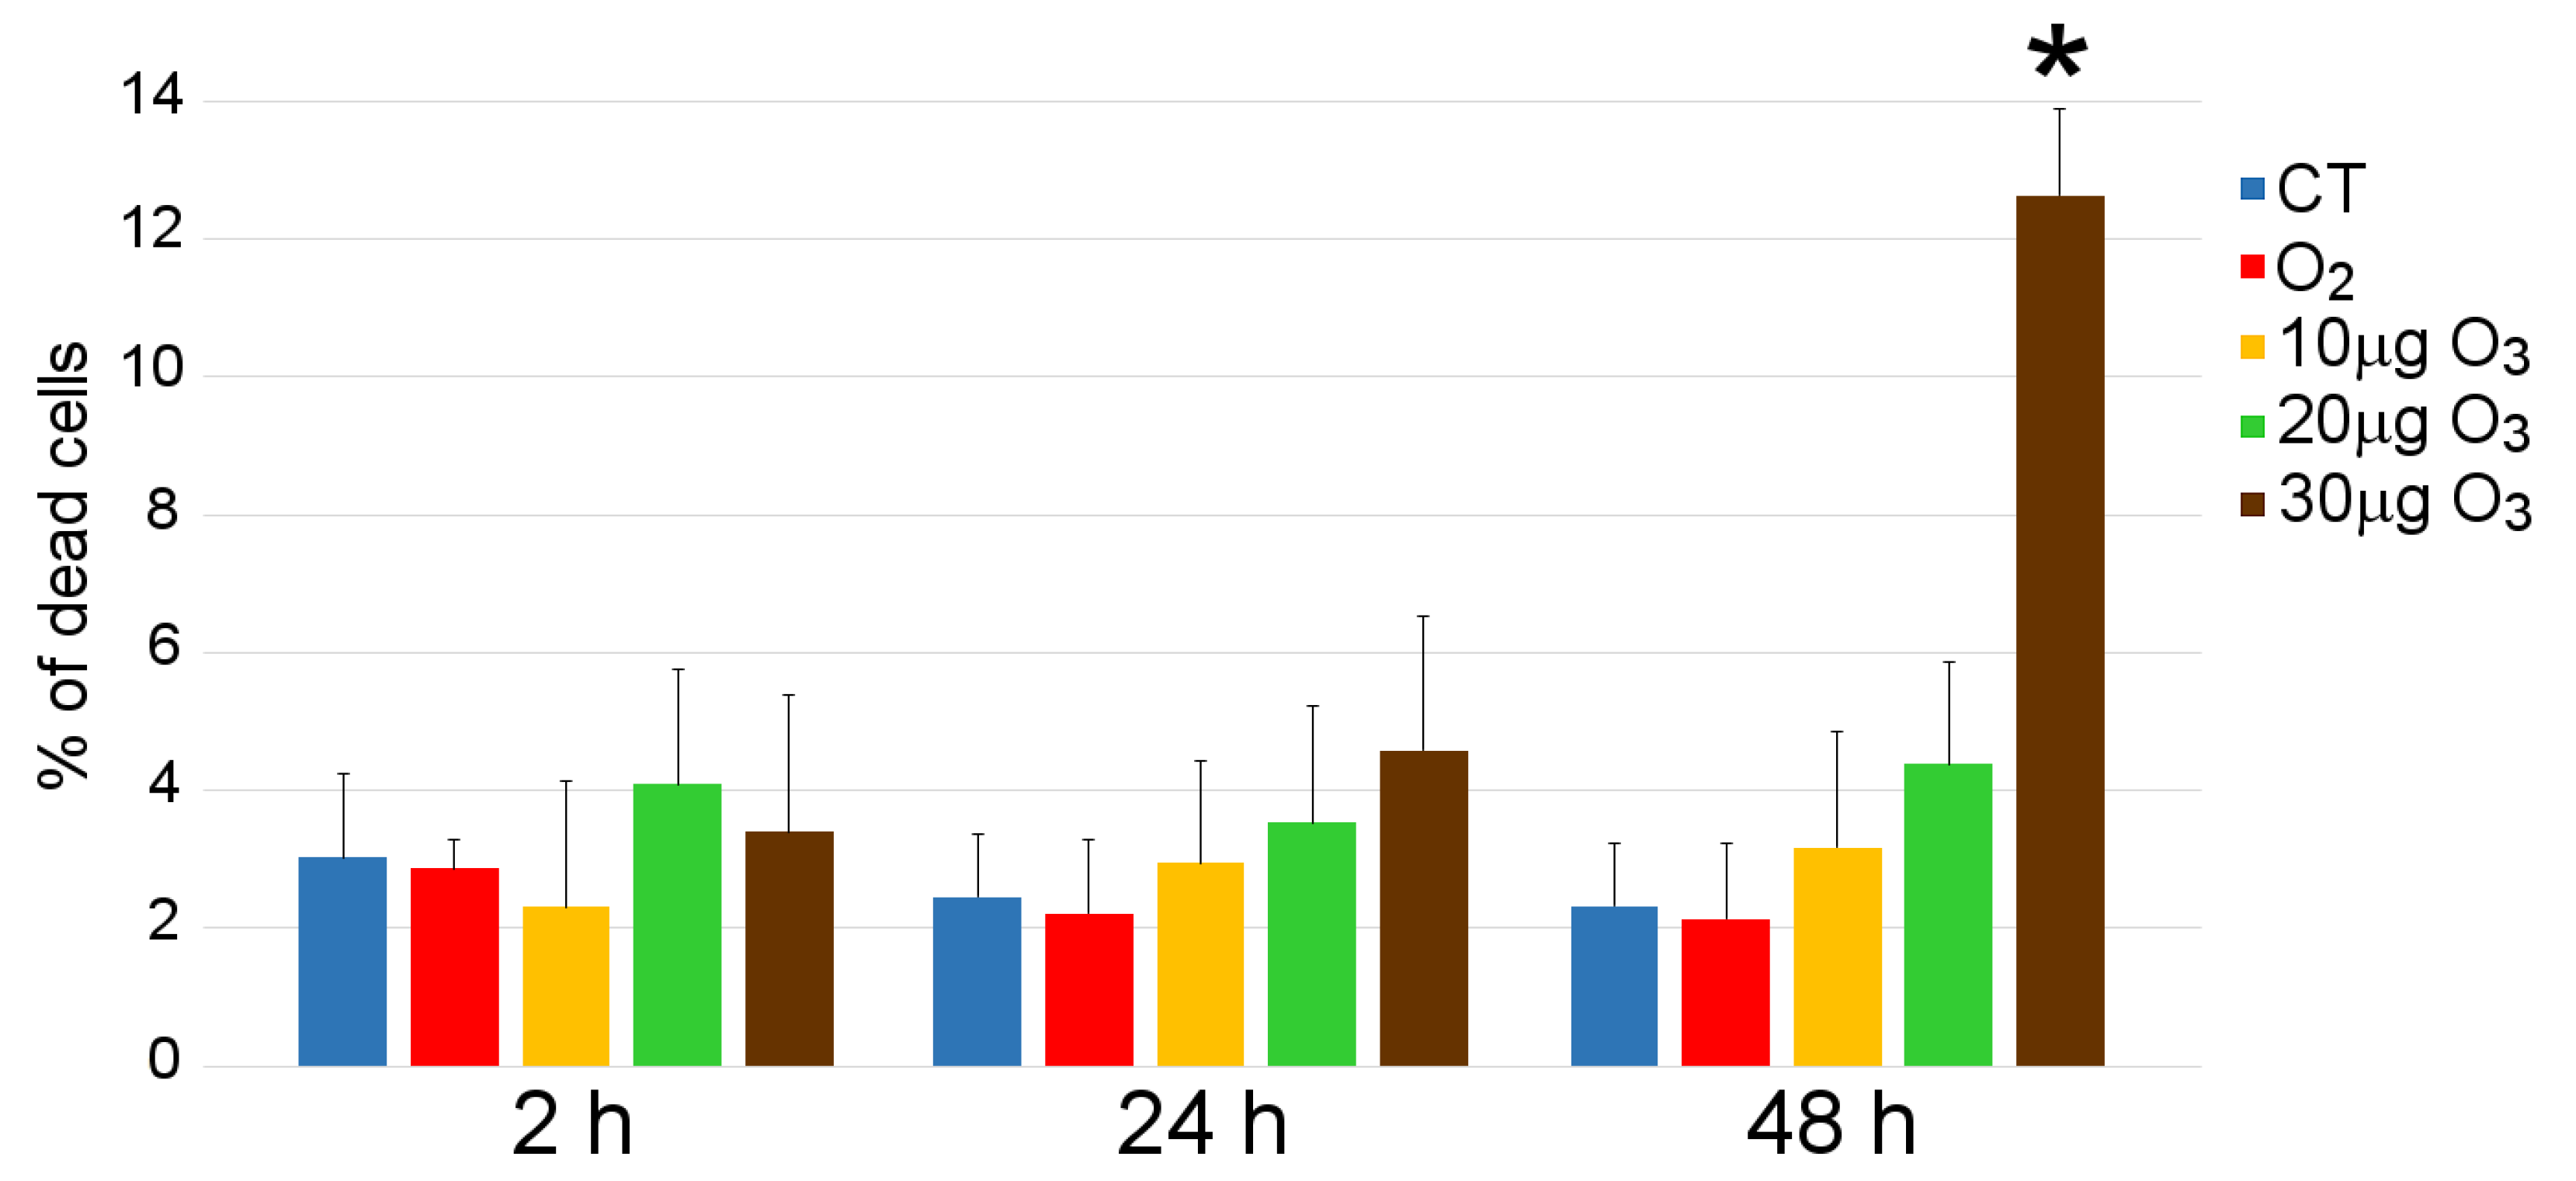
Figure 1. Diagrams show the mean value ± SD of percentage of dead cells in the samples after 2 h, 24 h, and 48 h from gas treatment. The asterisk (*) indicates significant difference with the respective control (CT).
Processes 09 01030 g001
Figure 2. Diagrams show the mean value ± SD of the number of viable Jurkat cells after 2 h, 24 h, and 48 h from gas treatment. The asterisks (*) indicate significant difference with the respective control (CT).
Processes 09 01030 g002
Figure 3. TEM micrographs of Jurkat cells after 24 h from treatment: control (a,a’), O2 (b,b’), 10 µg O3 (c,c’), 20 µg O3 (d,d’), 30 µg O3 (e,e’,f,g). Nucleus (N), mitochondria (asterisks), Golgi complex (arrowheads), endoplasmic reticulum (arrows). Note the cytoplasmic vacuolization in e, e’, and f. A necrotic cell is shown in (g). Bars: 1 µm (af); 500 nm (a’d’).
Processes 09 01030 g003
Figure 4. (ae) TEM micrographs of nuclear details from Jurkat cells after 24 h from treatment: control (a), O2 (b), 10 µg O3 (c), 20 µg O3 (d), 30 µg O3 (e). Immunogold labelling for Nrf2 is located at the periphery of heterochromatin clumps (stars). Bars: 200 nm. (f) Diagrams show the mean value ± SD of anti-Nrf2 labeling; asterisks (*) indicate significant difference (p < 0.001) with control (CT).
Processes 09 01030 g004
Figure 5. Gene expression of Hmox1 in Jurkat cells at 24 h post-treatment. CT: control.
Processes 09 01030 g005
Figure 6. Diagrams show the mean value ± SD of IL-2 amount detected in the medium of non-activated and activated cell samples after 24 h from gas treatment. Asterisks (*) indicate significant difference with the respective control (CT).
Processes 09 01030 g006
Figure 7. Diagrams show the mean value ± SD of percentage of dead cells in the PHA/PMA activated-cells samples after 2 h, 24 h, and 48 h from gas treatment. The asterisk (*) indicates significant difference with the respective control (CT).
Processes 09 01030 g007
Figure 8. Diagrams show the mean value ± SD of the number of viable PHA/PMA activated-Jurkat cells after 2 h, 24 h, and 48 h from gas treatment. The asterisk (*) indicates significant difference with the respective control (CT).
Processes 09 01030 g008
Publisher’s Note: MDPI stays neutral with regard to jurisdictional claims in published maps and institutional affiliations.