Article

Fundamental Understanding of Tea Growth and Modeling of Precise Tea Shoot Picking Based on 3-D Coordinate Instrument

1
College of Engineering, South China Agricultural University, Guangzhou 510642, China
2
College of Mathematics and Informatics, South China Agricultural University, Guangzhou 510642, China
*
Author to whom correspondence should be addressed.
Processes 2021, 9(6), 1059; https://doi.org/10.3390/pr9061059
Submission received: 4 May 2021 / Revised: 9 June 2021 / Accepted: 9 June 2021 / Published: 17 June 2021

Abstract

:
Tea is a popular beverage worldwide and also has great medical value. A fundamental understanding of tea shoot growth and a precision picking model should be established to realize mechanized picking of tea shoots with a small product loss. Accordingly, the terminal bud length (Lbud), tea stem length (Lstem), terminal bud angle (αbud), tea stem angle (αstem), and growth time (t) were considered as the key growth parameters; the sum of the vertical lengths of the terminal bud and stem (ξ), the picking radius (r), and the vertical length of the stem (Zstem) were considered as the picking indexes of the tea shoots. The variations in growth parameters with time were investigated using a 3-D coordinate instrument, and the relationships between the growth parameters and the picking indexes were established using an artificial neural network (ANN). The results indicated that the tea growth cycles for periods P1, P2, P3, P4, P5, and P6 were 14, 7, 6, 4, 4, and 6 d, respectively. A growth cycle diagram of the tea growth was established. Moreover, a 5-2-12-3 ANN model was developed. The best prediction of ξ, r, and Zstem was found with 16 training epochs. The MSE value was 0.0923 × 10⁻⁴, and the R values for the training, test, and validation data were 0.99976, 0.99871, and 0.99857, respectively, indicating that the established ANN model demonstrates excellent performance in predicting the picking indexes of tea shoots.

1. Introduction

Tea (Camellia sinensis O. Kuntz) belongs to the Camellia genus in the Dicotyledon class. It originated in southwest China and has become a popular beverage worldwide [1]. Tea can also be used in medicine, food, and industry. Tea polyphenols have antioxidant and antimutagenic effects and can effectively prevent cancer [2,3], resulting in their widespread use in medicine. Moreover, tea catechins can stimulate liver lipid catabolism and have a positive effect on diet-induced obesity (Murase et al., 2002); tea catechin products are popular in the food industry. In recent years, with an increase in the demand for tea, tea planting has also expanded. The quality of tea picking has become a key factor affecting its economic value [4].
Tea with one shoot with one leaf is often regarded as first-class tea; tea with one shoot with two leaves is regarded as second-class tea. The third and fourth classes are shown in Figure 1. Japan was the first country to conduct research on mechanized tea picking; tea picking and tea tree pruning using large scissors had been widely used [5]. Although mechanized picking is suitable for large-scale tea picking, the method is relatively rough and does not locate the tea picking area; a considerable number of leaves are broken, reducing their value. Thus, a fundamental understanding of tea growth is important for precision picking.
In recent decades, extensive research on the characteristics of tea shoots has been conducted to obtain a corresponding growth model. Takashi (1962) conducted morphological studies on the development of tea shoots as early as 1960 [6]; he found that there were many lateral buds on a long branch, and most young leaves were in the upper part of the branch. Sanui (1965) recorded lateral shoot differentiation data and the development of tea shoots in summer and further studied the morphology of tea shoot development [7]. To better harvest tea with scissors, Nakayama (1967) studied the vertical distribution of tea shoots and found that lateral buds had unique growth characteristics [8]; they grow at low positions and are inhibited by terminal buds. Based on this analysis, the morphological differences of tea shoots in different seasons are significant. Harada (1960) planted potted, young tea trees in greenhouses at temperatures of 5–35 °C to determine the factors influencing tea shoot development and further studied the development morphology and growth model of the tea shoots [9]. The results showed that the tea shoots germinated at 12.5 °C, and the growth rate reached the maximum value at 27.5 °C. The temperature had a smaller influence on the shoot length between 27.5 and 35 °C [10]. However, many problems remain if the temperature is the only variable used for tea shoot prediction.
Many researchers have extensively considered other variables affecting tea shoot prediction accuracy. Koichi (1988) and Takezawa (1994) improved the prediction accuracy of tea shoot growth at different temperatures using water as a variable [11,12]. Although there are many factors affecting the development of tea shoots, and the same batch of tea shoots differs in morphology, growth is generally similar in the same environment, which can provide a reference for follow-up research. To eliminate the influence of temperature and water on tea shoot development, Takayuki (1999) and Jayasinghe (2018) introduced growth time as a variable to investigate the variation in tea shoot growth over time in a natural environment [13,14]. Jayasinghe established models for predicting the leaf area and fresh weight of tea shoots at different development stages and locations. The results demonstrated that the models were in good agreement with the measured values at the validation stage (R2 > 0.92 for the leaf area model and R2 > 0.98 for the fresh weight model), indicating that predicting the growth of tea shoots in the same environment considering growth time was relatively accurate. Similar findings have been reported for other plant growth, including rice yield [15], maize and soybean yield [16], and crop harvest date [17].
These studies have produced a relatively accurate tea shoot growth model. With technological innovation, an increasing number of researchers have developed more accurate plant growth models using advanced equipment. Bernotas et al. [18] studied the growth structure of Arabidopsis thaliana under different conditions using a low-cost portable three-dimensional (3-D) plant phenotypic platform (PS-Plant) based on photometric stereo imaging technology. The results demonstrated that PS-Plant is a powerful phenotypic tool that can accurately predict the spatial structure of plants during different growth periods. Bengocheaguevara et al. [19] developed a crop detection system using RGB-D sensors that automatically created accurate 3-D models (color point clouds) of woody crops. Golbach et al. [20] constructed a 3-D imaging space using ten cameras to produce 3-D imaging of a single tomato plant; the leaf length, width, area, and stem length were also obtained. Li et al. [21] introduced time analysis into inexpensive portable 3-D acquisition equipment to analyze plant growth from 4-D point cloud data. The research included detection and quantification of specific growth events (such as sprouting and branching) and further tracking their evolution over time. In another study, a laser scanner system was used to obtain the 3-D structural characteristics of vines [22]. These modeling methods must scan the entire plant, producing a large amount of original data. Partial data must be extracted from the original data when specific points are required for analysis, which increases the data processing difficulty. Whitfield et al. [23] quantitatively described the architectural characteristics (length, width, and angle) of individual tobacco plants using a spatial coordinate instrument; accurate leaf orientation distributions were ascertained by combining an ellipsoid model and the Fisher distribution. Sinoquet et al. [24] used ultrasonic and electromagnetic devices to conduct 3-D digitization of the canopy; architectural characteristics (length, width, and angle) of the canopy were obtained at each leaf position. Although these methods require point-by-point measurement, field operation is simple. In addition, the 3-D space coordinates of the target point can be obtained directly without damage. A method combining 3-D space coordinate technology with growth time analysis may be an effective means of predicting the growth of tea shoots in different growth periods.
An artificial neural network (ANN) is an anthropomorphic training method that is simple to use, especially in processing a large amount of data. Wu et al. [25] used a probabilistic neural network (PNN) combined with image and data processing technology to automatically identify leaves for plant classification. Twelve leaf features were extracted and orthogonalized into five principal variables used as the input neurons of the PNN. The PNN was trained with 1800 leaves to classify 32 types of plants; the results demonstrated a classification accuracy greater than 90%. Considering the wheat yield, associated plantation area, rainfall, and temperature as the input neurons, Guo et al. [26] established an ANN model for predicting wheat yield; the results demonstrated that the ANN model was highly reliable. Kucukonder et al. [27] aimed to develop the best leaf area estimation model for tomato plants grown in a plastic greenhouse. The ANN methodology and regression analysis were used to estimate the leaf area using the leaf width and leaf length as the key variables. The statistical indices of the ANN model (R2 = 0.96, RMSE = 3.30, MAE = 1.94, and MAPE = 0.05) were lower than those of the regression model (R2 = 0.92, RMSE = 4.71, MAE = 3.31, and MAPE = 0.08), indicating a better prediction performance than that of the regression model. Hu et al. [28] presented a photosynthetic rate model of a heuristic neural network for tomatoes based on a genetic algorithm. The test results showed that the training effects and accuracy of the genetic neural network prediction of the photosynthetic rate were good; the correlation coefficient between the predicted data and the measured data was 0.987, and the absolute error of the photosynthetic rate was less than ±0.5 μmol/(m2·s). Green et al. [29] presented a spatial analysis neural network (SANN) algorithm combined with topographic attributes as explanatory variables for joint spatial interpolation and yield prediction. The results indicated the utility of SANN with topographic attributes containing implicit soil and water information for estimating the spatial patterns of dryland crop yield. From the analysis, the ANN methodology is an accurate and fast artificial intelligence algorithm for crop morphology and yield prediction and can be used for tea shoot growth prediction.
To realize precise picking mechanization for tea shoots, a fundamental understanding of tea shoot growth and a corresponding prediction model are necessary. This study focuses on the growth rule of tea shoots, applying a 3-D coordinate instrument to monitor key indices including terminal bud length (Lbud), stem length (Lstem), terminal bud angle (αbud), and stem angle (αstem) in different growth periods. The ANN methodology was applied to establish the growth rule prediction model considering Lbud, Lstem, αbud, αstem, and growth time (t) as the input neurons, and the sum of the vertical length of the shoot and stem (ξ), the picking radius (r), and the vertical length of the stem (Zstem) as the output neurons. This study intends to establish a fundamental basis for guiding practical tea picking and the design of a precise picking machine.

2. Materials and Methods

2.1. Sample Preparation

The experiment was conducted on 102 Yinghong #9 potted tea trees planted in the tea garden of the North building of the Engineering College of South China Agricultural University (longitude 113.3456°, latitude 23.1587°). The height of the tea trees ranged from 0.9 to 1 m; the five-year-old trees were planted in full light. To reduce interference caused by uncontrollable factors, the tea trees were uniformly managed in terms of watering and fertilization during the data acquisition period. Tea shoots with one shoot and three intact leaves were used in the experiment.

2.2. Testing Apparatus

According to Tang et al. [30], the quality of picking is an important factor affecting the value of the tea; the location of the picking point is the decisive factor in the picking quality [31]. Thus, this study used a 3-D coordinate instrument to measure the spatial coordinates of tea shoots. The device was purchased from Polhemus and consisted of a system electronic unit (SEU), a power supply, a sensor, a transmitter, and a computer, as shown in Figure 2. The testing accuracy within a circular area with a radius of 2 m was 0.1 mm. A handheld anemometer (Xima AS836) was used to measure the wind speed.

2.3. Data Acquisition

Data was collected from 1 March to 23 October 2020 in the open roof tea garden with sufficient light. A total of 46 sets of data were collected during the experiment, between 7:00 and 11:00 a.m. Each set of data was measured three times, and the average value was used for calculation. To ensure the validity of the data and reduce the disturbance caused by wind, the data were recorded when the wind speed was at level 0 (0.0–0.2 m/s).

2.4. Biometric Analysis

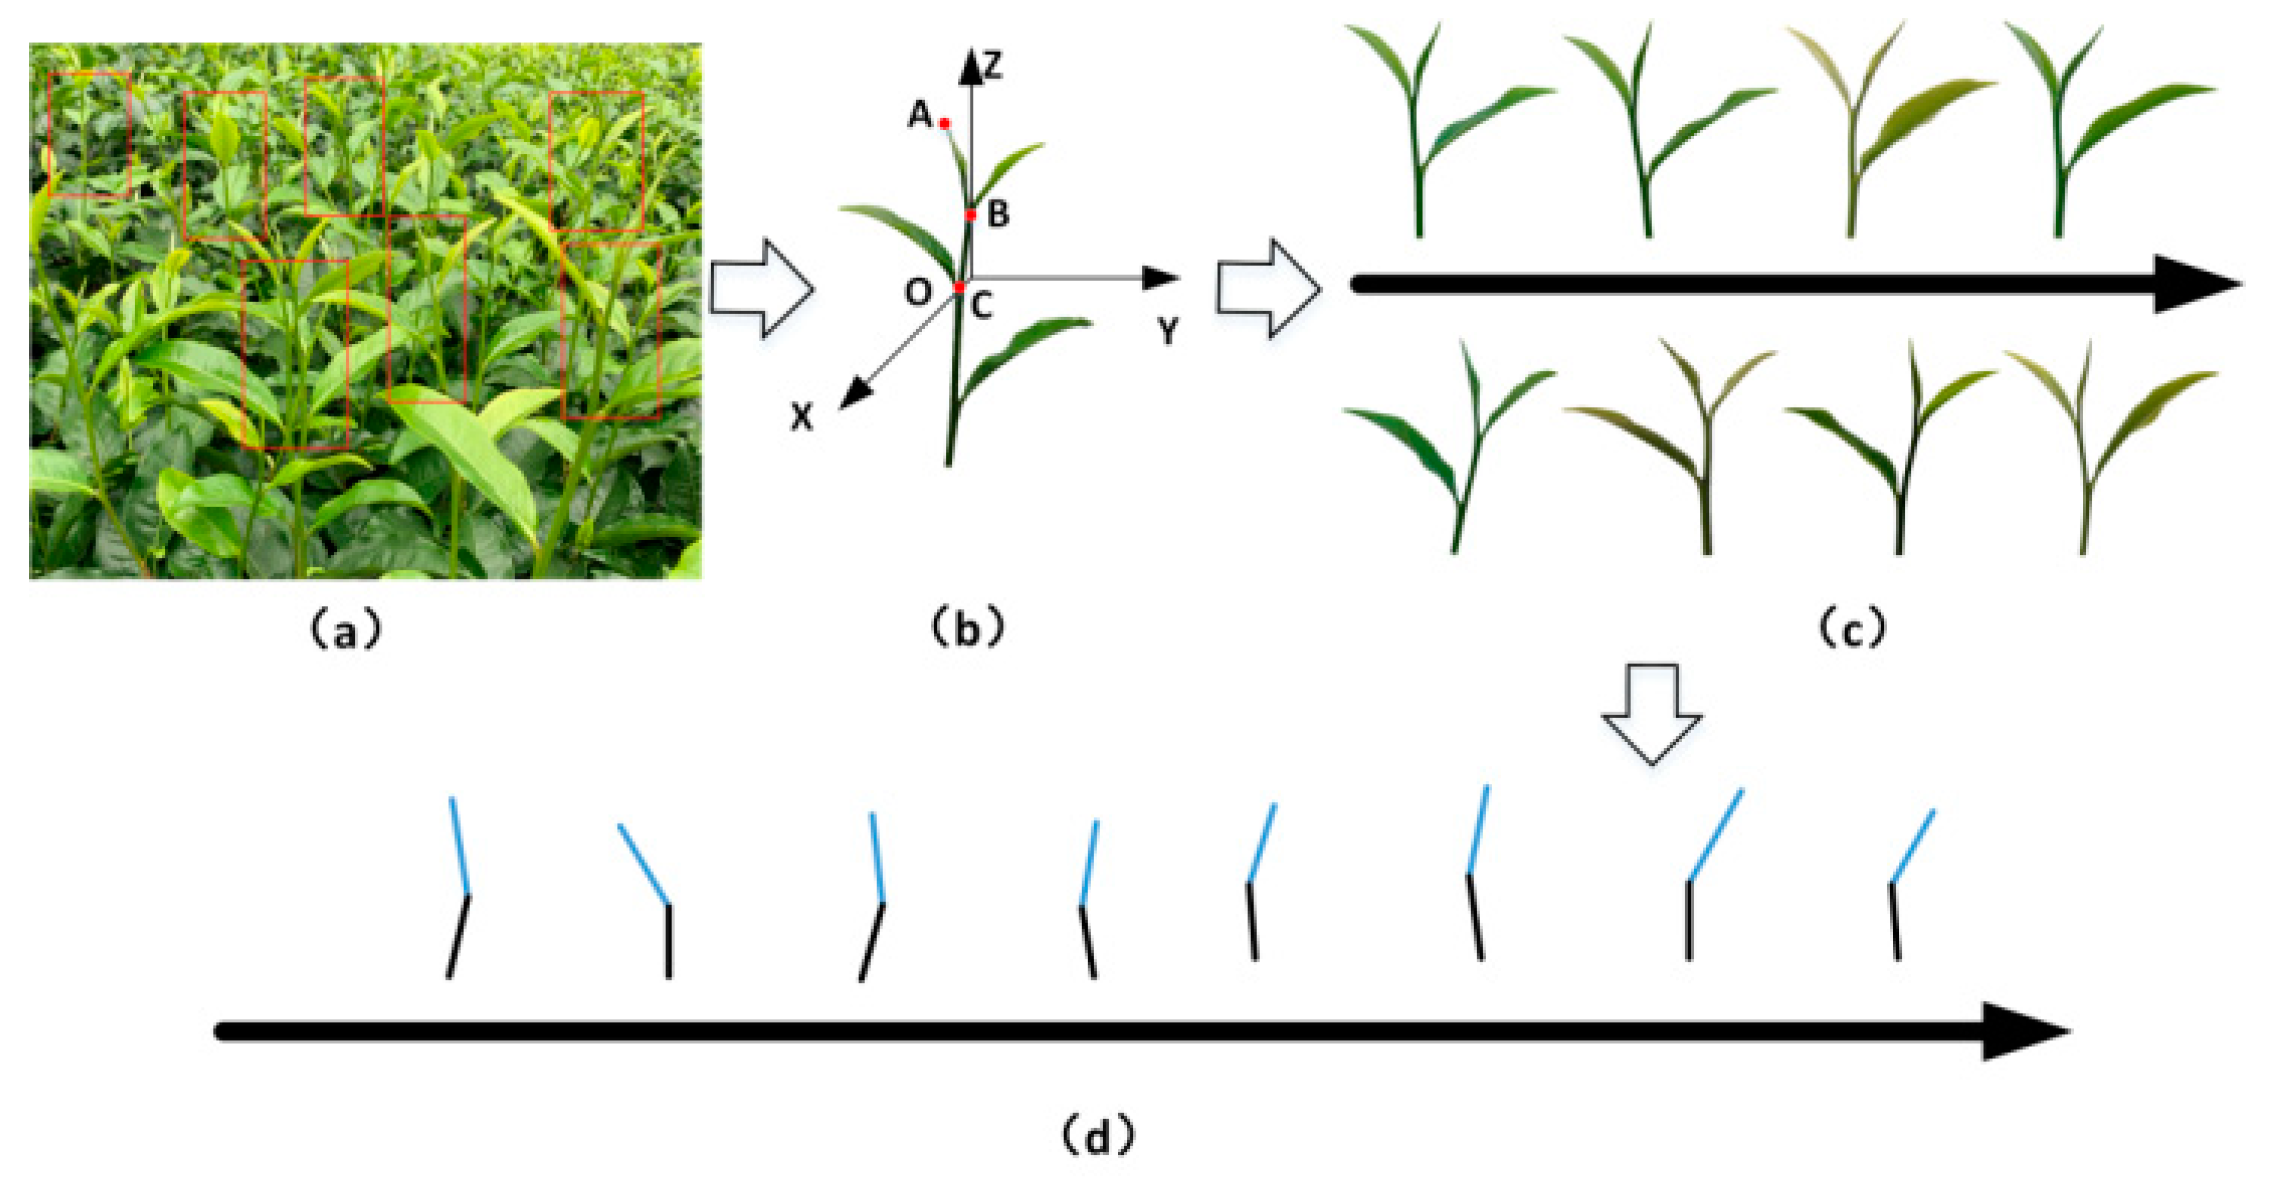
The biological characteristics of the abstract structure of Yinghong #9 tea shoots are shown in Figure 3. The physical characteristics of the tea shoots are unusual; a reasonable statistical method should be used. The main indexes for tea picking are Lbud, Lstem, αbud, and αstem, which are important biological characteristics of tea shoots. These indexes are important in designing the shape and response time of the end-effector.
As shown in Figure 3, the variation trends of the length and inclination angle for the stem internode and terminal bud are different in different growth periods. As reported by [30], one shoot with one leaf is one type of tea grading. From the morphological description of tea shoots, the terminal bud of the previous growth period differentiates into the terminal bud and leaf of the next growth period after a period of incubation and varies with the seasons. Normally, without human intervention, the branches circulate until the tea shoots become folium dichotomous, which marks the end of the branching process [32]. According to the branching process, the tea picking period is between Figure 4a,c. To obtain sufficient yield in actual production, experienced workers often pick in the late stage of one shoot with three leaves (late period c).

2.5. Experimental Plan

The development of tea shoot branching is not uniform owing to different planting environments and pruning methods. Accordingly, in this study, light pruning was performed after each picking to reduce the differences between individual tea shoots. Light pruning can also stimulate the germination of tea shoots, relieve the suppression of the side shoots by the top shoots, keep the crown surface flat, and adjust the number and thickness of production branches. In this study, the Yinghong #9 growing data in spring, summer, and autumn were collected. Generally, spring, summer, and autumn teas can be picked twice, three times, and once, respectively, owing to the hot weather in Guangdong. According to the actual tea picking conditions in 2020, the coordinate data corresponding to the period of one shoot with three leaves (Figure 4c) 2 March–15 March (P1), 2 May–9 May (P2), 19 June–25 June (P3), 15 July–19 July (P4), 18 August–22 August (P5), and 16 September–23 October (P6) were collected. To obtain the growth characteristics of the entire process for autumn tea shoots (from dormant to the picking period of one shoot with three leaves), the data were recorded immediately after pruning. The detailed experimental plan is presented in Table 1.

3. Model Establishment

3.1. Key Parameters for Mathematical Model of Precision Tea Picking

To establish a mathematical model of precision tea picking, the terminal buds of the tea shoots shown in Figure 5 were abstracted into spatial line AB; the spatial coordinates of points A and B were determined to be (Xa, Ya, Za) and (Xb, Yb, Zb), as shown in Figure 5a. Point B was translated to axis Y, and the spatial coordinates of point B became (0, Yb, Zb). The sets for different terminal buds are shown in Figure 5b. Point B was translated to the intersection of the X and Z axes, as shown in Figure 5c. Different terminal bud points (Bi) were translated following the same method; the sets of abstract lines are summarized in Figure 5d. From a spatial perspective, all of the terminal buds are clustered. Based on the analysis, a plane π was constructed to minimize the sum of the deviations from point set A to the π plane.
Similarly, a mathematical model for tea shoot picking can be obtained by analyzing and combining the BC segment of the stem, as shown in Figure 5e. The sum of the vertical lengths of terminal buds and stems is an important index for picking. The vertical length of the stem is regarded as a potential picking area and is directly related to whether the picked shoots have one shoot with one leaf. In theory, a longer Zstem indicates a greater probability of one shoot with one leaf being picked. Based on the statistics, it was found that the length and deflection angle of the terminal bud was always greater than those of the stems. Thus, the projection distance of the terminal bud was greater than that of the stem in the horizontal plane and is regarded as the picking radius. To protect the main body of the shoots during the picking process, r is also an important parameter in the subsequent design of the end-actuator. The key parameters in the precision tea picking model were determined to be ξ, Zstem, and r.

3.2. Multivariate Least Squares Linear Regression Analysis to Analyze Parameters

It is assumed that there are n points of P j ( x j , y j , z j ) , j = 1 , 2 , 3 , n (position of node B). A plane π( Z ξ = A x + B y ) was determined to minimize the sum of the deviations from the point sets of Pj to π. Accordingly, the problem can be transformed into the following optimization problem:
( A , B , ξ ) = arg min j = 1 n ( A x j + B y j + ξ z j ) 2 ( A , B , ξ ) R 3
f ( x , y , ξ ) = j = 1 n ( A x j + B y j + ξ z j ) 2
After finding the stagnation point, the system can be solved.
{ f A = 2 j = 1 n ( A x j + B y j + ξ z j ) x j = 0 f B = 2 j = 1 n ( A x j + B y j + ξ z j ) y j = 0 f ξ = 2 j = 1 n ( A x j + B y j + ξ z j ) 1 = 0
{ A j = 1 n x j 2 + B j = 1 n x j y j + ξ j = 1 n x j = j = 1 n x j z j A j = 1 n x j y j + B j = 1 n y j 2 + ξ j = 1 n y j = j = 1 n z j y j A j = 1 n x j + B j = 1 n y j + n ξ = j = 1 n z j
X = ( x 1 , x 2 , x n ) , Y = ( y 1 , y 2 , y n ) , Z = ( z 1 , z 2 , z n ) ,
X = 1 n j = 1 n x j , Y = 1 n j = 1 n y j , Z = 1 n j = 1 n z j ,
X , X = j = 1 n x j 2 , X , Y = j = 1 n x j y j , X , Z = j = 1 n x j z j , Y , Y = j = 1 n y j 2 , Y , Z = j = 1 n y j z j
{ X , X A + X , Y B + n X ξ = X , Z X , Y A + Y , Y B + n Y ξ = Z , Y n X A + n Y B + n ξ = n Z
Z ξ = A x + B y
Thus,
z j = ξ + A x j + B y j
Equation (10) is the regression plane, which can be solved by substituting the values of (xj, yj) to obtain
z j = ξ + A x j + B y j
When the plane is parallel to the ground, the problem can be simplified as
ξ = arg min j = 1 n ( ξ z j ) 2 ( ξ ) R
f ( ξ ) = j = 1 n ( ξ z j ) 2
d f d ξ = 2 j = 1 n ( ξ z j ) 1 = 0
ξ = z 1 + z 2 + + z n n = z ¯
Node A produces the value closest to the observed value.
Plane π may not be parallel to the ground, which may be a key issue in practical production. To simplify, plane π was assumed to be parallel to the ground, and the picking actuator was perpendicular to the ground. The algorithm represents the derivation process for the entire tea bud picking plane. Based on the algorithm, the picking length of tea shoots in each period can be calculated, and several important parameters can be obtained. The following equations can be obtained by combining the picking model shown in Figure 5.
L b u d = ( X b X c ) 2 + ( Y b Y c ) 2 + ( Z b Z c ) 2
L s t e m = ( X a X b ) 2 + ( Y a Y b ) 2 + ( Z a Z b ) 2
Z b u d = | Z a Z b |
Z s t e m = | Z b Z c |
r = L b u d 2 Z b u d 2
α b u d = arg cos Z b u d L b u d
α s t e m = arg cos Z s t e m L s t e m
where Lbud, αbud, and Zbud are the actual length, inclination angle, and vertical length of the terminal bud, respectively; Lstem, αstem, and Zstem are the actual length, inclination angle, and vertical length of the stem, respectively; r is the projection distance of the terminal bud on the horizontal plane.
Using this method, we processed the original data in Table 1 to obtain the tea shoot parameters. Partial experimental data are presented in Table 2.

3.3. ANN Modeling for Precise Tea Picking Prediction

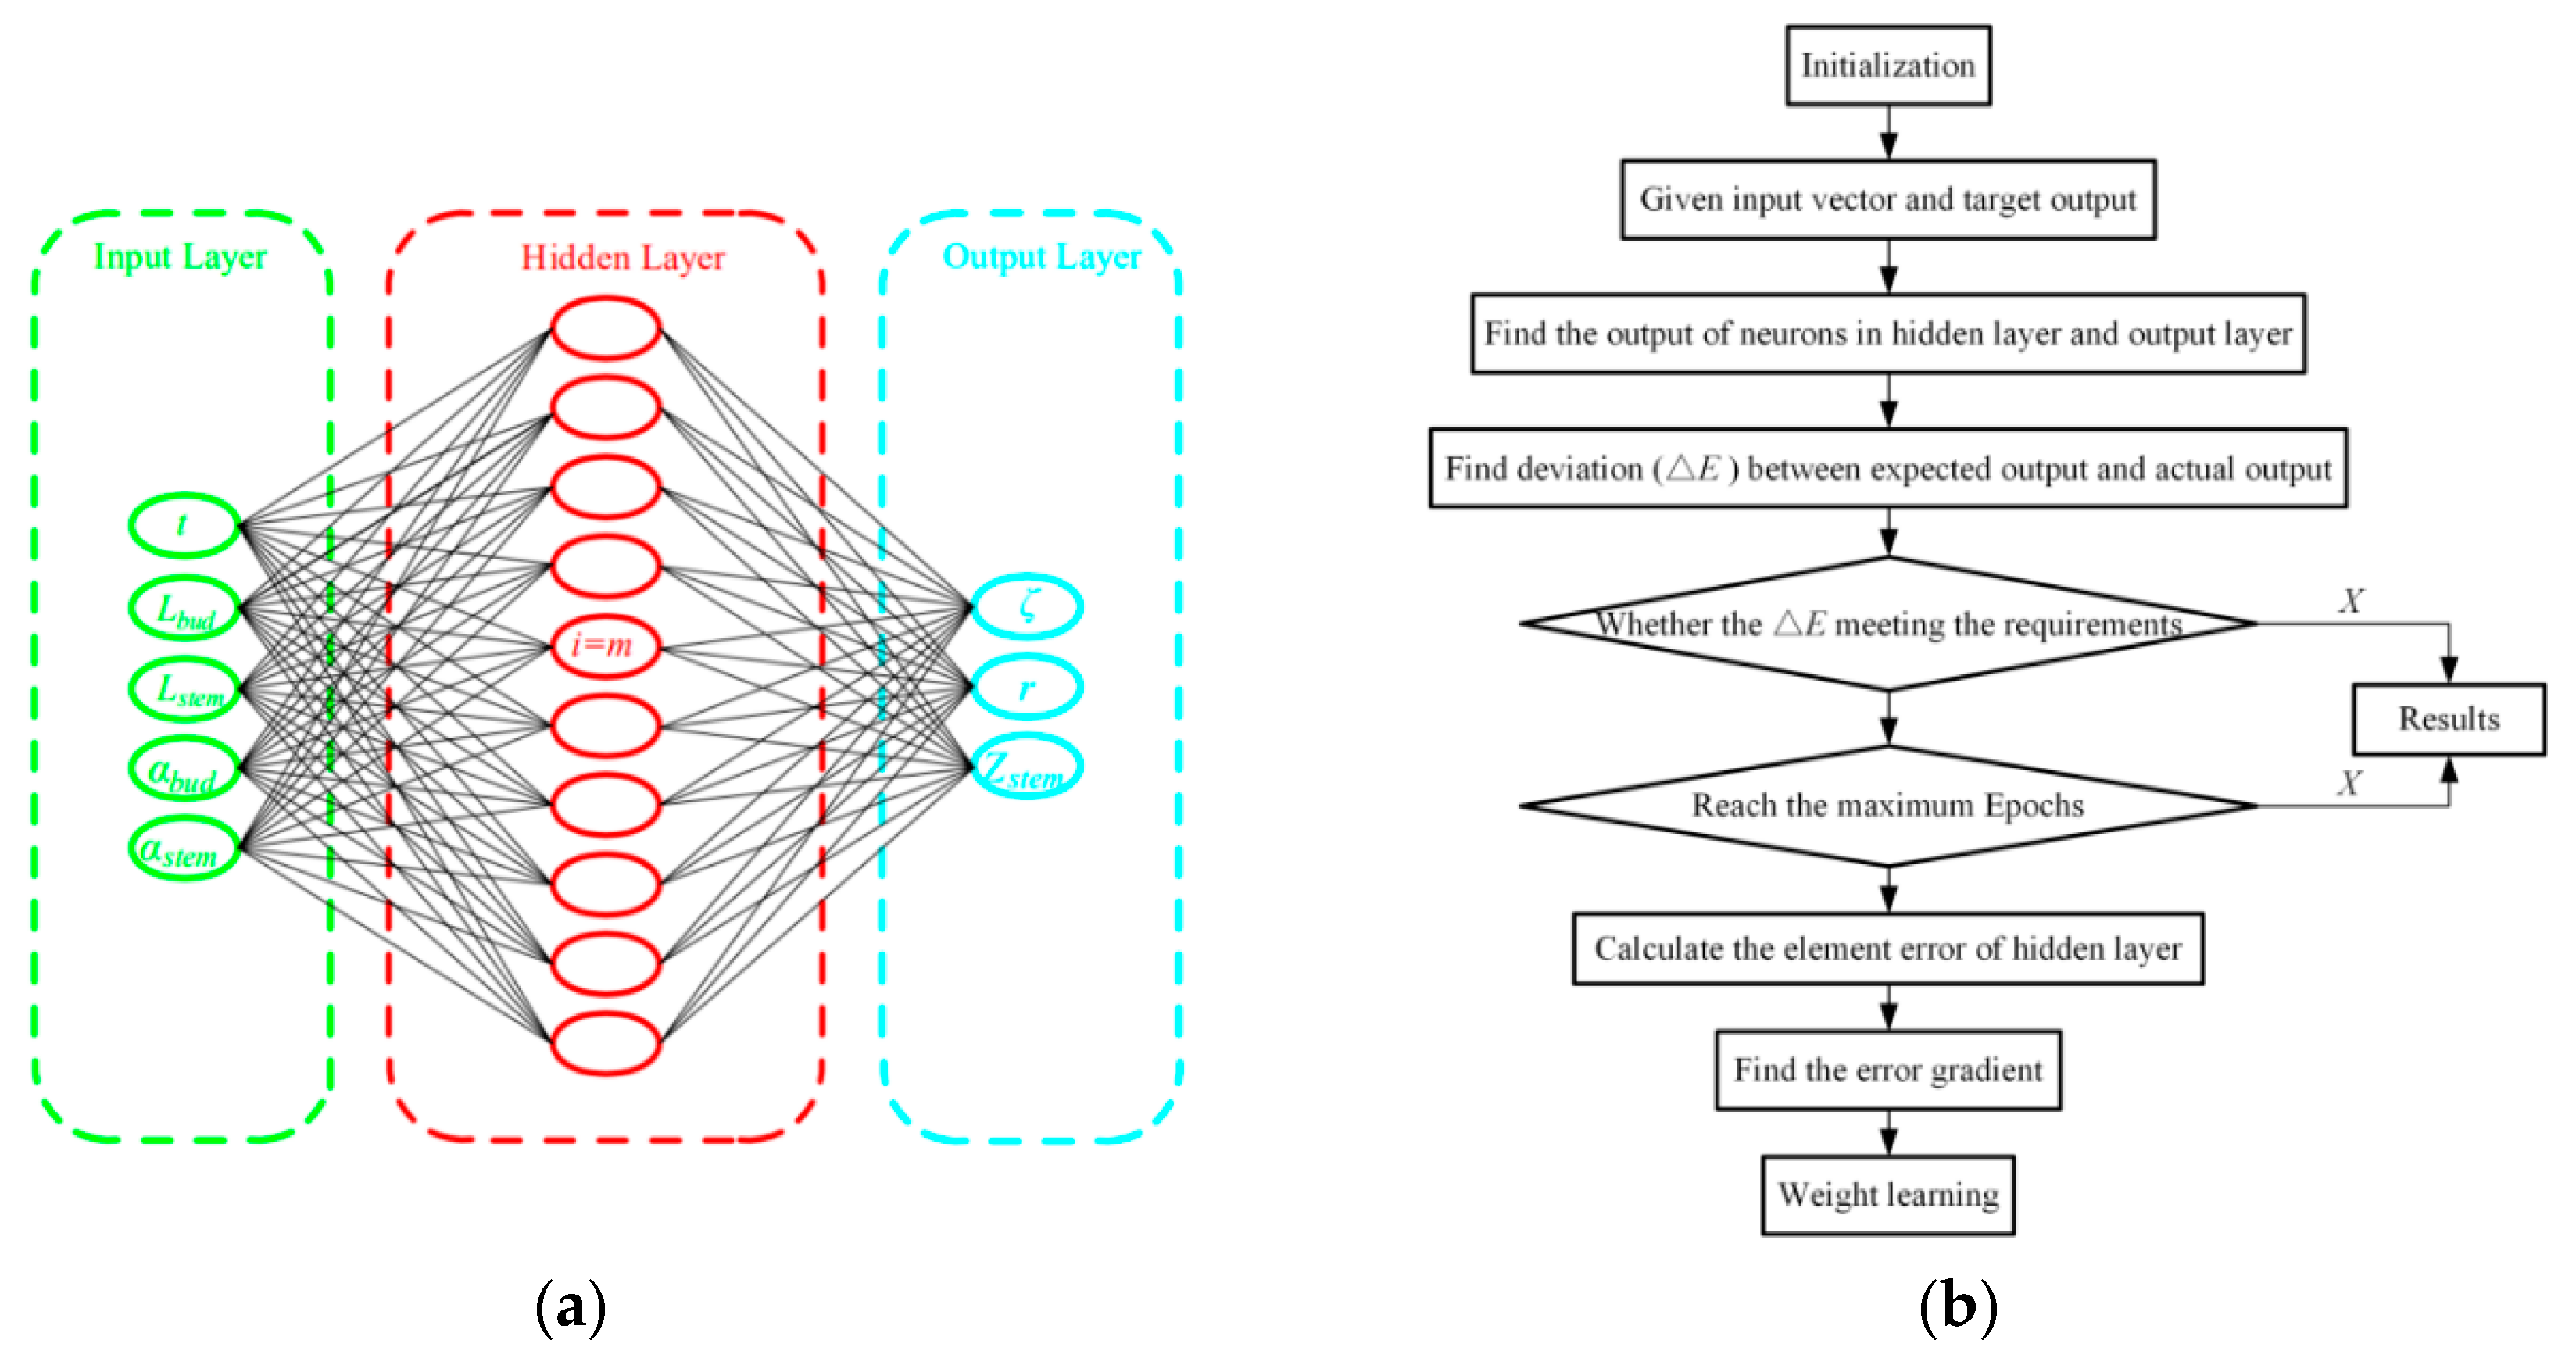
To investigate the relationships between the key growth parameters (Lbud, Lstem, αstem, αbud, t) of the tea, and the picking indexes (ξ, r, and Zstem), a feed-forward backprop artificial neural network model was established; the key parameters of the model can be determined through the following steps.

3.3.1. Input and Output Layer Neurons

Based on the analysis, Lbud, Lstem, αbud, αstem, and t were considered as the input neurons of the ANN model; ξ, r, and Zstem were considered as the output neurons. Accordingly, there were four input and three output layers.

3.3.2. Hidden Layer Neurons

The number of hidden layers directly affects the training accuracy of the ANN model. According to Dai et al. [33], the number of hidden layers of an ANN model can be determined by the following equation:
m = a + b + k
where m is the number of hidden layer neurons; a is the number of input layer neurons, which was five, as shown in Figure 6a; b is the number of output layer neurons, which was three; k is a constant between 1 and 10. Accordingly, m can be calculated to be in the range of 3–13.

3.3.3. Transfer and Train Function

The Tansig function provides a good tradeoff for neural networks, where speed is important, and the exact shape of the transfer function is not [34]. The Tansig function was used as the transfer function. The Levenberg–Marquardt algorithm was applied as the training function for the ANN model because it has a fast gradient descent and meets the error requirement with fewer epochs [35].

3.3.4. Physical Structure of Model

Based on the analysis, the established ANN and the corresponding training process are summarized in Figure 6b.

3.3.5. Key Training Parameters of the ANN Model

Scientifically, an ANN model should ascertain the number of neurons in the input and outlet layers and the number of hidden layers but should also determine the training parameters of the model, including the number of hidden neurons, momentum coefficients, and training epochs. According to Reed, R. D [36], for a simple dataset, one or two hidden layers are usually enough. Accordingly, the present work considers the number of hidden layers is in the range of 1–3. The momentum coefficient and training epochs are usually no more than 0.4 and 1500, respectively, as recommended by Chokphoemphun, S. et al. [37] and Zeng, Z. et al. [38], accordingly, the ranges of momentum coefficient and training epochs are ascertained to be in the ranges of 0.1–0.4 and 300–1500, respectively. Based on the analysis in Section 3.3.1 and Section 3.3.2, the configuration of the ANN model can be summarized, as shown in Table 3.
In order to ascertain the architecture of the ANN model, the parameters in Table 3 are tuned by training the 134 sets of experimental data. The mean squared error (MSE) is adopted to evaluate the training results.

3.3.6. Statistical Analysis

The predictive performance of the established ANN model was estimated using statistical indexes including the coefficient of determination (R2), the mean squared error (MSE), and the mean absolute error (MAE), which can be calculated using Equations (24)–(26), respectively [39].
R 2 = 1 i = 1 n ( α i β i ) 2 / i = 1 n ( α ¯ β i ) 2
M S E = 1 n i = 1 n ( α i β i ) 2
M A E = 1 n i = 1 n ( | α i β i | )
where n is the number of data points; αi is the i-th experimental result; βi is the i-th result predicted by the ANN model.

4. Results and Discussion

4.1. Variation Rules for Lbud, Lstem, and ξ with Growth Time for Different Periods

To ascertain the variation rules of the picking indexes with growth time, the interval time between two adjacent terminal bud branches was considered as the growth cycle of the tea shoots. The variations in Lbud, Lstem, and ξ with t for different periods are shown in Figure 7; the growth cycles of the tea shoots are different for different periods. The growth cycles of P1, P2, P3, P4, P5, and P6 were 13, 7, 6, 4, 4, and 6 d, respectively. Although the tea shoot growth cycle was significantly affected by seasonal differences, the change rate of Lstem for all periods was essentially the same. The growth rates of Lbud, Lstem, and ξ for P2, P3, and P6 were significantly reduced near the end of the growth cycle, as shown in Figure 7b,c,f. Liu et al. [35] reported that the terminal bud in the next growth cycle must be inoculated in advance for the nutrients in the terminal bud to be consumed, which may explain the growth cycle changes. It was found that Lbud is larger than Lstem in each period; the tea shoots sorted by length in descending order for different periods are represented by: P1, P2, P3, P6, P4, and P5.

4.2. Variation Rules for αbud and αstem with Growth Time for Different Periods

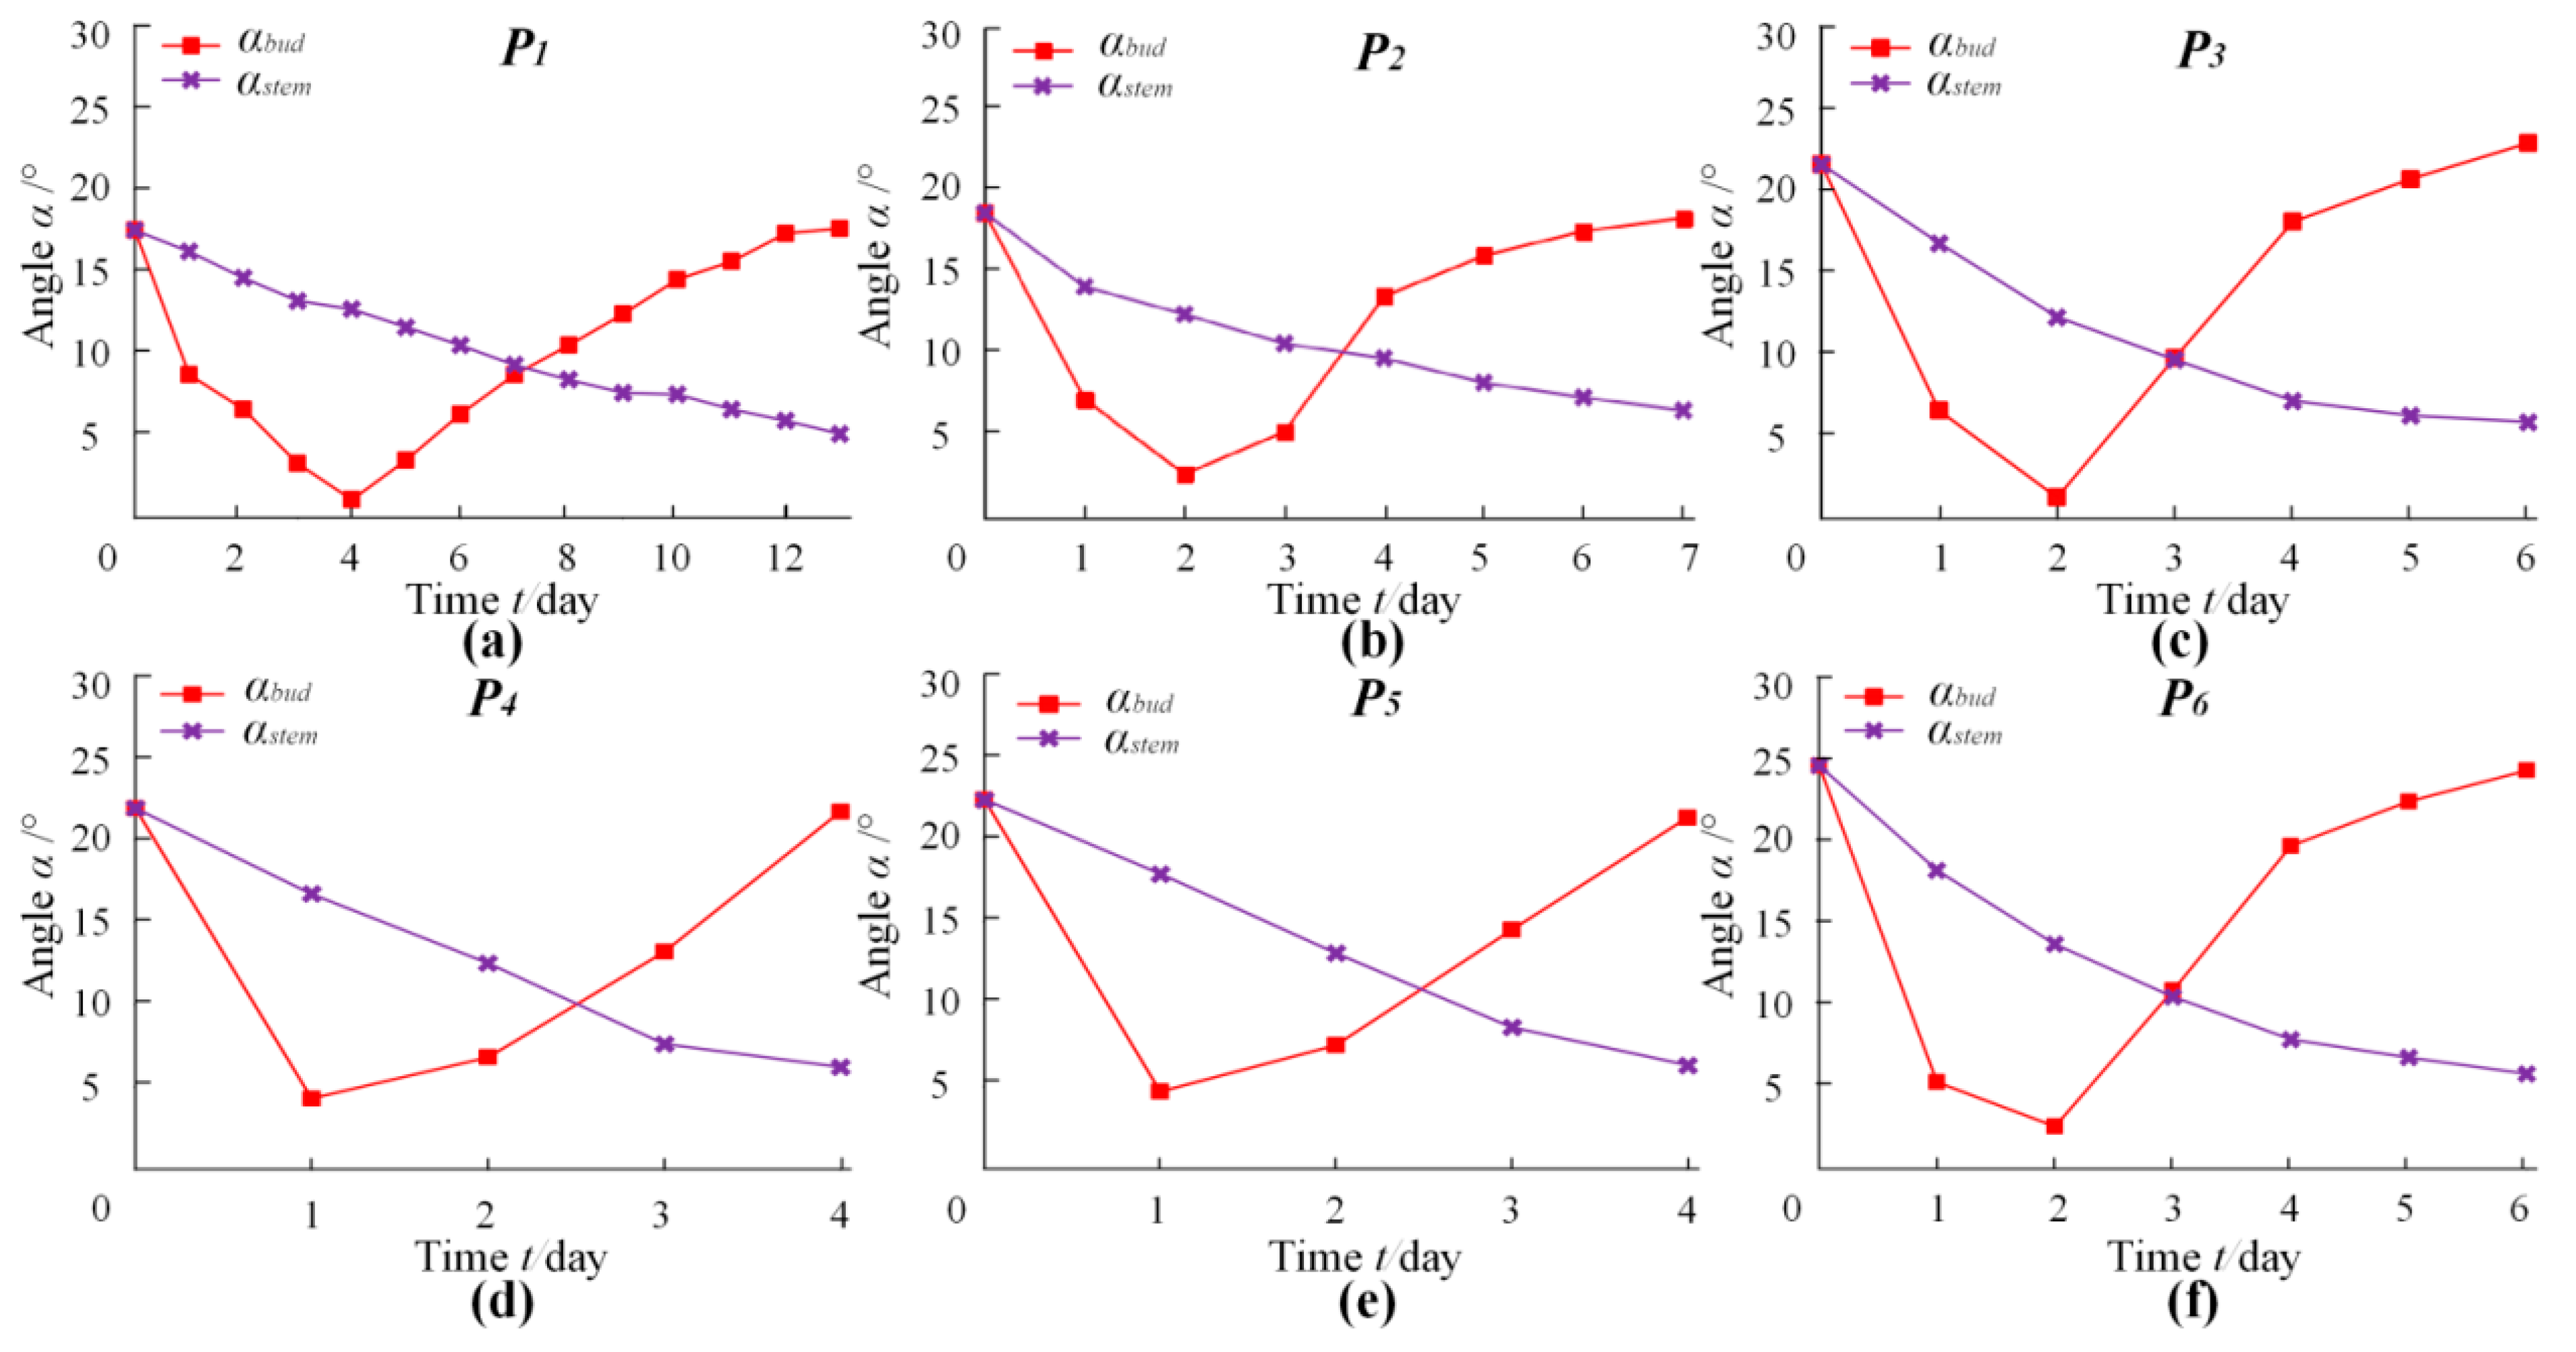
In Figure 5e, αbud and αstem are the key factors affecting r, and r is a key parameter for tea picking. Thus, the variation rules for αbud and αstem with respect to t were investigated. Figure 8 shows the variation of αbud and αstem with growth time. The terminal bud in the previous cycle grows into a new terminal bud and a stem in the next cycle; consequently, αbud is equal to αstem at the initial point of the growth cycle for all periods. It was observed that αstem decreased with an increase in growth time and tended to change gradually in the final stage of the growth cycle. However, αbud decreased rapidly during the initial stage of the growth cycle and further increased at a relatively rapid rate, perhaps because when the terminal bud reaches a critical point in the vertical state, it continues to incline in the same direction. The minimum values (all close to 0°) of αbud for P1, P2, P3, P4, P5, and P6 were at 4, 2, 2, 1, 1, and 2 d of the growth cycle, respectively. In the final stage, αbud tended to change gradually, similar to the Lbud trends, as shown in Figure 7. It is also observed in Figure 8 that αbud in the final stage is essentially equal to αbud at the initial point of the growth cycle for each period, possibly due to different biological characteristics.

4.3. Changes in Tea Growth Cycle with Time

To fully understand the growth rule for the Yinghong #9 tea shoot, the growth characteristics from the tea branch pruning period to the tea picking period were monitored; the growth cycle diagram is shown in Figure 9. It can be intuitively observed in Figure 9 that the transition period of the tea is nearly 20 d, nearly half of the entire process. This is because the transition period requires preparation of the nutrients for subsequent growth of the tea shoots. The next stage is the budding period, during which the bud gradually changes from dark brown to light green, and the bud length changes continuously. In the final stage of the budding period, the bud begins to branch and grow rapidly. Tea shoots then grow into the first stage of the germination period (a stage), where many top spring teas of greater value originate; the tea production yield is small, and the picking operation is difficult in this stage. Stages b and c are the stages of one shoot with two leaves and one shoot with three leaves, respectively. From a morphological perspective, the terminal buds in these two stages are very similar; the change trends of αbud and αstem in the c stage are essentially the same. In stage c, Lstem and Lbud increased with increasing growth time. In practical production, to increase production yield, workers often pick tea shoots in stage c. It is concluded from the figure that the c stage is 5–6 d. The appropriate picking time is near the end of stage c, which is approximately 1–2 d. Most of the shoots stopped branching when they had three leaves; the tea leaves became darker, and the stems gradually changed from green to brown, finally growing into folium dichotomous.
The growth of tea shoots is affected by different factors; the most influential is “top advantage” [40]. Many terminal buds branch and grow continuously without human intervention, greatly impacting the growth and development of side branches [41]. In actual production, to produce a more uniform growth of tea shoots and to facilitate precision picking, the “top advantage” of tea trees should be removed [42]. The growth cycle diagram presented in this study may only be aimed at the growth of Yinghong #9 tea in autumn, but to some extent, the basic understanding of this tea has been realized for the first time. The growth cycle diagram may provide a theoretical foundation and a technical reference for guiding picking and managing tea shoots in tea gardens and is a highlight of this study.

4.4. Analysis of Prediction Results of the Established ANN Model

4.4.1. Number of Hidden Layers and Momentum Coefficient

The mean square error (MSE) for different momentum coefficients with different numbers of hidden layers and neurons was used as the index to determine the optimal number of hidden layers and the momentum coefficient. As shown in Table 4, the lowest MSE value (0.033 × 10⁻⁴) was found with a momentum coefficient of 0.4, when the number of hidden layers was two, and the number of neurons was seven; the ANN model achieved the best training performance with these parameters. The training test was conducted with 1000 training epochs and a learning rate of 0.1. To determine the optimal number of training epochs and neurons in the hidden layer, the MSE for different numbers of training epochs (300–1500) with different numbers of hidden layer neurons were investigated; the results are shown in Figure 10. In the figure, the optimal training performance (MSE = 0.079 × 10⁻⁴) was found with 1200 training epochs and 11 neurons. Thus, the optimal configuration of the ANN model included two hidden layers, 11 neurons, a momentum coefficient of 0.4, and 1200 training epochs; the optimal architecture of the established model was 5-2-11-3. A similar methodology was reported by Fang et al. [43] for ANN modeling of the corn drying process in an industrial drying system and by Chokphoemphun et al. [39] for modeling of the moisture content prediction of paddy drying in a fluidized-bed drier with a vortex flow generator.

4.4.2. Training Results of the ANN Model

To investigate the fitting performance and the predictive capability of the established 5-2-12-3 ANN model, 134 sets of experimental data (Table 2) were used to train the ANN; 70% were used for the training, 15% were used for the test, and 15% were used for the validation. The training results are shown in Figure 11. The best training performance was found with 16 training epochs; the MSE was 0.0923 × 10⁻⁴, and the R values for the training data, test data, and validation data were 0.99976, 0.99871, and 0.99857, respectively. The training results of the established 5-2-12-3 ANN model demonstrated a perfect fitting performance and can be used to predict the picking indexes ξ, r, and Zstem. The weights of the ANN model are presented in Table 5.

4.4.3. Validation of the Established ANN Model

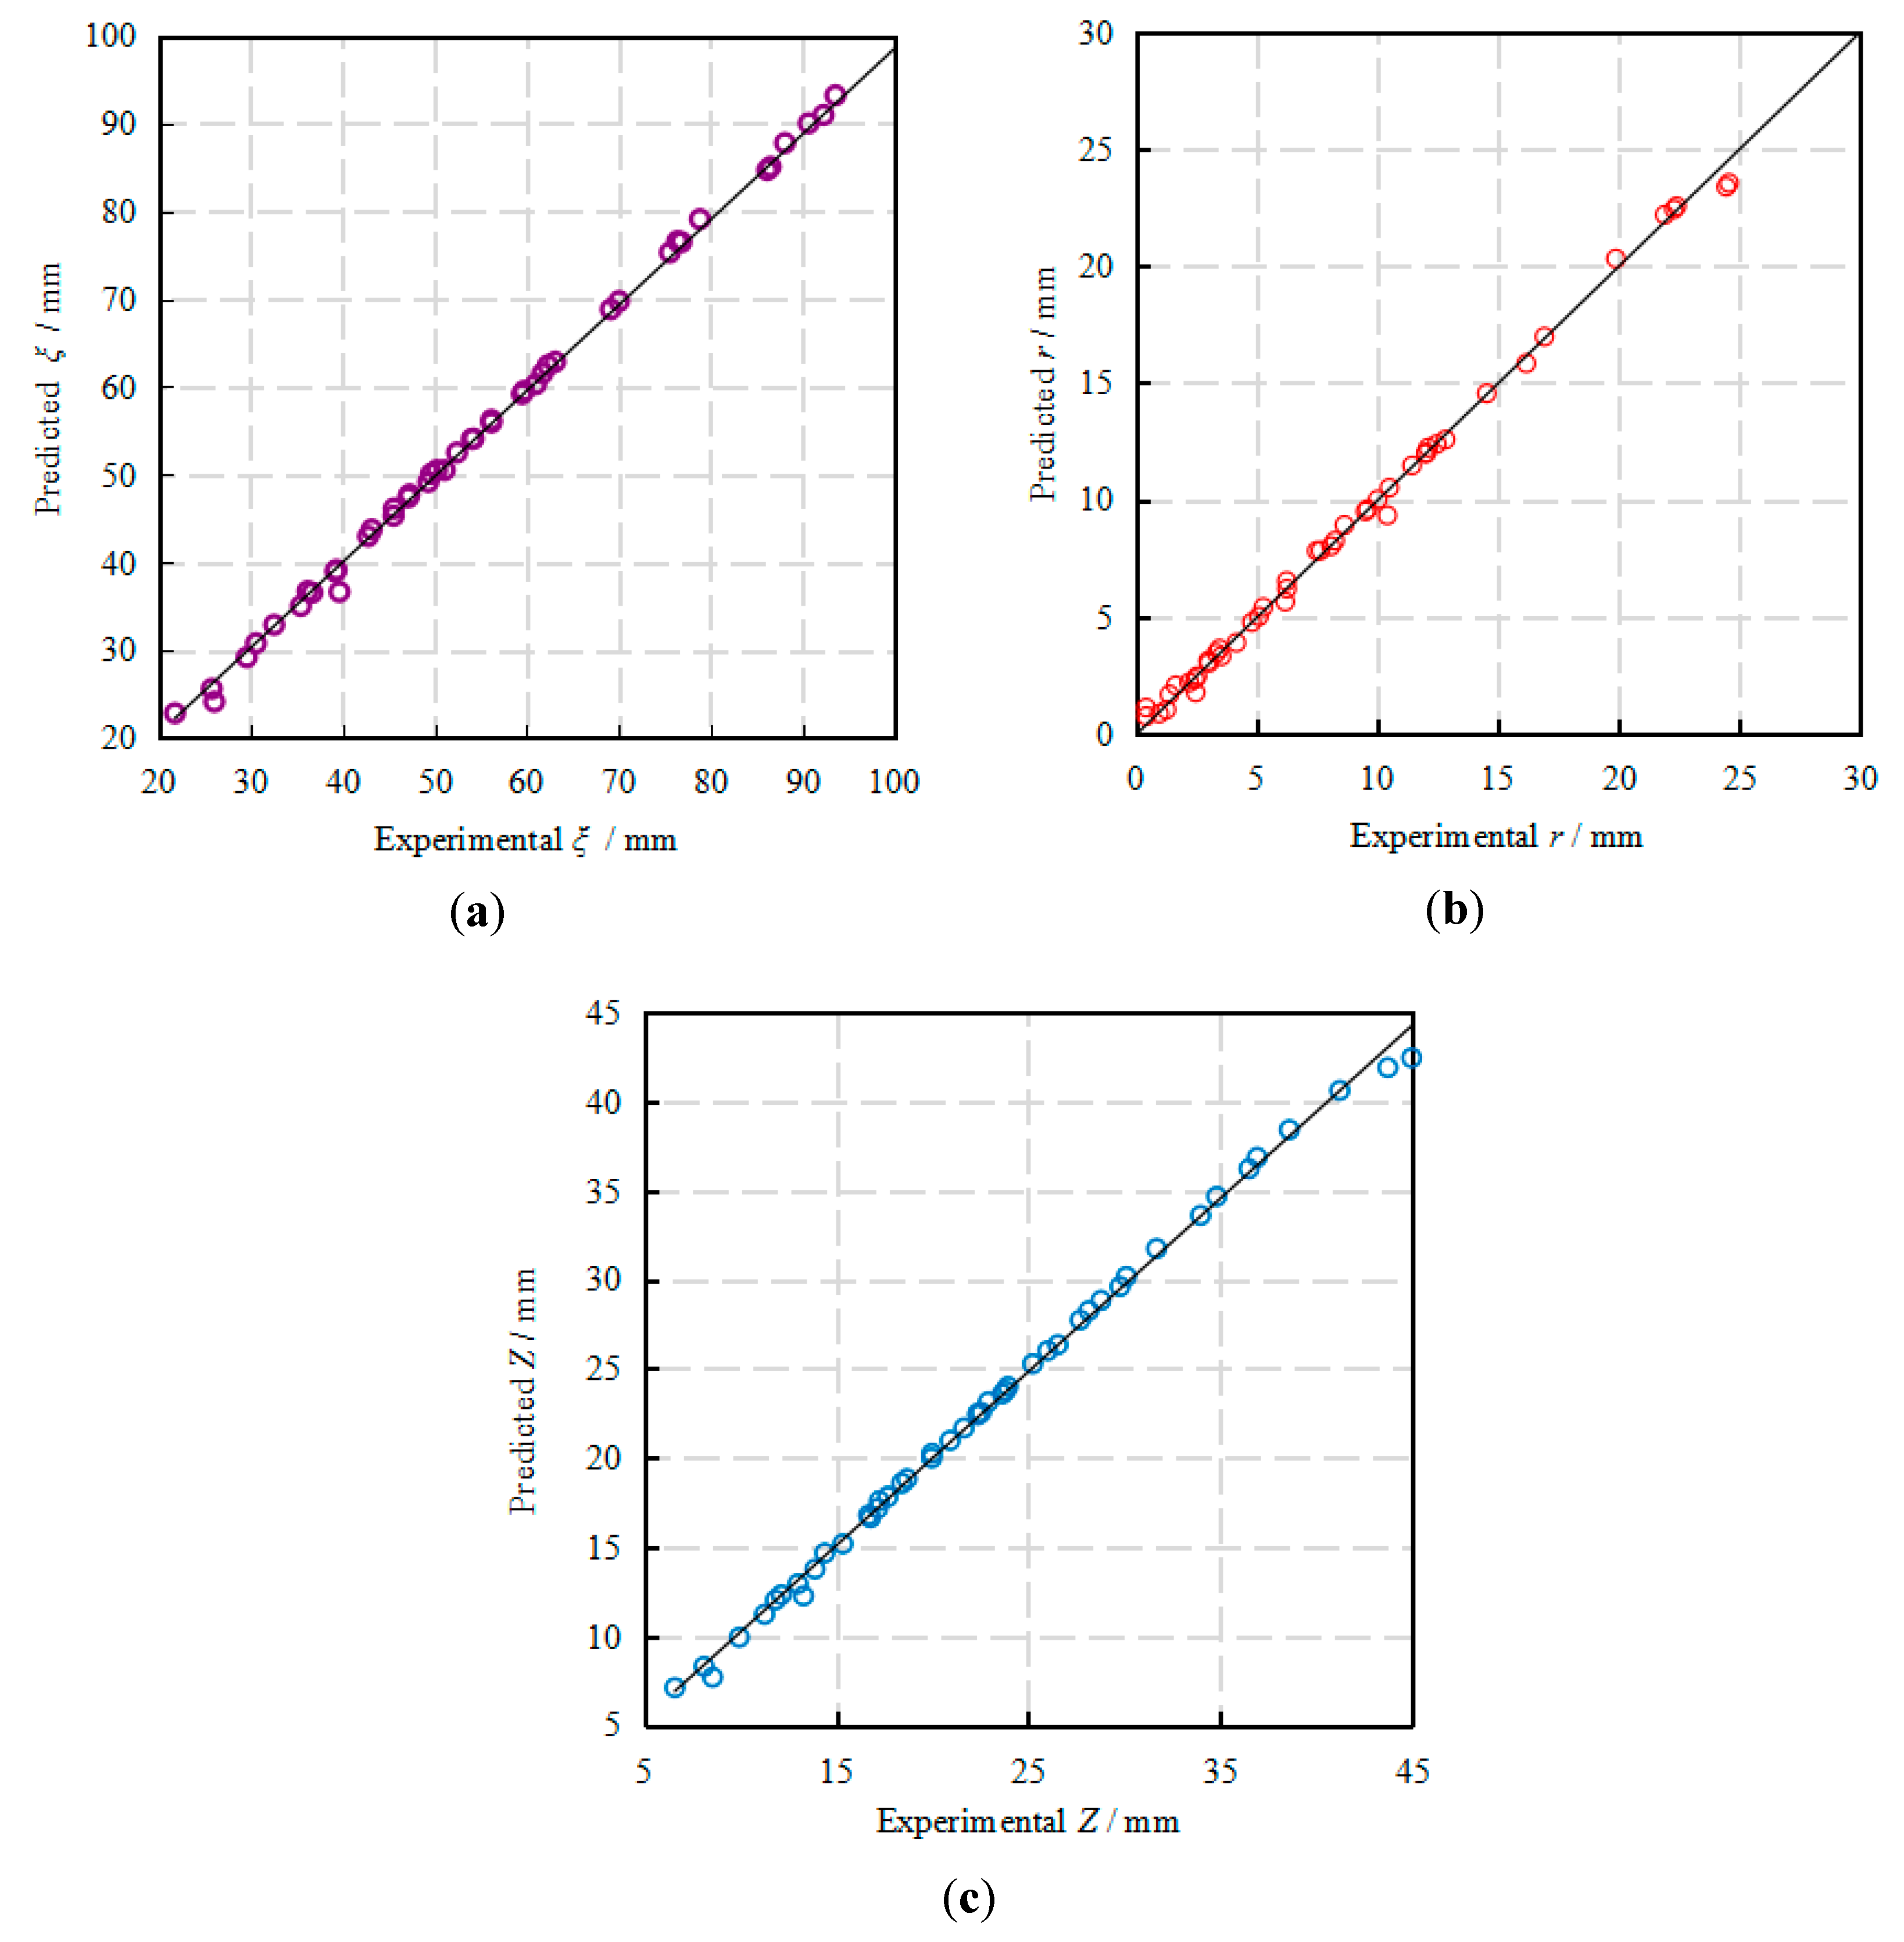
To validate the prediction capacity of the established ANN model, 46 sets of experimental data collected during the tea picking period were used for validation. The statistical parameters introduced in Section 3.2 were used to estimate the prediction capacity of the model. The validation results for ξ, r, and Zstem are shown in Figure 12a–c, respectively. The statistical results of the 5-2-12-3 ANN model are presented in Table 6. In Figure 12, the predicted values of the picking indexes (ξ, r, and Zstem) are in good agreement with the experimental data, indicating that the established ANN model has a good prediction capacity for ξ, r, and Zstem. According to the statistical results in Table 6, the determination coefficients (R2) for the indexes are all greater than 0.99, and the mean square errors (MSE) for ξ, r, and Zstem are 1.35183, 0.12726, and 0.27117, respectively; the mean absolute errors (MAE) for ξ, r, and Zstem, are 0.41474, 0.03799, and 0.13437, respectively. The statistical results indicate that the established 5-2-12-3 ANN model has a good prediction capacity and can be used to predict tea picking indexes.

4.4.4. Application of the Established ANN Model

Based on the established 5-2-12-3 ANN model, an application scheme is proposed, as shown in Figure 13. During the picking process, the input neurons including Lbud, Lstem, αbud, αstem, and t are measured by the 3-D coordinate instrument, and the measured datasets are used to train the ANN model, the predicted indexes (output neurons) including ξ, r, and Zstem are transferred to an intelligent optimized controller, and further inputted into the tea picking system after compensation. The output signals are executed by an actuator and achieve the goal of precision tea picking.

5. Conclusions

This study provides a fundamental understanding of tea growth. Based on the results, the key indexes, including the sum of ξ, r, and Zstem for tea picking, were determined using an ANN. The conclusions are summarized as follows:
(1)
A detailed growth cycle diagram including the transition period, budding period, and germination period of the tea growth was presented in this study.
(2)
The growth characteristics of the tea shoots were investigated and the growth cycle for periods P1, P2, P3, P4, P5, and P6 were determined to be 13, 7, 6, 4, 4, and 6 d, respectively, which can help in guiding the production of tea picking.
(3)
Considering the key growth parameters (Lbud, Lstem, αstem, and αbud) as the input neurons and the picking indexes (ξ, r, and Zstem) as the output neurons, a 5-2-12-3 ANN model was established.
(4)
The best performance for predicting ξ, r, and Zstem was found with 16 training epochs, where the MSE value was 0.0923 × 10⁻⁴, and the R values for the training, test, and validation data were 0.99976, 0.99871, and 0.99857, respectively. The established ANN model demonstrated excellent prediction performance and can be used to predict the picking indexes of tea shoots.

Author Contributions

The presented work was under supervision by W.W.; X.W.: Conceptualization, Methodology, Software, and Writing—original draft; Q.Z.: Visualization and Software; C.H.: Validation and Writing—review and editing; J.X.: Methodology and Writing—review and editing; Z.H.: Validation; Z.Z.; M.C.: Validation. All authors have read and agreed to the published version of the manuscript.

Funding

This work was supported by the Key Realm R&D Program of Guangdong Province (grant No.2019B020223001) and the National Natural Science Foundation of China (grant No. 11971178).

Institutional Review Board Statement

Not applicable.

Informed Consent Statement

Not applicable.

Data Availability Statement

This study did not report any data.

Acknowledgments

The authors acknowledge the editors and reviewers for their constructive comments and all the supports on this work.

Conflicts of Interest

The authors declare no conflict of interest.

References

  1. Shevchuk, A.; Jayasinghe, L.; Kuhnert, N. Differentiation of black tea infusions according to origin, processing and botanical varieties using multivariate statistical analysis of lc-ms data. Food Res. Int. 2018, 109, 387–402. [Google Scholar] [CrossRef]
  2. Yang, C.; Kim, S.; Yang, G.; Lee, M.; Liao, J.; Chung, J. Inhibition of carcinogenesis by tea: Bioavailability of tea polyphenols and mechanisms of actions. Proc. Soc. Exp. Biol. Med. 2010, 220, 213–217. [Google Scholar]
  3. Khan, N.; Mukhtar, H. Multitargeted therapy of cancer by green tea polyphenols. Cancer Lett. 2008, 269, 269–280. [Google Scholar] [CrossRef] [Green Version]
  4. Murase, T.A.; Nagasawa, J.; Suzuki, T.; Hase, I. Tokimitsu. Beneficial effects of tea catechins on diet-induced obesity: Stimulation of lipid catabolism in the liver. Int. J. Obes. Relat. Metab. Disord. 2002, 26, 1459–1464. [Google Scholar] [CrossRef] [Green Version]
  5. Baruah, P. Types of tea, value addition and product diversification of Indian tea. Proc. First Int. Conf. Tea Sci. Dev. 2015, 7, 151–159. [Google Scholar]
  6. Takashi, N.S.H. Study on temperature and growth of tea plants (4th report). Growth of young tea plants in temperature and summer. Tea Trial Res. Rep. 1962, 1, 28–40. [Google Scholar]
  7. Nakayama, T.; Sanui, G. Morphological study on tea shoot development (2nd report). Differentiation and development of lateral shoots in summer. Tea Res. Rep. 1965, 23, 1–5. [Google Scholar]
  8. Nakayama, T. Vertical distribution of tea buds in a scissors-picking tea plantation. Tea Giken 1967, 35, 40–44. [Google Scholar]
  9. Harada, T.N.S. Morphological study on tea bud development. Tea Res. Rep. 1960, 23, 1–5. [Google Scholar]
  10. Stephens, W.; Othieno, C.O.; Carr, M.K.V. Climate and weather variability at the tea research foundation of kenya. Agric. For. Meteorol. 1992, 61, 219–235. [Google Scholar] [CrossRef]
  11. Koichi, K. The effects of autumn to spring on the sprouting and plucking seasons minimum temperature and precipitation. Chakenh 1988, 6, 22–37. [Google Scholar]
  12. Takezawa, N.K.K. Prediction of the germination period of the first tea by nonparametric DVR method. Agric. Weather 1994, 50, 221–224. [Google Scholar]
  13. Takayuki, N. Tea-side shoot development model starting from the pruning period. Jpn. Crop Sci. J. 1999, 68, 433–439. [Google Scholar]
  14. Jayasinghe, H.A.S.L.; Suriyagoda, L.D.B.; Karunarathne, A.S.; Wijeratna, M.A. Modelling shoot growth and yield of ceylon tea cultivar tri-2025 (camellia sinensis (l.) o. kuntze). J. Agric. Sci. 2018, 156, 200–214. [Google Scholar] [CrossRef]
  15. Wang, W.; Yuan, S.; Wu, C.; Yang, S.; Zhu, J. Field experiments and model simulation based evaluation of rice yield response to projected climate change in southeastern China. Sci. Total Environ. 2020, 761, 143206. [Google Scholar] [CrossRef]
  16. Joshi, V.R.; Kazula, M.J.; Coulter, J.A.; Naeve, S.L.; Garcia, A. In-season weather data provide reliable yield estimates of maize and soybean in the us central corn belt. Int. J. Biometeorol. 2021, 65, 489–502. [Google Scholar] [CrossRef]
  17. Jwmp, A.; Cags, B.; Jeo, A. Temperature-based prediction of harvest date in winter and spring cereals as a basis for assessing viability for growing cover crops. Field Crops Res. 2021, 264. [Google Scholar] [CrossRef]
  18. Bernotas, G.; Scorza, L.C.T.; Hansen, M.F.; Hales, I.J.; Halliday, K.J.; Smith, L.N. A photometric stereo-based 3d imaging system using computer vision and deep learning for tracking plant growth. GigaScience 2019, 8, giz056. [Google Scholar] [CrossRef]
  19. Bengocheaguevara, J.M.; Andujar, D.; Sanchezsardana, F.L. A Low-Cost Approach to Automatically Obtain Accurate 3D Models of Woody Crops. Sensors 2017, 18, 30. [Google Scholar] [CrossRef] [Green Version]
  20. Golbach, F.G.; Kootstra, S.; Damjanovic, G.; Otten, R.V.; Zedde, D. Validation of plant part measurements using a 3d reconstruction method suitable for high-throughput seedling phenotyping. Mach. Vis. Appl. 2016, 2, 663–680. [Google Scholar] [CrossRef] [Green Version]
  21. Li, Y.; Fan, X.; Mitra, N.J.; Chamovitz, D.; Cohen-Or, D.; Chen, B. Analyzing growing plants from 4d point cloud data. Acm Trans. Graph. 2013, 32, 1–10. [Google Scholar] [CrossRef]
  22. Cabo, C.; Pozo, S.D.; Rodríguez-Gonzálvez, P.; Ordóez, C.; González-Aguilera, D. Comparing terrestrial laser scanning (tls) and wearable laser scanning (wls) for individual tree modeling at plot level. Remote Sens. 2018, 10, 540. [Google Scholar] [CrossRef] [Green Version]
  23. Whitfield, D.M.; Connor, D.J. Architecture of individual plants in a field-grown tobacco crop. Funct. Plant Biol. 1980, 7, 415–433. [Google Scholar] [CrossRef]
  24. Sinoquet, H.; Stephan, J.; Sonohat, G.; Lauri, P.E.; Monney, P. Simple equations to estimate light interception by isolated trees from canopy structure features: Assessment with three-dimensional digitized apple trees. New Phytol. 2007, 175, 94–106. [Google Scholar] [CrossRef]
  25. Wu, S.G.; Bao, F.S.; Xue, E.Y. A Leaf Recognition Algorithm for Plant Classification Using Probabilistic Neural Network. IEEE 7th Interantional Symposium on Signal Processing and Information Technology. Cairo 2007, 11–16. [Google Scholar] [CrossRef] [Green Version]
  26. Guo, W.W.; Xue, H. Crop yield forecasting using artificial neural networks: A comparison between spatial and temporal models. Math. Probl. Eng. 2014, 22, 1–7. [Google Scholar] [CrossRef]
  27. Kucukonder, H.; Boyaci, S.; Akyz, A. A modeling study with an artificial neural network: Developing estimationmodels for the tomato plant leaf area. Turk. J. Agric. For. 2016, 40, 203–212. [Google Scholar] [CrossRef]
  28. Hu, J.; Xin, P.; Zhang, S. Model for tomato photosynthetic rate based on neural network with genetic algorithm. Int. J. Agric. Biol. Eng. 2019, 12, 179–185. [Google Scholar] [CrossRef] [Green Version]
  29. Green, T.R.; Salas, J.D.; Martinez, A. Relating crop yield to topographic attributes using spatial analysis neural networks and regression. Geoderma 2006, 139, 23–37. [Google Scholar] [CrossRef]
  30. Tang, P.; Shen, D.; Xu, Y.; Zhang, X.; Shi, J.; Yin, J. Effect of Fermentation Conditions and Plucking Standards of Tea Leaves on the Chemical Components and Sensory Quality of Fermented Juice. J. Chem. 2018, 1–7. [Google Scholar] [CrossRef]
  31. Wang, F.L. Scientific picking of high-quality tea. New Countrys. 1994, 4, 13. [Google Scholar]
  32. Liu, X.X.; Wang, J.L.; Zhao, H.F.; Hu, H.J.; Duan, X.Y. The physical and chemical difference of open surface leaf and clip leaf. Tea Commun. 2011, 38, 11–13. [Google Scholar]
  33. Dai, A.; Zhou, X.; Liu, X.; Liu, J.; Zhang, C. Model of drying process for combined side-heat infrared radiation and convection grain dryer based on bp neural network. Nongye Jixie Xuebao/Trans. Chin. Soc. Agric. Mach. 2017, 48, 351–360. [Google Scholar]
  34. Vogl, T.; Mangis, P.J.K. Accelerating the convergence of the back-propagation method. Biol. Cybern. 1988, 59, 257–263. [Google Scholar] [CrossRef]
  35. Aghbashlo, M.; Mobli, H.; Rafiee, S.; Madadlou, A. The use of artificial neural network to predict exergetic performance of spray drying process: A preliminary study. Comput. Electron. Agric. 2012, 88, 32–43. [Google Scholar] [CrossRef]
  36. Reed, R.D.; Marks, R.J. Neural smithing-supervised learning in feedforward artificial neural networks. Pattern Anal. Appl. 2001, 4, 73–74. [Google Scholar] [CrossRef]
  37. Chokphoemphun, S.; Chokphoemphun, S. Moisture content prediction of paddy drying in a fluidized-bed drier with a vortex flow generator using an artificial neural network. Appl. Therm. Eng. 2018, 145, 630–636. [Google Scholar] [CrossRef]
  38. Zeng, Z.; Chen, M.; Wang, X.; Wu, W.; Ma, B. Modeling and optimization for konjac vacuum drying based on response surface methodology (RSM) and artificial neural network (ANN). Processes 2020, 8, 1430. [Google Scholar] [CrossRef]
  39. Li, B.; Li, C.; Huang, J.; Li, C. Application of artificial neural network for prediction of key indexes of corn industrial drying by considering the ambient conditions. Appl. Sci. 2020, 10, 5659. [Google Scholar] [CrossRef]
  40. Mariotti, B.; Maltoni, A.; Jacobs, D.F.; Tani, A. Tree shelters affect shoot and root system growth and structure in quercus robur during regeneration establishment. Eur. J. For. Res. 2015, 134, 641–652. [Google Scholar] [CrossRef]
  41. Vanderzande, S.; Hias, N.; Edge-Garza, D.; Costes, E.; Davey, M.W.; Keulemans, J. Sylleptic branching in winter-headed apple (malus×domestica) trees: Accession-dependent responses and their relationships with other tree architectural characteristics. Tree Genet. Genomes 2016, 12, 87. [Google Scholar] [CrossRef]
  42. Velisevich, S.N.; Bender, O.G.; Goroshkevich, S.N. The influence of scion donor tree age on the growth and morphogenesis of siberian stone pine grafts. New For. 2020, 1–19. [Google Scholar] [CrossRef]
  43. Fang, C.; Huang, J.; Cuan, K.; Zhuang, X.; Zhang, T. Comparative study on poultry target tracking algorithms based on a deep regression network. Biosyst. Eng. 2020, 190, 176–183. [Google Scholar] [CrossRef]
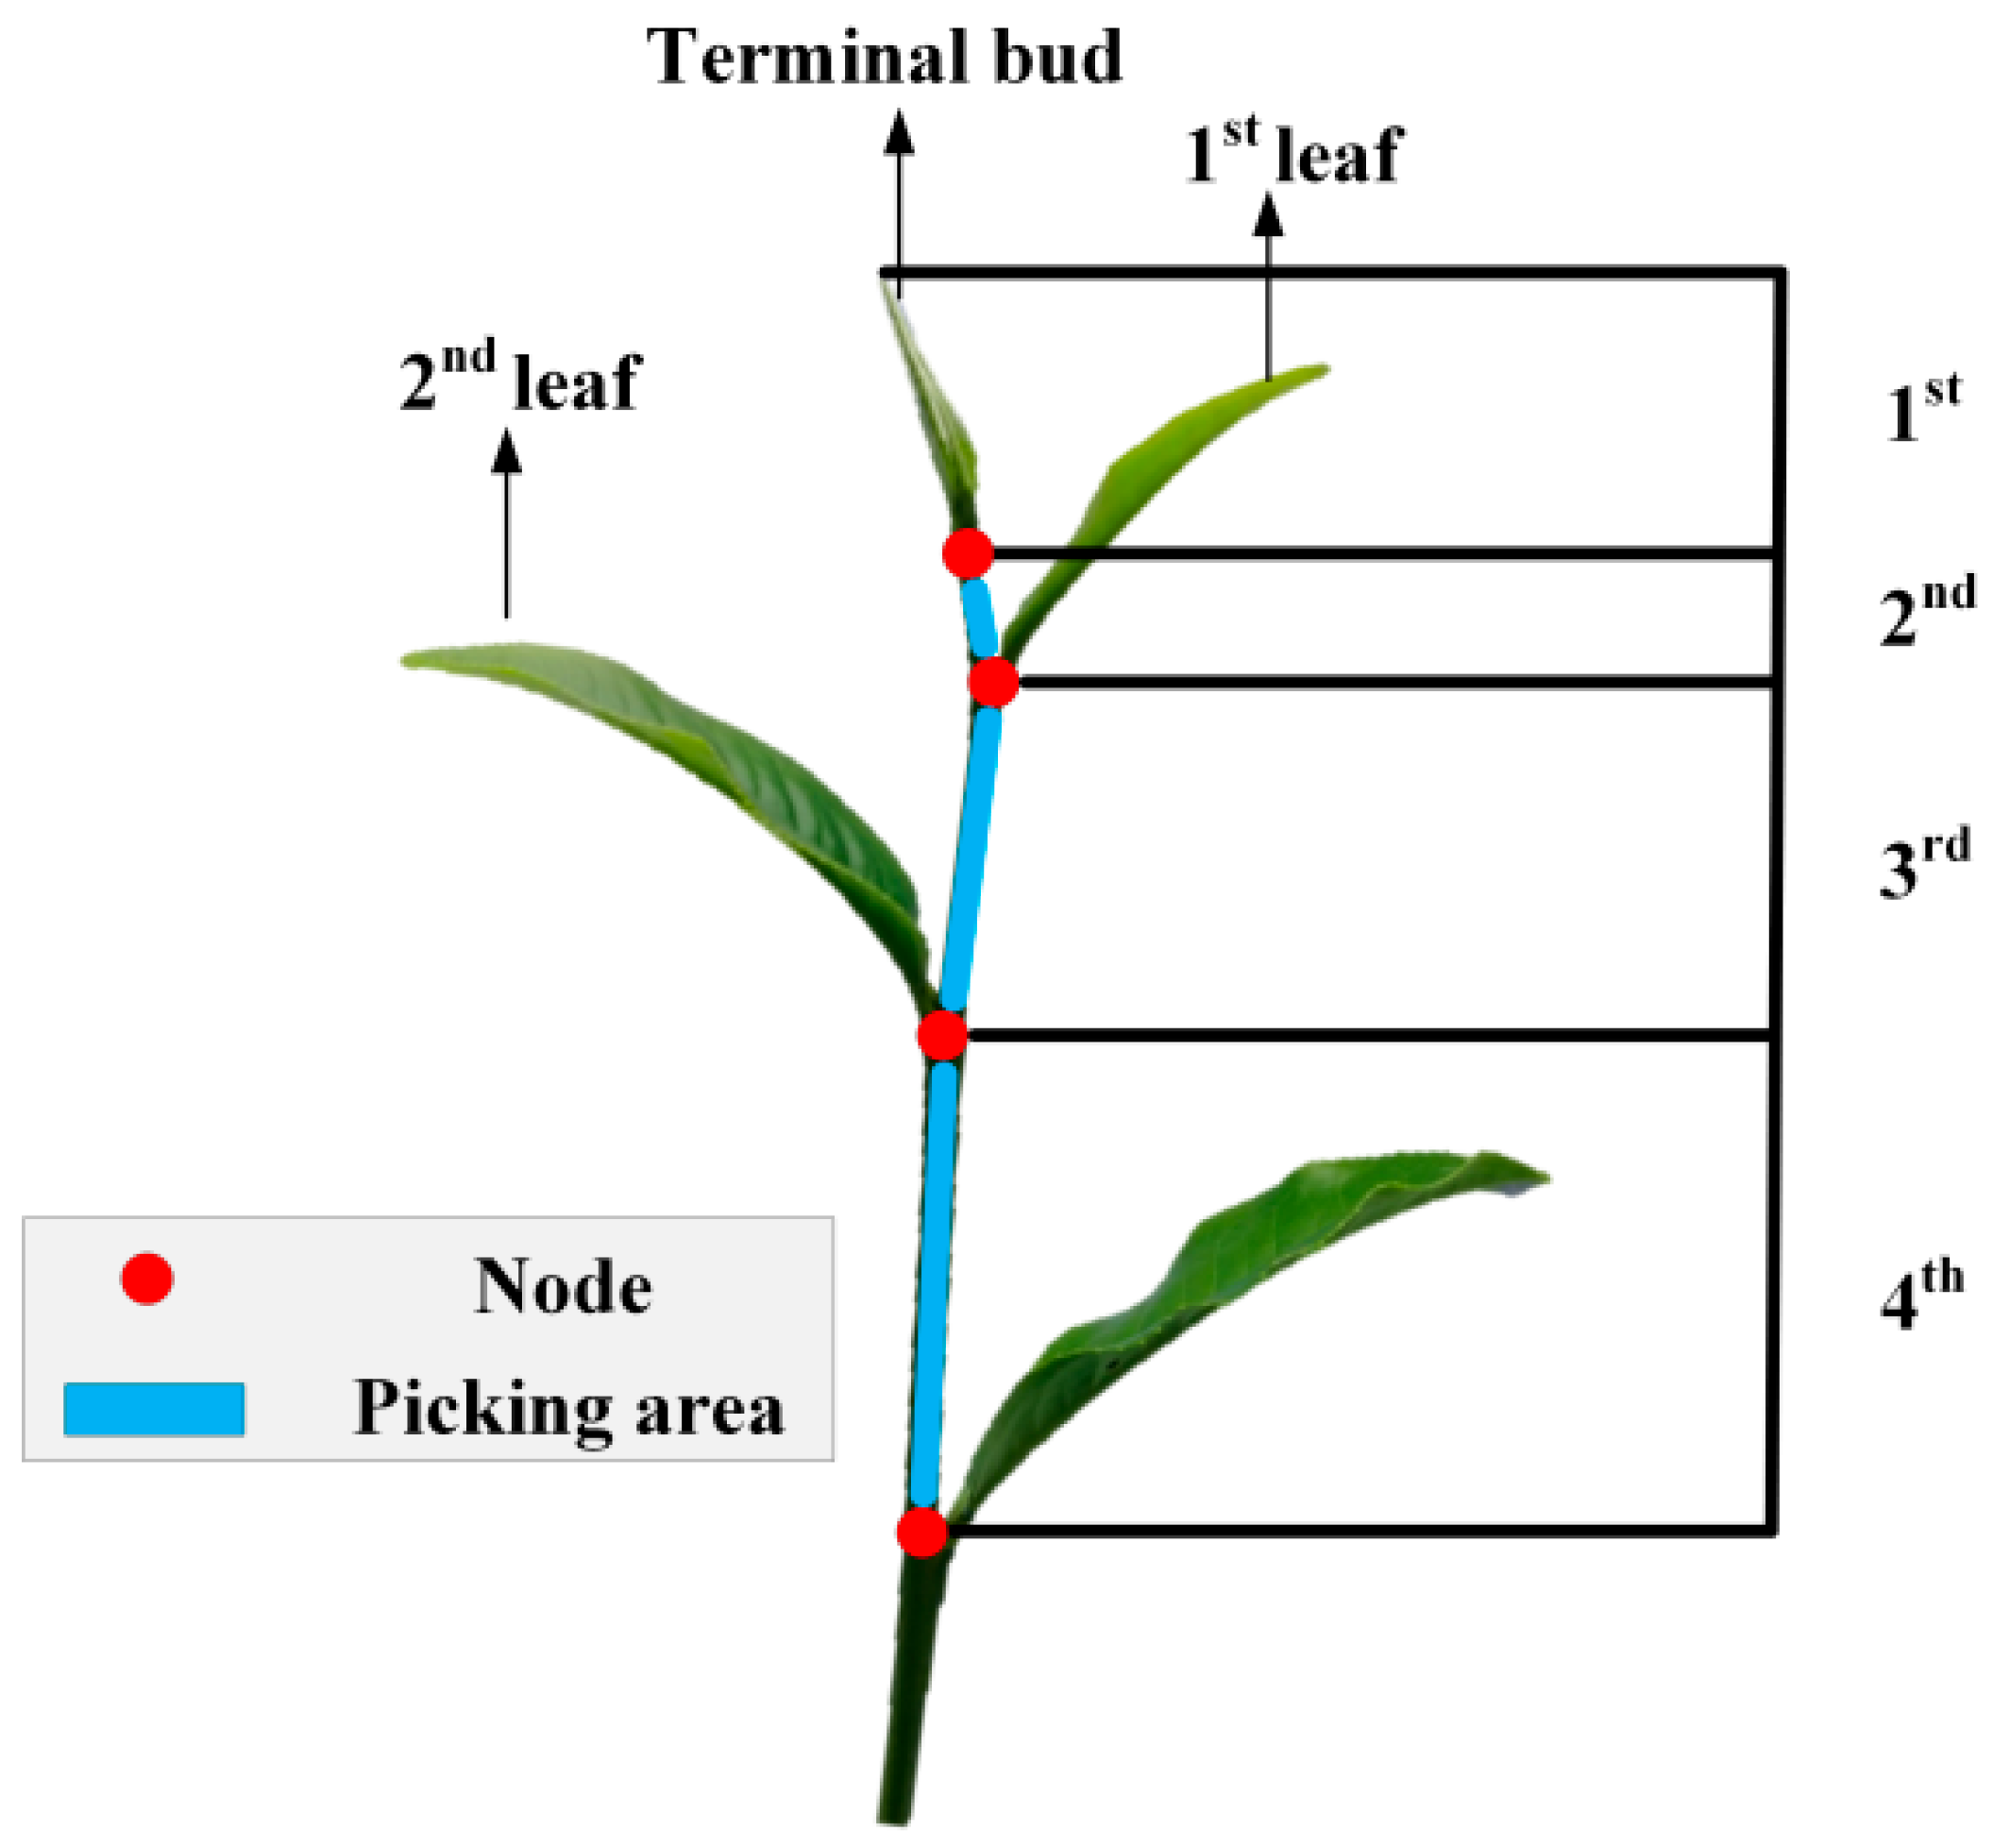
Figure 1. Tea section and picking areas.
Processes 09 01059 g001
Figure 2. The 3-D coordinate acquisition system.
Processes 09 01059 g002
Figure 3. Scene graph of the tea leaf (a), coordinate system of a single tea leaf (b), various forms of the tea leaf(c) and the diagram of the tea trunk (d).
Processes 09 01059 g003
Figure 4. Tea shoot branching (a), terminal bud (b) and the new tea shoot branching produced by the terminal bud (c).
Processes 09 01059 g004
Figure 5. Coordinate of the terminal bud (a), the diagram of the terminal buds in a plane (b), the plane coordinates of the a single terminal bud after translation (c), the plane coordinates of the terminal buds after translation (d) and the established tea leaf precise picking model (e).
Processes 09 01059 g005
Figure 6. Established ANN (a) and the corresponding training process (b).
Processes 09 01059 g006
Figure 7. Variation rules for Lbud, Lstem, and ξ with growth time for P1, P2, P3, P4, P5 and P6 (af).
Processes 09 01059 g007
Figure 8. Variation rules for αbud and αstem with growth time for P1, P2, P3, P4, P5 and P6 (af).
Processes 09 01059 g008
Figure 9. Growth cycle diagram of Yinghong #9 tea. Note: a, b, and c represent the stage of one shoot with one leaf, one shoot with two leaves, and one shoot with three leaves, respectively.
Processes 09 01059 g009
Figure 10. Variation in MSE with different numbers of training epochs and neurons.
Processes 09 01059 g010
Figure 11. Training results of error approximation (a) and the fitting (b) for the 5-2-12-3 ANN model.
Processes 09 01059 g011
Figure 12. Comparison of experimental values and prediction results for (a) ξ; (b) r; (c) Zstem.
Processes 09 01059 g012
Figure 13. The application scheme of the established 5-2-12-3 ANN model.
Processes 09 01059 g013
Table 1. Experimental plan.
VarietyPeriodQuantityMassive ContentPurpose
Yinghong #9P150A/B/C
Coordinates in space
Calculate and test
P250
P350
P450
P550
P650
Table 2. Partial experimental data.
BatchDateLbud (mm)Lstem (mm)αbud (°)αstem (°)ξ (mm)r (mm)Zstem (mm)
P1115.9116.95518.55518.55521.7644.7966.594
319.77310.3057.10515.10529.5712.4469.949
825.94617.4169.2169.81642.7724.15517.161
1432.50825.34117.9415.44156.15410.01425.227
P2118.5499.05519.45719.06926.0486.1798.558
321.80114.8062.52613.44036.1800.96014.400
633.27322.63516.7638.73954.2319.59622.372
835.46128.31018.8066.05961.72011.43128.152
P3127.50613.30223.36623.69337.43110.90912.181
442.98425.68811.81111.52867.2438.79725.169
757.78138.86823.8777.33291.38623.38838.868
P4130.24518.38523.95923.29744.52412.28116.886
345.61430.0539.23114.68274.0957.31729.071
560.92644.65924.2227.67599.82124.99644.259
P5132.74018.67025.60925.90746.31714.15116.793
348.36630.45310.35516.37476.7958.69329.217
565.72544.78524.3518.940104.11927.0996.959
P6128.31714.93327.54726.62938.45513.09513.348
443.78427.47513.03012.54969.4759.87126.818
758.01941.70126.6848.69693.06026.05441.221
Table 3. Configurations of ANN model.
Parameters of ANN ModelRange
Number of hidden layers1–3
Number of neurons4–12
Momentum coefficient0.1–0.4
Number of training epochs300–1500
Table 4. Variation in MES values with different ANN configurations.
Number of Hidden LayersNumber of NeuronsMSE for Momentum Coefficient (×10−4)
0.10.20.30.4
150.84362.62692.05391.2984
71.28363.01672.06460.7428
90.79603.05720.36382.8964
118.00431.35942.27881.2983
251.47821.32352.19801.2382
71.74430.28200.28460.0330
99.51666.30660.81402.400
114.98110.90803.30921.1428
359.08752.90993.27761.4205
72.66972.54371.04592.4660
90.13900.10320.12850.2722
112.94571.48022.18110.5287
Note: With 1000 training epochs and a learning rate of 0.1. The bold numbers indicate the lowest MSE.
Table 5. Weights of established ANN model.
WeightMatrix
i w { 1 , 1 } [ 1.5485 1.1896 1.2995 0.1283 0.88355 1.8239 1.0092 1.4292 2.3875 1.5284 2.2486 1.6935 2.3644 0.16251 2.8041 1.7806 2.2935 2.0127 0.1276 1.6143 1.0057 1.705 1.1219 2.883 0.22473 1.4881 0.49466 1.8236 1.1918 2.2426 ] T
i w { 2 , 1 } [ 0.11719 0.20031 0.92857 0.24623 0.25743 0.50884 1.1206 0.16612 0.87807 0.12095 0.24653 0.28233 0.44907 1.1557 0.2302 0.46417 0.42098 0.55108 0.6603 0.801 0.19157 0.4772 0.93092 0.97381 1.0995 0.6018 0.017862 0.097757 0.30043 0.15305 ]
b { 1 } [ 3.1099 2.5969 1.7251 1.1526 0.52729 0.82056 1.0568 1.5445 2.8732 2.869 ] T
b { 2 } [ 0.415334 0.70839 0.32821 ] T
Table 6. Statistical results of 5-2-12-3 ANN model.
ParameterStatistical Values for Picking Indexes
ξrZstem
Determination coefficient (R2)0.996790.999940.99978
Mean square error (MSE)1.351830.127260.27117
Mean absolute error (MAE)0.414740.037990.13437
Publisher’s Note: MDPI stays neutral with regard to jurisdictional claims in published maps and institutional affiliations.