Article

A Fuzzy Model to Manage Water in Polymer Electrolyte Membrane Fuel Cells

by
Gómer Abel Rubio
* and
Wilton Edixon Agila
Escuela Superior Politécnica del Litoral, ESPOL, Facultad de Ingeniería en Electricidad y Computación, CASE, CIDIS, km 30.5 vía Perimetral, Guayaquil PO Box 09-01-5863, Ecuador
*
Author to whom correspondence should be addressed.
Processes 2021, 9(6), 904; https://doi.org/10.3390/pr9060904
Submission received: 7 April 2021 / Revised: 6 May 2021 / Accepted: 6 May 2021 / Published: 21 May 2021
(This article belongs to the Section Energy Systems)

Abstract

:
In this paper, a fuzzy model is presented to determine in real-time the degree of dehydration or flooding of a proton exchange membrane of a fuel cell, to optimize its electrical response, and, consequently, its autonomous operation. By applying load, current, and flux variations in the dry, normal, and flooded states of the membrane, it was determined that the temporal evolution of the fuel cell voltage is characterized by changes in slope and by its voltage oscillations. The results were validated using electrochemical impedance spectroscopy and show slope changes from 0.435 to 0.52 and oscillations from 3.6 to 5.2 mV in the dry state, and slope changes from 0.2 to 0.3 and oscillations from 1 to 2 mV in the flooded state. The use of fuzzy logic is a novelty and constitutes a step towards the progressive automation of the supervision, perception, and intelligent control of fuel cells, allowing them to reduce their risks and increase their economic benefits.

1. Introduction

This document is an extension of the work originally presented at Icrera 2019 [1]. The great problems of today’s society such as economic inequality, climate change, decreasing of the ozone layer, lack of resources, toxic pollution, diminishing biodiversity, human health, coastal settlements; must be confronted by the academy and decidedly by the engineering sciences. The hydrogen-powered fuel cell stack is the most promising energy source of the future [2], as it would help eliminate the world’s serious problems [3,4]. The hydrogen economy—where hydrogen and fuel cells are essential partners—is estimated to grow from USD 122 billion in 2018 to USD 155 billion in 2022 [5,6].
The fuel cell stack converts the chemical energy into electrical power and produces water and heat as subproducts during its operation. The proton exchange membrane fuel cell (PEMFC), it is expected to play a key role in the future energy system since its favorable characteristics such as high-power density, zero pollution, low operating temperature, quick start-up capability, and long lifetime. PEMFC can be used in cell phones, electric vehicles, distributed power systems, submarines, and aerospace applications.
The PEMFC for its proper operation simultaneously requires both a high proton conductivity in the membrane and a sufficient supply of reactants; for this reason, water management is one of the most important issues and to manage it properly, it is necessary to know how it is transported and distributed through the different components of the PEMFC.
Different methodologies have been proposed to study, diagnose, and prevent failures in water management in PEMFC. On the one hand, methodologies based on analytical, physical, or experimental models and on the other hand, methodologies that are based on non-models and that use artificial intelligence, statistics, or signal processing techniques.
From the position of model-based methodologies, the problem of water management has been diagnosed considering models that involve multi-scale methods solved by electric circuits, numerical simulations [7,8,9], use of VOF in CFD, method of Lattice–Boltzmann, Eulerian–Lagrangian method (Eulerian for air and Lagrangian for water), neutron imaging technique, magnetic resonance imaging technique, and Kalman filter. Water management has been modelled in a stationary, dynamic, isobaric, and non-isobaric way [10,11,12,13], developing experimental techniques to predict its parameters and determine the distributions of water, gas, and of temperature in the PEMFC. The materials to build the membrane, the transient response produced by the dehydration of the membrane, the flooding of the gas diffusing layers and the dilution of the reagents in the flow channels have been analyzed [14,15,16,17].
While it is true that the results of model-based methodologies have broadened the understanding of liquid transport through porous media and facilitated the development of new models at the macro and micro level, it could be argued that there are still difficulties in measuring simultaneously multiple parameters and in many cases, the techniques and methods proposed require equipment that increases the costs of the PEMFC and complicates the timely detection of failures [18,19].
From the perspective of methodologies based on non-models, the problem of water management has been analyzed considering models that involve neural network methods, fuzzy logic, neural-fuzzy networks, and prognostics. Techniques have been developed to determine the diffusion time constant, Nyquist diagrams, relative humidity, hydration status, control air supply, and estimate the remaining life of the PEMFC, with fairly accurate results.
At first glance, the precision of the results of non-model-based methodologies maybe their great strength; on closer inspection, however, the results were obtained assuming that pressures are controlled, reactants are rapidly and constantly humidified, and there are no gas transmission losses.
Although many of the fuzzy logic studies have concluded that their results are accurate, some studies have assumed that the pressures are controlled and that the reagents humidify rapidly and constantly. These assumptions constitute a challenge and allow us to propose the objective of our study.
In this article, to optimize the electrical response of the PEMFC and consequently its operation, a fuzzy model is presented that allows—in real-time—to determine the degree of dehydration or flooding of its proton exchange membrane and to make control decisions about pressure and humidification of gases. The scope of this work is the polymeric membrane, limited to its dry and flooded states.
The remainder of the paper is organized as followed: Section 1 provides a review of the state-of-the-art and analyzes the precision and reliability of the different fault diagnosis and detection methodologies, which help prevent premature degradation of the PEMFC. Section 2 proposes an innovative, low-cost and easy-to-implement fussy technique to detect in real-time the degree of wetting of the PEMFC membrane. Section 3 analyzes the results and their validation, detecting three well-defined wetting states, dry, normal, and wet. Section 4 concludes this article and Section 5 presents some lines of future research.

2. State-of-the-Art Review

Diagnostic and troubleshooting tools help identify and isolate errors that may occur in a system that is being monitored in real-time. In the case of the PEMFC, its optimal operation is given by its electrical response, so the critical states that can cause a malfunction to depend on the energy demand of the load and are directly related to the hydration levels of the membrane. The purpose of this section is to analyze the precision and reliability of the different fault diagnosis and detection methodologies, which help prevent premature degradation of the PEMFC.

2.1. Model-Based Techniques

They require internal knowledge of the PEMFC to approximate it quantitatively, from differential equations to numerical methods; or qualitatively, from experiments to electrical circuits, for example, [20].
Electric circuits could be generated from methods based on non-models (neural network, fuzzy logic, and statistics). Models can adopt software and equipment used in electrical and electronic network analysis, such as Matlab/Simulink and electrochemical impedance meters (EIS). Impedance measurements are techniques widely used in the diagnosis of water management problems.
The electrical model has adequate characteristics for fault diagnosis since it can be characterized by differential equations that can be linearized around the desired operating point, obtaining information on the behavior of the battery. Its voltage signal as a function of time allows considering the different states of the PEMFC (initial, transient, and stationary), which allows proposing dynamic controls [21]. On the other hand, it can also be associated with the variation/estimation of the circuit parameters, allowing the use of a parametric approach for diagnosis, such as Kalman filtering [22].
An example of this is the mathematical model simulated in Matlab/Simulink that predicts the electrical response to various inputs, such as variable loads, and that allows predicting the performance of the PEMFC in terms of efficiency and energy production. Unfortunately, being a model designed for low temperatures, its response to high temperatures is not known [23].
Another work that serves as an example is the implementation of NEOPARD-X, a numerical model that analyzes in detail the physical processes that govern the PEMFC, that is, multiphase flow, non-isothermal flow, electric charge transport, and transport of oxygen. It is concluded that the contribution of diffusion to the total impedance is small, that the concentration gradients along the channel have a strong impact and that the inductive part of the impedance is dependent on humidity. The results were validated with impedance measurements under different operating conditions [24].
Another robust method that has been used is the neutron imaging technique to explore the possible contribution of two-phase flux in porous media to mass transport losses (one of the least understood contributors to overpotential in electrolyzers). The study found that the increase in mass transport losses with increasing current densities and operating pressures were not related to two-phase flow in most gas diffusion layers (GDL); concluding that the two-phase flow in the GDL is purely capillary and that the most probable is that the origin of the increase of the losses by mass transport, is in the interface between GDL and the catalyst layer (CL) [25]. Using the same technique, another study investigated the impact of temperature on two-phase flow and showed that, with increasing temperature, the saturation of the GDL decreases. According to the study, it also seems that at high temperatures (greater than 60 °C), the current density has an impact on the saturation of the anode GDL, so they recommend operating at high temperatures, to achieve an optimal transport of water and oxygen [26].
Another robust technique is magnetic resonance imaging that allows visualizing the water content in the membrane and that correlates the battery output voltage with its operating conditions [27]. On the other hand, measurements of the magnetic field surrounding the PEMFC have also been made (based on the relationship between current density-magnetic field), obtaining graphs that allow determining whether a stack is healthy. An unhealthy stack will be dry or flooded [28].
Another example of a model-based approach is predictive control with Kalman filters (PCKF). One study developed a robust estimator to determine at the cathode, the state of the pressure control relief valve in the gas supply subsystem [22]. Along similar lines, another study developed a preliminary estimator to regulate, on the anode side, the level of liquid water saturation in the GDLa, where the flooding of PEMFCs that are used especially in automobiles occurs [29]. It should be remembered that the PCKF requires measuring several states with enough precision, to later use them as initial values for subsequent calculations.

2.2. Non-Model-Based Techniques

Non-model-based methods require a large amount of data and techniques of artificial intelligence, statistics, or signal processing, to be able to diagnose faults. Some artificial intelligence methods are the neural network, fuzzy logic, and neural-fuzzy network [30].
The neural network is one of the most popular to diagnose faults since it allows learning and mapping a non-linear system if you have a set of input and output data. One of the most used is the Hamming neural network (HNN), designed to recognize binary patterns.
An illustration of the neural network is the diagnostic procedure for water management (drying and flooding), which identifies some parameters, among which the diffusion time constant with values close to 0.1 s stands out. However, the article does not mention the capillary time constant (surface tension) that is the most important in the analysis of water flow, whose value normally ranges between 80 and 180 s [31]. Another example is the neural network sensor model through Nyquist diagrams for the drying or flooding states of the PEMFC, without considering the control of the humid airflow [32].
Fuzzy Logic is a classification technique that organizes information and handles the imprecision of a system by mimicking human reasoning. It can be used for pattern recognition or residue generation since it allows fuzzy data to be grouped into several groups [1]. Each group is a fuzzy set whose elements are associated with a membership function. Membership functions can be trapezoidal, linear, or curved. They are based on heuristic rules of the form IF (cause)… THEN (effect)….
Fuzzy logic is used when the processes are non-linear, subjective, or their complexity is so high that there is no precision in the mathematical models that describe them.
An illustration of fuzzy logic is the model to diagnose the hydration state of the PEMFC, considering the relative humidity in the membrane, the dynamics of the gases and the output voltage. Through gradual changes in the load and the water present in the air, the model determines whether the membrane should be flooded or dried. The results are presented using an impedance spectrum [33].
On the other hand, the air supply system to the PEMFC has characteristics of external disturbances and uncertain parameters, which make it difficult to obtain an accurate and stable model. One proposed model is an adaptive robust controller based on the type-2 fuzzy logic system, to control the excess oxygen ratio of the air supply system, validated by numerical simulation and hardware experimentation. Compared with type-1 fuzzy controller and proportional integral derivative (PID) controller, its performance is better. The model assumes that the anode pressure is controlled and that it is equal to the cathode pressure; those reagents are constantly humidified, and that high-pressure compressed hydrogen is available [34].
In the same line of controlling the air supply, using the Takagi–Sugeno fuzzy model, a moving average predictive controller has been proposed for automotive applications, which additionally suppresses fluctuations caused by load change. It is shown that the proposed method can precisely control the air supply to the desired values. The model assumes that the anode pressure is controlled and that it tracks the cathode pressure in real-time; that the reactants are humidified, that the humidity of the membrane is 100% and that there are no losses due to gas transmission [35]. Another example is an adaptive range type-2 fuzzy controller, which avoids oxygen starvation to the stack and maximizes energy production (optimizing the excess oxygen ratio). The theoretical and experimental results verified its effectiveness [36].
Neural-fuzzy integrates the adaptability of the neural network and the qualitative approach of fuzzy logic, one of the most popular being the adaptive Neuro-Logic system (ASNF). A work using a neuro-fussy model as an inference system and electrochemical impedance spectroscopy (EIS) as a sensor, allows predicting the relative humidity of a PEMFC [37].
Finally, prognostics is an engineering diagnosis method that can predict the remaining life of the system and assess its reliability. It can be model-based, non-model, or hybrid and has been applied in various areas such as telecommunications, materials, electrochemistry. An example is the prognostics method based on semi-empirical models that can predict PEMFC degradation and estimate its remaining useful life. The results show that it can achieve an accurate prediction of the degradation trend of PEMFCs, either of their complete profile or the degradation corresponding to the maximum operating current [38]. Another example in the same line is an ageing model based on prognostics and health management (PHM) technology. This model, in turn, uses physical principles based on the Butler–Volmer laws, where the voltage is a function of the current density and the physical parameters of the cell [39].

3. Real-Time Qualitative Model

The current work presents an innovative, low-cost and easy-to-implement fussy technique to detect in real-time the degree of wetting of the PEMFC membrane. It allows the detection of the conditions defined as NORMAL from the ABNORMAL (critical) condition, such as dehydration and flooding of the membrane, using time series analysis of the voltage response. The analysis makes it possible to extract the relevant characteristics of the voltage variation over time and propose a qualitative fuzzy model, classifying the state of the fuel cell [1].

3.1. Characterization Methodology

3.1.1. Experimental Setup

To model the operation of the PEMFC, an experimental station is required to measure, control, and determine the operational parameters that allow their optimal performance. The characterization is given by the polarization curves, voltage-current, obtained by the system at different experimental conditions. Figure 1 shows the PEMFC characterization system, made up of the subsystems:
  • Core processor.
  • Gas management.
  • Management of other products.
  • Electronic load.
The PEMFC used in this work was designed and built in the Renewable Energy and Hydrogen Laboratory of the Center for Automation and Robotics. Table 1 shows the dimensions of its components:
A test station with its controllers [40] was used to regulate the state variables:
  • The management of the supply of hydrogen and oxygen reactants to the anode and cathode respectively, through the flow (Q), the pressure (P) and the humification of the gases (% RH). The supply lines are separated for the safety of the system, avoiding the mixing of gases, in case a leak occurs. Additionally, the pressure regulation used avoids the condensation of the gas vapor at the outlet of the cell and consequently, it is flooding.
  • The thermal management of the cell using its temperature (T).
  • The electrical charge considering the voltage (V) and the current (I) generated by the PEMFC and, additionally, the electrical resistance (R) between the anode and the cathode.
Because the test station is modular, open, and flexible, it allows working with batteries of different sizes—whether they are hydrogen or direct methanol— and incorporating variables and new control algorithms.

3.1.2. Experimental Plan

The critical operating zones of the PEMFC are particularly linked to certain state variables (operating conditions), the power of the load, and the greater or lesser hydration of the membrane. The hydration of the membrane leads to the selection of three relevant states, corresponding to three different degrees of humidification: DRY, NORMAL, and FLOOD. The standard operating condition was used to set the NORMAL grade, while the conditions of the DRY and FLOOD states were triggered, operating the stack with a low or high-water content in its membrane. Numerous tests were carried out at atmospheric pressure and room temperature, varying flow, humidification, or temperature, alternately. In the case of humidification, the response was observed both when not humidifying the gases, and when humidifying them with different periods. In the case of flow rates, the flow rate is reduced from the initial value of 150 mL/min to 10 mL/min. The operating conditions for the three operating states are shown in Table 2.
The experimental plan was planned and executed, following the methodology for the diagnosis and detection of failures of the PEMFC [41] which consists of:
(1)
Monitoring and processing
Which consists of the generation of three types of disturbances:
  • Charging step ( Δ I ) given by a current pulse of 40 mA. The immediate response represents the resistance of the membrane (Rm) and is related to its degree of humidity.
  • Current oscillations ( f Δ I ) . In this case, the applied disturbance is a load of variable intensity (sinusoidal) in time. The applied load has a medium intensity value, to which is superimposed a low amplitude and high-frequency sinusoidal intensity value (6 mV and 4 kH, respectively).
  • Flow path (ΔQ) at the cathode, given by the experimentally obtained equation Δ Q = 2 Q r e f .
Experimentally it was applied at three different points on the V-I polarization curve:
  • In the diffusion zone that corresponds to the short-circuit current (Icc).
  • In the ohmic loss zone that corresponds to Icc/2.
  • In the activation zone corresponding to Icc/10.
15,000 samples reached a stable state in approximately 6 s and allowed obtaining global information on the electrical behavior of the PEMFC.
(2)
Characteristics extraction
Once the disturbance has ended, the evolution of the voltage over time is analyzed to extract the relevant characteristics that adequately describe the three states. These characteristics must show very similar values for a particular degree of humidification, as well as values that are sufficiently different to discriminate between the three degrees of humidification.
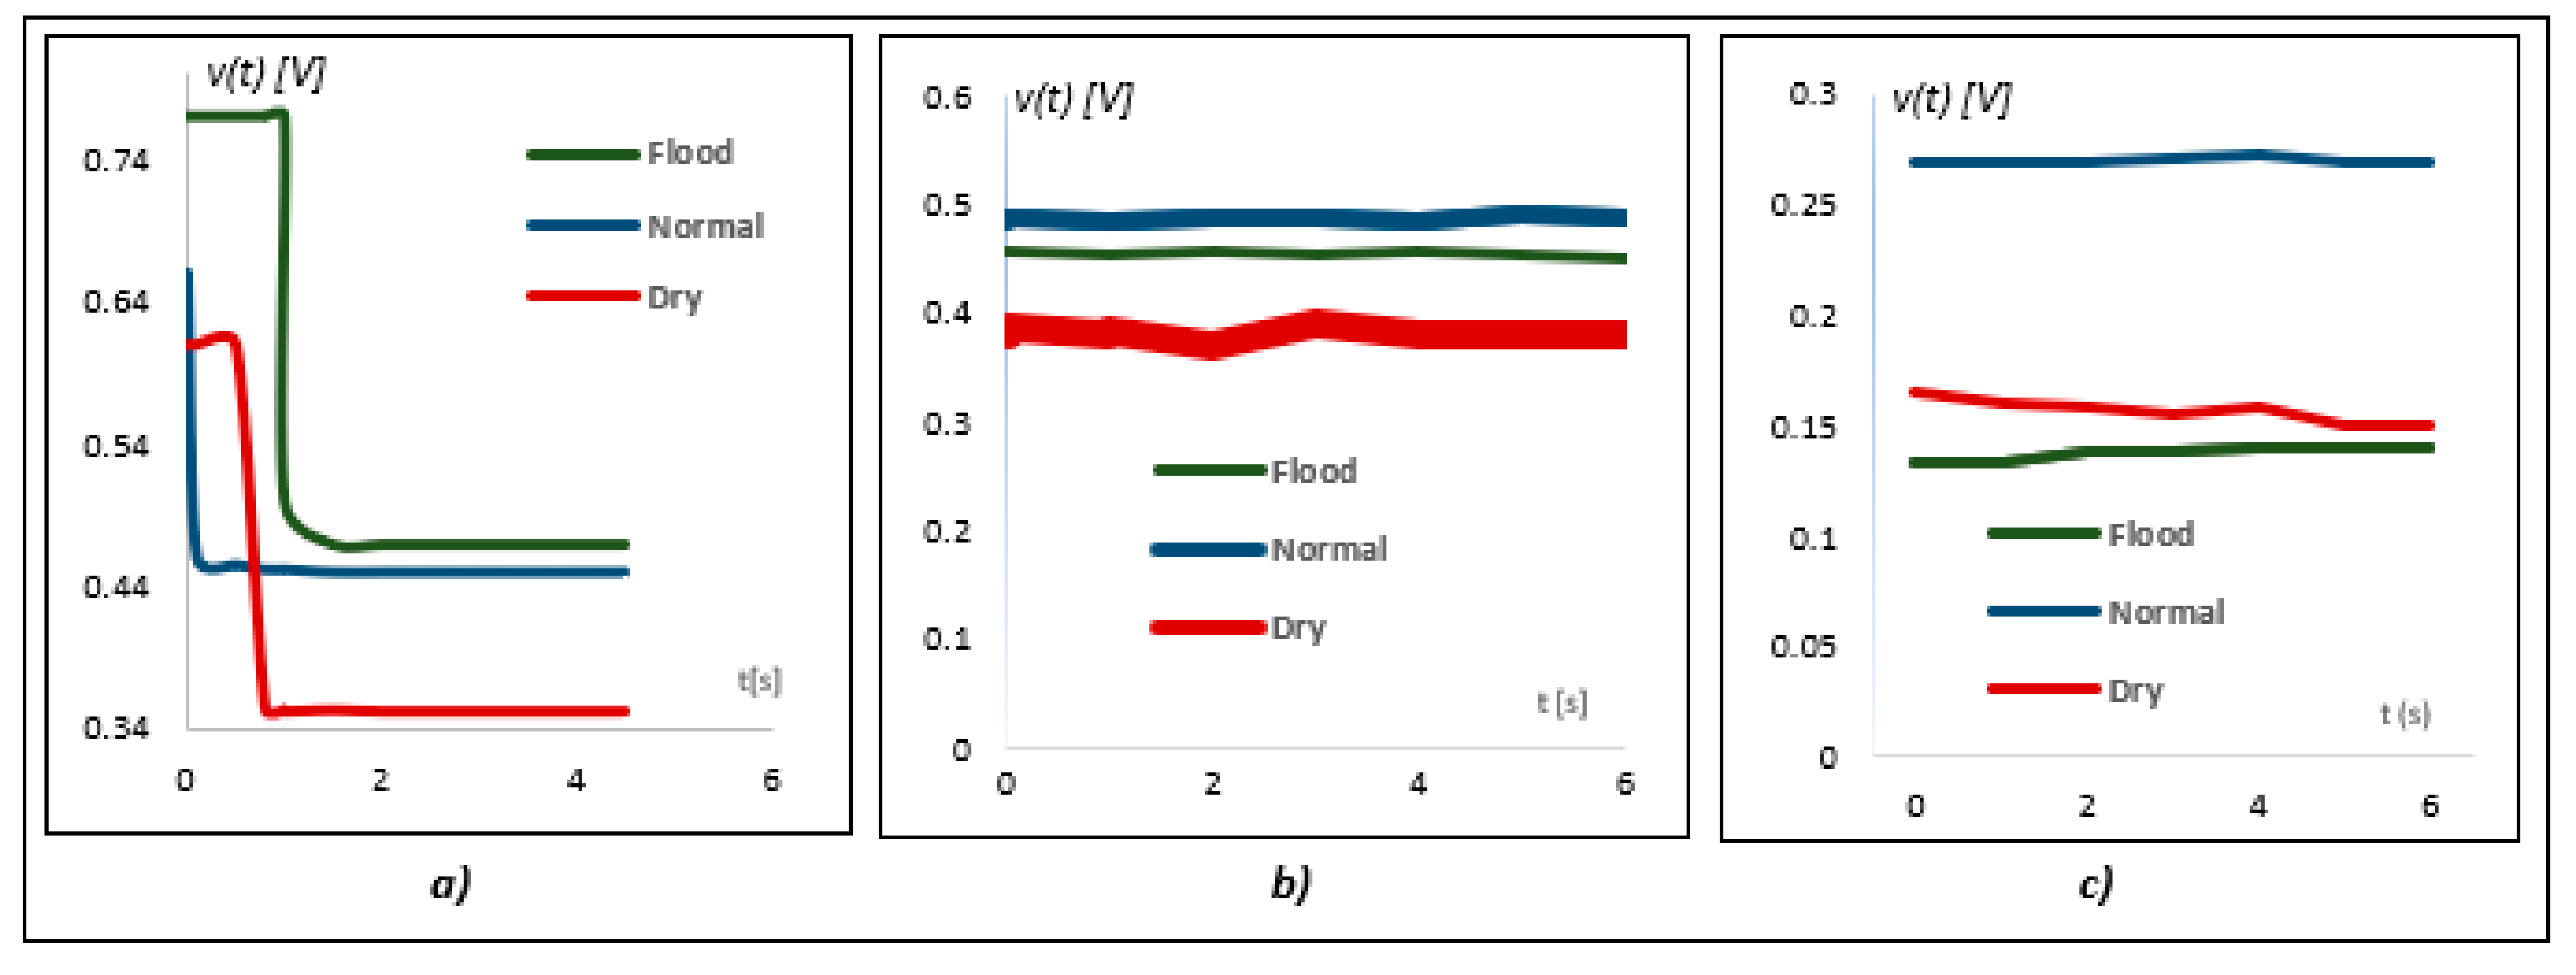
Load step: Observing Figure 2a, after applying the “load step” disturbance, a characteristic that allows discriminating between dry–normal–flooded is detected and it is the voltage jump from a high value to a low value, when the response stabilizes, so:
  • If the voltage values are normalized, they could be compared between levels and opposite directions (by increases or decreases of load) with greater reliability.
  • Fuzzy logic incorporates the inherent uncertainty of the measurements of a real system. Therefore, normalized voltages can assign:
    ·
    1 to the initial voltage.
    ·
    0 to the final voltage.
and they vary linearly with the measured voltages. Mathematically:
v n t = V ( t ) V f i n V i n i V f i n
where:
v n t :
Normalized voltage at time t.
V ( t ) :
Voltage measured at time t.
V i n i :
Initial voltage averaged from various samples.
V f i n :
Final voltage averaged after 15,000 samples (stabilized signal).
Current oscillations: Observing Figure 2b, after applying the “current oscillation” disturbance a characteristic is detected that allows discriminating between dry-normal-flooded, the higher the humidity the smaller the voltage fluctuation.
  • This characteristic is the amplitude of the oscillation. Its value is calculated from the moving standard deviation (σv), for segments of n samples, (n < N) that are averaged in the form:
    σ v = i = 1 N = n i = 1 n [ V ( i ) V ¯ ] 2 n N n
    where V ¯ is the average voltage of n samples and N is the total number of samples.
Flow step: The flow increases (Figure 2c) produce decreases in the voltage values of the fuel cells, just the opposite of the previous experiment.
  • The voltage that corresponds to a jump in the flow is:
    Δ V = V f i n V i n i f
    where V f i n is the voltage after the disturbance, V i n i the voltage before the disturbance and f is the correction factor of the signal.
(3)
Feature reduction
The relevant characteristics that are selected are:
  • SLOPE CHANGE ( Δ P ) : Which is the point where the normalized voltage changes its slope (after a charge step) and which corresponds to the electrical response speed of the fuel cell. This is because normalization failed to properly separate the three states.
  • VOLTAGE OSCILLATION ( σ v ) : Which is the amplitude of the oscillation after applying the disturbance “current oscillation”. This characteristic is selected because the sensitivity to a disturbance of the loading passage is directly related to the water content of the membrane.
  • VOLTAGE DELTA ( Δ V ) : : The physical meaning of this parameter is direct, that is, the change in voltage with a change inflow, and its value varies depending on the water content in the membrane.
(4)
Failure classification
The fuzzy logic allows characterizing in real-time the degree of hydration of the PEMFC membrane. The estimation of the water contents is accompanied by transients in the voltage. The selected characteristics are defined as fuzzy variables. Their values are defined using fuzzy sets that have gradual transitions between them defined by trapezoidal functions (Figure 3).
The values of the membership functions of the linguistic variables (high, medium, and low) corresponding to the three characteristics, have the same profile and the same number of values (fuzzy sets), but different numerical values of the parameters that define the function trapezoidal: V1, V2, V3, and V4. The values of these four parameters are shown in Table 3.
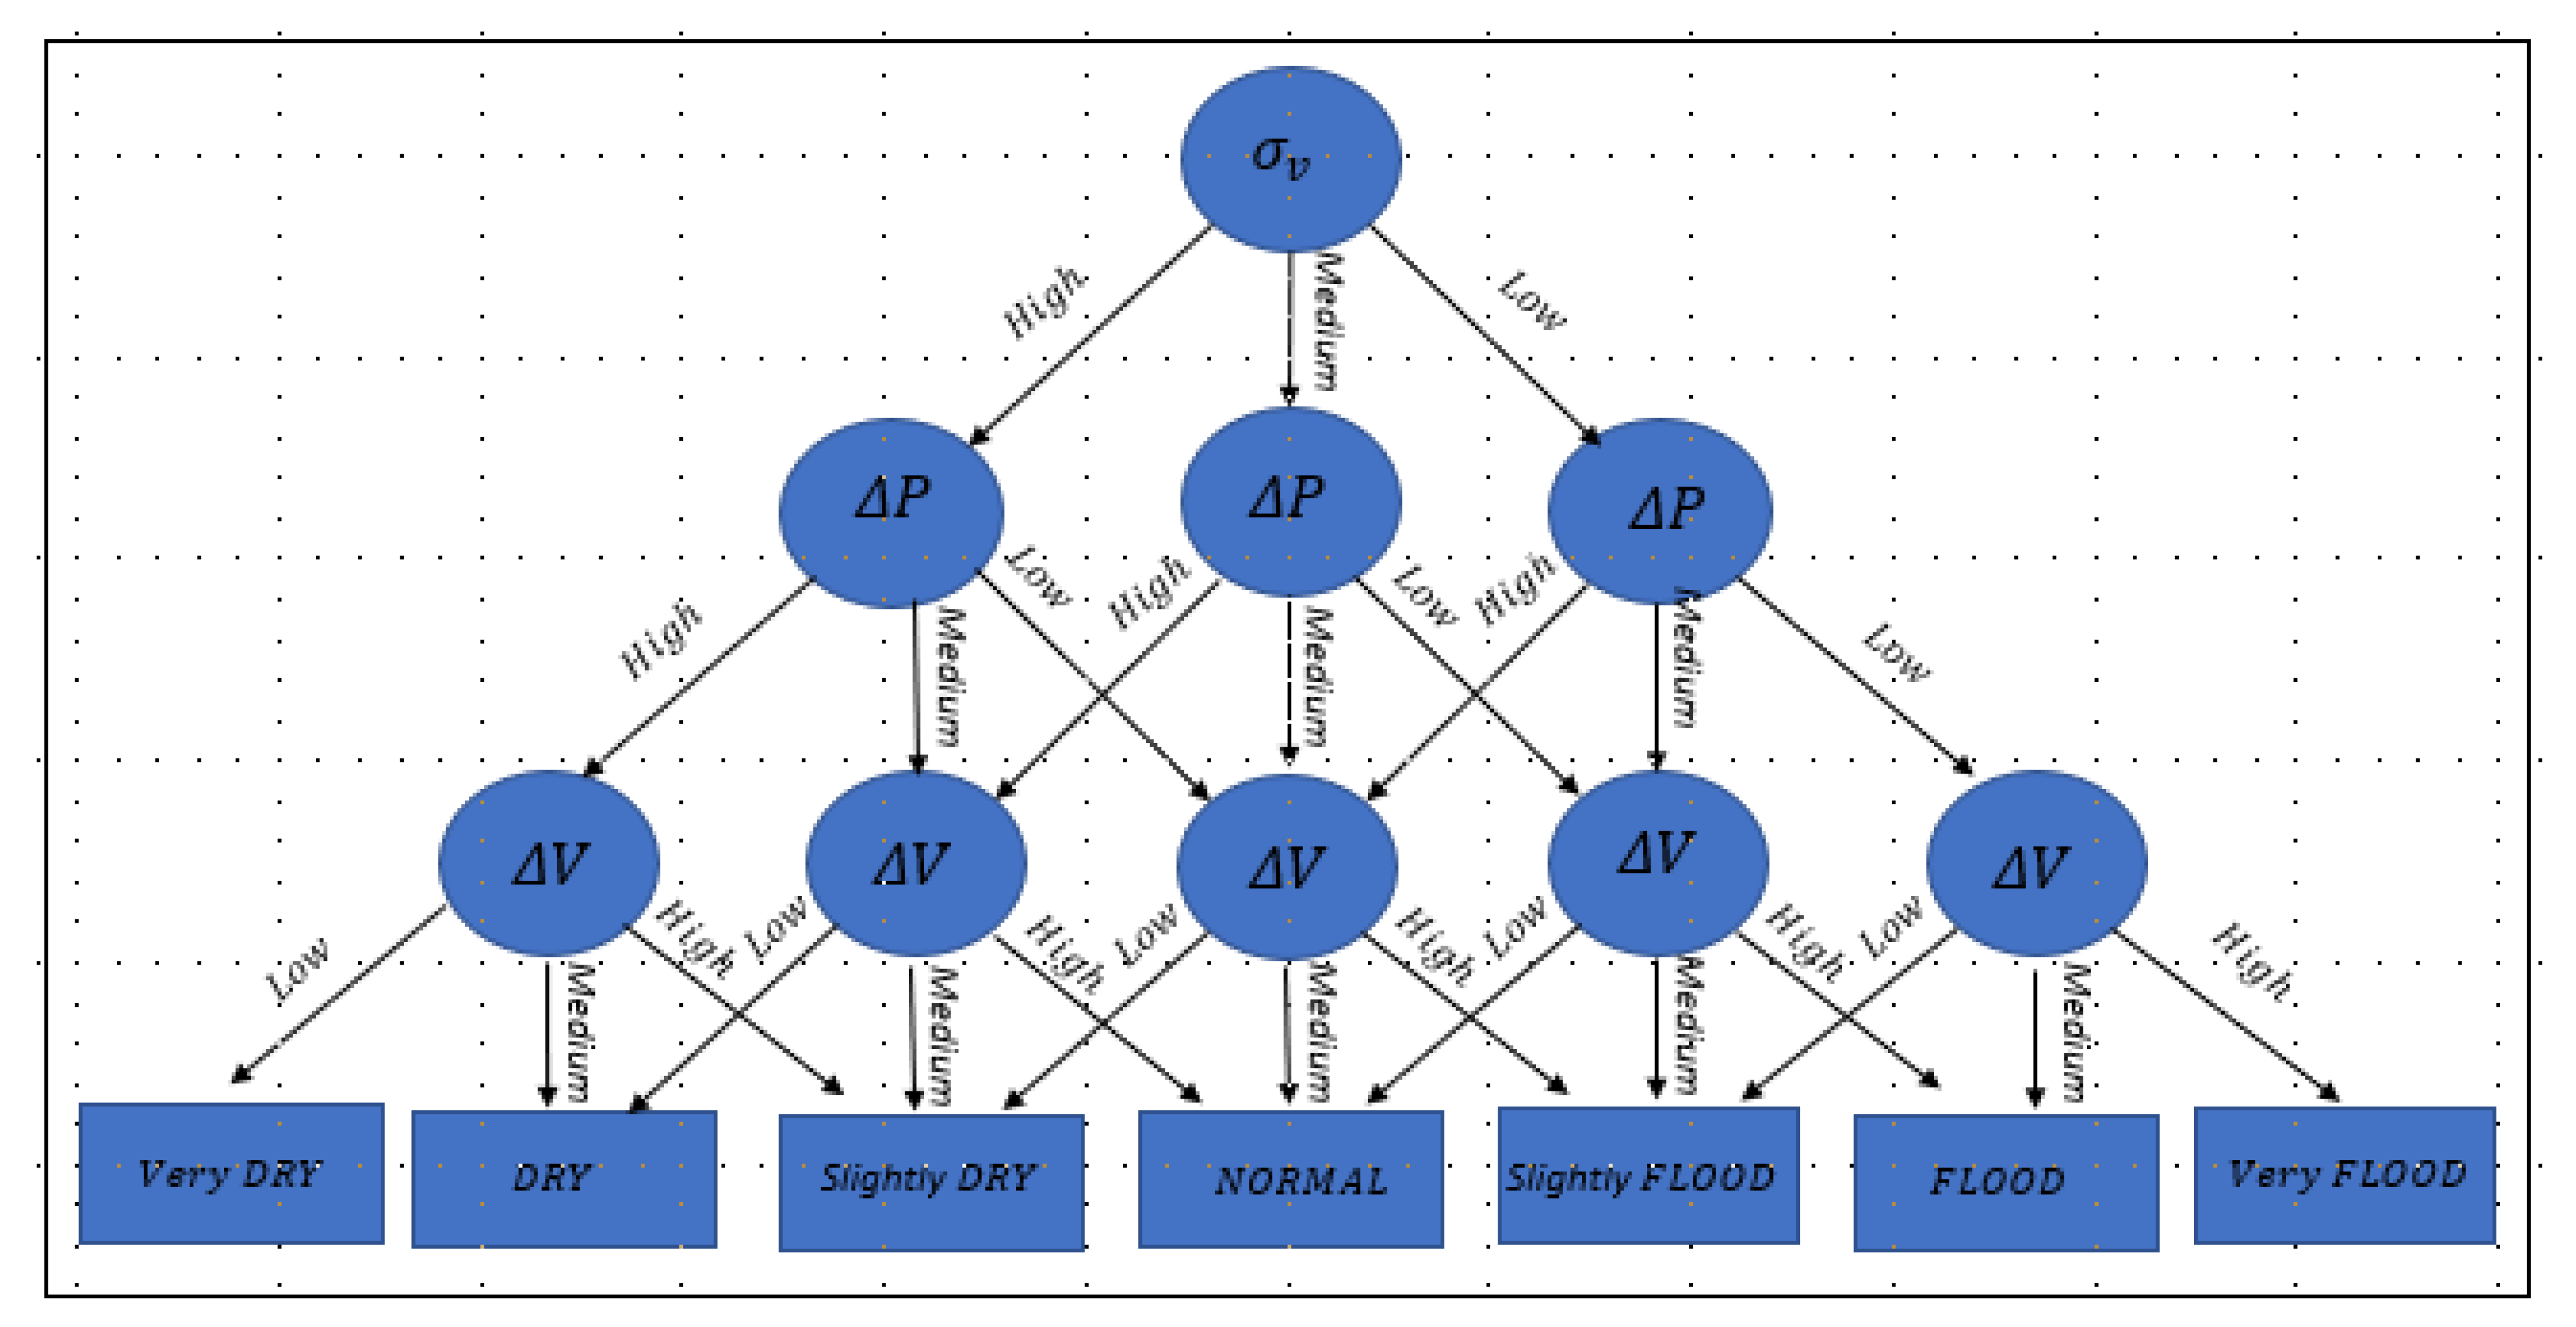
The membership function of a set indicates the degree to which each element of the variable voltage belongs to the set. The implementation of the fuzzy logic methodology is done through the fuzzy decision tree. In the current application, the evaluation criterion is discrimination, so the VOLTAGE OSCILLATION characteristic has the highest priority and is therefore at the root node.
From this node, depending on the membership values that correspond to the highest priority parameter, one or another branch of the fuzzy decision tree advances until it reaches a terminal node, finally reaching one of the seven states… very dry, dry, slightly dry, normal, slightly flood, flood and very flood (Figure 4). Since a high degree of resolution is not required (for the slightly dry and slightly flood states), and because the control tactics to get out of critical situations are similar (for the very dry-dry and very flood-flood states) they come together with the classes that appear at the extremes, leaving only the DRY, NORMAL, and FLOOD states.

4. Results and Discussion

4.1. Results Analysis

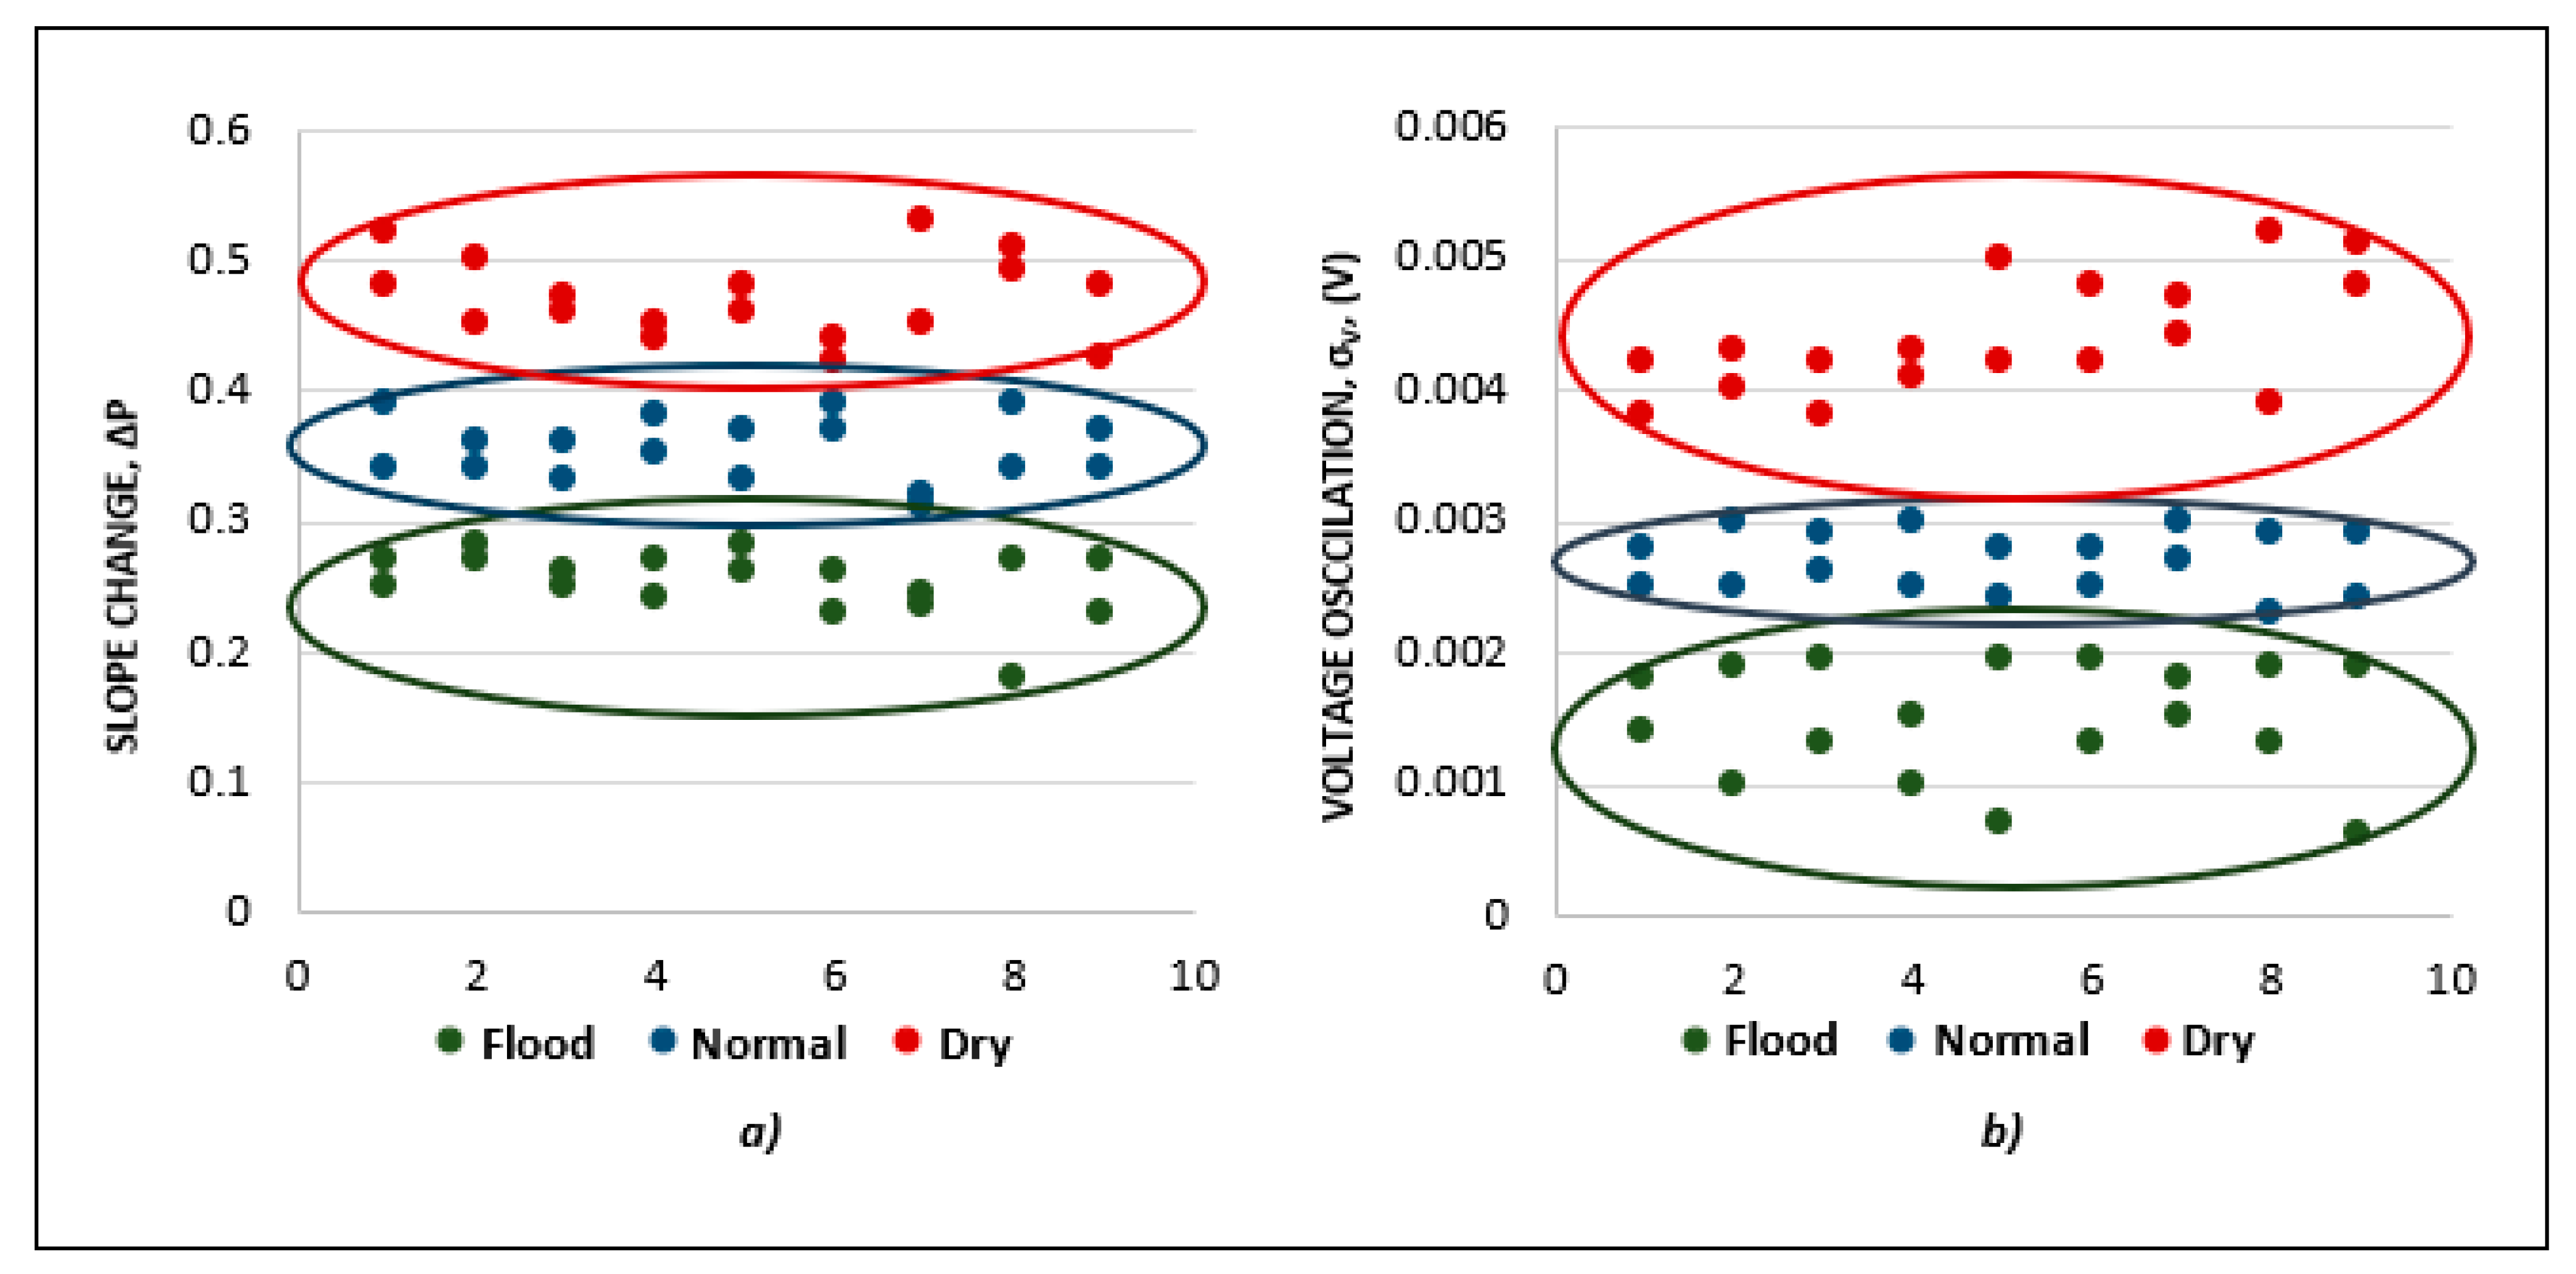
Multiple experimentation sessions were carried out taking the PEMFC to the three initially defined operating states (dry, normal, and flooded), to adjust the limits of the blurred labels (LOW, MEDIUM, and HIGH) corresponding to each of the characteristics selected. The results confirm that the characteristics of SLOPE CHANGE and VOLTAGE OSCILLATION are the priority ones and therefore their correct location in the decision tree. Figure 5 illustrates the power of discrimination:
  • In the SLOPE CHANGE characteristic (Figure 5a), the results are shown for different experimentation sessions before a load step disturbance. The characteristic allows three groups to be identified without overlapping between them, becoming a good discriminator between the operating states of the cell (flooded, normal, and dry). Physically, this parameter (change in slope before load step) corresponds to the instantaneous electrical response of the PEMFC and is directly related to the water content in the membrane.
  • In the VOLTAGE OSCILLATION characteristic (Figure 5b), the reproducibility of the results of the characteristic voltage oscillation amplitude in the three operating states of the PEM cell is observed. Although in the flooded state there are significant differences between different experimentation sessions, this difference is due to slightly different initial conditions of the water content in the membrane. It is confirmed that the reproducibility is sufficient to be able to adequately discern the state with this characteristic since there is no overlap between the three classes (states).
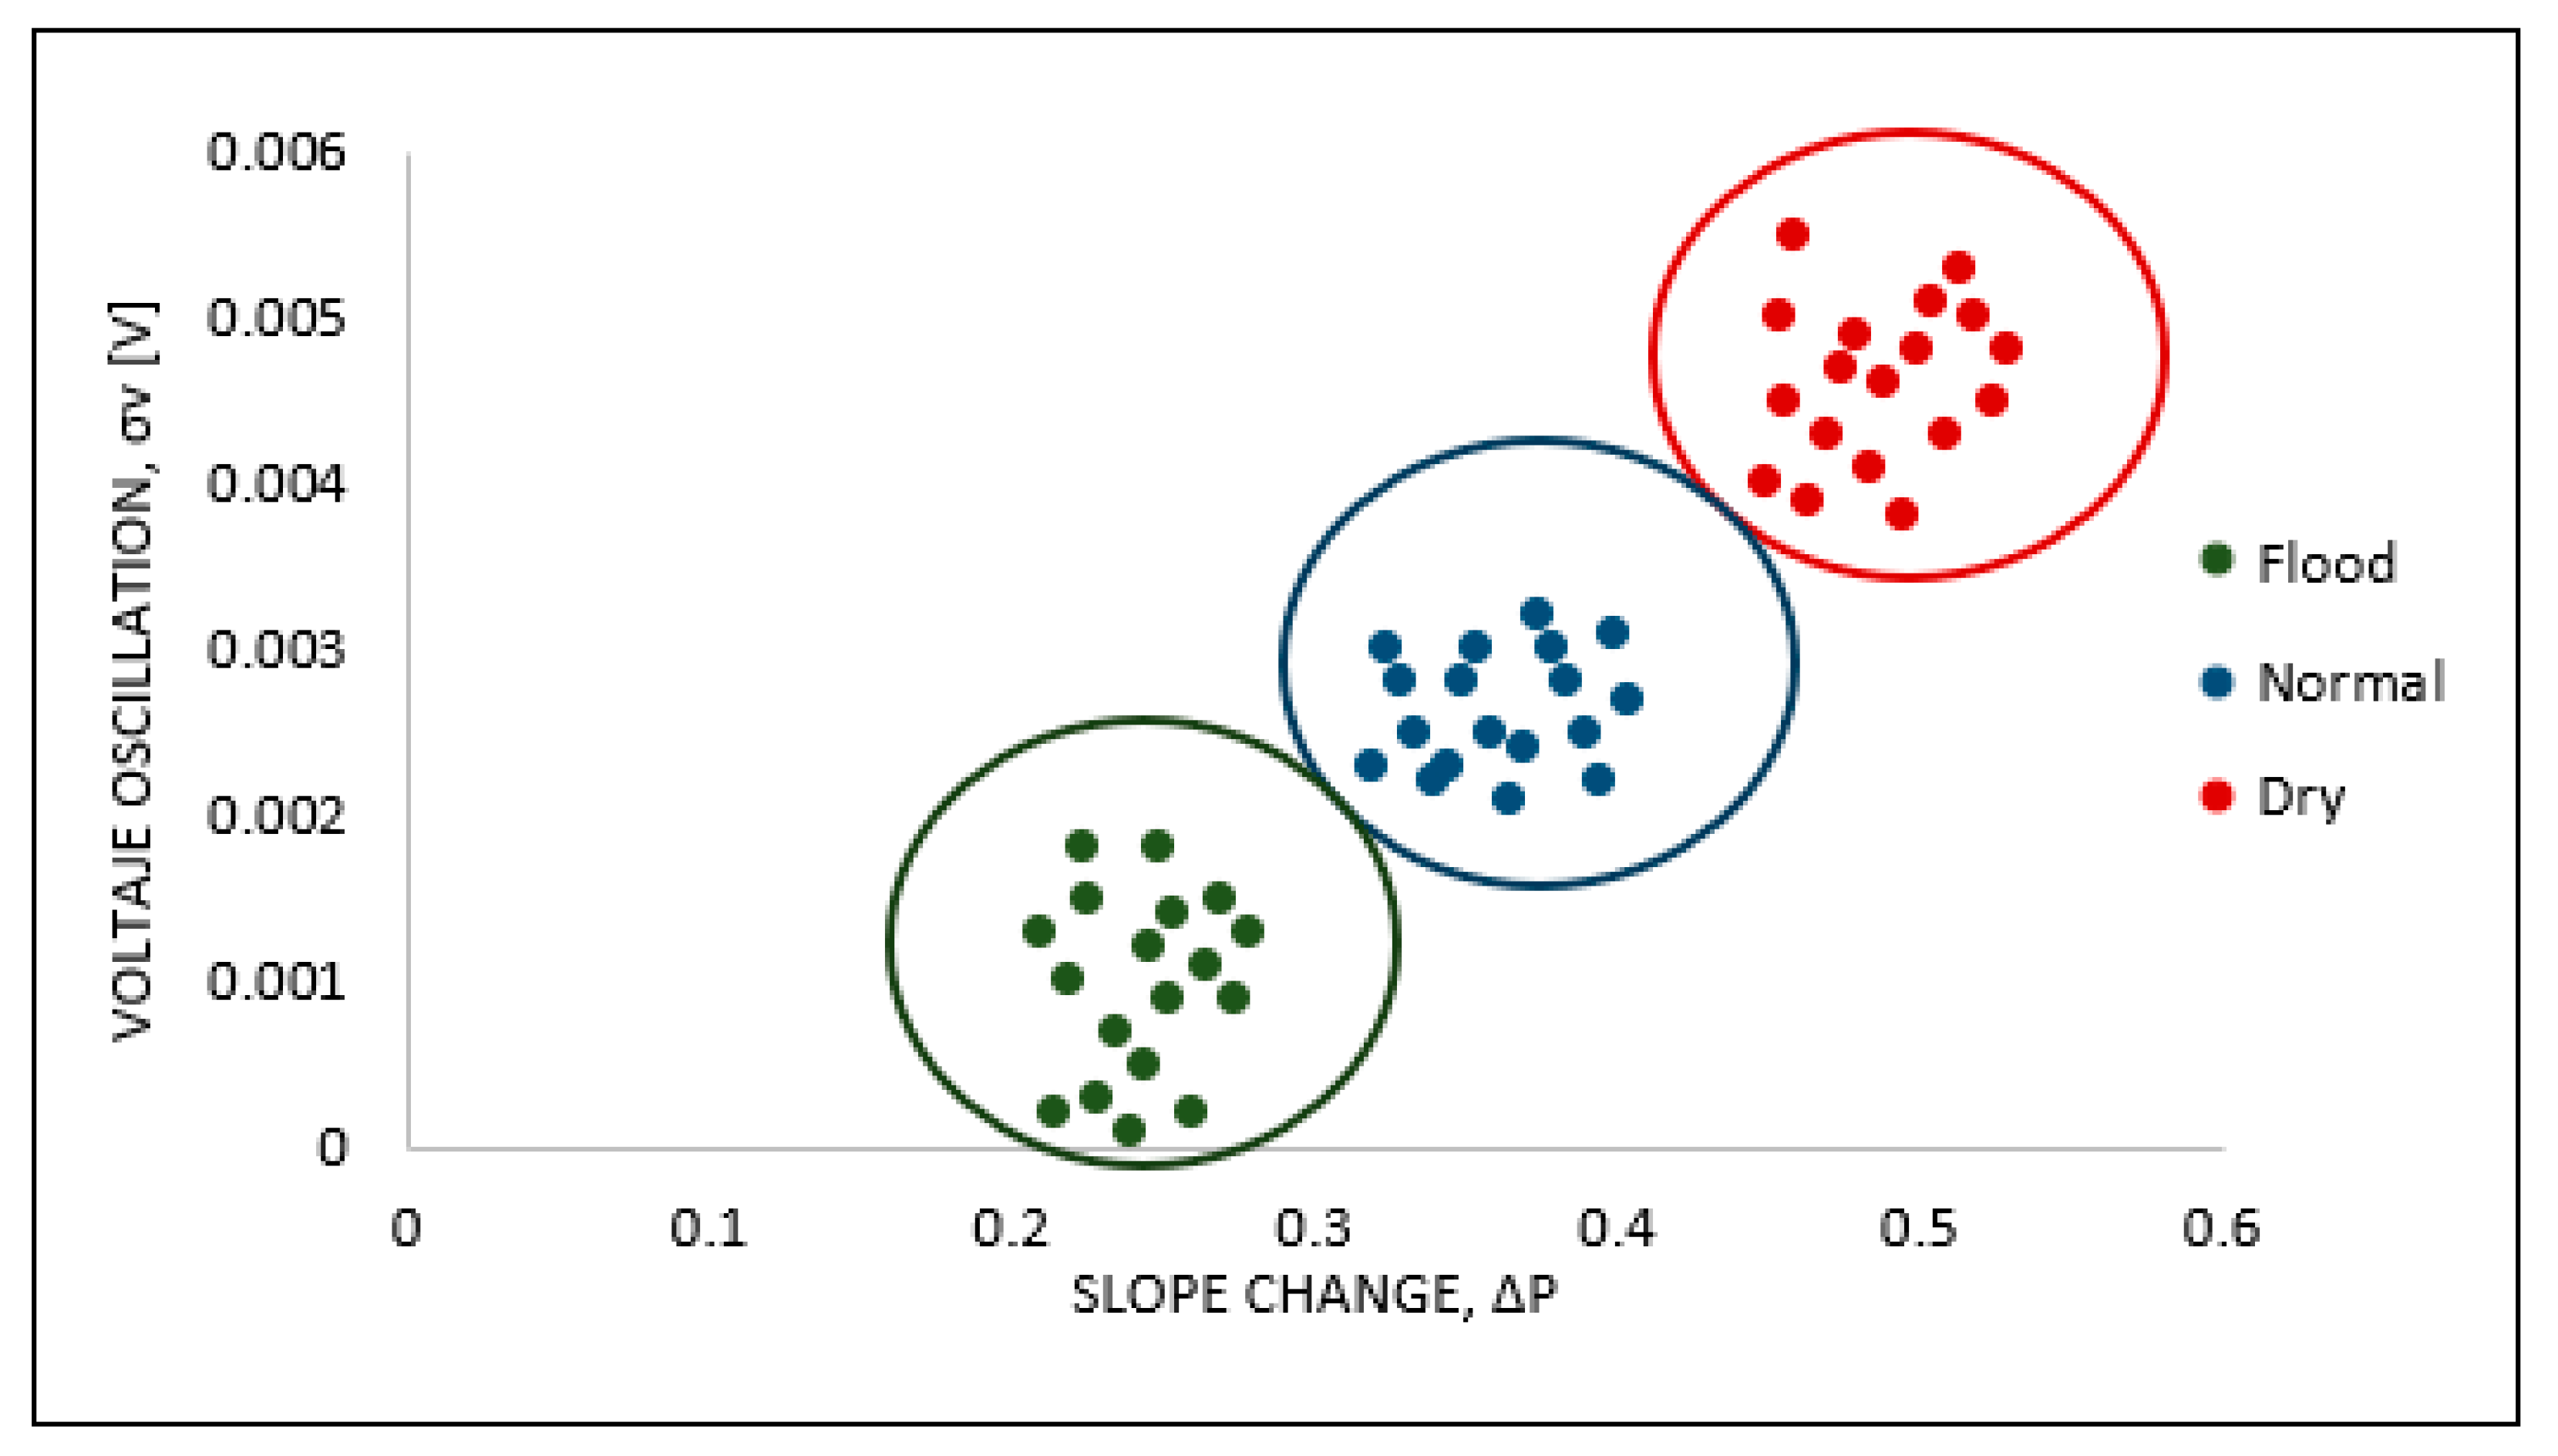
The joint discrimination power of the two selected characteristics is shown in Figure 6, where:
  • The three degrees of humidification are separated: The highest values in both characteristics correspond to DRY, the average values to NORMAL and the lowest values to FLOOD.
  • The results follow the algorithm selected for the fuzzy decision tree. Another combination could present greater uncertainty and would correspond to intermediate regions in the figure.
Correlating the model with real data, in Figure 7 different V-I polarization curves are observed.
Figure 7 in turn provides a proof of concept that using this fuzzy method can better regulate water transport in the PEMFC. Starting from the dry state (Test 1), the low performance of the battery can be observed when supplying 60 mA. As humidified gas is introduced with a humidification time of 100%, it is observed that the response improves (from Test 2 to Test 8), in such a way that, when it reaches the optimal conditions of electricity generation, the separation between curves consecutive V-I is decreasing. In the curve of Test 9, a voltage drop is observed as the stack is going from a normal state to a slightly flooded state. In the curve of Test 10, a recovery of the electrical response of the pile is observed, probably due to the disturbance of the two-minute flow jump, when dragging the water from the stack.

4.2. Results Validation

Electrochemical impedance spectroscopy (EIS) is used to validate the methodology for estimating the degree of humidification of the PEM fuel cell proposed here. The impedance spectra for the DRY, NORMAL, and FLOOD grade are shown in Figure 6. The results that validate it are:
  • The membrane resistance (Rm) is higher in the DRY state.
  • The FLOOD state has a slight overlap with the NORMAL.
Of the impedance curves in Figure 8, the farthest from the imaginary axis is the DRY state. Its resistive value is the one that corresponds to the zero-crossing point with the real axis and indicates that the resistance of the membrane increases if it is dry.
For experimental reasons, a minimum frequency of 100 Hz was used since lower values produced incorrect measurements and stagnation in the frequency sweep. The maximum frequency was limited to 1 MHz. The sweep was downward, motivated by problems in the polarization of the membrane due to the deposit of ions on the electrodes. A voltage of 100 mV was used as the lower limit for the excitation signal in the PEM cell. The negative part of the spectrum in Figure 8 is the inductance that corresponds to the collector plates of the battery.
The equivalent circuit to extract the data is shown in Figure 9.
Physically:
Rm: Electrical resistance associated with the membrane.
L: Inductance associated with the collector plates.
Q1: Pseudo capacitance associated with the charge transport process at the electrode–membrane interfaces (electrochemical double layer).
R1: Resistance associated with the charge transport process at the electrode–membrane interfaces.
Q2: Pseudo capacitance associated with the mass transport process (adsorption and diffusion).
R2: Electrical resistance associated with the mass transport process (adsorption and diffusion). It only appears if the injected gas is hydrogen since in the case of air it presents unacceptable errors.
The data to obtain the EIS (O2/O2, T = 50 °C) are shown in Table 4.

5. Conclusions

The implementation of a methodology for the diagnosis and detection of failures of the PEMFC has been presented, using the fuzzy decision tree technique. From the generation of three types of disturbances (load step, current oscillation, and flow step), two characteristics SLOPE CHANGE and VOLTAGE OSCILLATION were selected to detect in real-time if the battery is in the DRY, NORMAL state, or FLOOD. The results show that the discrimination power of the two characteristics is very high, without any overlap (ambiguities). This can be seen in Figure 5, where the separation of the data between dry–normal–flood is observed. The results were validated using Electrochemical impedance spectroscopy, which shows us at the zero-crossing with the real axis, the resistive values of the PEMFC of the three states, the resistance being higher in the dry state.
The approximate reasoning model in the control of the degree of wetting of the PEM cell allows addressing the non-linearities of the electrical behavior of the cell, the imprecision of the real world and an autonomous and optimal control in real-time, of the performance of the PEMFC, by incorporating control actions that avoid their critical states.
Finally, this work constitutes a step towards the progressive automation of the supervision, perception, and intelligent control of fuel cells, allowing them to reduce their risks and increase their economic benefits.

6. Future Works

One of the critical issues in the operation of the PEMFC is the water content in the membrane, which is what was analyzed in this work. However, water does not only accumulate on the membrane, so future work would be:
  • Design a robust model that considers the physical processes of transport and distribution of water in humidifiers, in catalytic layers, in the membrane, in gas diffusing layers, inflow channels; as a function of the humidity of the inlet gas, the porous structure of the electrodes, the composition of the membrane, the diffusion in the gas diffusing layers, the capillary pressure and the heat transfer.
  • The robust model can involve in your solution:
    • Fuzzy logic methods.
    • Numerical simulations using the volume of fluid (VOF) in computational fluid dynamics (CFD).
    • Lattice–Boltzmann methods.
    • Eulerian–Lagrangian methods (Eulerian for air and Lagrangian for water).

Author Contributions

Investigation, G.A.R.; supervision, W.E.A. Both authors have read and agreed to the published version of the manuscript.

Funding

This research received no external funding.

Institutional Review Board Statement

This research received no external funding.

Informed Consent Statement

Not applicable.

Conflicts of Interest

The authors declare no conflict of interest.

Abbreviations

CFDComputational fluid dynamics
CLaCatalyst layer anode
CLcCatalyst layer cathode
CLCatalyst layer
GDLaGas diffusion layer (anode)
GDLGas diffusion layer
PEMFCProton exchange membrane fuel cell
VOFVolume of fluid
HNNHamming neural network
PCKFPredictive control with Kalman filters
EISElectrochemical impedance spectroscopy
ASNFAdaptive Neuro-Logic system
PHMPrognosis and health management

References

  1. Rubio, A.; Agila, W.; Miranda, L.; Lima, B. Real-Time Qualitative Model for Estimate Water Content in PEM Fuel Cell. In Proceedings of the 2019 8th International Conference on Renewable Energy Research and Applications (ICRERA), Brasov, Romania, 3–6 November 2019; pp. 455–459. [Google Scholar]
  2. Nguyen, T.-T.; Martin, V.; Malmquist, A.; Silva, C.A. A review on technology maturity of small scale energy storage technologies. Renew. Energy Environ. Sustain. 2017, 2, 36. [Google Scholar] [CrossRef] [Green Version]
  3. Rubio, A.; Agila, W. Sustainable Energy: A Strategic Overview of Fuel Cells. In Proceedings of the 2019 8th International Conference on Renewable Energy Research and Applications (ICRERA), Brasov, Romania, 3–6 November 2019; pp. 239–243. [Google Scholar]
  4. Rubio, A.; Agila, W. A Novel System-Level Model for a Fuel Cell in a Strategic Context. In Proceedings of the 2018 7th International Conference on Renewable Energy Research and Applications (ICRERA), Paris, France, 14–17 October 2018; pp. 1044–1048. [Google Scholar]
  5. Töpler, J. Hydrogen as energy-storage-medium and fuel-A strong partner of renewable energies. Renew. Energy Environ. Sustain. 2016, 1, 31. [Google Scholar] [CrossRef]
  6. Bezdek, R.H. The hydrogen economy and jobs of the future. Renew. Energy Environ. Sustain. 2019, 4, 1. [Google Scholar] [CrossRef]
  7. Al-hadeethi, O. Numerical Investigation of the Effect of Operating Temperature and Relative Humidity on the Pem Fuel Cell Performance. Ph.D. Thesis, Karabuk University, Karabuk, Turkey, 2020. [Google Scholar]
  8. Lee, N.; Kim, Y.; Kim, M.; Kim, M. Numerical analysis on the effect of voltage change on removing condensed water inside the GDL of a PEM fuel cell. J. Mech. Sci. Technol. 2016, 30, 4383–4390. [Google Scholar] [CrossRef]
  9. Jarauta, A.; Ryzhakov, P.; Secanell, M.; Waghmare, P.R.; Pons-Prats, J. Numerical study of droplet dynamics in a polymer electrolyte fuel cell gas channel using an embedded Eulerian-Lagrangian approach. J. Power Sources 2016, 323, 201–212. [Google Scholar] [CrossRef] [Green Version]
  10. Zhang, G.; Jiao, K. Multi-phase models for water and thermal management of proton exchange membrane fuel cell: A review. J. Power Sources 2018, 391, 120–133. [Google Scholar] [CrossRef]
  11. Khazaee, I. Experimental investigation and numerical comparison of the performance of a proton exchange membrane fuel cell at different channel geometry. Heat Mass Transf. 2015, 51, 1177–1187. [Google Scholar] [CrossRef]
  12. Ashrafi, M.; Shams, M.; Bozorgnezhad, A.; Ahmadi, G. Simulation and experimental validation of droplet dynamics in microchannels of PEM fuel cells. Heat Mass Transf. 2016, 52, 2671–2686. [Google Scholar] [CrossRef]
  13. Gao, F.; Kabalo, M.; Rylko, M.; Blunier, B.; Miraoui, A. Fuel cell system. In Power Electronics for Renewable and Distributed Energy Systems; Springer: London, UK, 2013; pp. 185–234. [Google Scholar]
  14. Lei, H.; Huang, H.; Li, C.; Pan, M.; Guo, X.; Chen, Y.; Liu, M.; Wang, T. Numerical simulation of water droplet transport characteristics in cathode channel of proton exchange membrane fuel cell with tapered slope structures. Int. J. Hydrog. Energy 2020, 45, 29331–29344. [Google Scholar] [CrossRef]
  15. Kim, E.-Y.; Yim, S.-D.; Bae, B.; Yang, T.-H.; Park, S.-H.; Choi, H.-S. Study of a highly durable low-humidification membrane electrode assembly using crosslinked polyvinyl alcohol for polymer electrolyte membrane fuel cells. J. Solid State Electrochem. 2016, 20, 1723–1730. [Google Scholar] [CrossRef]
  16. Jiao, K.; Lee, X. Water transport in polymer electrolyte membrane fuel cells. Prog. Energy Combust. Sci. 2011, 37, 221–291. [Google Scholar] [CrossRef]
  17. Lee, J.-B.; Oh, I.H. Electrochemical characteristics and interfacial contact resistance of multi-layered Ti/TiN coating for metallic bipolar-plate of polymer electrolyte membrane fuel cells. Met. Mater. Int. 2014, 20, 629–639. [Google Scholar] [CrossRef]
  18. Jeon, D.H. Effect of gas diffusion layer thickness on liquid water transport characteristics in polymer electrolyte membrane fuel cells. J. Power Sources 2020, 475, 228578. [Google Scholar] [CrossRef]
  19. Gholizadeh, M.; Ghazikhani, M.; Khazaee, I. Experimental study of humidity changes on the performance of an elliptical single four-channel PEM fuel cell. Heat Mass Transf. 2016, 53, 233–239. [Google Scholar] [CrossRef]
  20. Sinha, V.; Mondal, S. Recent development on performance modelling and fault diagnosis of fuel cell systems. Int. J. Dyn. Control 2017, 6, 511–528. [Google Scholar] [CrossRef]
  21. Hernandez, A.; Outbib, R.; Hissel, D. Fault Diagnosis of PEM Fuel Cell. In PEM Fuel Cells with Bio-Ethanol Processor Systems; Springer: London, UK, 2012; pp. 151–183. [Google Scholar]
  22. Hähnel, C.; Aul, V.; Schultze, M.; Horn, J. State estimation of exhaust valve position by Kalman Filter in PEM fuel cell system. In Proceedings of the 2015 International Conference on Renewable Energy Research and Applications (ICRERA), Palermo, Italy, 22–25 November 2015; pp. 590–595. [Google Scholar]
  23. Mogorosi, K.; Oladiran, M.T.; Rakgati, E. Mathematical Modelling and Experimental Investigation of a Low Temperature Proton Exchange Membrane Fuel Cell. Energy Power Eng. 2020, 12, 653–670. [Google Scholar] [CrossRef]
  24. Futter, G.A.; Gazdzicki, P.; Friedrich, K.A.; Latz, A.; Jahnke, T. Physical modeling of polymer-electrolyte membrane fuel cells: Understanding water management and impedance spectra. J. Power Sources 2018, 391, 148–161. [Google Scholar] [CrossRef]
  25. Zlobinski, M. Investigation of Water and Gas Distribution in Proton Exchange Membrane Water Electrolyzer. Ph.D. Thesis, ETH Zurich, Zurich, Switzerland, 2021. [Google Scholar]
  26. Lee, C.; Lee, J.; Zhao, B.; Fahy, K.; LaManna, J.; Baltic, E.; Hussey, D.; Jacobson, D.; Schulz, V.; Bazylak, A. Temperature-dependent gas accumulation in polymer electrolyte membrane electrolyzer porous transport layers. J. Power Sources 2020, 446, 227312. [Google Scholar] [CrossRef]
  27. Minard, K.R.; Viswanathan, V.V.; Majors, P.D.; Wang, L.-Q.; Rieke, P.C. Magnetic resonance imaging (MRI) of PEM dehydration and gas manifold flooding during continuous fuel cell operation. J. Power Sources 2006, 161, 856–863. [Google Scholar] [CrossRef]
  28. Le Ny, M.; Chadebec, O.; Cauffet, G.; Rosini, S.; Bultel, Y. PEMFC stack diagnosis based on external magnetic field measurements. J. Appl. Electrochem. 2015, 45, 667–677. [Google Scholar] [CrossRef]
  29. Xu, L.; Hu, Z.; Fang, C.; Li, J.; Hong, P.; Jiang, H.; Guo, D.; Ouyang, M. Anode state observation of polymer electrolyte membrane fuel cell based on unscented Kalman filter and relative humidity sensor before flooding. Renew. Energy 2020, 168, 1294–1307. [Google Scholar] [CrossRef]
  30. Rubio, A.; Agila, W. Dynamic Model of Proton Exchange Membrane Fuel Cells: A Critical Review and a Novel Model. In Proceedings of the 2019 8th International Conference on Renewable Energy Research and Applications (ICRERA), Brasov, Romania, 3–6 November 2019; pp. 353–358. [Google Scholar]
  31. Laribi, S.; Mammar, K.; Sahli, Y.; Koussa, K. Analysis and diagnosis of PEM fuel cell failure modes (flooding & drying) across the physical parameters of electrochemical impedance model: Using neural networks method. Sustain. Energy Technol. Assess. 2019, 34, 35–42. [Google Scholar] [CrossRef]
  32. Arama, F.Z.; Mammar, K.; Laribi, S.; Necaibia, A.; Ghaitaoui, T. Implementation of sensor based on neural networks technique to predict the PEM fuel cell hydration state. J. Energy Storage 2020, 27, 101051. [Google Scholar] [CrossRef]
  33. Mammar, K.; Saadaoui, F.; Laribi, S. Design of a PEM fuel cell model for flooding and drying diagnosis using fuzzy logic clustering. Renew. Energy Focus 2019, 30, 123–130. [Google Scholar] [CrossRef]
  34. Zhang, H.; Wang, Y.; Wang, D. Adaptive robust control of oxygen excess ratio for PEMFC system based on type-2 fuzzy logic system. Inf. Sci. 2020, 511, 1–17. [Google Scholar] [CrossRef]
  35. Yang, D.; Pan, R.; Wang, Y.; Chen, Z. Modeling and control of PEMFC air supply system based on T-S fuzzy theory and predictive control. Energy 2019, 188, 116078. [Google Scholar] [CrossRef]
  36. Luo, G.; Ma, B.; Wang, Z.; Yin, L.; Wang, Y. Model-free adaptive control for the PEMFC air supply system based on interval type-2 fuzzy logic systems. J. Renew. Sustain. Energy 2020, 12, 064301. [Google Scholar] [CrossRef]
  37. Mammar, K.; Laribi, S. Application of Adaptive Neuro-Fuzzy Inference System Techniques to Predict Water Activity in Proton Exchange Membrane Fuel Cell. J. Electrochem. Energy Convers. Storage 2018, 15, 041009. [Google Scholar] [CrossRef]
  38. Ou, M.; Zhang, R.; Shao, Z.; Li, B.; Yang, D.; Ming, P.; Zhang, C. A novel approach based on semi-empirical model for degradation prediction of fuel cells. J. Power Sources 2021, 488, 229435. [Google Scholar] [CrossRef]
  39. Lechartier, E.; Gouriveau, R.; Péra, M.C.; Hissel, D.; Zerhouni, N. Towards an Ageing Model of a PEMFC for Prognostics Purpose. In Proceedings of the International Discussion on Hydrogen Energy and Application (IDHEA), Nantes, France, 12–14 May 2014; pp. 1–7. [Google Scholar]
  40. Guinea, D.; Agila, W.; Villanueva, E.; García-Alegre, M.; Guinea, D. Test Station for Proton-Exchange-Membrane Fuel-Cells characterization. Patent in Spain ES 2342797, 2007. [Google Scholar]
  41. Zheng, Z.; Petrone, R.; Péra, M.; Hissel, D.; Becherif, M.; Pianese, C.; Steiner, N.Y.; Sorrentino, M. A review on non-model based diagnosis methodologies for PEM fuel cell stacks and systems. Int. J. Hydrog. Energy 2013, 38, 8914–8926. [Google Scholar] [CrossRef]
Figure 1. The experimental setup.
Processes 09 00904 g001
Figure 2. Temporal evolution of the PEMFC voltage for the three humidification degrees and under different disturbances. (a) Load step. (b) Current oscillations. (c) Flow step.
Processes 09 00904 g002
Figure 3. Classification of failures (Fuzzy variables).
Processes 09 00904 g003
Figure 4. Fuzzy decision tree to estimate the operational status of the PEMFC.
Processes 09 00904 g004
Figure 5. Model to estimate water in the PEMFC. (a) SLOPE CHANGE. (b) VOLTAGE OSCILLATION.
Processes 09 00904 g005
Figure 6. Model for estimating water in PEMFC.
Processes 09 00904 g006
Figure 7. V-I polarization curves of the PEMFC, for different states.
Processes 09 00904 g007
Figure 8. Complex impedance spectra for the three-humidification degree of the PEMFC.
Processes 09 00904 g008
Figure 9. PEMFC equivalent electrical circuit.
Processes 09 00904 g009
Table 1. Single-cell components dimensions.
ComponentThickness (mm)Area (mm × mm)
End plates1580 × 80
Seal0.2250 × 50
Teflon frame0.850 × 50
Corrugated sheets1.1522 × 22
Electrodes0.3522 × 22
Membrane:Nafion 1150.12755 × 55
Table 2. PEMFC operating conditions in the three states.
Operation StatusAnode Flow
(mL/min)
Cathode Flow
(mL/min)
Humidifier Temperature
(°C)
Stack Temperature
(°C)
RH
(%)
DRY100150AtmosphereAtmosphere40
NORMAL10013030Atmosphere100
FLOOD101050Atmosphere100
Table 3. Parameter values for each fuzzy set of each of the three characteristics (ΔV, σ v , and ΔP).
CharacteristicFuzzy SetV1V2V3V4
VOLTAGE
OSCILLATION
( σ v ) :
High0.0030.00310.00550.006
Medium0.0010.0020.0030.0031
Low−0.0010.00.0010.002
SLOPE
CHANGE
( Δ P ) :
High0.390.400.500.55
Medium0.290.300.390.40
Low0.10.200.290.30
VOLTAGE
DELTA
( ( Δ V )
High−0.0010.000.020.30
Medium−0.01−0.007−0.0010.0
Low−0.05−0.04−0.01−0.007
Table 4. The equivalent circuit parameter value.
ParameterValueRelative Error (%)
Rm 0.7237   Ω
L 4.1857 × 10 7   H 1
R1 16.87   Ω 0.59
Q1 Y 0 = 4.0238 × 10 6   F 3.2
n = 0.08863 0.3
R2 0.5
Q2 Y 0 = 1.22635 × 10 6   F 6.43
n = 0.5787 2.49
Publisher’s Note: MDPI stays neutral with regard to jurisdictional claims in published maps and institutional affiliations.