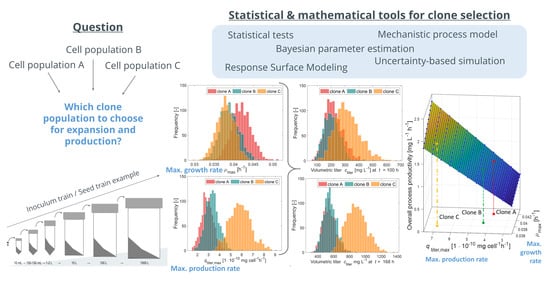
The following results provide insights into the roles of cell-specific growth rate (in the following growth rate) and cell-specific production rate (in the following production rate) in the cell expansion process (inoculum train) and the final production scale of operation using a model-based simulation approach. The following variables are considered: duration of the inoculum train; the volumetric titer in production; and the overall process productivity, defined by the ratio of volumetric titer in production to the overall cultivation time, including inoculum train.
An implemented and tested mechanistic cell culture model was adapted to further exploit the experimental data of one of these populations. Modeling and parameter estimations based on new experiments at 10, 50 and 500 mL were performed. This model was then used for further theoretical considerations.
Uncertainty-based simulations of inoculum train and production scale were performed for three clonal cell lines with established differences of growth and production rates.
Finally, a study was performed for several combinations of growth rate and production rate, showing the impacts of these differences on cultivation time and overall process productivity.
3.1. Analysis of Variabilities in Growth Rate and Production Rate for Five Clonal Cell Lines
Experimental data from a 3-month stability study were used to calculate growth and production rates for each clonal population. The clonal populations were subcultivated every 3 or 4 days during a time period of 13 weeks (see
Section 2.1). The averaged empirical growth rates for two measurements of viable cell density
and
(at the beginning and at the end of a subcultivation) have been calculated according to Equation (
1). The averaged empirical production rate between the beginning of a subcultivation and 4 days later was calculated according to Equation (
2) for every second subcultivation (volumetric titer were only determined for the 4-day subcultivations).
The obtained average growth and production rates are illustrated in
Figure 3 over every second subcultivation. The corresponding distributions can be found in the appendix (see
Figure A2 and
Figure A3).
Mean, standard deviation (sd), coefficient of variation (cv) and maximum (max) are listed for both quantities, growth rate and production rate, for all five populations in
Table 3.
Clone 5 showed the highest growth rate (a mean of 0.030 h
, a cv of 7% and a maximum value of 0.035 h
) and clone 2 the highest production rate (a mean of 17.4
mg cell
h
, a cv of 5.8% and a maximum value of 19.6
mg cell
h
) (see also
Figure 3).
Overall, the growth rates (mean values) varied between 0.62 d
(=0.026 h
) and 0.72 d
(=0.030 h
), and production rates varied between 19 pg cell
d
(=8.09 ·10
mg cell
h
) and 42 pg cell
d
(=17.4 ·10
mg cell
h
). These growth rates are in the range of those reported recently in [
6] (0.48–0.76 d
), where different CHO host cell lines were compared. The production rates found in the present study exceeded the production rates presented in [
6], where production rates between 1.6 and 16.2 pg cell
d
were found, and [
25], where averaged production rates ranged between 8 and 22 pg cell
d
, though the cultivation set ups in those studies may have differed in some aspects from ours, e.g., concerning cultivation vessels and volumes.
However, to identify which clones differ from each other in terms of averaged growth rates and production rates, the variations of the calculated rates have to be considered as well. To decide if several clonal populations have significant differences in terms of their means, an analysis of variance adapted for heterogeneous variances and post hoc tests (multiple comparison) has been performed according to the statistical procedure described in
Section 2.5. To test on variance homogeneity, the Bartlett test was applied, and the result (
p-value = 0.019 for
,
p-value = 0.021 for
) indicates heterogeneous variances. Hence, the Brown and Forsythe F-test [
20] was applied. The results (
p-value = 2.9
for
and
p-value = 5.0
for
) show that statistically significant differences (on a 5%-level) exist in both cases. The results of the post hoc tests, to identify differences between individual groups, are listed in
Table 4.
It can be seen that most populations show statistically significant differences between each other (
p-values ≪ 0.05), except clone 2 and clone 3 concerning growth rate (
p-value = 1), and clone 4 candompared to clone 5 concerning both, growth rate (
p-value = 0.19) and production rate (
p-value = 1). The biggest difference in terms of growth rate has been found between clone 5 and clone 3, with a difference of 0.0041 h
(see
Table 4, row 1, columns 1–3). A positive value in column 2 means that the left clone in column 1 has a higher
than the right clone in column 1.
Clone 2 has a significantly higher specific productivity than any of the other clones (see
Table 4, rows 1 to 4, columns 4–6). All differences between clone 2 and the compared clone are positive and statistically significant (
p-values < 0.05). The following is cell line 1 with significantly higher production rates than clones 3, 4 and 5 (see
Table 4, rows 5, 8 and 9 in columns 4–6).
To investigate whether a theoretical clonal cell population showing high growth rates is more favorable than cell lines with higher production rates, clonal populations (here referred to in a generalist way as clone A and clone B) are considered which are inversely related to each other. This means that the following criteria are fulfilled:
The averaged empirical growth rate of clone A, , is statistically significantly higher than the averaged empirical growth rate of clone B, , i.e., .
The averaged empirical production rate of clone A, , is statistically significantly lower than averaged empirical production rate of clone B, , i.e., .
This holds for the comparisons “clone 1 vs. clone 5” and “clone 2 vs. clone 5” of
Section 3.1. Therefore, the differences between these clones in terms of growth rate and production rate (highlighted in bold font in
Table 4) are considered in the following.
It should be noted that the averaged growth and production rates differ from the model parameters maximum growth rate and maximum production rate , used within a cell culture model. For this reason, the presented findings regarding differences between clonal populations have also been calculated on a percentage basis, to keep the same ratios within the simulation-based investigations. The empirical growth rate of clone 1 was approximately 7.6% higher than that of clone 5 and 10% higher than that of clone 2. The empirical production rate was 10.5% lower than that of clone 5 and 74% higher than that of clone 2.
In order to know how these clones would behave in a typical cell expansion process (from vial to production vessel) and at the final production phase, a representation was created which is explained in the following section. Growth rates and production rates are assumed to remain the same at the larger scales of operation.
3.2. Model Adaption of a Mechanistic Cell Culture Model for Prediction Using Bayesian Parameter Estimation
To display the cell growth behavior of a cell line, a growth model has to be applied and adapted based on experimental data. Since only clone 5 was available for further experiments, cell expansion processes from 5 mL and 10 mL in parallel to 500 mL have been performed at ExcellGene SA for this clone. At 5 and 10 mL scales, viable cell density, viability and volumetric titer have been measured. Calculated growth rates and production rates have been used to define the prior distributions of and in the following.
At 500 mL scale, cells have been cultivated over a period of 8 days and substrates (glucose and glutamine) and metabolites (lactate and ammonia) were measured in addition to viable cell density, viability and volumetric titer (to also adapt parameters characterizing substrate uptake and death rate). Based on these experiments, a growth model (see
Section 2.2), which had been already applied to other CHO cell lines, was used here while applying Bayesian parameter estimations. This approach consists of the following steps:
In a first step, the prior knowledge about model parameters had to be quantified. In the second step, experimental data were added, and a Markov chain Monte Carlo algorithm is used to find the posterior probability distributions of the model parameters to be estimated. The obtained posterior distributions contained information from prior knowledge and new experimental data.
3.2.1. Prior Knowledge
To quantify the prior probability distributions of model parameters, data from the stability study and data from additional experiments at 5 mL and 10 mL with the same clone, clone 5, have been used in the following way:
The maximum growth rate of clone 5 over all subcultivations of the stability study was h. Additional experiments at 5 and 10 mL-scales revealed growth rates of 0.046 and h, respectively. The additional experiments provide one measurement per day, allowing the computation of the growth rate per day. The stability study provides data at the beginning and at the end of each subcultivation (with a duration of 3 or 4 days each). Consequently, the maximum growth rate cannot be approximated as precisely as using daily measurements. Nevertheless, it is considered for determination of the prior distribution but with less weight (1/3) than the approximations of further experiments (2/3).
The maximum production rate of clone 5 over all subcultivations of the stability study revealed mg cell h. The maximum production rates of clone 5, based on additional experiments at 5 and 10 mL-scales, were mg cell h and mg cell h, respectively. The reason for the variation of these values is unknown, but the variation (uncertainty) itself is information also included in the prior probability study. (A higher uncertainty signifies less weight for the prior mean within the parameter estimation process).
Based on this information, mean and variance have been calculated to characterize the prior probability distribution of maximum growth rate
and maximum production rate
according to Equation (A1). These are listed in
Table 5, including the corresponding coefficient of variation (cv).
3.2.2. Posterior Distributions
Bayesian parameter estimation has been performed using a Markov chain Monte Carlo (MCMC) algorithm considering cultivation data (at 500 mL over 8 days) and prior distributions as described in
Section 2.7. Measured and simulated time course data are presented in
Figure 4. It can be seen that reasonable agreement between measured and simulated data can be achieved by the set of model parameters used, although more experimental data between day 4 and day 8 could have helped to define more precisely when the cells entered into the stationary phase. Prior (before parameter estimation) and posterior (after parameter estimation) distributions are shown in
Figure 5. Posterior means of estimated model parameters and values of the fixed model parameters are presented in
Table A1. It can be concluded from
Figure 4 together with
Figure 5 that parameters
and
represent rather well the measured data: Posterior distributions (red solid lines) are much narrower than the prior distributions (blue dashed lines), thereby reducing uncertainty for these model parameters. This means that uncertainty has been reduced for these model parameters. Furthermore, the means moved slightly to the right in the case of maximum growth rate
and strongly to the left in case of
. Posterior distributions of the remaining model parameters do not differ much from their prior distributions.
3.3. Uncertainty-Based Upstream Process Simulation—Comparison of Three Clonal Populations with Different Growth and Production Rates
In this section, we describe the application of the adapted model perform upstream simulations for three different theoretical cell lines, named A, B and C, under consideration of variabilities observed in
Section 3.1. The reference clone A is characterized by the model parameter distributions obtained in the previous section (parameter estimation for clone 5). The two other clones B and C are defined as showing lower growth rates than clone A, but higher production rates than clone A, as listed in
Table 6. In order to choose realistic values concerning the differences between clones A, B and C, the differences obtained in
Section 3.1 concerning growth rate and production rate have been applied. Empirical growth rates for experimentally analyzed cell lines 5 and 1 showed an averaged difference of 7.6% and for 5 and 2 an averaged difference of 10%.Therefore, model parameter
of clone B was chosen to be 7.6% lower than
of clone A and
of clone C was chosen to be 10% lower than
of clone A.
Empirical production rates for cell lines 5 and 1 showed averaged differences of 10.5% and 74%, respectively. Therefore, model parameter of clone B was chosen to be 10.5% higher than of clone A, and of clone C was chosen to be 74% higher than of clone A. A suitable inoculum train protocol was defined for each clonal cell line. Furthermore, these simulations were used to investigate and illustrate the impact of differences in growth and production rates between all three clones regarding duration of the inoculum train, volumetric titer in production and overall process productivity for a batch process.
To digitally display an upstream process, the following inputs have been defined:
Volumes: The simulated upstream process consisted of six scales of operation with the following volumes: 10 mL → 120 mL → 1.5 L → 15 L → 100 L → 1000 L (production).
This setup enabled the use of a highly similar type of cultivation approach (orbital shaking) at all scales. Note: ExcellGene has considerable experience with scale-up cultures in both orbital shaken and standard stirred systems to have sufficient confidence in the matching impacts of critical parameters in both approaches (not published). Passaging strategy: Cells were passaged, i.e., subcultivated, as soon as a required cell density for transfer was reached, using the predicted viable cell density. The required cell biomass was based on the optimal cell density for inoculation at cells mL. Initial concentrations: viable cell density, cells mL; viability; glucose, mmol L; glutamine mmol L; lactate, mmol L; ammonia, mmol L, titer, = 0 mg L; and volume, L. Furthermore, a limiting substrate was assumed to have initial value mmol L.
The corresponding simulated time profiles for trends in viable cell density and titer are presented in
Figure 6.
It turned out that the designed inoculum trains seemed suitable for cell expansion of all three clonal populations. When the inoculum cell densities were fulfilled, cells did not enter into the stationary phase during the inoculum train, and transfer cell densities were within an acceptable range (maximum cell density below cells mL).
The durations of the inoculum train cultures ranged from 298 to 333 h. Obviously, lower growth rates cause longer cultivation times. Clone B needed 24 h and clone C 35 h more than clone A. Clone A and clone B, concerning the predicted volumetric titers in the production vessel, differed by a 10.5% higher production rate of clone B, resulting in a 13% higher volumetric titer during the first hours of the production phase. However this difference shrunk over time: After 25 h clone A reached 13 mg L and clone B 15 mg L. Between 50 and 100 h in the production vessel, clone A compensated for the disadvantage through a 7.6% higher growth rate. After 100 h, clone A presentd a titer of 222 mg L, 7% more than clone B with 207.0 mg L. Nevertheless, after 168 h (7 days) clone B reached a higher volumetric titer (558 mg L) than clone A (539 mg L). This was due to the fact that the higher growth rate of clone A led to an earlier beginning of the death phase (here in batch mode) compared to clone B. Putting the volumetric titer in relation to the overall cultivation time and accepting an overall error of about 10%, both clones led to a similar overall process productivity (1.16 mg L h for clone A and 1.14 mg L h for clone B).
A clearer impact was observed for clone C, having a 10% lower maximum growth rate combined with a 74% higher production rate as compared to clone A. Already, after the first 25 h in the production vessel, clone C reached 25 mg L on average (clone A and B only 13 and 15 mg L, respectively), and after 7 days (168 h) clone C reached 876 mg L (clone A and B only 539 and 558 mg L, respectively). This is an increase of 337 mg L (63.5% of the volumetric titer generated with clone A).
It should be noted that the presented model-based method can be further extended to fed-batch processes which are most frequently applied in industrial large scale manufacturing or to perfusion mode. However, the batch process has been considered in this study because the focus was not to find an optimal operating mode for the production bioreactor, but rather to consider how phenotypic differences effect cell growth in the inoculum train, which contributes significantly to the manufacturing time and overall process productivity, yet is rarely considered in literature [
26].
A comparison of different CHO host cell lines for batch, fed-batch and perfusion modes was recently reported in [
6]. They found that differences in phenotypic properties affect cell growth and productivity regardless of process mode (batch, fed-batch or perfusion) or cell culture media.
For a better illustration,
Figure 7 shows how variabilities in model parameters
and
propagate onto the output uncertainty in form of probability distributions (histograms) at each interesting point in time.
It thus becomes visible how the output distribution changes over time. In accordance with the results presented in
Figure 6, there is not a huge difference concerning volumetric titer between the distributions of clone A and clone B: not after 25 h (
Figure 7c), 100 h (
Figure 7d) or 168 h (
Figure 7e) of production. The distributions are almost overlapping, although after 100 h clone A shows a higher mean than clone B, as described above. The distribution of clone C instead differs clearly from those of clone A and clone B (small overlap) after 25 h in production. After 100 h of production there are larger overlapping areas between all three clones, indicating a decline in differences between them. However, after 168 h (7 days) of production, a clear difference (smaller overlap) is visible between clone C and clones A and B, whereas clone A and B are almost totally overlapping. In this case and under the assumptions of equal stability and quality, clone C would be the recommended clone for moving forward.
Nevertheless, it may be the case that two or more clonal populations differ in a different proportion to each other in terms of phenotypic characteristics than the here discussed three. The following section tries to address such.
3.4. Impacts of Differences in Growth and Production Rates on Inoculum Train and Titer at Production Scale—General Considerations and a Decision Criterion
To judge the effects of growth rate and specific productivity in numerous clonal cell populations, one needs to know the resulting overall process productivities (=Space-Time-Yield: volumetric titer in production/overall cultivation time, including inoculum train).
We determined these effects for a realistic cell expansion setup and based on model parameter ranges derived from the previous sections (
h
± 10%,
mg cell
h
± 10%). For each parameter combination, the two response numbers (volumetric titer in production and overall process productivity) were obtained by upstream simulations as before. These results were then adapted to corresponding response surfaces (see
Figure A4,
Figure A5,
Figure A6), which visualize the effects of maximum growth rate and maximum production rate on each response quantity.
Multiple linear regression has been performed for the responses after 50, 100 and 168 h in the production vessel. Due to their different orders of magnitude, all variables have been scaled (transformed) to the range of [0, 1]. The results are presented in
Table 7.
All regressions have an R-value very close to one, meaning that the applied model is suitable to present the correlation between factors and response variables. All determined -coefficients, which describe the correlation of () and () for the investigated response variable, show p-values less than 0.05 (meaning that they are statistically significant to a 5%-level). Due to the scaling of both factors, the -coefficients stayed within the range of 0 and 1. It is interesting to see that the impact and the relation between both factors, and , varies depending on which point in time in production is considered.
Regarding volumetric titer as a response variable, it can be observed that after 50 h in the production vessel, the impact of ( = 0.57) was 1.4 times higher than the impact of ( = 0.42). After 100 h in production, this changed. Then, the impact of ( = 0.69) was 2.2 times higher than the impact of ( = 0.31). However, after 168 h (7 days) in production, ( = 0.67) was again higher than (two times = 0.33). The decreasing impact of after 168 h can be explained because cells probably entered in the stationary/death phase (here batch-mode is assumed) while cells were still producing titer.
Considering overall process productivity,
has a higher impact than
, regardless of the considered point in time (see
-coefficients for the overall process productivity in
Table 7). It was 1.6 times higher after 50 h, three times higher after 100 h and 1.17 times higher after 168 h cultivation time in the production vessel compared to
. Obviously, therefore, growth rates have a higher impact on the output per year.
This regression analysis was performed within a range of 0.397 h
± 10% for
and 5
mg cell
h
± 10% for
); it should be noted, however, that the results of the stability study showed a higher variation of the production rate than that of the growth rate. Therefore,
has been varied ± 50%, and response surfaces for both response variables, volumetric titer and overall process productivity, have been estimated as shown in
Figure 8.
Choosing a clonal population showing a lower growth rate but a higher production rate will only be favorable if the productivity is high enough. As stated before, and summarized in
Table 8, clones A and B delivered very similar process productivities (1.16 mg L
h
for clone A and 1.14 mg L
h
for clone B). The final titers for clone A and B were 539 and 558 mg L
, respectively—a negligible difference. When taking 74% higher productivity for C, then a more significant difference is obtained with 876 mg L
after 168 h, and an 1.75 mg L
h
overall process productivity enhancement over A and B is seen.
The response surface models can be used, therefore, to approximate volumetric titer and overall process productivity for a realistic combination of growth rate and production rate, and help with the decision processes. These simulations can be used to determine to what extent growth rate or production rate must differ to cause a difference of at least 5% in the response variables.


 ,
, 


