
A Dissolution Kinetic Study of Disperse Dye in Supercritical Carbon Dioxide to Design an Efficient Supercritical Dyeing Process

Abstract
:1. Introduction
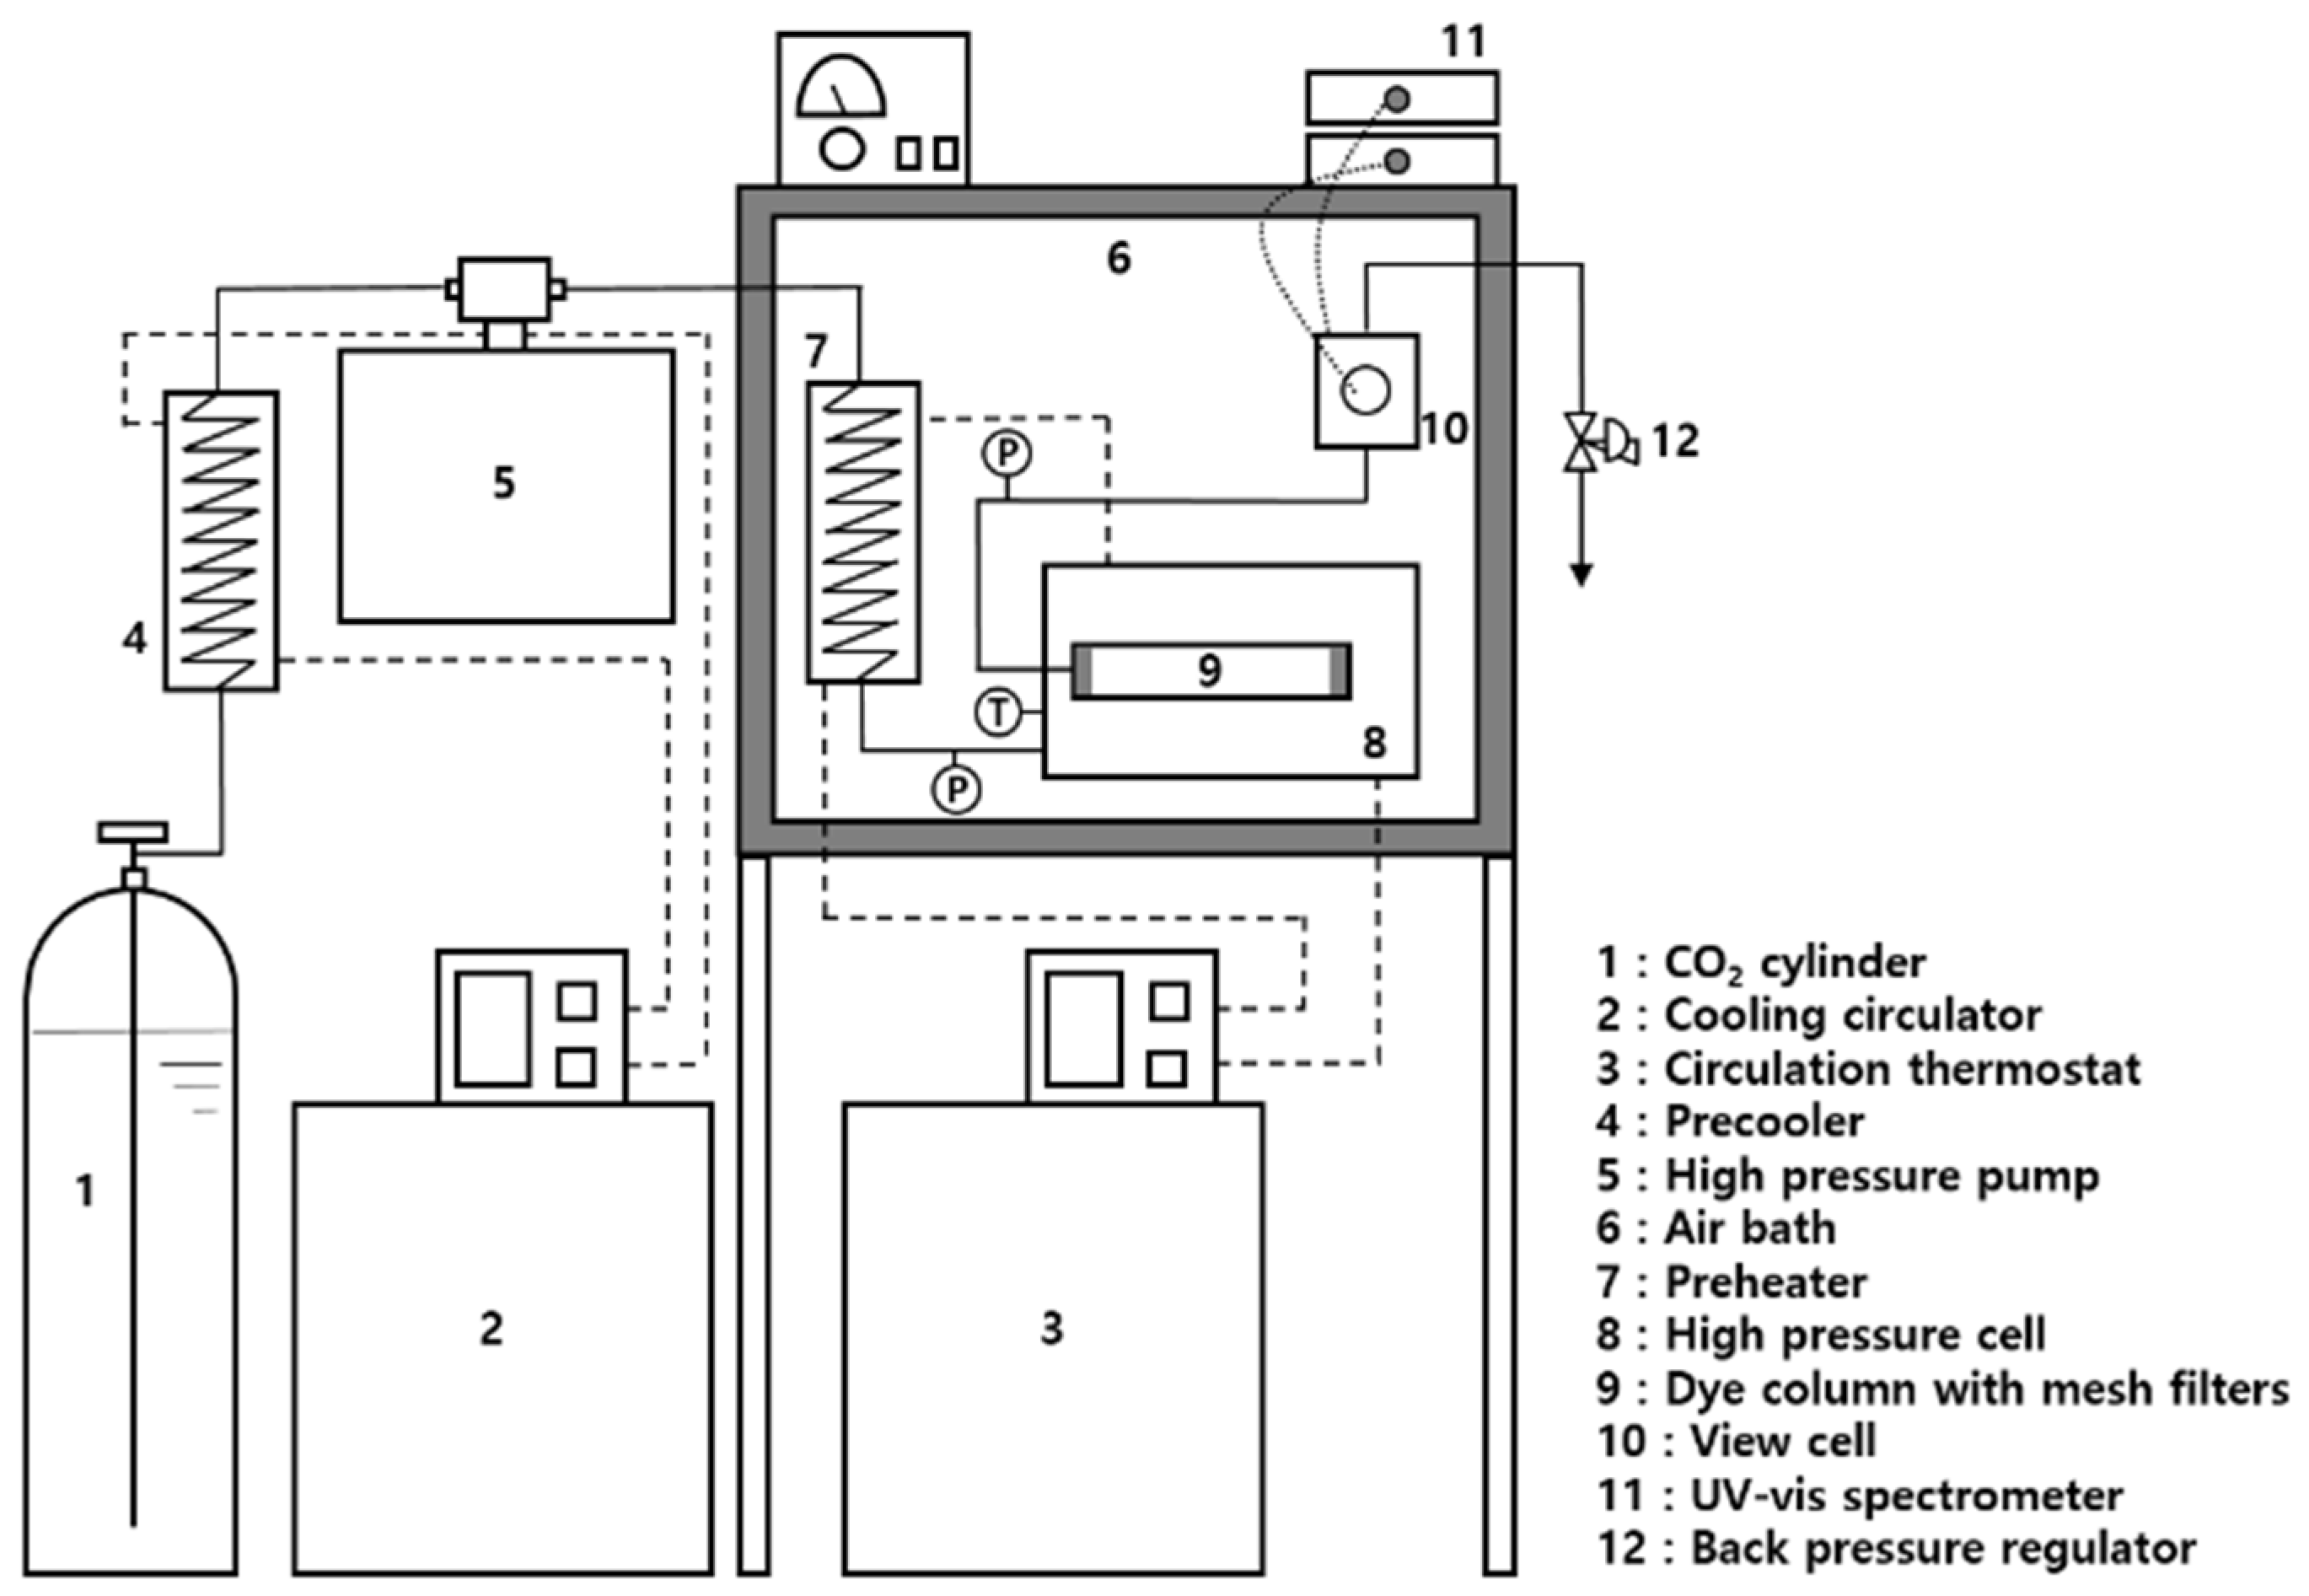
2. Materials and Methods
3. Results and Discussion
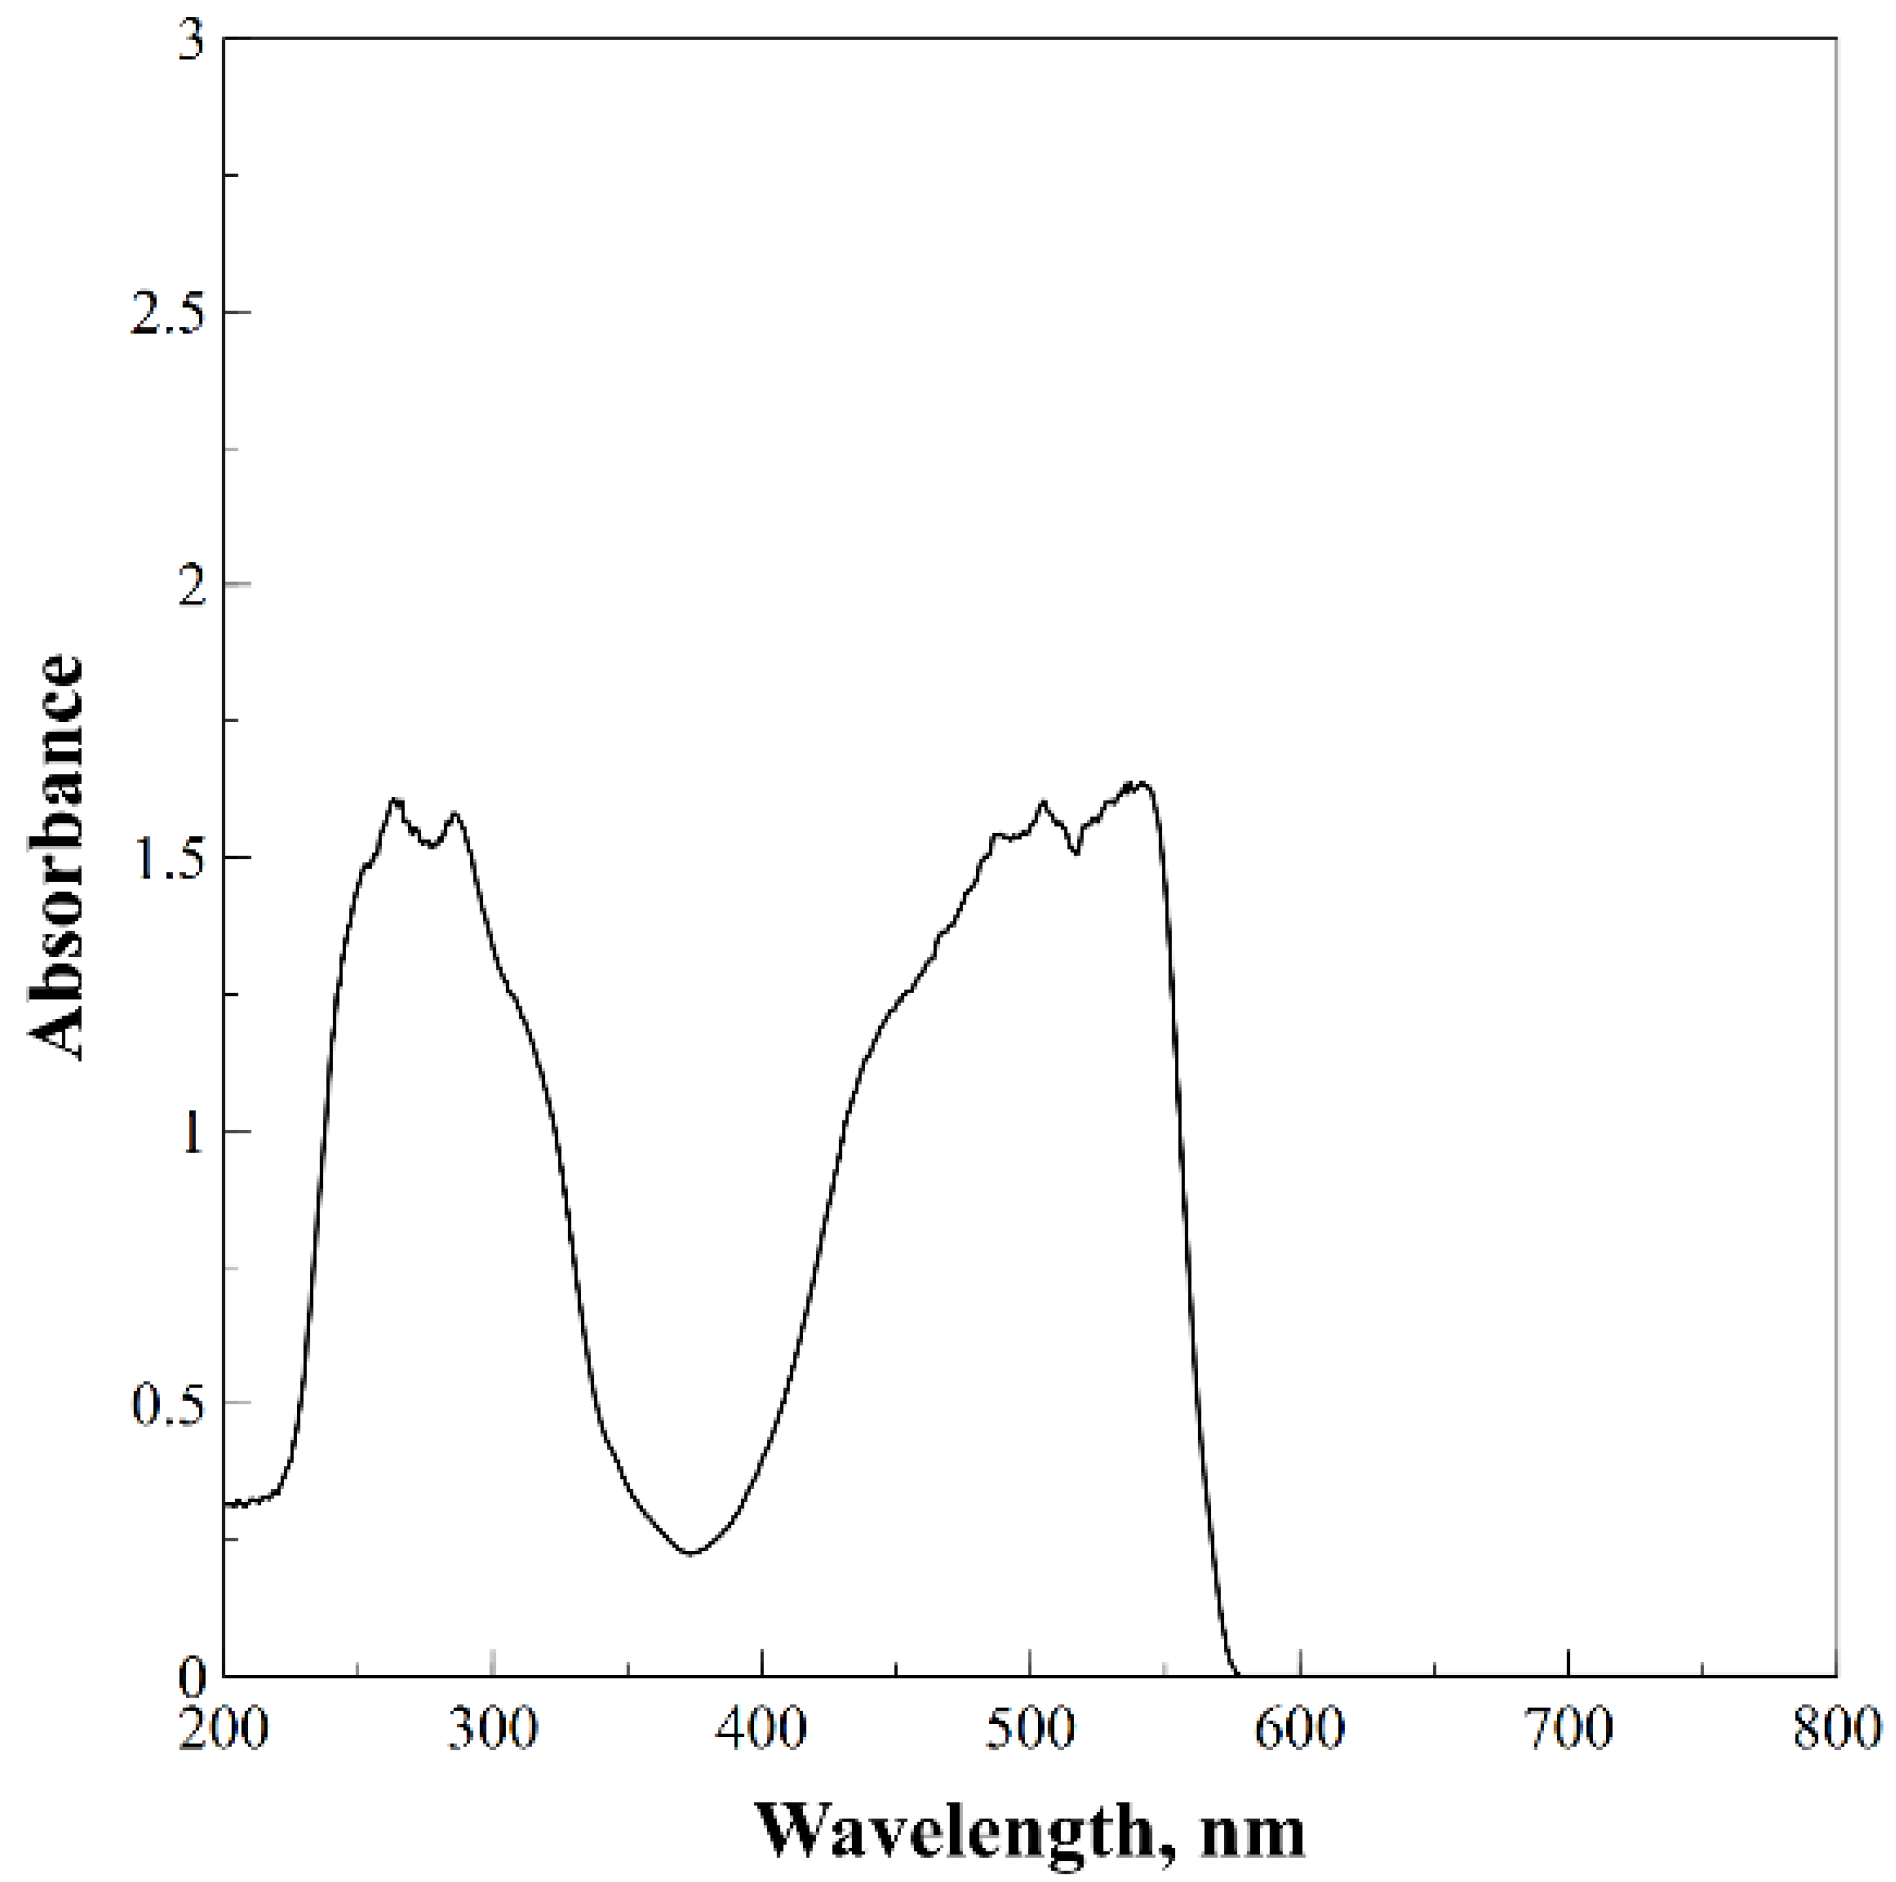
3.1. UV/Vis Spectrometer Analysis
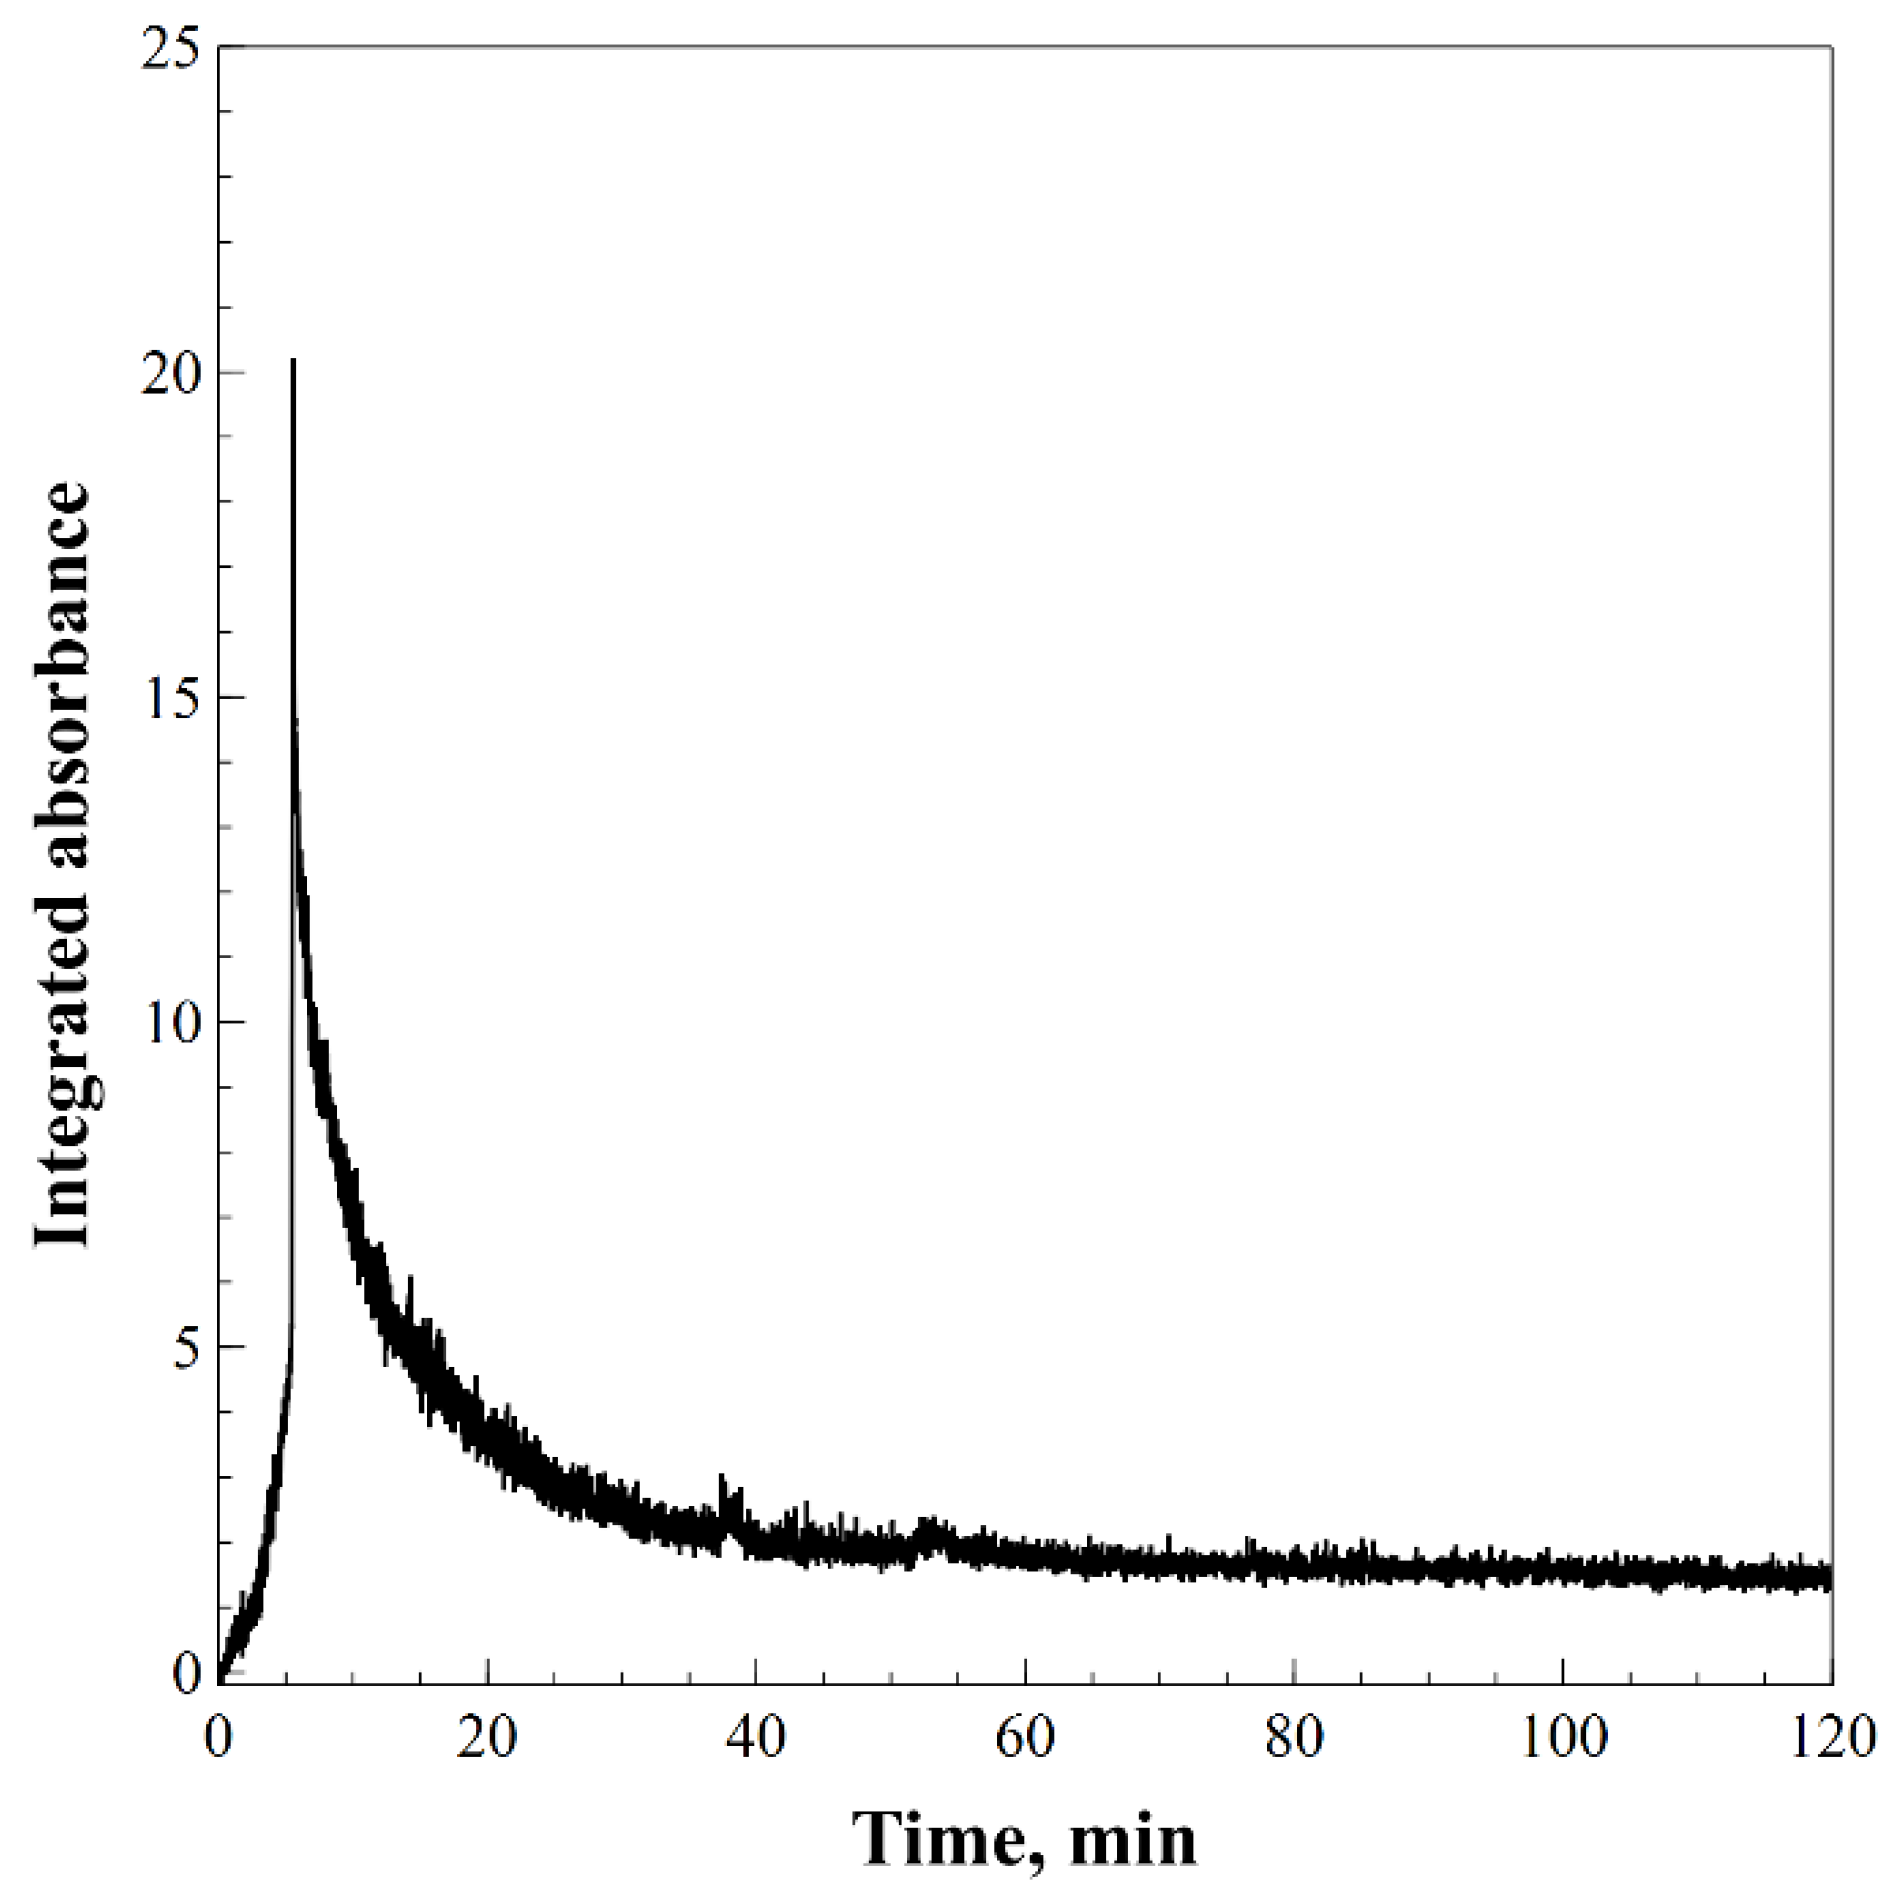
3.2. Calculation of Mass Transfer Coefficient
3.3. Effect of Initial Weight of Dye
3.4. Dimensionless Correlation
3.5. Prediction of Dissolution Rate
4. Conclusions
Author Contributions
Funding
Institutional Review Board Statement
Informed Consent Statement
Acknowledgments
Conflicts of Interest
References
- Banchero, M. Supercritical fluid dyeing of synthetic and natural textiles—A review. Color. Technol. 2013, 129, 2–17. [Google Scholar] [CrossRef]
- Kim, T.; Park, G.; Kong, W.; Lee, Y.-W. Supercritical Dyeing Technology. Clean Technol. 2018, 24, 1–8. [Google Scholar] [CrossRef]
- Abou Elmaaty, T.; Sofan, M.; Elsisi, H.; Kosbar, T.; Negm, E.; Hirogaki, K.; Tabata, I.; Hori, T. Optimization of an eco-friendly dyeing process in both laboratory scale and pilot scale supercritical carbon dioxide unit for polypropylene fabrics with special new disperse dyes. J. CO2 Util. 2019, 33, 365–371. [Google Scholar] [CrossRef]
- Bai, T.; Kobayashi, K.; Tamura, K.; Jun, Y.; Zheng, L. Supercritical CO2 dyeing for nylon, acrylic, polyester, and casein buttons and their optimum dyeing conditions by design of experiments. J. CO2 Util. 2019, 33, 253–261. [Google Scholar] [CrossRef]
- Wang, Y.; Jing, X.; Zhao, Y.; Zheng, L.; Zheng, H. Waterless beam dyeing in supercritical CO2: Establishment of a clean and efficient color matching system. J. CO2 Util. 2021, 43, 101368. [Google Scholar] [CrossRef]
- Özcan, A.S.; Özcan, A. Adsorption behavior of a disperse dye on polyester in supercritical carbon dioxide. J. Supercrit. Fluids 2005, 35, 133–139. [Google Scholar] [CrossRef]
- Sicardi, S.; Manna, L.; Banchero, M. Comparison of dye diffusion in poly(ethylene terephthalate) films in the presence of a supercritical or aqueous solvent. Ind. Eng. Chem. Res. 2000, 39, 4707–4713. [Google Scholar] [CrossRef]
- Sicardi, S.; Manna, L.; Banchero, M. Diffusion of disperse dyes in PET films during impregnation with a supercritical fluid. J. Supercrit. Fluids 2000, 17, 187–194. [Google Scholar] [CrossRef]
- Fernandez Cid, M.V.; Van Der Kraan, M.; Veugelers, W.J.T.; Woerlee, G.F.; Witkamp, G.J. Kinetics study of a dichlorotriazine reactive dye in supercritical carbon dioxide. J. Supercrit. Fluids 2004, 32, 147–152. [Google Scholar] [CrossRef]
- Bach, E.; Cleve, E.; Schollmeyer, E. Past, present and future of supercritical fluid dyeing technology—An overview. Rev. Prog. Color. Relat. Top. 2002, 32, 88–102. [Google Scholar] [CrossRef]
- Kim, T.; Seo, B.; Park, G.; Lee, Y.-W. Effects of dye particle size and dissolution rate on the overall dye uptake in supercritical dyeing process. J. Supercrit. Fluids 2019, 151, 1–7. [Google Scholar] [CrossRef]
- Seager, R.J.; Acevedo, A.J.; Spill, F. Solid dissolution in a fluid solvent is characterized by the interplay of surface area-dependent diffusion and physical fragmentation. Sci. Rep. 2018, 1–17. [Google Scholar] [CrossRef]
- Welty, J.R.; Wicks, C.E.; Wilson, R.E.; Rorrer, G. Fundamentals Of Momentum, Heat, And Mass Transfer, 5th ed.; Wiley India: New Delhi, India, 2010; ISBN 8126528389. [Google Scholar]
- Banchero, M.; Sicardi, S.; Ferri, A.; Manna, L. Supercritical Dyeing of Textiles—From the Laboratory Apparatus to the Pilot Plant. Text. Res. J. 2008, 78, 217–223. [Google Scholar] [CrossRef]
- Banchero, M. Recent advances in supercritical fluid dyeing. Color. Technol. 2020, 136, 317–335. [Google Scholar] [CrossRef]
- Duba, K.S.; Fiori, L. Supercritical CO2 extraction of grape seed oil: Effect of process parameters on the extraction kinetics. J. Supercrit. Fluids 2015, 98, 33–43. [Google Scholar] [CrossRef]
- Pérez-Galindo, J.A.; López-Miranda, J.; Martín-Dominguez, I.R. Geometric and Reynolds number effects on oregano (Lippia Berlandieri Schauer) essential oil extraction. J. Food Eng. 2000, 44, 127–133. [Google Scholar] [CrossRef]
- Núñez, G.A.; Del Valle, J.M. Supercritical CO2 oilseed extraction in multi-vessel plants. 2. Effect of number and geometry of extractors on production cost. J. Supercrit. Fluids 2014, 92, 324–334. [Google Scholar] [CrossRef]
- Lin, T.M.; Ping, T.S.; Saptoro, A.; Freddie, P. Mass Transfer Coefficients and Correlation of Supercritical Carbon Dioxide Extraction of Sarawak Black Pepper. Int. J. Food Eng. 2013. [Google Scholar] [CrossRef] [Green Version]
- Thirteen, C. Scale-Up in Reactor Design. In Modeling of Chemical Kinetics and Reactor Design; Elsevier: Amsterdam, The Netherlands, 2001; pp. 1034–1081. [Google Scholar]
- Donati, G.; Paludetto, R. Scale up of chemical reactors. Catal. Today 1997, 34. [Google Scholar] [CrossRef]
- Braeuer, A. In Situ Spectroscopic Techniques at High Pressure; Elsevier: Amsterdam, The Netherlands, 2015; ISBN 9780444634221. [Google Scholar]
- Ngo, T.T.; Bush, D.; Eckert, C.A.; Liotta, C.L. Spectroscopic measurement of solid solubility in supercritical fluids. AIChE J. 2001, 47, 2566–2572. [Google Scholar] [CrossRef]
- Inomata, H.; Yagi, Y.; Saito, M.; Saito, S. Density dependence of the molar absorption coefficient—Application of the beer-lambert law to supercritical CO2—Naphthalene mixture. J. Supercrit. Fluids 1993, 6, 237–240. [Google Scholar] [CrossRef]
- Ngo, T.T.; Liotta, C.L.; Eckert, C.A.; Kazarian, S.G. Supercritical fluid impregnation of different azo-dyes into polymer: In situ UV/Vis spectroscopic study. J. Supercrit. Fluids 2003, 27, 215–221. [Google Scholar] [CrossRef]
- Kautz, C.B.; Schneider, G.M.; Shim, J.J.; Wagner, B.; Tuma, D. Solubilities of a 1,4-bis(alkylamino)-9,10-anthraquinone series in compressed carbon dioxide. J. Chem. Eng. Data 2008, 53, 2356–2371. [Google Scholar] [CrossRef]
- Wagner, B.; Nishioka, M.; Tuma, D.; Maiwald, M.; Schneider, G.M. Sample purification for spectroscopic high-pressure investigations by dynamic supercritical fluid extraction. J. Supercrit. Fluids 1999, 16, 157–165. [Google Scholar] [CrossRef]
- Kim, T.; Seo, B.; Park, G.; Lee, Y.-W. Predicting diffusion behavior of disperse dyes in polyester fibers by a method based on extraction. J. Supercrit. Fluids 2020, 157, 104685. [Google Scholar] [CrossRef]
- Rice, J.K.; Niemeyer, E.D.; Bright, F.V. Evidence for Density-Dependent Changes in Solute Molar Absorptivities in Supercritical CO2: Impact on Solubility Determination Practices. Anal. Chem. 1995, 67, 4354–4357. [Google Scholar] [CrossRef]
- Carrott, M.J.; Wai, C.M. UV—Visible Spectroscopic Measurement of Solubilities in Supercritical CO2 Using High-Pressure Fiber-Optic Cells. Anal. Chem. 1998, 70, 2421–2425. [Google Scholar] [CrossRef]
- Haarhaus, U.; Swidersky, P.; Schneider, G.M. High-pressure investigations on the solubility of dispersion dyestuffs in supercritical gases by VIS/NIR-spectroscopy. Part I—1,4-Bis-(octadecylamino)-9,10-anthraquinone and disperse orange in CO2 and N2O Up to 180 MPa. J. Supercrit. Fluids 1995, 8, 100–106. [Google Scholar] [CrossRef]
- Suzuki, S.; Aoki, K.; Moribe, K.; Sako, T. Solubility Measurement in Supercritical CO2 with High Pressure UV/VIS Absorption Spectroscopy. In Asian Pacific Confederation of Chemical Engineering Congress Program and Abstract; The Society of Chemical Engineers: Tokyo, Japan, 2004; p. 839. [Google Scholar] [CrossRef]
- Yoon, T.J.; Youn, Y.S.; Son, W.S.; Seo, B.; Ahn, K.H.; Lee, Y.-W. Dimensionless entropy of fusion as a simple criterion to predict agglomeration in the supercritical antisolvent process. Cryst. Growth Des. 2013, 13, 3481–3489. [Google Scholar] [CrossRef]
- Lemmon, E.; McLinden, M.O.; Friend, D.G. Thermophysical Properties of Fluid Systems. In NIST Chemistry WebBook; Linstrom, P.J., Mallard, W.G., Eds.; NIST Standard Reference Database Number 69; National Institute of Standards and Technology: Gaithersburg, MD, USA, 2018. [Google Scholar] [CrossRef]
- Funazukuri, T.; Yamasaki, T.; Taguchi, M.; Yi, C. Fluid Phase Equilibria Measurement of binary diffusion coef fi cient and solubility estimation for dyes in supercritical carbon dioxide by CIR method. Fluid Phase Equilib. 2016, 420, 7–13. [Google Scholar] [CrossRef]


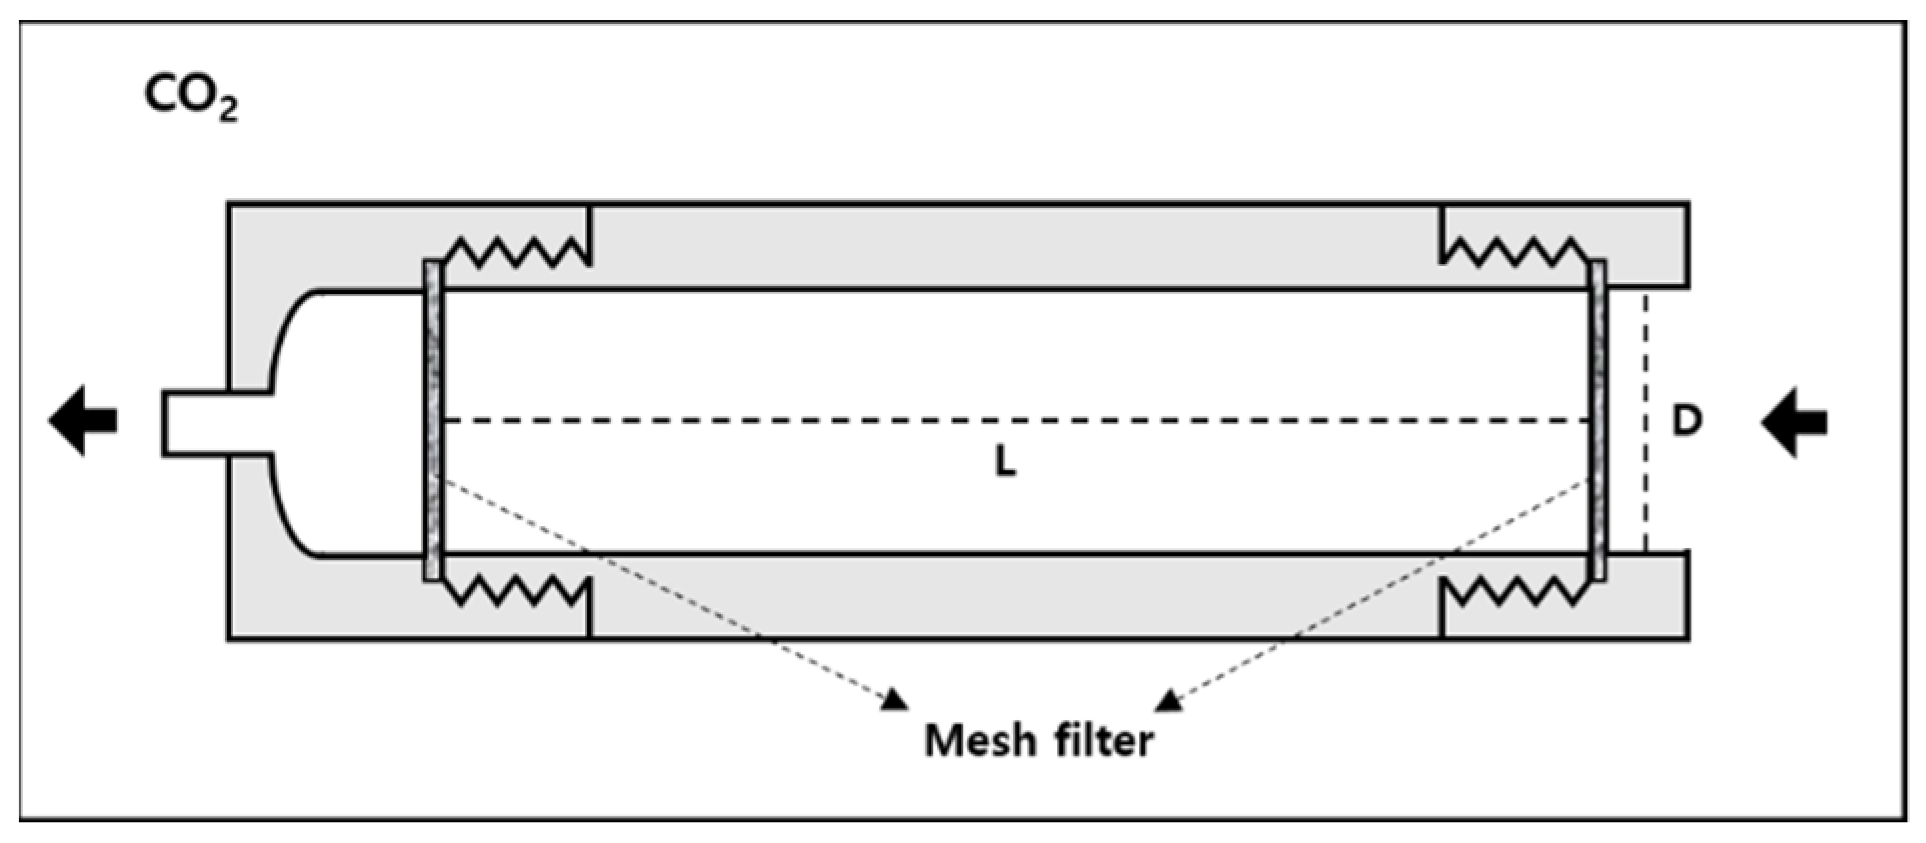
| Length (m) | Diameter (m) | L/D Ratio | Volume (m3) |
|---|---|---|---|
| 0.0146 | 0.0146 | 1 | 2.44 × 10⁻⁶ |
| 0.043 | 0.0086 | 5 | 2.45 × 10⁻⁶ |
| 0.068 | 0.0068 | 10 | 2.45 × 10⁻⁶ |
| Flow Rate [mL/min] | L/D Ratio | Initial Dye 1 [mg] | Dissolved Dye 2 [mg] |
|---|---|---|---|
| 20 | 1 | 39.8 | 6.73 (0.65) |
| 5 | 41.0 | 15.31 (0.52) | |
| 10 | 40.6 | 19.59 (2.01) | |
| 30 | 1 | 39.3 | 7.60 (0.22) |
| 5 | 40.3 | 17.02 (0.71) | |
| 10 | 40.9 | 22.68 (1.10) | |
| 40 | 1 | 40.1 | 8.80 (0.44) |
| 5 | 40.3 | 18.11 (1.02) | |
| 10 | 41.2 | 28.93 (0.51) |
| Flow Rate [mL/min] | L/D Ratio | Trend Line Equation | R2 | Kc ·104 [m/min] 1 |
|---|---|---|---|---|
| 20 | 1 | 0.9908 | 1.093 | |
| 5 | 0.9927 | 2.927 | ||
| 10 | 0.9941 | 4.533 | ||
| 30 | 1 | 0.9685 | 1.120 | |
| 5 | 0.9488 | 3.144 | ||
| 10 | 0.9981 | 5.007 | ||
| 40 | 1 | 0.9883 | 1.352 | |
| 5 | 0.9938 | 3.497 | ||
| 10 | 0.9989 | 6.215 |
| Property of DR60 | Value |
|---|---|
| Density of DR60 [g/mL] | 1.44 |
| Particle radius of DR60 [µm] | 20 |
| Solubility of DR60 in CO2 [g/mL] | 1.134 × 10⁻⁴ |
| Initial Dye [mg] | M01 [mg] | Dissolved Dye 2 [mg] | Trend Line Equation | R2 | Kc 104 [m/min] |
|---|---|---|---|---|---|
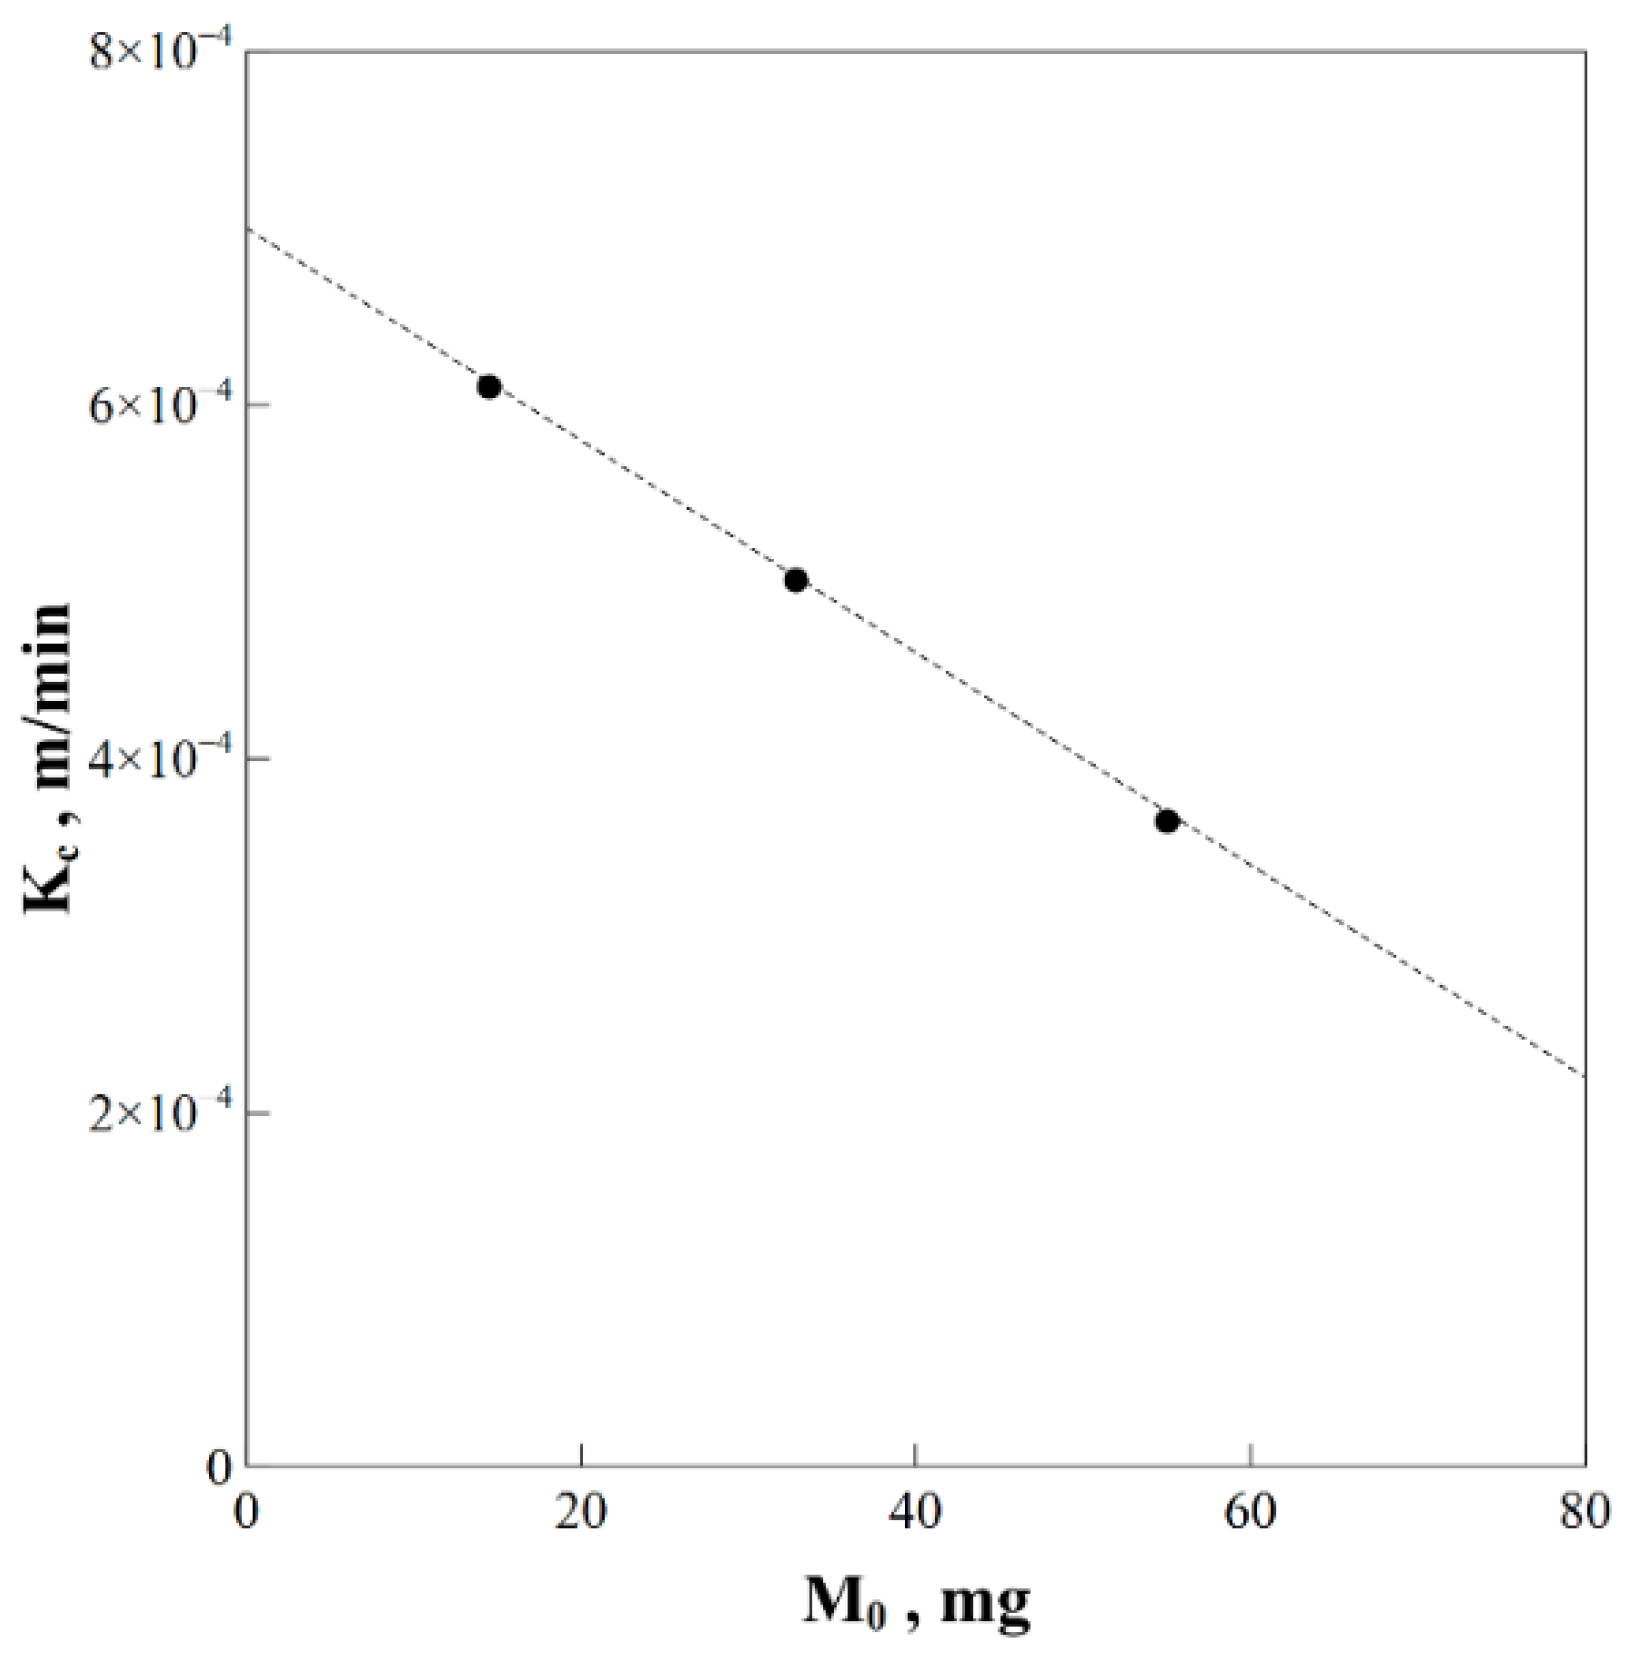
| 20.2 | 14.51 | 13.21 (1.58) | 0.9974 | 6.10 | |
| 40.9 | 32.84 | 22.68 (1.10) | 0.9981 | 5.01 | |
| 62.4 | 55.02 | 26.90 (2.71) | 0.9993 | 3.65 |
| Property | Value |
|---|---|
| Density of CO2 [Kg/m3] | 500 |
| Viscosity of CO2 [Kg/m· s] | 4 × 10⁻⁵ |
| Particle radius of DR60 [µm] | 20 |
| Diffusivity of DR60 in CO2 [m2/min] | 6 ×10⁻⁷ |
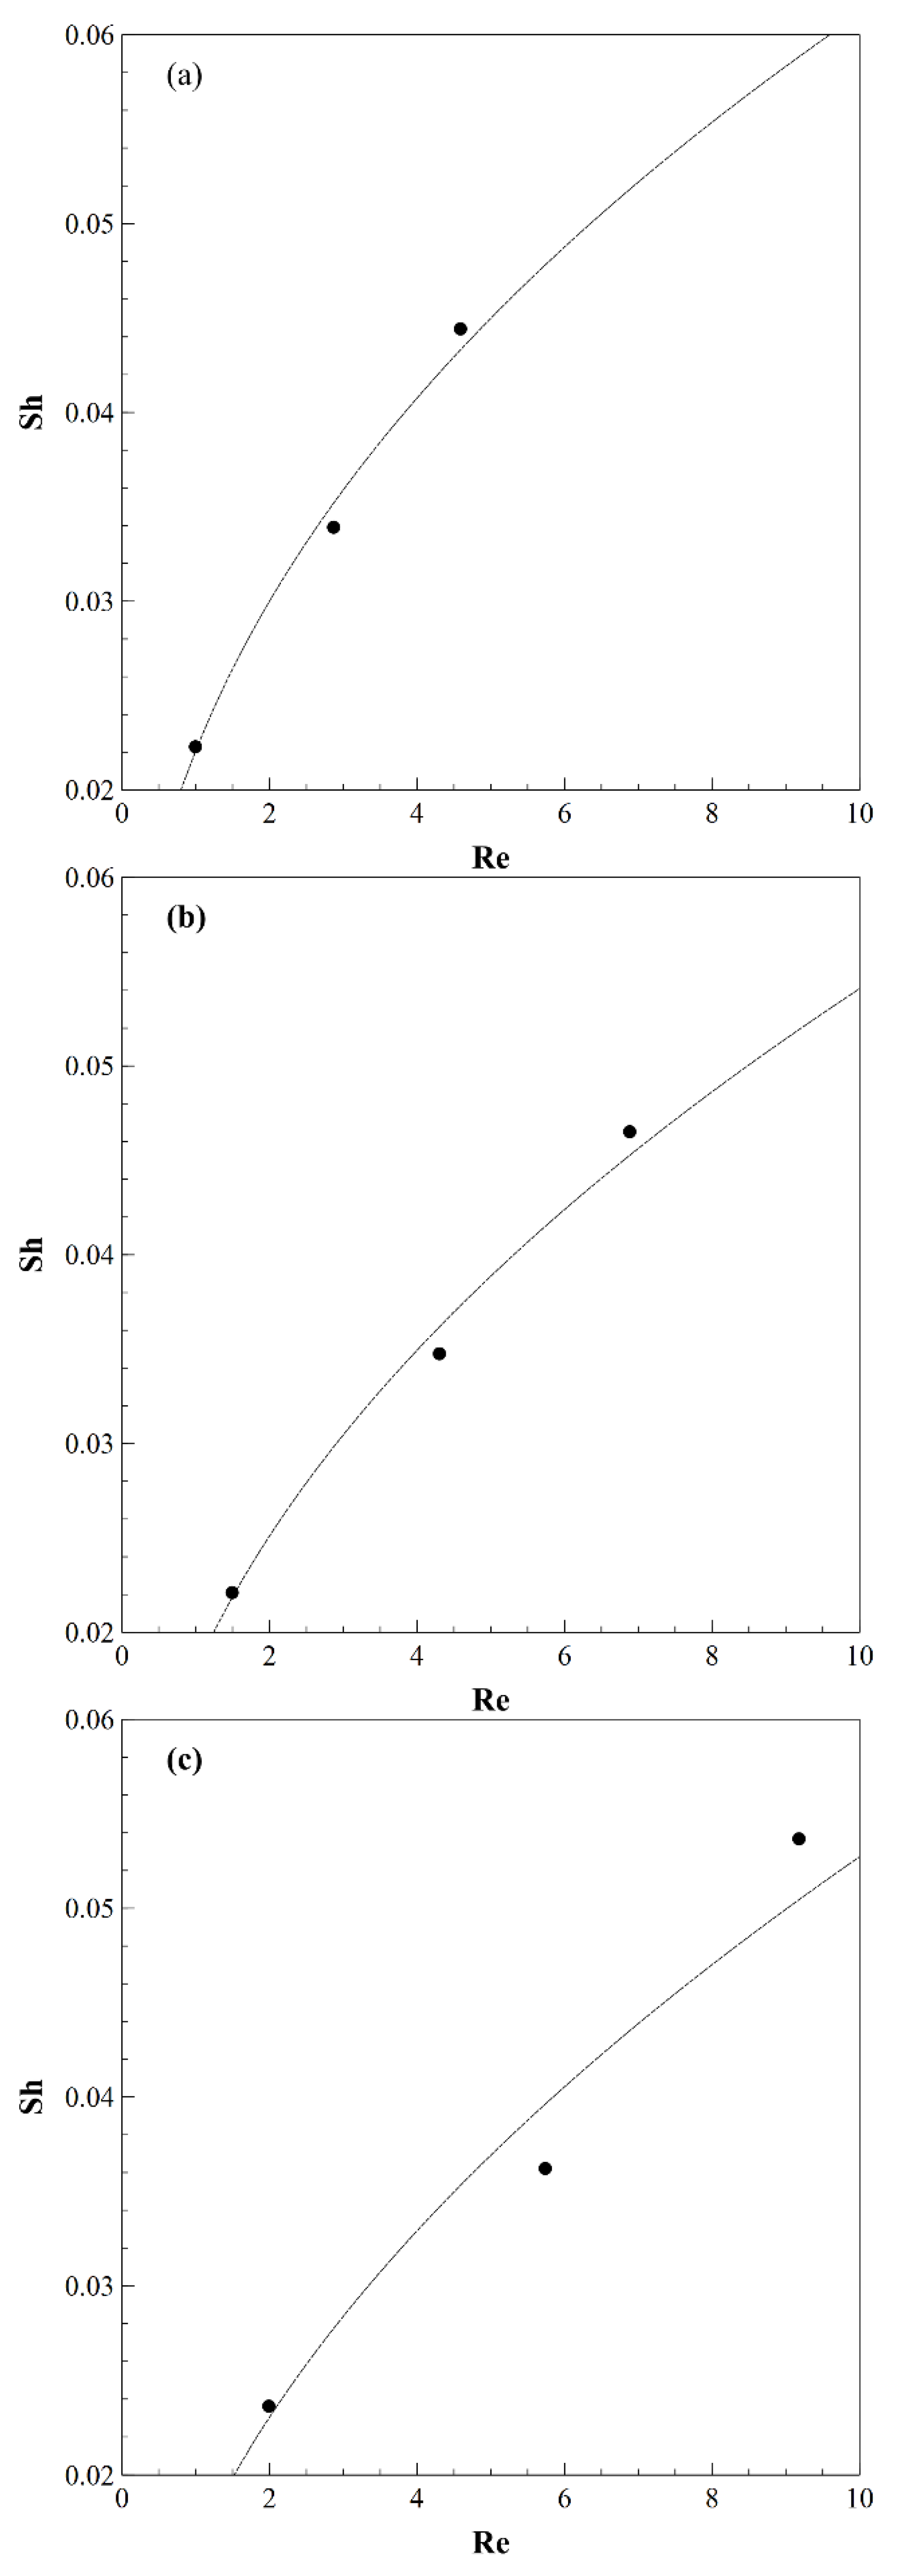
| Flow Rate [mL/min] | L/D Ratio | Kc*·104 1 [m/min] | Re | Sh | Dimensionless Correlation | R2 |
|---|---|---|---|---|---|---|
| 20 | 1 | 3.344 | 0.996 | 0.0222 | Sh = 0.0221·Re0.442 | 0.9912 |
| 5 | 5.087 | 2.869 | 0.0339 | |||
| 10 | 6.664 | 4.589 | 0.0444 | |||
| 30 | 1 | 3.316 | 1.493 | 0.0221 | Sh = 0.0180·Re0.477 | 0.9911 |
| 5 | 5.214 | 4.304 | 0.0348 | |||
| 10 | 6.978 | 6.884 | 0.0465 | |||
| 40 | 1 | 3.544 | 1.991 | 0.0236 | Sh = 0.0161·Re0.514 | 0.9624 |
| 5 | 5.432 | 5.738 | 0.0362 | |||
| 10 | 8.052 | 9.178 | 0.0537 |
| Property | Value |
|---|---|
| Length of dye column [m] | 0.093 |
| Diameter of dye column [m] | 0.0093 |
| Volume of dye column [m3] | 6.32 × 10⁻⁶ |
| Flow rate of CO2 [ml/min] | 77 |
| Initial dye [mg] | 100.7 |
| Dissolved dye [mg] | 39.4 |
| Re | 9.446 |
| Experimented dissolution curve | |
| Predicted dissolution curve |
Publisher’s Note: MDPI stays neutral with regard to jurisdictional claims in published maps and institutional affiliations. |
© 2021 by the authors. Licensee MDPI, Basel, Switzerland. This article is an open access article distributed under the terms and conditions of the Creative Commons Attribution (CC BY) license (https://creativecommons.org/licenses/by/4.0/).
Share and Cite
Park, G.; Kwon, D.E.; Kong, W.; Park, J.; Lee, Y.-W. A Dissolution Kinetic Study of Disperse Dye in Supercritical Carbon Dioxide to Design an Efficient Supercritical Dyeing Process. Processes 2021, 9, 977. https://doi.org/10.3390/pr9060977
Park G, Kwon DE, Kong W, Park J, Lee Y-W. A Dissolution Kinetic Study of Disperse Dye in Supercritical Carbon Dioxide to Design an Efficient Supercritical Dyeing Process. Processes. 2021; 9(6):977. https://doi.org/10.3390/pr9060977
Chicago/Turabian StylePark, Geonhwan, Dong Eui Kwon, Wonbae Kong, Jimin Park, and Youn-Woo Lee. 2021. "A Dissolution Kinetic Study of Disperse Dye in Supercritical Carbon Dioxide to Design an Efficient Supercritical Dyeing Process" Processes 9, no. 6: 977. https://doi.org/10.3390/pr9060977