1. Introduction
Casting is the process of injecting the molten metal solution into a pre-made mold (such as a sand mold, ceramic mold, or metal mold) and waiting for it to cool and solidify before the cast is removed. The raw material of the foundry industry in Taiwan is import-based; the castings produced in Taiwanese foundries produce tools, automobiles, aircraft, and biomedicines. According to an official survey by ITIS [
1], currently, there are more than 800 foundries in Taiwan; these are mainly small and medium-sized enterprises, and 39% of these enterprises are concentrated in the central region of Taiwan. The main casting products are automobile parts (35%), large line tool castings (25%), water hardware (20%), and cast-iron pipes (3%). These enterprises employ approximately 18,000 people and have an annual output of approximately 1.4 million tons. This NT
$90-billion industry ranks 12th in the world. Relative to the unit area and population, the foundry industry ranks first and third globally, respectively.
This research proposes solutions for the furnace zone’s inefficiency. The manufacturer under consideration is currently the largest supplier of milling materials in Taiwan. The main products of this firm are automobile parts, mechanical parts, and compressor parts. In a typical casting process, the furnace area is the beginning of the manufacturing process; therefore, a long cycle time and machine delays in this area will affect the subsequent processes. This is the reason we started the project from the furnace area: to establish a transparent input flow along the whole process chain of this foundry.
Although trial and error methods are still practical in the production field, people have made many efforts proposing various strategies to improve the foundry’s production. From different points of view, such as six sigma, lean production, and simulation, these studies are all proven successful—for example, the six sigma and Lean six sigma methods to improve quality, predictions, and productivity [
2,
3,
4,
5,
6,
7,
8]. There is a review of the analysis of foundry defects for sand casting quality improvement [
9]. Another study for quality improvement of the casting process in identifying the main course defects can be found in [
10]. In addition, in detecting the defects in cast iron foundry, DMAIC of lean six sigma is applied to work on the rejection rate [
11]. Another research study using DMAIC in the sand-casting industry enhances productivity [
12]. Some research utilized Lean Production tools such as the value stream for production efficiency improvement [
13,
14]. Reduction of waste also raised researchers’ attention, and statistical tools are used to optimize mechanical reclamation systems in cast iron foundry [
15]. Computer simulation is another tool for the performance and improvement of the production line [
16]. Machine learning technologies are also applied to improve foundry production quality [
17,
18], using decision trees, Bayesian Networks, and K-Nearest Neighbors algorithms. The design of experiments and analysis of variance are also popular; a recent related review can be found in [
19]. To be more specific, researchers also proved that the experiment and analysis of variance are applicable in foundry production improvement [
20]. A most recent review about improving sand casting foundries can be found in a conference paper [
21]. In summary, to improve production efficiency, statistical analysis cannot be neglected.
In this project, we streamlined the production process in the furnace zone based on data-driven technology. Using the furnace zone’s past production records, we calculated the output efficiency of the furnace zone. We also analyzed the data on the staff member’s work style, order scheduling, personnel scheduling, and improving the furnace zone’s production efficiency and work hour optimization. Finally, we reduced unreasonable waste in the furnace zone. Improvements with statistically significant differences are described below.
The highlight of the study was the completion of three specific key performance indicators (KPIs) with the industry–academia research partners; the KPIs included increasing the daily production to over 28 pots of melting metal, reducing the average molten metal making time to 62 min per pot, and decreasing the average cycle time in the furnace zone from 219 to 135 min. In terms of corporate management, the executives were profoundly aware of the importance of building a corporate digital culture.
2. Investigation of Process Bottlenecks
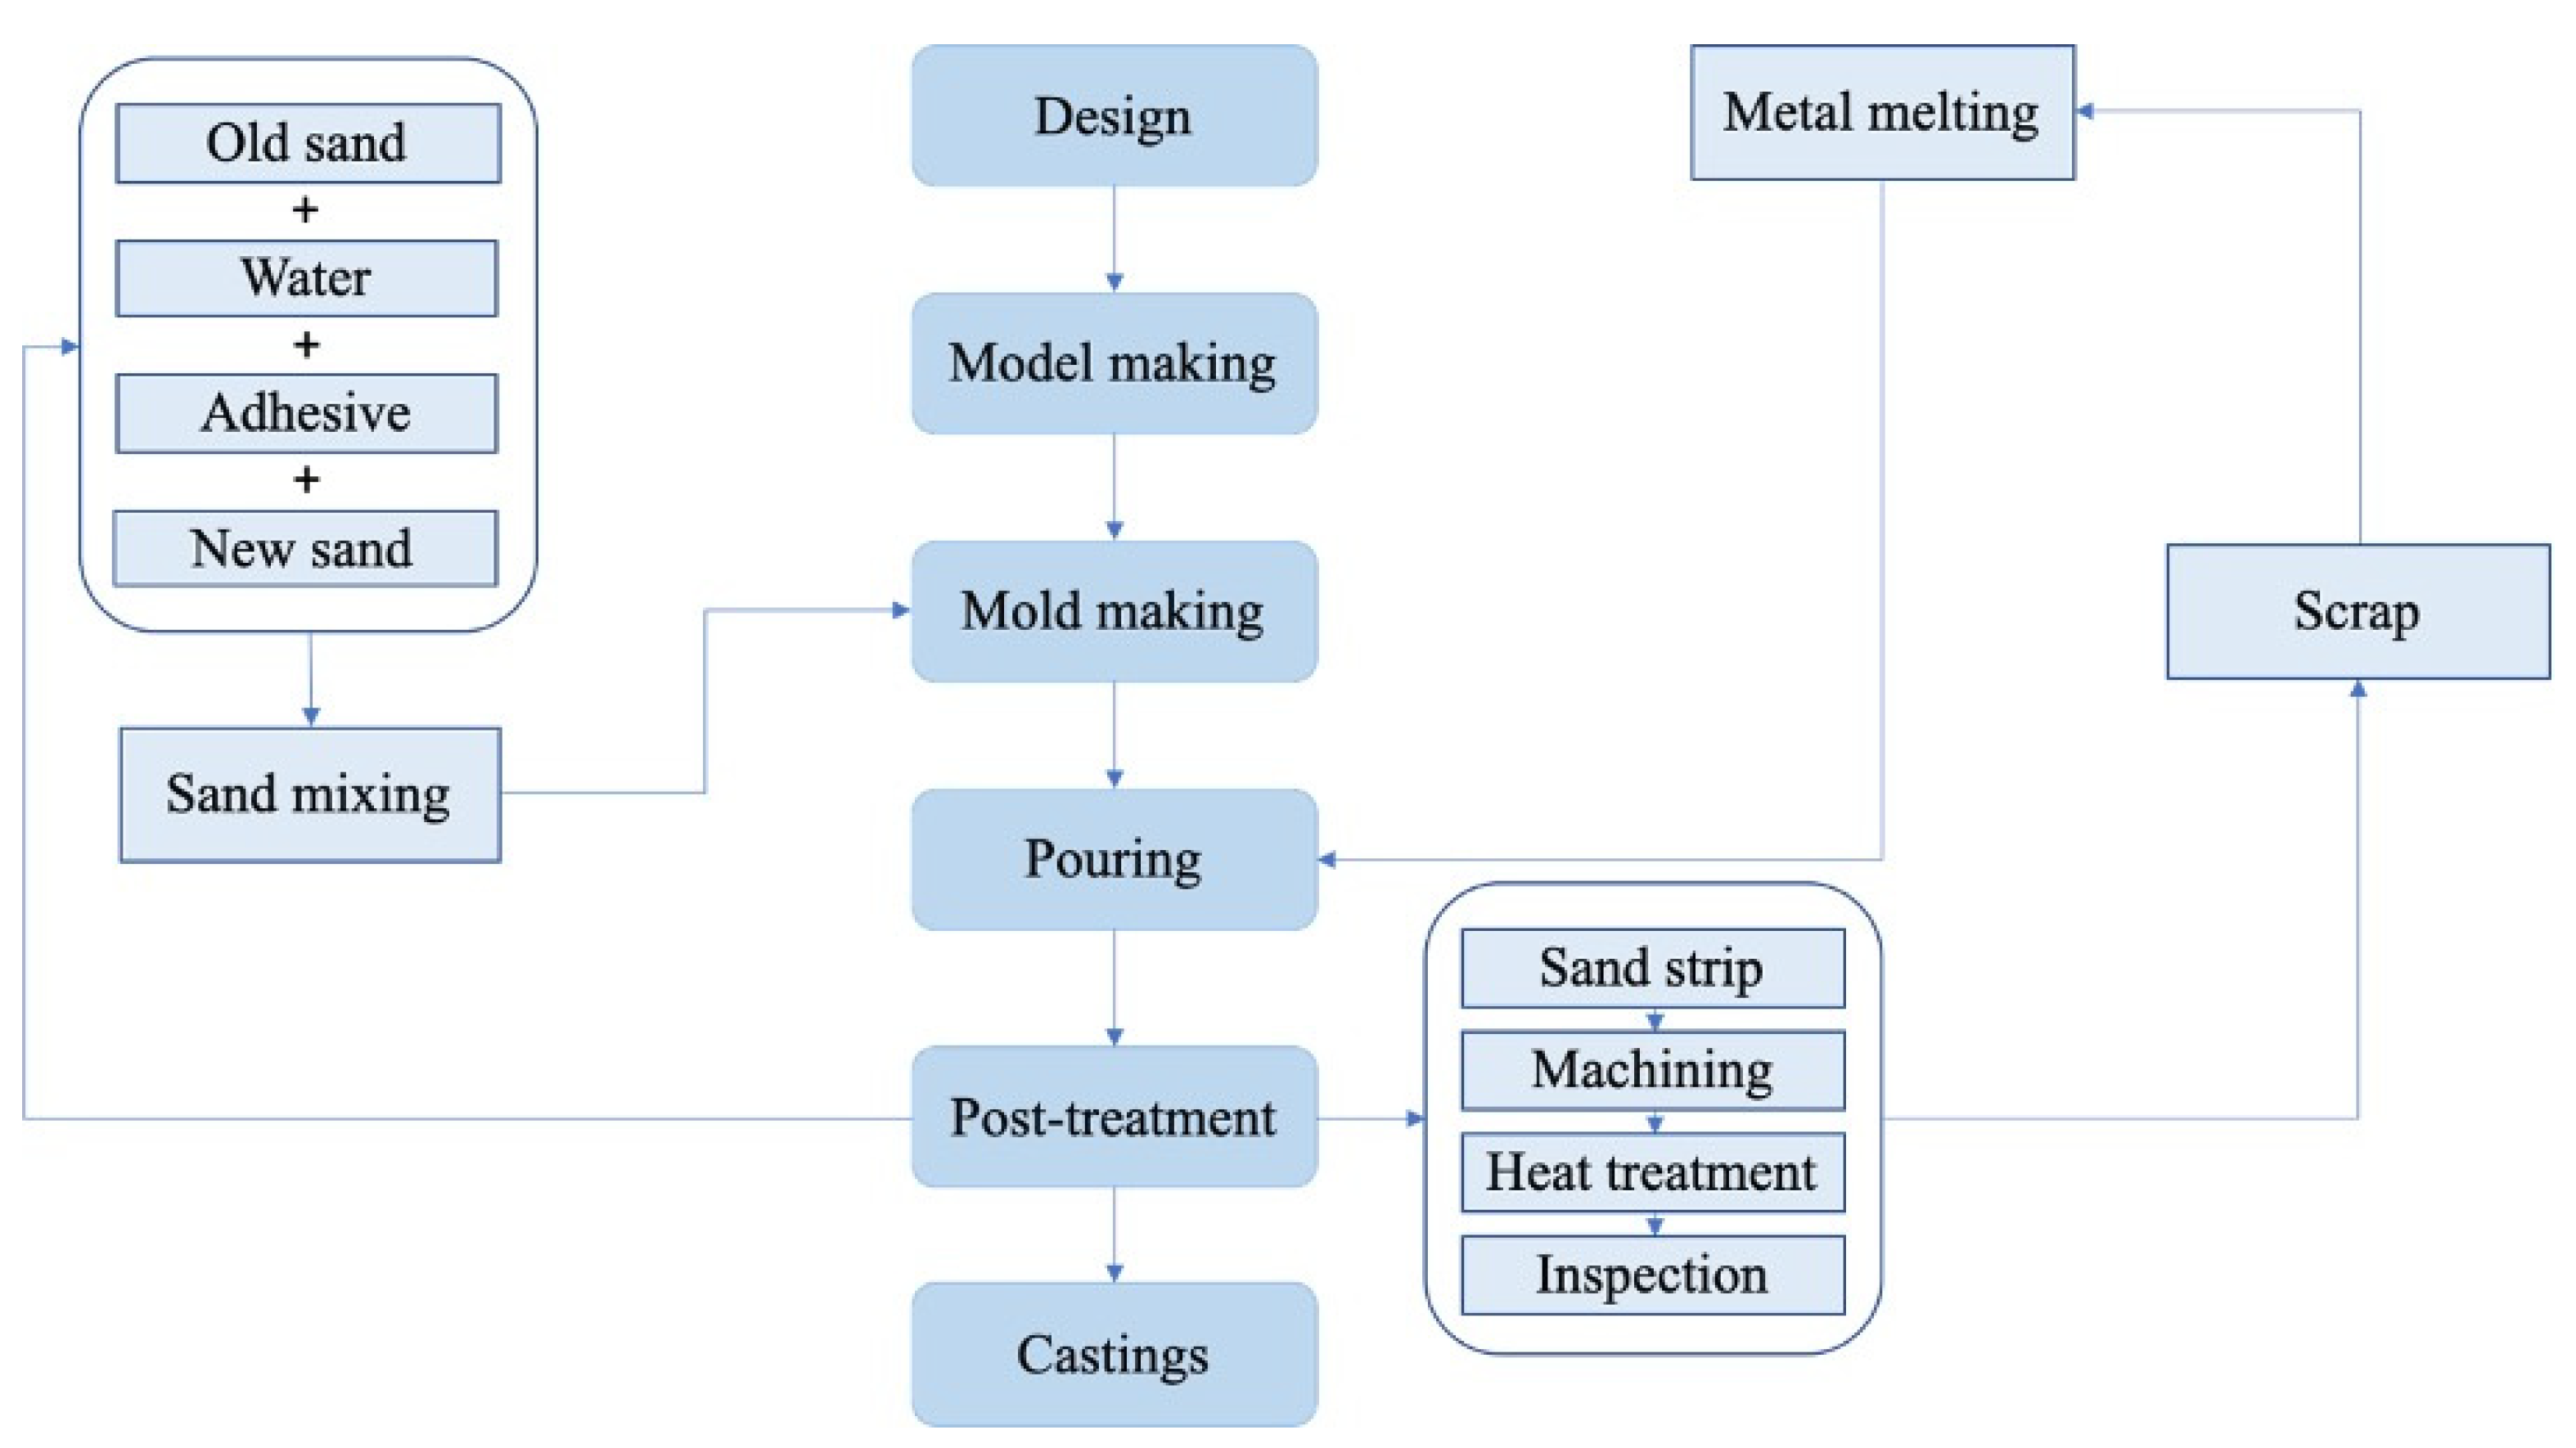
Casting involves pouring molten liquid metal into a pre-made mold at an appropriate temperature range and under specific conditions. After the liquid metal is cooled and solidified, it is taken out of the mold. The required casting process is performed after proper cleaning and processing. The casting method can be divided into two depending on the casting material: the sand-casting and special casting methods. Casting is a repetitive process; the finished casting must be designed, and the model developed. The mold can be made when the model is developed. The old sand, water, binder, and new sand are mixed to form the mold and mix in the process. After the raw materials are melted into a molten metal, the casting is poured into the mold for cooling; the cast can be completed after cleaning off remaining sand, mechanical processing, heat treatment, and inspection. The process is shown in
Figure 1.
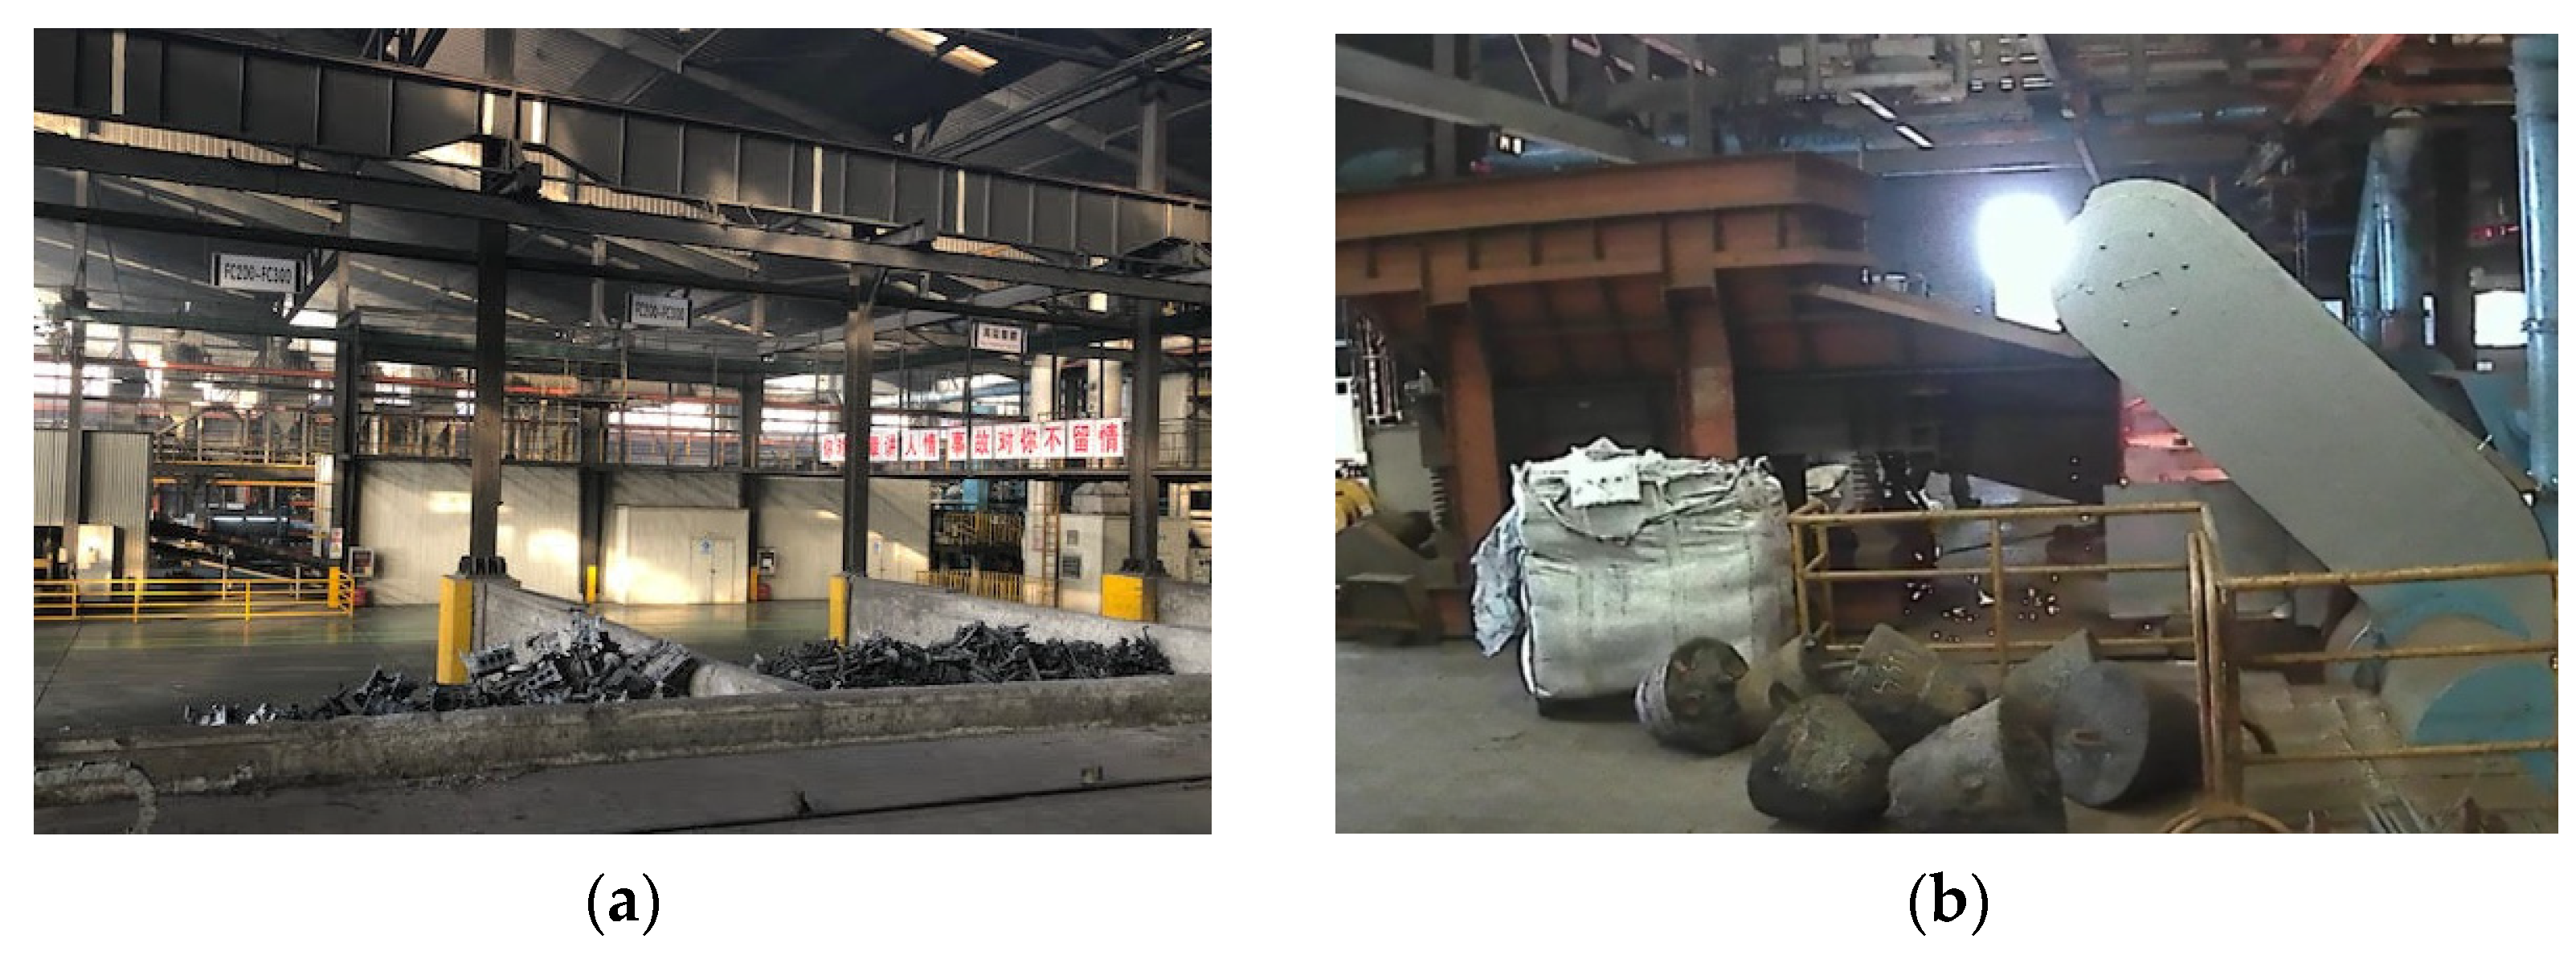
According to the production process in the furnace area, the pre-feeding operation was performed first. Depending on the composition requirements of different products, sampling analysis was performed in the preparation area to determine the required raw materials. The scene in the preparation area is shown in
Figure 2a. The crown block-type suction cup was used to move the returned material to the feeding cart when feeding. The vibration mode was then used to push the materials on the cart into the furnace (as shown in
Figure 2b); this process was repeated until the production demand was achieved. While waiting for the melting process, different materials were added depending on the final product. After all the materials were melted, a separation operation was performed to check the quality of the raw materials in the furnace and evaluate whether they met the product specifications.
If the ingredients did not meet the specifications, the mixing and tempering of the ingredients in the furnace needed to be performed in accordance with the standard operating procedure (SOP), and the subsequent manufacturing process could only be performed after the ingredients in the furnace reached the target. The above action is called thermal refining. There could be non-metallic materials in the return stock; therefore, the stock needed to be cleaned with a slag remover before it was removed from the oven. At this point, the slag rose to the surface, and the operator removed it (as shown in
Figure 3a). We call this action “removing dross” for the later content.
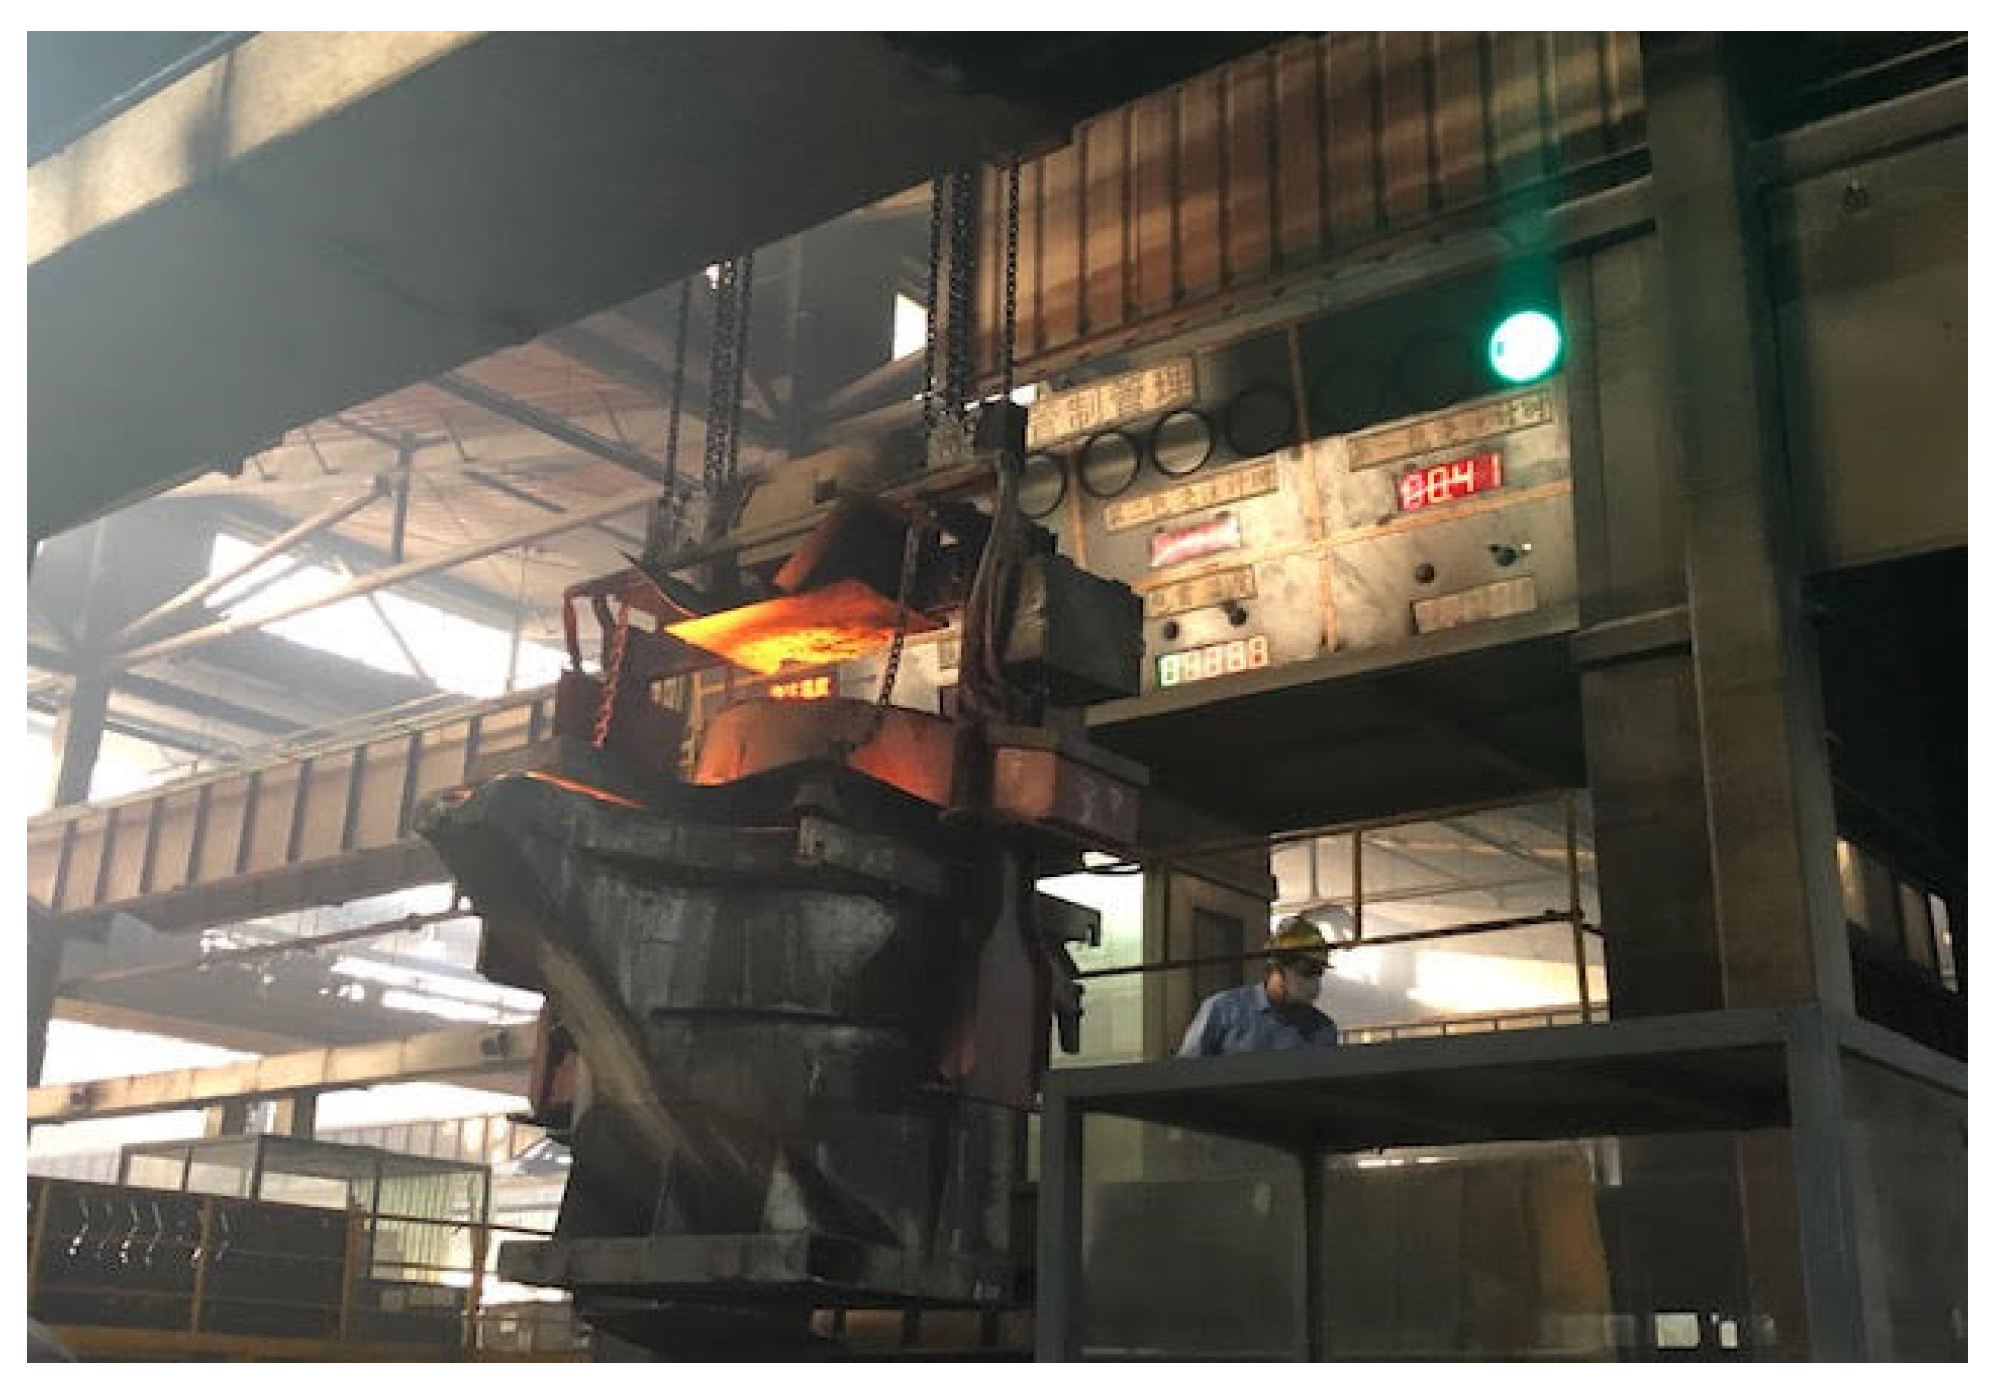
With the dross removed, the molten metal was ready. When the molten metal came out, it was poured into a hanging pot (as shown in
Figure 3b), and the potted molten metal from the hanging pot was sent to the molding machine for pouring (as shown in
Figure 4).
When making the molten metal, attention needed to be paid to the temperature and the speed at which the molding machine poured it. After the pouring process was complete, the overall process in the furnace area was complete.
At this stage, the main bottleneck of the foundry production was the furnace process. The production was divided into the furnace area and the sanding area. There were four electric furnaces in the furnace area—Furnace No. 1 and Furnace No. 2 were for one group and Furnace No. 3 and Furnace No.4 were for another group. The melting process had a maximum electricity consumption of 7000 kWh. In the plant, electricity production is divided into three main sectors: Small power (200 kWh), median power (1500–2000 kWh), and massive power (more than 3000 kWh). Two cranes were used in the process; however, they can operate only one at a time. A basin was hung on the crane to move the molten metal to the molding machine. There were two molding machine production lines in the sand mold area. The company differentiated the production lines according to the mold sizes. The larger molds are produced on the 270-production line and the smaller ones on the 230-production line.
Currently, relevant data were input by the operators, checked, and modified by senior operators while the senior operators report to the supervisor. They also record data to the electric furnace information system.
3. Analysis and Improvement
As the furnace process was identified as the bottleneck by the production manager, based on the low utilization of other workstations and idle workers, an analysis of the furnace process seems to be desired. The analysis starts from investigating the overall process in the furnace zone, followed by the investigation of scheduling, analysis of process time statistics, and so on, as stated in the following sections. We applied statistical methods to identify the source of variation and distinguish the factors with a significant difference using Analysis of Variance (ANOVA) and Least-Significant Difference (LSD) analysis. As for improving the process and scheduling, we implemented concepts from lean production, quality management, and facility layout, utilized methods such as standardization of input and operations, waste reduction, re-arrange layout, and increased productivity and decrease of cost.
3.1. Reducing the Size of Material Fed
We studied and improved the feeding stage by reducing the size of the material fed. The financial constraints often force companies to use low-cost remanufactured materials rather than ferrosilicon or silicon steel sheets. Such low-cost materials are often in different sizes and shapes, which may delay the preparation time. In other words, with a small furnace (diameter about 1 m), larger recycled metal with various shapes would make it difficult to feed the raw material to the furnace at one time using the crane-type battery suction cups (as shown in
Figure 5a). Therefore, the initial preparation stage frequently takes a long time. Defining the preparation time before adding raw material to the furnace, we called it “the preparation stage.”
Another problem generated by such irregular raw material is the safety issue. When the volume of the raw material is larger, or the length of it is greater than the depth of the furnace, the dissolution time will increase, and, most importantly, a possible bridging phenomenon may occur. The bridging phenomenon occurs when the material gets stuck in the furnace. When the material underneath is melted, a distance will be created between the stove and the stock. If the operator manually pushes the material into the furnace at this time (as shown in
Figure 5b), a splash of hot molten metal may hurt the operator. Therefore, before feeding the raw material, it is suggested to cut or reduce the raw materials’ volume to fit the diameter of the furnace at the preparation stage.
3.2. Improvement of Production Process at the Preparation Stage
The original data used in this study were obtained in the form of daily records either in paper form or an Excel file by a senior operator in the field. However, the wrong records can still be found frequently and verified by the production manager at the end of the shift or the second day before their daily seminar in the morning. In the seminar, the summary data will be reported, challenged, and modified if necessary. The analyzed data in this research were transformed from the paper forms and Excel files.
By investigating the actual production schedule of the electric furnaces, we found that the average cycle time of generating a pot of molten metal can be reduced by better scheduling at the preparation stage. To explain this, we take one production record (13:12~13:46) with four furnaces working simultaneously as an example, as shown in
Table 1. In
Table 1, the actions are pouring the molten metal (to the moldings), heating the furnace, adding raw material, sampling, thermal refining, removing the dross, preparing raw material, and stopping heating. Most of the action can only follow its precedent process closely, but not raw material preparation. It can be observed from
Table 1 that the material preparation for Furnace No. 3 could be advanced to 13:15 (i.e., 15 min earlier) or earlier because the furnace operations would not be affected by the material preparation. Thermal refining of furnace No. 3 cannot start right after adding raw material (13:30) because government regulation limits electricity usage (up to 6000 W). Before 13:30, Furnace No.1 uses 3000 W, and No.4 uses 2500 W, making no room for other operations. Confined by the aforementioned limitation, only 15 min can be saved in this period. The firm’s power consumption is up to 6000 KWh for the electric furnace but usually keeps it under 5500 KWh. Some records with similar findings were found. Hence, we proposed to prepare the raw material whenever an operator is available. The allocation of electricity is then re-scheduled and resulted in some power consumption savings. The current workforce is sufficient to execute the action.
3.3. Statistical Analysis of Processing Times in the Furnace Zone
Another issue was raised when we were scheduling, and we analyzed the relation between the process times in the furnace zccone versus 11 types of material using analysis of variance (ANOVA) in the melting phase. For better understanding, we call it “molten metal making time,” which includes all the operations in the furnace zone, starting from adding raw material and ending when the molten metal is ready to be transported. We use 1932 sets of data during 2018/1~2018/7, and the 11 types of materials are Grey Cast Iron 1~ Grey Cast Iron 4, Nodular Cast Iron 1~ Nodular Cast Iron 4, Nodular Cast Iron 6, Nodular Cast Iron 6A, and Nodular Cast Iron 8. Grey Cast Irons are named FCs, and Nodular Cast Irons are named FCDs in the firm, shown as levels in
Figure 6. During this period, 14 operators worked in the furnace area.
By observing the mean and variance of collected data, we suppose that some significant variance may exist. To clarify if the molten-metal-making times differ from different materials, we performed the hypothesis test.
We apply JMP
® Software from SAS to perform Analysis of Variance (ANOVA).
Figure 7 shows that the average molten metal making time is 75.68 min, and there was no significant difference (
p-value = 0.4104 > 0.05) in the average molten metal making time when using different materials. Therefore, another test was performed to attack the problem. The full names of notations in the following analysis are briefly introduced below.
Adj Rsquare: Adjusted R2, where R2 is the coefficient of determination.
C. Total: Corrected Total, means Total variation.
DF: Degree of freedom
p-value: A p-value is a measure of the probability that an observed difference could have occurred by chance. The higher the p-value, the smaller the statistical significance of the observed difference.
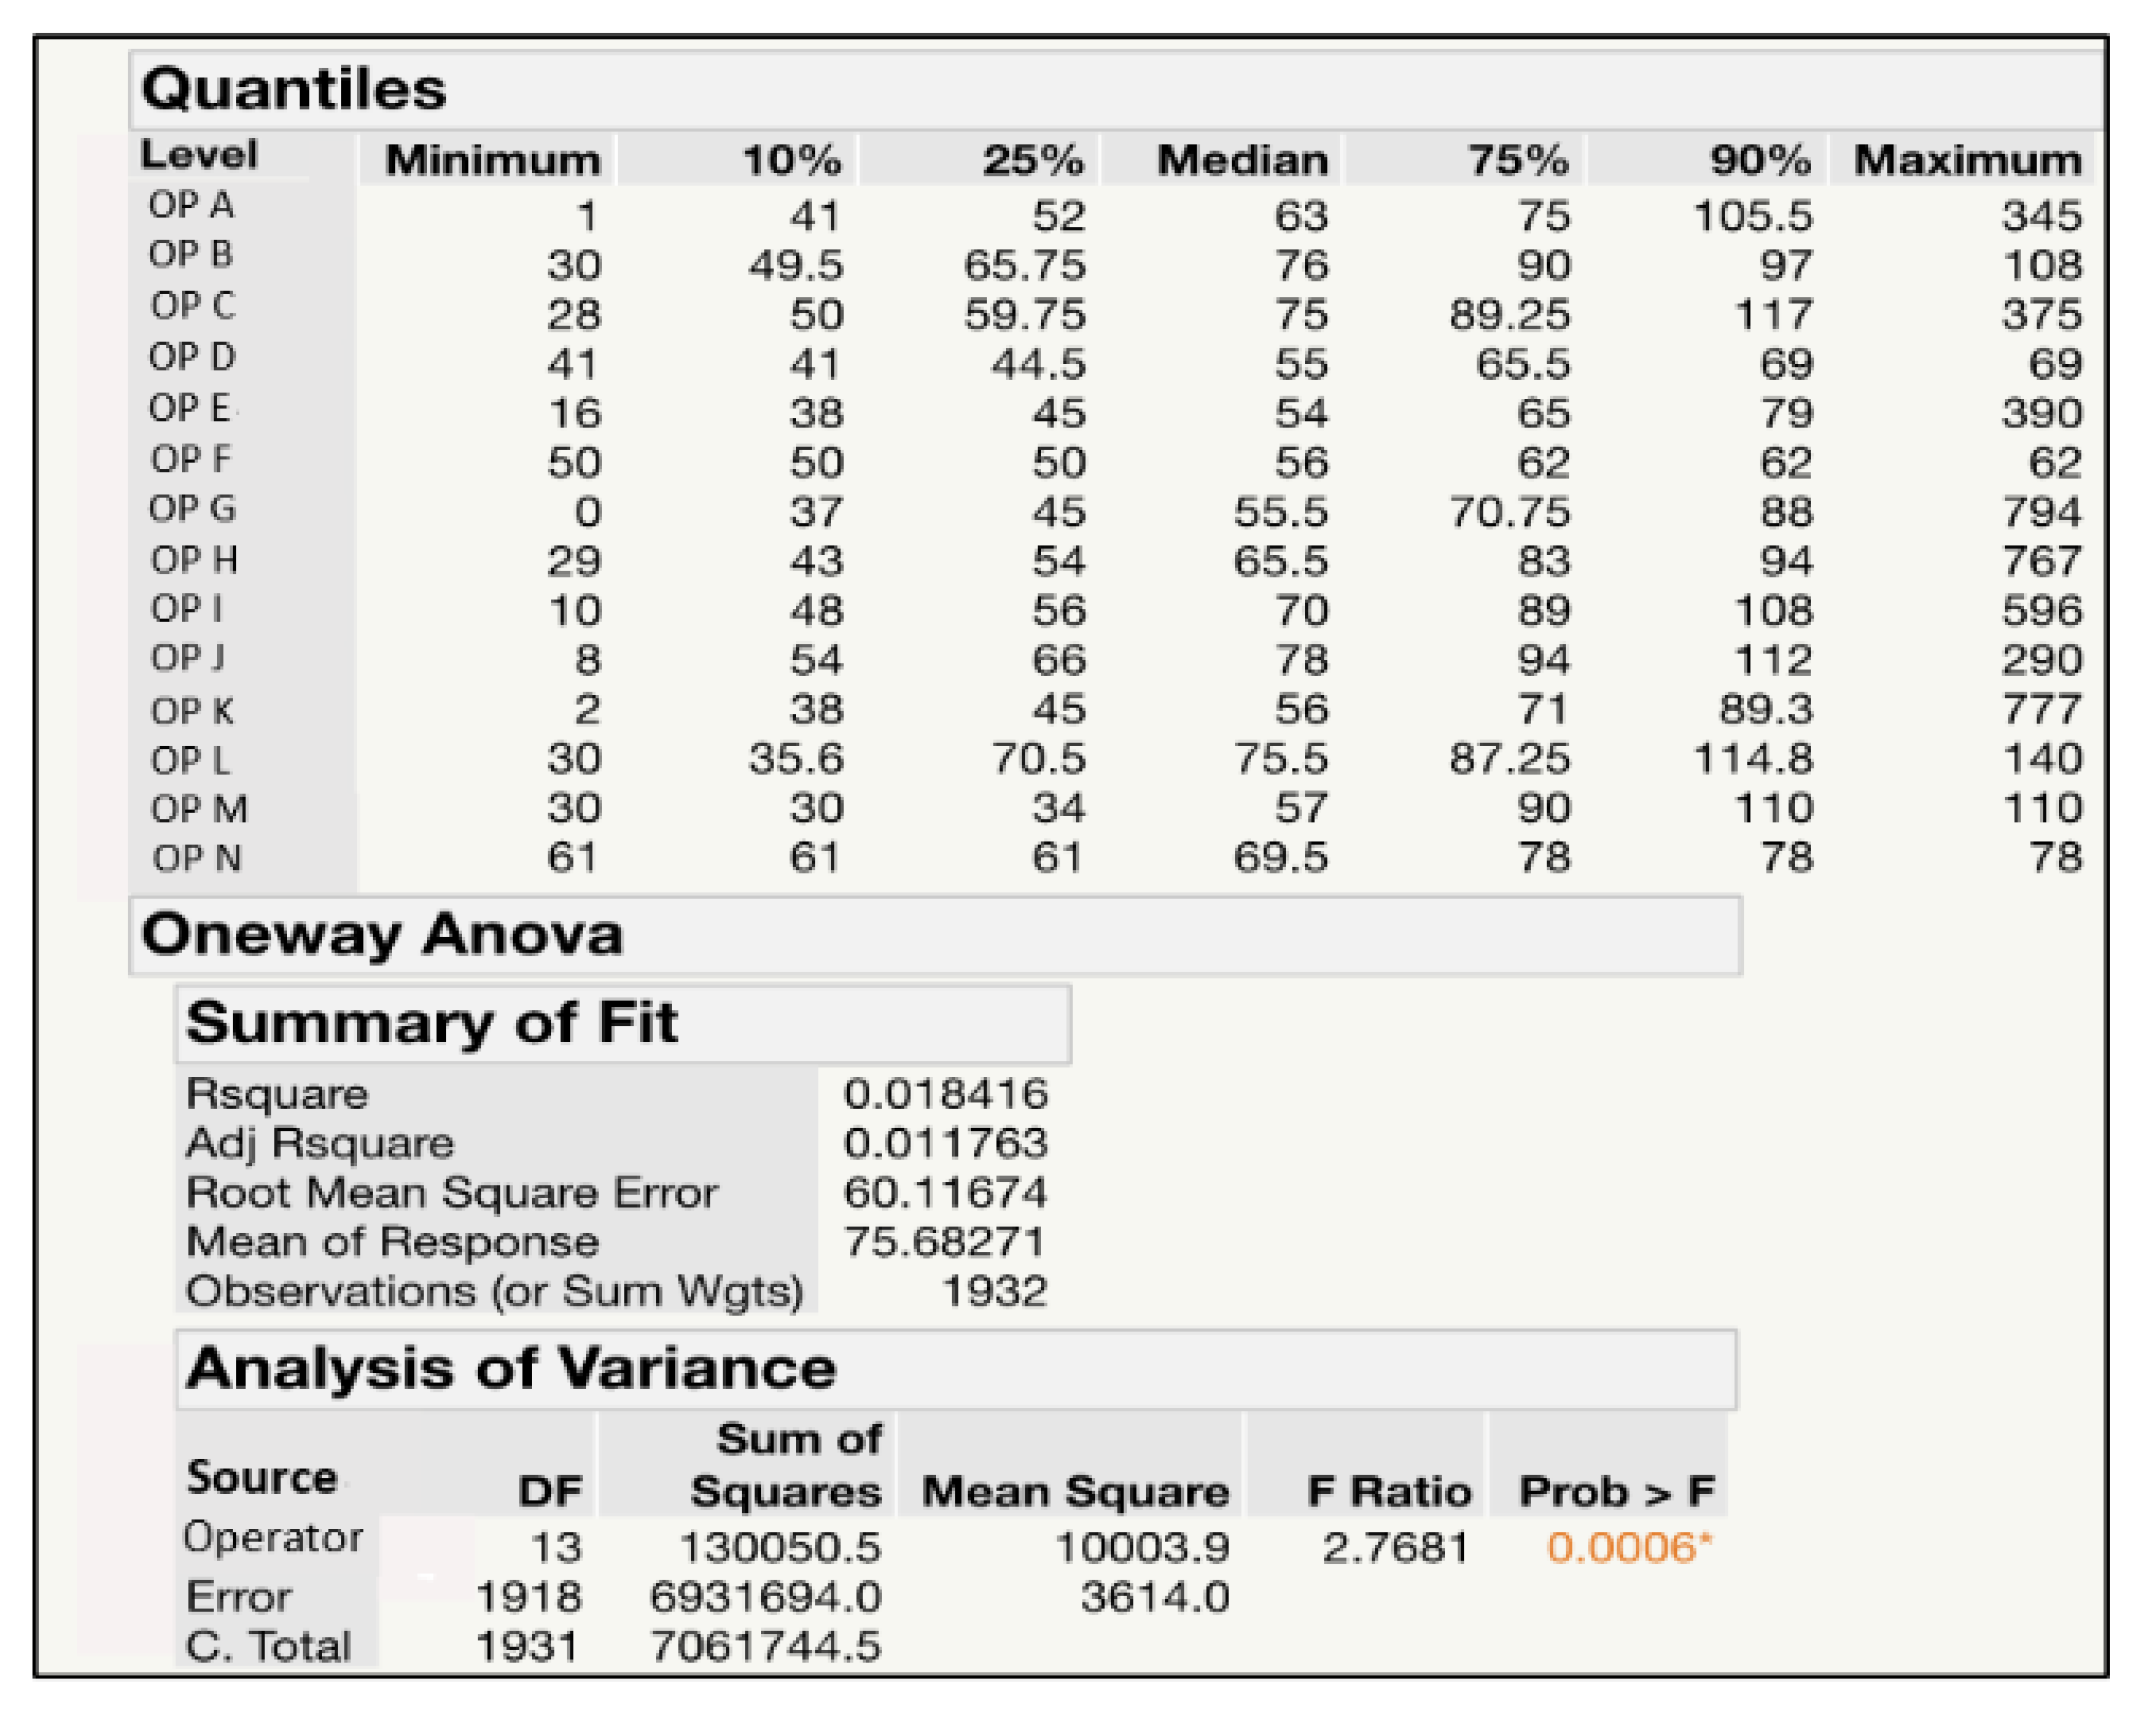
With the suspicion that operators may cause the difference, we performed this ANOVA. The result is shown in
Figure 7 and shows that, with a
p-value < 0.05, we reject the null hypothesis and conclude that not all molten-metal-making times are the same for different operators. In other words, some operators took significantly different times in the melting process.
The manager agreed with the above conclusion since the furnace operators have different levels of skills. To pinpoint who is taking longer in molten-metal-making times, we proposed the Least-Significant Difference (LSD) analysis of operation times, and the result is in
Table 2. In
Table 2, we can divide the operators into three groups: With the letter A only, with letters A and B, and with the letter B only. Operators with both A and B led to no significant differences in molten-metal-making times. It can be observed from
Table 2 that operators with only the letter A took a longer time (>81 min) than operators with the only the letter B (~60 min) to melt the raw material. In short, operator I, operator J, and operator C took longer, and operator E took less time than others to finish the process. Taking operator J and operator E as an example, there is a significant difference between their average melting times (
Figure 8). The conclusion is made in accordance with no overlapping between their 95% confidence intervals in molten-metal-making times. Ensuring that the product’s quality would not be affected by reducing the melting time, which the company verifies, we proposed controlling the melting time to around 60 min for all operators. The judgment that “the product quality will not be affected by the length of molten-metal-making times” can also be reasonably inferred since no quality issue was raised from these 1932 observations, where a large variance in molten-metal-making times existed. The firm then requested all operators to follow the standard operating procedure (SOP) to ensure the molten-metal-making time was about 60 min.
As the initial production cost, electricity consumption is an essential issue to the company. However, the usage of power is controlled by the operators who make the decision according to their own experiences, which causes difficulty in controlling the electricity consumption. By standardizing the melting process, the coordination of electricity consumption becomes possible. As a result, the company saved an average of $240,000NT each month (2018/8~2018/11).
3.4. Improvement of Thermal Refining
Next, we attempt to improve the process in the furnace zone. By observing the production records in
Table 1, we noticed that the thermal refining operation takes place only once in many productions, whereas sometimes it happens 2–4 times.
Table 3 shows a record of Furnace No. 4 operations with Nodular Cast Iron 2 material (called FCD2), where the red squares represent the occurrence of thermal refining. A general procedure of melting metal in a furnace consists of heating up the furnace, verifying the ingredients by spectral inspection, adjusting the ingredients by adding Si, Fe, etc., as a supplement, spectral inspection again, and removing dross. Adjusting the ingredients is called thermal refining, and ingredients need to be adjusted repeatedly until the spectral inspection is passed. One additional thermal refining takes 10 more minutes before finishing the melting process. Such a failure would delay the production schedule and increase the electricity cost for maintaining the temperature. Therefore, to reduce the cycle time of generating each pot of molten metal to enhance productivity, it is desirable to lower the frequency of thermal refining and reduce the thermal refining time.
To lower the frequency, it is necessary to know the ingredients of raw materials in the preparation stage. The raw materials from different suppliers with various ingredients used to be orderless, making it difficult to know exactly which ingredients were in the preparation stage. Now, the raw materials are classified while purchasing, and the proper materials will be selected to fit the product formular. To reduce the thermal refining time, we shortened the time taken for adding supplement ingredients by re-arranging and fixing the location of ingredients bins so the operators can easily fetch what is needed without searching. The most frequently used ingredient Si is located closer to the operators and the number of bins are increased from 2 to 4, one bin for one furnace.
As the result in 2018/8~2018/11, 95% of the process needs no thermal refining, 4.5% needs it once, and 0.5% took more than once.
3.5. Statistical Analysis of Molten Metal Consuming Times
As described in chapter 2, when the molten metal is ready, it will be poured into a hanging pot and transported to the molding machine for pouring into the molds. It often takes several instances of pouring for the molding machine to consume all molten metal. With defining the time between “start to pour molten metal into a hanging pot” and “consume all molten metal” as the “transportation time,” the average transportation time of 1932 transportations was 49.70445 min, as shown in
Figure 9. We discovered that there exist large variations in transportation time, and we test the following hypothesis to verify whether the materials make a difference (
Figure 9).
From
Figure 9, we can conclude that not all transportation times are the same with different materials (
p-value = 0.01333 < 0.05). To pinpoint which materials make a difference, an LSD analysis is performed and the result is as shown in
Table 4.
From
Table 4, we can observe that the transportation of FCD2 (~55.1 min) is much longer than FCD8 (~40.5 min). However, theoretically, the material should not make a difference. We further discussed this with the engineer and found that the transportation time is related to the size of the molds. The suggestion to the firm is to consider the mold sizes when scheduling.
4. Discussion
After discussing the results of the study with the manufacturer, the recommendations and improvements are summarized below.
Improvement: Speed up the melting process and reduce the risk of injury.
Improvement: Reduced cycle time of molten metal making and some power consumption saving.
Improvement: Reduced cycle time of molten metal made from 72.3(2018/1~7) to 62.1 min (2018/8-11), and the standard deviation decreased from 16.6 to 14.9 min.
Improvement: Lower the frequency of thermal refining and reduce the processing time. The processing time is reduced.
From January to July in 2018, the average electric power consumption per ton was 665 KWh. From August to November, the average electric power consumption per ton was 634 KWh. Adopting our proposals, the electric power consumption per ton was reduced, and the firm can save NT$240,000 per month. The variations of the processes ranging from feeding, melting, tempering, and delivery times were reduced. The average cycle time of producing a pot of molten metal was improved from 219 min to 135 min. The daily production was uncontrollable, ranging from 20 to 30 pots of molten metal, and it is now more than 28 pots of molten metal every day.
5. Conclusions
Data analysis is becoming more and more important, and our project is an example of organization in the process of automation. We started improvement from the bottleneck, standardized the input and procedure of operations, performed basic statistical analysis to identify the source of variation, eliminated waste (waiting time), and maintained a smooth flow.
Based on our suggestions, the firm improved its production schedules and processes, used statistical methodologies for data analysis, reduced the production cycle times, decreased the power consumption, and eventually decreased the production cost. Another important contribution of this project is to promote the executives the importance of data analysis.
The research limitation was that some historical data were missing or mistaken, which cost us much time to collect the desired data. Another problem is that some operators signed other operator’s names instead of their own names, which caused the mismatch of data.
Our future study will focus on the line balancing of all workstations using system simulation tools, as the input flow of the first station has been stabilized. Another goal will be further reducing the power consumption since it is the primal cost for the plant.


