5.2. System Optimization
A solar collector (SC) can effectively improve the overall performance of SCAHP. However, due to high initial investment and different climate conditions in various regions, there are certain difficulties in system design. At the same time, as a key component of the system coupling, a hot water storage tank (ST) also has some difficulties in design. There are few researches on the optimization of heat pump drying system configuration. This research tries to give some suggestions.
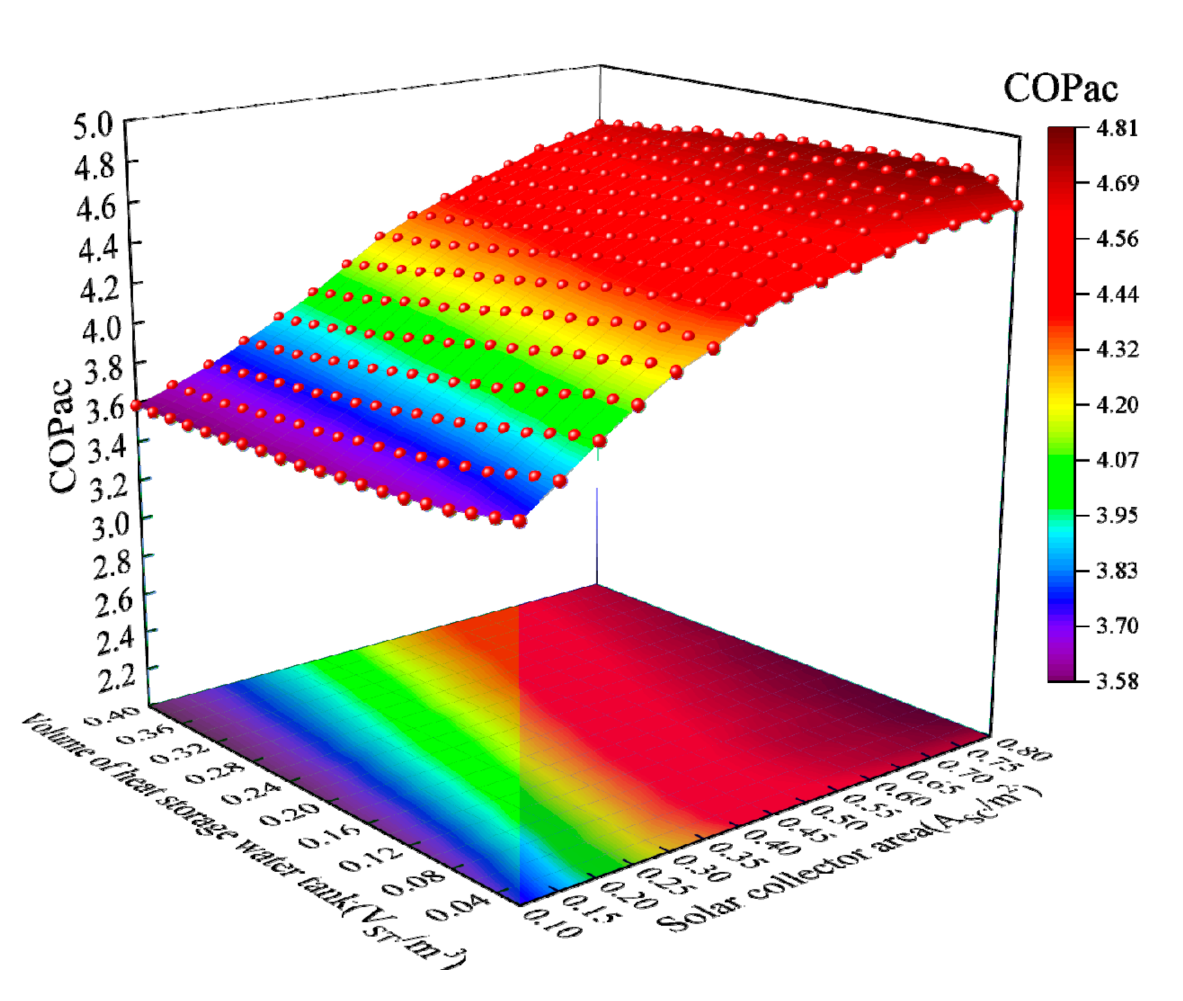
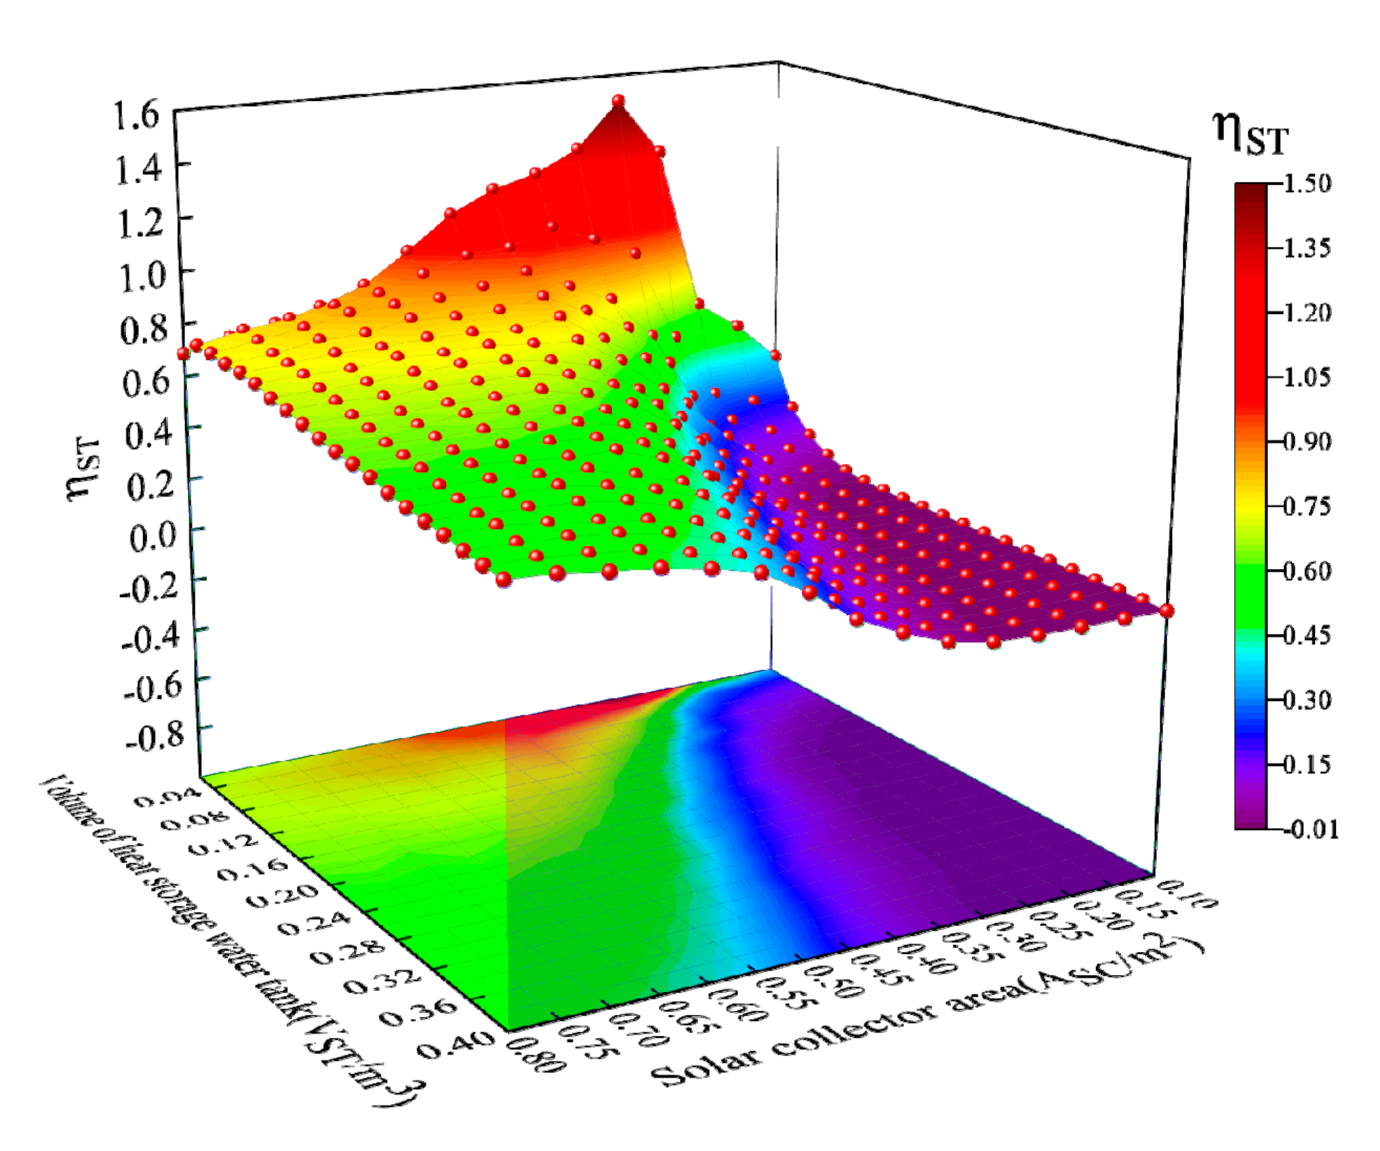
As shown in
Figure 11, the annual cumulative efficiency of the system
shows an increasing trend with the increase in the area of solar collector
. This is because as the
increases, the proportion of solar heating in the overall heating of the system increases, and the proportion of air-water heat pump (HP) heating is reduced, the total energy consumption of drying room (DR) remains unchanged, the power consumption decreases, and the
increases accordingly. In this configuration,
is 3.571~4.805. As the volume of heat storage water tank
increases,
gradually slows down as the
increases. When the
is
, as the
increases, the
with a larger
system will always surpass the system with a smaller
at a certain point. When the
is
, as the
increases, the
shows an overall downward trend. This is due to the large
, the temperature rise of ST is slow, and the heat in the ST cannot be effectively and timely passed to the BT. As a result, on the one hand, the heat collection pump is idling, which increases energy consumption. On the other hand, it cannot effectively reduce the heat supplied by the heat pump and the solar collector cannot be used to the maximum extent, which leads to a decrease in the
.
Figure 11 also reveals that when the
is
, the
shows a decreasing trend as the
increases, and when the
is
, the
increases first and then decreases as the
increases; this is because the smaller
cannot fully release the heat supply potential of the larger
, and as the
increases, the
corresponding to the highest value of the system efficiency also increases. When
is 0.4, 0.5, and 0.6
correspond to ST with volumes of 0.04, 0.08, and 0.1
, respectively, so that the
reaches the corresponding maximum value. In addition, it can be seen from the figure that when the
is
, the distance between the lines is relatively sparse. Within this range, as the
increases, the
increases rapidly. When the
is
, the distance between the lines is relatively dense. In this range, as the
increases, the system efficiency increases slowly, which shows that when the
is increased to
, the system has been mainly heated by the SC, and the HP has played a smaller role. It is recommended to use solar collectors with an area less than
in this system.
In summary, the coupling of the SC and ST is very important. Different require designing a ST of appropriate volume. In order to find this appropriate value, we introduce the surface-to-body ratio (SBR): , Among them, and respectively represent the and the corresponding to the optimal . is the volume of BT, taking . It can be calculated that the value is concentrated between 3.182~4.091 under the premise of the recommended value.
As shown in
Figure 12, when the
is
, the
increases first and then decreases as the
increases. When the
is
, the
shows an increasing trend as the
increases. As the
increases, the
corresponding to the maximum
becomes larger. This is because the larger the
, the slower the temperature rise, and a larger
is required to provide sufficient heat.
Figure 12 also reveals that when the
is
, the
shows a decreasing trend as the
increases, when the
is
, the
will first increase and then decrease as the
increases. This is because the
is too small compared to the
, and it cannot store enough solar collector heat. As a result, the heat generated by the SC cannot pass into the BT in time, and the HP needs to be turned on to provide heat to the BT, and the heat generation potential of the SC is not fully utilized. When the
is
, the distance between the lines is relatively dense. In this range, as the
increases, the
decreases slowly. This shows that when the
increases to
, it is enough to meet the energy demand of the system. The decrease in the
is mainly caused by the increase in
. This shows that more heat from the SC is wasted, which confirms the analysis result in
Figure 11.
To sum up, take the as the goal, and based on the effective value of this calculation, the best SBR can be calculated from 1.923 to 4.444, and the corresponding to the maximum is greater than . It can be seen that the does not match the overall efficiency of the system. It is recommended to choose a small after selecting the , and increase the to avoid too much heat from the solar collector being wasted. Combining increasing the and will also increase the initial investment, and it is recommended not to take the as the first choice for system design.
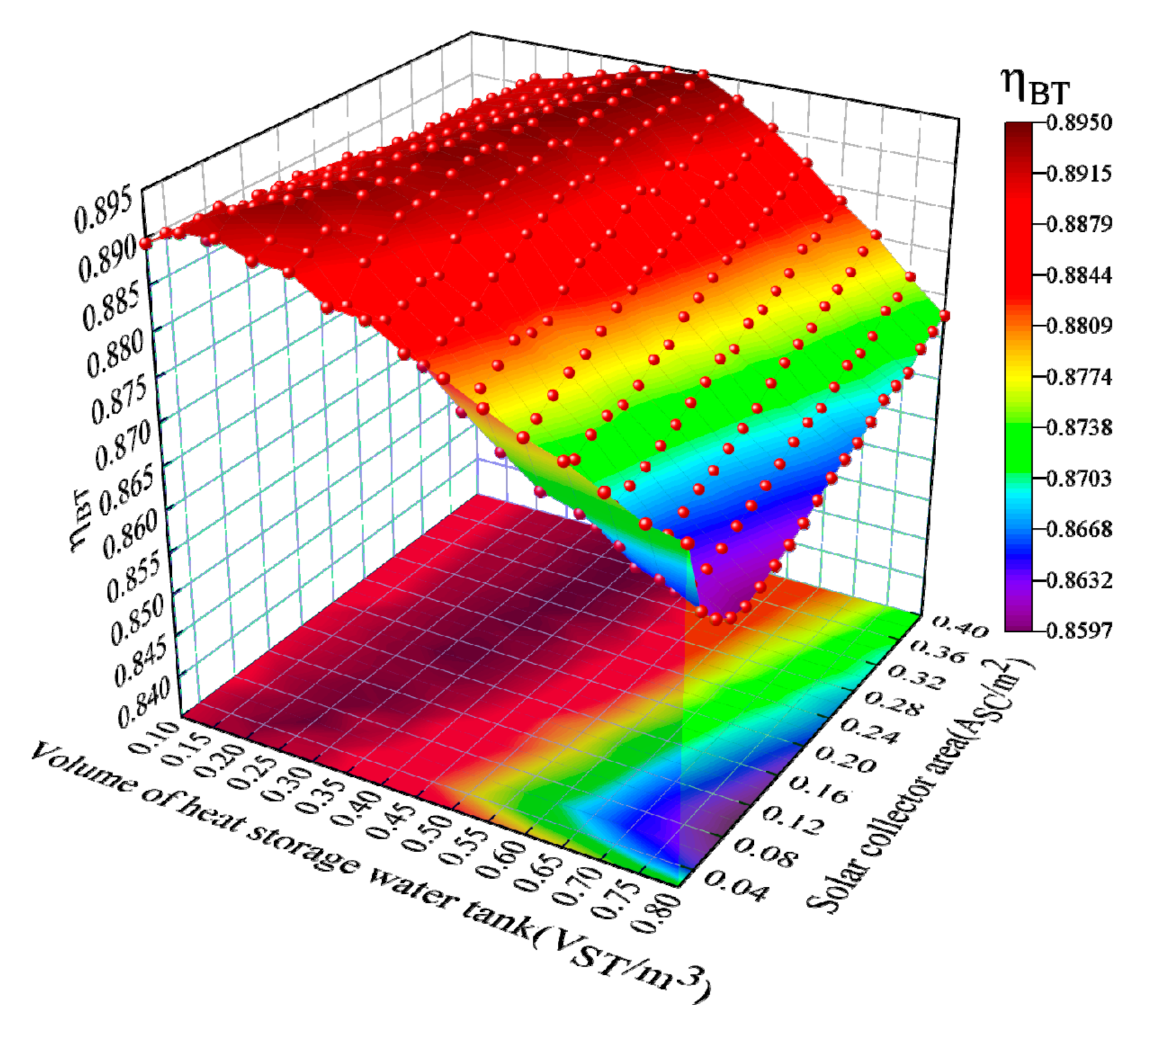
As shown in
Figure 13, the
shows a trend of increasing first and then decreasing as the
increases; this is because when the
is relatively small, the heat of the BT comes from the HP.The HP heats the BT to 65 °C, and during the process of lowering the temperature of the BT, the heat loss is large, which causes the
to be low. As the
increases, the heat received by the BT from the SC increases, and the BT will no longer rise to 65 °C frequently, thereby reducing heat loss and improving
. With the further increase in the
, enough heat can be stored in the ST. When the system shuts down at night, the heat from the ST will be transferred to the BT, and then it will interact with the surrounding atmosphere in the BT. The heat exchange causes waste, and the
is gradually reduced. This problem will be solved in a non-stop system.
Figure 13 also reveals that when the
is
, the
shows a basically unchanged trend with the increase of
, during the whole process, the
changes at most by 1.49% and at least 0.44%, which can be ignored. This is because the SC cannot provide sufficient heat for the BT to lose heat at night. When the
is
, the
decreases first and then increases as the
increases, this is because SC can provide sufficient heat at this time, the ST has a small volume and a high temperature. When it is shut down at night, the ST can provide more heat to the BT, resulting in greater heat loss, as the
increases, the temperature of the ST decreases the amount of heat transfer is reduced, the heat loss is also reduced, and the heating efficiency of the BT is gradually improved. In summary, the system configuration required for the maximum efficiency of the BT is different from the system configuration required for the maximum efficiency of the ST.
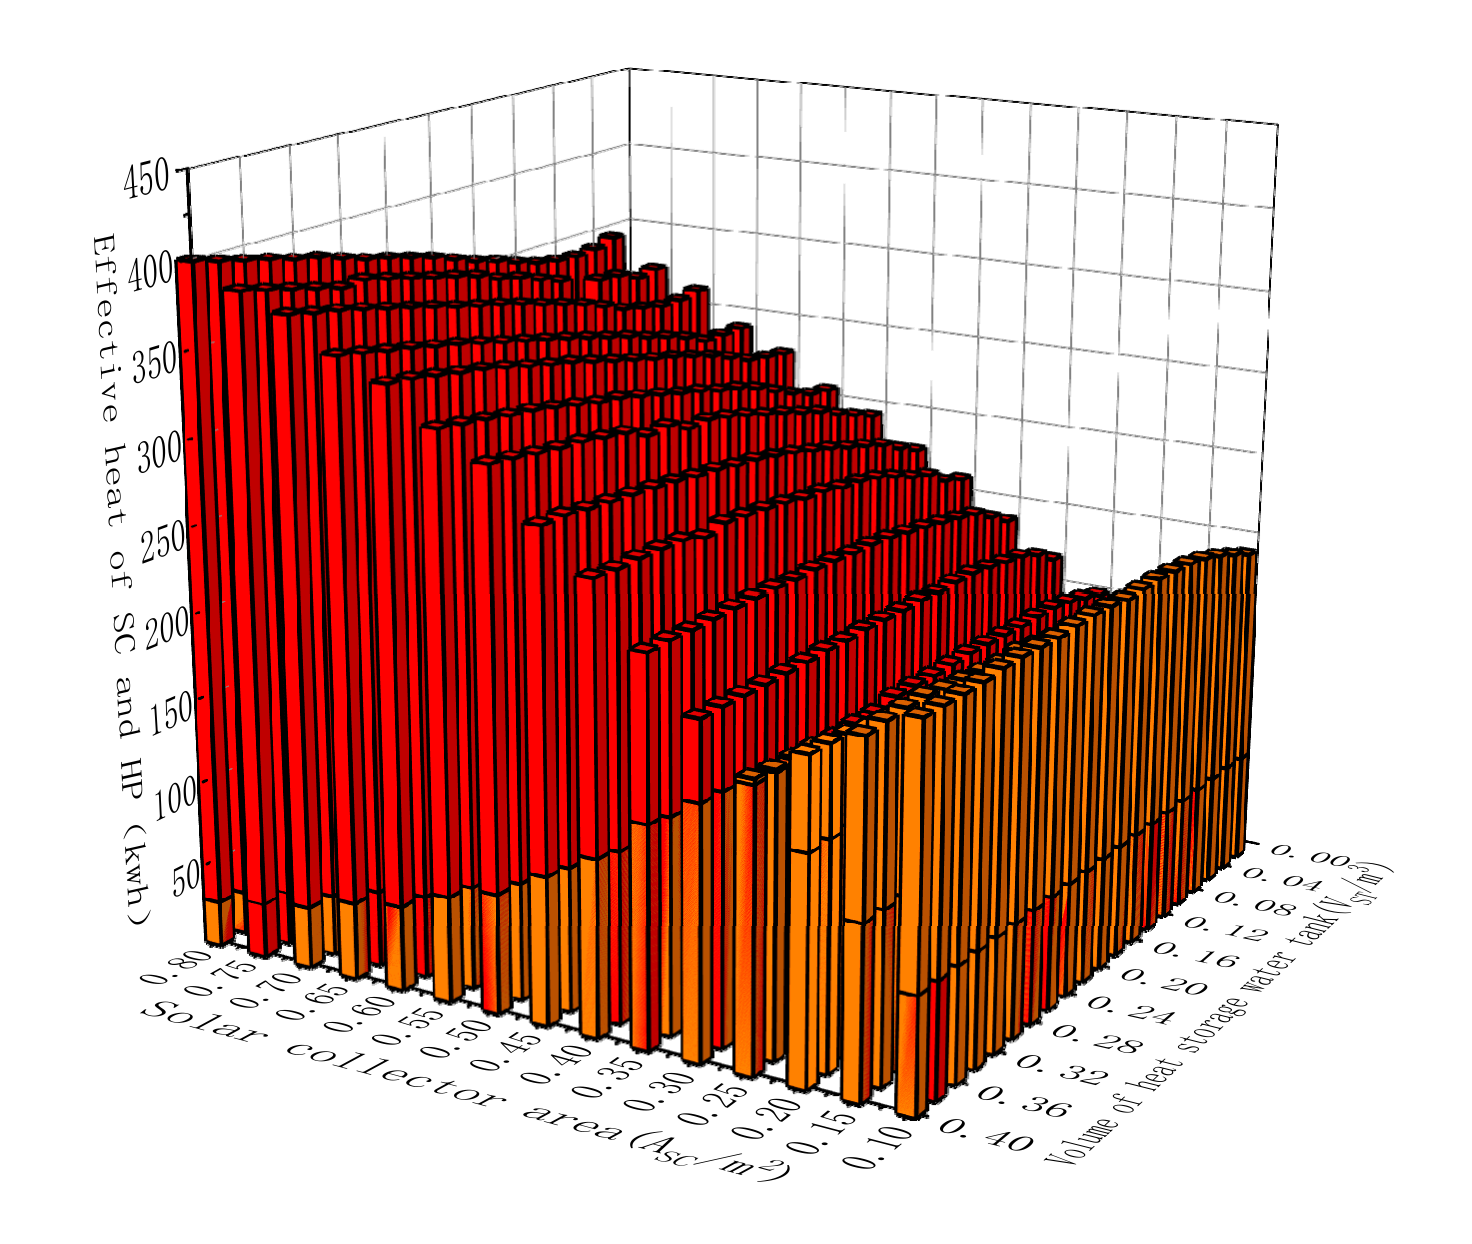
As shown in
Figure 14, the heat provided by the SC shows an increasing trend as the
increases. When the
is
, the heat supply of the SC shows an increasing trend as the
increases, when the
is
, the heat supply of SC will decrease first and then increase as the
increases. This is because when the
is small, as the
increases, it can absorb more heat from the SC, and when the
is larger, the smaller
quickly heats up, which can make better use of the heat recovered from the waste heat, causing the SC to decrease the heat first. The heat provided by the HP shows a decreasing trend as the
increases, when the
is
, the heat supply of the HP shows an increasing trend as the
increases, when the
is
, the heat supply of the HP decreases first and then increases as the
increases; this is because when the
is
, the system mainly relies on the HP heating. As the
increases, the system mainly uses the SC for heating, the heat supplied by the HP decreases in the initial stage. Later, as the
increases, the
decreases, and the BT needs the HP to provide more heat, which is consistent with the analysis in
Figure 12. When the
is
, the heat supply ratio of the SC is 34.14~68.03%, which is reasonable.
Based on the above analysis, water tank efficiency and heat supply analysis, we suggest that the
of this system is
, the SBR is between 3.2~4.1, and the
is
. The recommended values for other climate zones are shown in
Table 5. The following analysis in this paper will be based on Nanjing, with a
of
and a
of
.
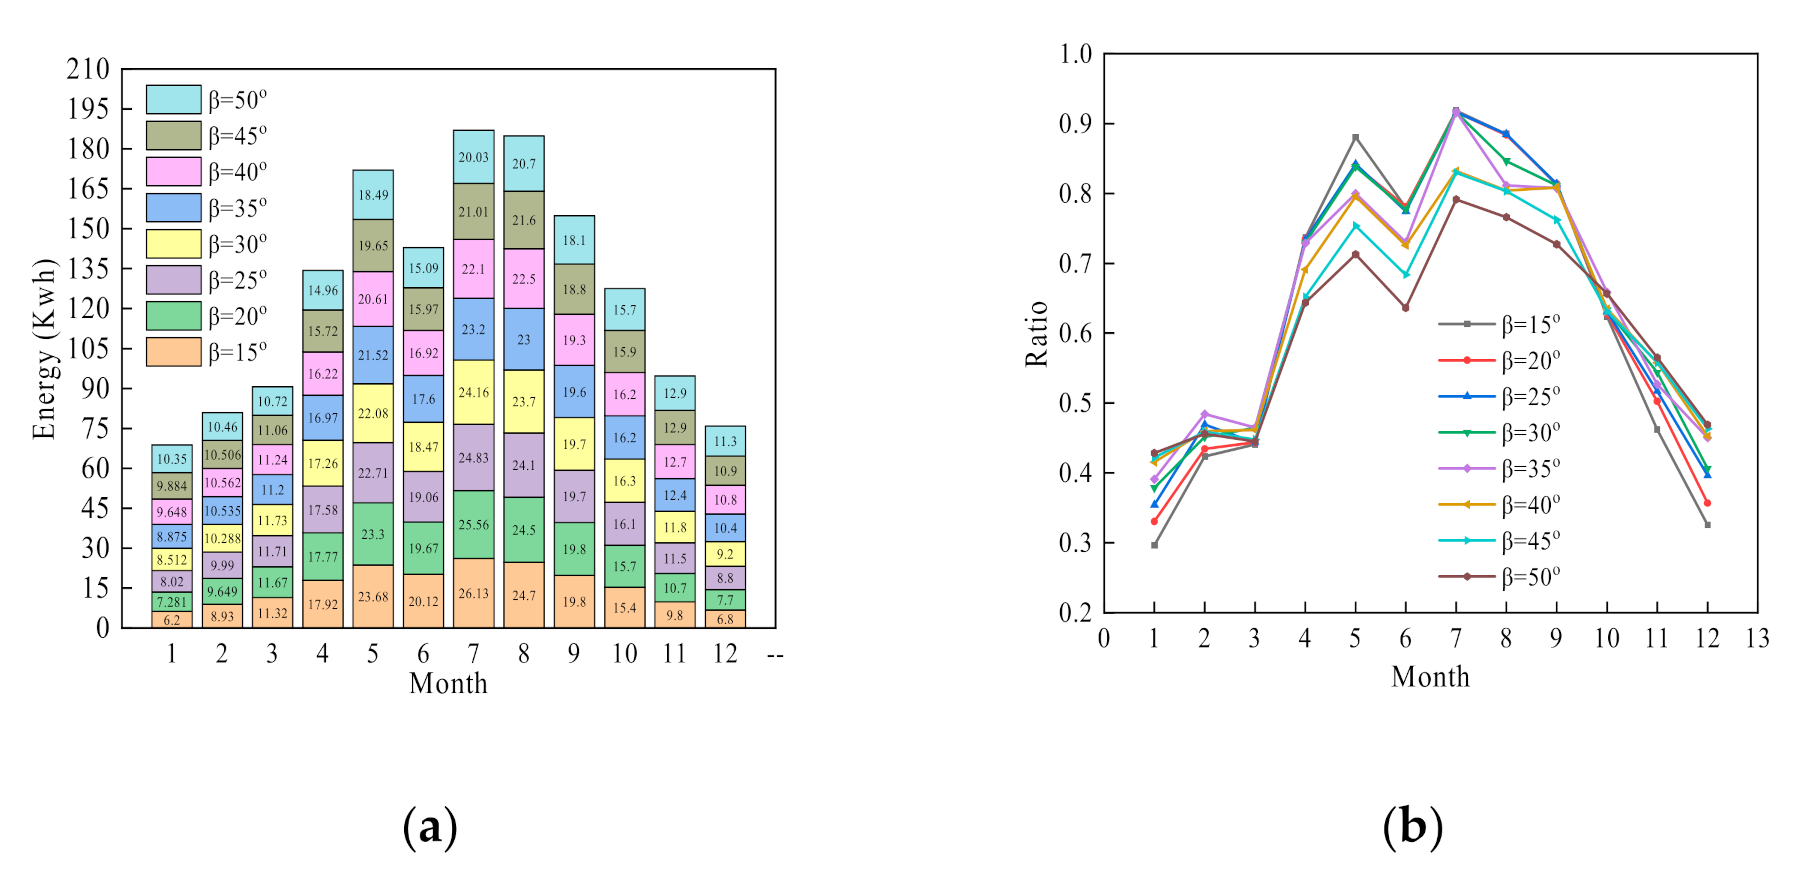
As shown in
Figure 15a, the difference in heat supplied by the SC with different
in 12 months ranges from 4.83 to 58.27%. October is the month with the smallest difference and June is the month with the largest difference, and the annual average difference is 23.2%. It can be seen that the design of the
plays a key role. The annual heat provided by the SC increases first and then decreases with the increase of the
. When the
is
, the total heat provided by the SC throughout the year is the largest. If the SC is designed to have no tilt angle change throughout the year, it is recommended to select a tilt angle of
.
As shown in
Figure 15b, when Nanjing is in January to February and November to December, and the
is
, the most heat is collected. From March to October, the solar collector can collect the most heat when the
is
. Therefore, we recommend changing the
twice a year. In March, change the
to
, and in November Change the
to
until March of the next year. The configuration parameters of
in other cities are shown in
Table 5.


