Article

The Osteogenic Function of Danggui Buxue Tang, a Herbal Decoction Containing Astragali Radix and Angelicae Sinensis Radix, Is Optimized by Boiling the Two Herbs Together: Signaling Analyses Revealed by Systems Biology

1
Shenzhen Key Laboratory of Edible and Medicinal Bioresources, Shenzhen Research Institute, Hi-Tech Park, Nanshan, Shenzhen 518000, China
2
Division of Life Science and Center for Chinese Medicine, The Hong Kong University of Science and Technology, Clear Water Bay, Hong Kong, China
3
Department of Chemical and Biological Engineering, The Hong Kong University of Science and Technology, Clear Water Bay, Hong Kong, China
*
Author to whom correspondence should be addressed.
Processes 2021, 9(7), 1119; https://doi.org/10.3390/pr9071119
Submission received: 5 May 2021 / Revised: 18 June 2021 / Accepted: 20 June 2021 / Published: 28 June 2021
(This article belongs to the Section Pharmaceutical Processes)

Abstract

:
The therapeutic efficacy of a herbal mixture, being multi-target, multi-function and multi-pathway, is the niche of traditional Chinese medicine (TCM). Systems biology can dissect the network of signaling mechanisms in a complex biological system. In preparing TCM decoctions, the boiling of herbs together in water is a common practice; however, the rationale of this specific preparation has not been fully revealed. An approach of mass-spectrometry-based multi-omics was employed to examine the profiles of the cellular pathways, so as to understand the pharmacological efficacy of Danggui Buxue Tang (DBT), a Chinese herbal mixture containing Astragali Radix and Angelicae Sinensis Radix, in cultured rat osteoblasts and mesenchymal stem cells. The results, generated from omics analyses, were compared from DBT-treated osteoblasts to those of treating the herbal extract by simple mixing of extracts from Astragali Radix and Angelicae Sinensis Radix, i.e., herbal mixture without boiling together. The signaling pathways responsible for energy metabolism and amino acid metabolism showed distinct activation, as triggered by DBT, in contrast to simple mixing of two herbal extracts. The result supports that boiling the herbs together is designed to maximize the osteoblastic function of DBT, such as in energy and lipid metabolism. This harmony of TCM formulation, by having interactive functions of two herbs during preparation, is being illustrated. The systems biology approach provides new and essential insights into the synergy of herbal preparation. Well-defined multiple targets and multiple pathways in different levels of omics are the key to modernizing TCM.

1. Introduction

The preparative procedure in making a herbal extract in traditional Chinese medicine (TCM) is crucial for its pharmacological efficacy, which determines the final chemical composition within the extract. For an example, the Chinese Pharmacopeia has described four different herbal decoctions that could be derived from Coptis chinensis roots. These decoctions have the same herbal materials; however, they show distinct pharmacological activities and modes of action. The distinction is known to be triggered by the variation in preparation methods [1]. In general, TCM herbal formulae are typically composed of two or more herbal drugs that are decocted together in boiling water; however, the rationale behind this preparation is still lacking strong scientific evidence.
Among the ancient TCM mixtures, Danggui Buxue Tang (DBT) is one of the simplest formulae, containing two herbs: Astragali Radix (AR; roots of Astragalus membranaceus (Fisch). Bunge or A. membranaceus (Fisch). Bunge var. mongholicus (Bunge) Hsiao) and Angelicae Sinensis Radix (ASR; roots of Angelica sinensis Oliv) at the weight ratio of 5:1 [2,3,4] recorded in “Neiwaishang Bianhuo Lun” by Li Dongyuan in the Jin dynasty (about AD 1247). This herbal formula requires boiling two herbs together in water by gentle heating. DBT is proposed to be consumed by patients suffering from “Blood” and “Qi” deficiency syndromes [5]. Nowadays, in China, DBT is being administered every day as a menopausal treatment, i.e., to improve osteoporotic problems in aged women [3,6].
Although DBT has been used for over 800 years, the requirement of boiling the herbs together has not changed. Chemometric analysis of DBT (AR and ASR boiled together) and AR+ASR (simple mixing of AR and ASR extracts in a 5 to 1 ratio without boiling them together) have been studied and compared. The herbal extract within DBT contained significantly higher amounts of active chemicals, as compared to a simple mixing of AR and ASR extracts [7]. The increased amount of chemical ingredients in DBT could therefore account for the better pharmacological efficacy [2]. Due to the complexity of a herbal mixture, the identification of bioactive chemical and pharmacological mechanisms in DBT has encountered great challenges. Indeed, this complexity of mechanistic action is one of the major bottlenecks in the development of TCM.
Integrated omics represents an emerging and powerful discipline, providing an accurate and dynamic landscape of the phenotypes of biosystems through analyses of proteins and metabolites. This information could be used to identify therapeutic targets and pharmacological mechanisms [8]. The pharmacological effect induced by TCM herbal decoction is the result of a multi-interaction between genes, proteins, metabolites and lipids. The transformation, or perturbation, of metabolic and signaling pathways is highly dynamic via complex regulatory networks [9]. To dissect the mechanistic signaling of DBT in osteoblastic differentiation, we employed proteomics and lipidomics as tools to identify and quantify protein and lipid metabolites in DBT-treated osteoblasts. The DBT-triggered signaling pathways and molecules were compared with that triggered by herbal extract formed by simple mixing of two herbs, i.e., AR+ASR. The identified distinct biomolecules, regulated by DBT, could serve as biomarkers in the quality control of herbal decoctions, and subsequently, those identified molecules could provide a prosperous detection window in solving the mechanism of the requirement of boiling herbs together in a TCM preparation.

2. Materials and Methods

2.1. Preparation and Quality Control of Herbal Medicines

The preparation of DBT was described in detail previously [4,6,7,10]. Roots of three-year-old A. membranaceus var. mongholicus (AR) from Shanxi Province and two-year-old A. sinensis roots (ASR) from Minxian of Gansu Province were utilized. Herbal medicine was examined by Dr. Tina Dong (herbalist) based on Standards of Materia Medica in Hong Kong. To extract herbal materials, DBT (AR and ASR in a weight ratio of 5:1) was extracted in eight volumes of water (v/w) at boiling for two hours: this process was performed twice. The mixture was dehydrated under vacuum. Identification and quantification of active compounds of DBT was conducted on an Agilent high-performance liquid chromatography (HPLC) system (Agilent, Waldbronn, Germany), coupled with a diode array detector (DAD) and an evaporative light scattering detector (ELSD). The herbal extracts were isolated by an Agilent C18 column (1.8 μm, 50 mm × 4.6 mm). The mobile phase contained 0.1% formic acid (FA) in ACN (B) and 0.1% FA in H2O (A). HPLC setting was as follows: 0–2 min, 20–20% (B); 2–7 min, 20–34% (B); 7–12 min, 34–34% (B); 12–16 min, 34–65% (B); 16–18 min, 65–80% (B). The solvent velocity was optimized at 0.3 mL/min. The eluate was introduced into DAD and ELSD for further analysis.

2.2. Rat Osteoblast and Micromass Culture

Animal protocols were revised and approved by the Animal Experimentation Ethics Committee of the Department of Health, Hong Kong (No. 17–283 for Animal Ethics Approval), under the instructions of “Principles of Laboratory Animal Care” (NIH publication No. DH/HA&P/8/2/3). The postnatal day 1 SD rat was dissected to obtain calvarias. Tissues were digested by 1% trypsin for 10 min, and 0.2% collagenase for 65 min, respectively [11]. Afterwards, the supernatant was obtained via centrifugation at 1500 rpm for 5 min. Osteoblasts were incubated in MEM-α, supplemented with 10% FBS and 1% penicillin/streptomycin. Proliferation of osteoblasts was conducted by 3-(4,5-dimethylthiazol-2-yl)-2,5-diphenyltetra-zolium bromide (MTT) assay. For micromass culture, rat embryos were utilized to cultivate mesenchymal progenitor cells from limb buds. The ectoderms were removed after enzymatic digestion of limb buds with 0.1% trypsin and 2.4 U of dispase ll for 20 min. The cell number was adjusted to 25 × 106 cells/mL. The micromass was maintained with the CMRL 1066 medium, 10% FBS and 1% penicillin/streptomycin. The micromass was fixed with 4% paraformaldehyde for 15 min, incubated in Alcian blue 8 GS solution (0.1 mg/mL) for 1 h, then washed and immersed with glycerol for Alizarin Red S (40 mM, pH 4.2) staining.

2.3. Alkaline Phosphatase (ALP) and Collagen Quantification

ALP was extracted in lysis buffer (10 mM HEPES, pH 7.5 and 0.2% Triton X-100). ALP enzymatic reaction was examined by mixing the cell lysate with 10 mM p-nitrophenyl phosphate (as a substrate in enzymatic reaction) in a buffer (pH 10.4) containing 0.1 M glycine, 1 mM MgCl2 and 1 mM ZnCl2 at 37 °C, and colorimetric analysis was conducted at 405 nm [11]. Dexamethasone and vitamin C were used as a positive control [12]. For determination of collagen, osteoblasts were cultured for 72 h with drug treatment. The cells were incubated in methanol overnight and placed in 0.1% picrosirius red staining solution (100 μL/well) for 3 h. The staining was recognized by a microscope.

2.4. Adhesion Assay

Osteoblasts were cultured for 72 h with drug treatment. Cells were trypsinized for 1–2 min and cultured in fresh cultured medium. The cell suspension was then counted to a cell concentration of 4 × 10⁵ cells/mL, and was placed onto a cell culture plate. The cells were cultured for 30 min for attachment, and the suspended cells were collected. The unattached cells were counted via phase-contrast microscopy.

2.5. Shotgun Proteomics

For protein extraction, osteoblasts were subjected to freeze–thaw cycles repeated three times, and sonication in 8M urea buffer (0.1% SDS, pH = 7.4) for 5  min. Next, the cell lysate was precipitated in cold acetone. The proteins were resuspended in 4 M urea (pH = 6.5). Forty milligrams of protein was reduced by DTT and alkylated by iodoacetamide (IAA). The modified proteins were then cleaved by trypsin (1: 50 w/w) for 18 h at 37 °C. Next, the peptide sample was desalted by C18 ZipTip (Millipore, Darmstadt, Germany) and dried by vacuum. Peptides were dissolved in 0.1% formic acid (FA) and were directly loaded onto a C18 capillary column (75 μm × 25 cm; 2 μm, 100 Å). The solvent elution was optimized using an Ultimate nanoLC system (Thermo Fisher Scientific, Waltham, MA) at a flow speed of 300 nL/min, and a 120 min LC gradient of 2–90% acetonitrile (ACN) in 0.1% FA was utilized to isolate peptides. The eluted peptides were detected by an Orbitrap Fusion Lumos mass spectrometer (Thermo Fisher Scientific). The electrospray ionization voltage was set at +2.3 kV, and the ion transfer tube temperature was set at 300 °C. MS machine setting was as follows: 1 microscan for MS1 scan at 60 K resolution, MS2 at 30 K resolution; full MS mass range: m/z 400–1500; and MS/MS mass range: m/z 100–2000. Automatic gain control targeting for MS2 was 40 K; maximum injection time was 20 ms; higher-energy C-trap dissociation energy was 35% and dynamic exclusion duration was 4 s.

2.6. Protein Identification and Quantification

MS data were analyzed via Thermo Scientific™ Proteome Discoverer™ 2.2. MS2 data were searched with SEQUEST® HT against a database of Rattus norvegicus. Carbamido-methylation (+57.021 Da) of cysteine residues was set as a fixed modification, and oxidation of methionine residues (+15.9949 Da) and acetylation of the protein N-terminus (+42.0106) were considered as variable modifications. MS1 tolerance was set as 20 ppm, and MS2 was set at 0.8 Da tolerance. Peptide spectral matches were validated using a percolator algorithm, based on q-values at a 1% false discovery rate. The proteomics data collection was conducted using an Rt-Aligner and feature mapper nodes, created for untargeted label-free quantification workflow in Proteome Discoverer.

2.7. Lipidomics Analysis

The cellular lipids were obtained by homogenizing 1 × 10⁷ osteoblasts with 300 μL LC-MS water, 600 μL methanol and 450 μL chloroform. The mixture was subjected to water–organic two-layer separation by centrifugation at 12,000 g for 15 min. The lower layer was obtained and dried under nitrogen. Aliquots of 60 μL lipid samples were pooled as a QC sample. The cellular lipids were measured on a Waters Acquity UPLC connected to a high-resolution mass spectrometer (TripleTOF 4600, AB SCIEX). The cellular lipids were analyzed on a Waters UPLC Acquity instrument, coupled with a high-resolution MS (TripleTOF 4600, AB SCIEX). A Waters C18 column (1.7 μm, 2.1× 100 mm) was utilized for the separation. The final acquisition method was illustrated as below. The mobile phase for lipidomics was A = ACN/water (60:40) with 10 mM NH4HCO3 and 0.1% FA, B = isopropanol/ACN (90/10) with 10 mM NH4HCO3 and 0.1% FA. The solvent gradient was 0–10  min: 0–20% B; 10–10.1  min: 20–80% B; 10.1–13  min: 80% B; 13–13.1 min: 80–0% B; 13.1–20 min: 0% B. The solvent speed was optimized at 0.2 mL/min. The MS conditions were set as follows: ion source gas 1 at 45, ion source gas 2 at 45, curtain gas at 30, temperature at 450 °C, ion-spray voltage floating at ± 5 kV, de-clustering potential (DP) at 100 V and collision energy (CE) at 10 V. For TOF-MS scan, the accumulation time was set as 0.1 s per spectra, and TOF masses were acquired from 200 to 1200 Da. For product ion experiment, the accumulation time was at 0.05 s per spectra, and masses were acquired from 100 to 1160 Da, DP was set at 100 V and CE was at 35 V with ± 15 V collision energy spread. Information-dependent acquisition (IDA) was selected to perform MS/MS scan, and its parameters were set as follows: exclude isotopes within 4 Da, mass tolerance at 10 ppm and the maximum number of candidate ions per cycle at 20. The “for” and “after” were chosen in the “exclude former target ions” part and were set at “for 15 s after two occurrences” (the time was usually set at half-length of a signal). In addition, “dynamic background subtracts” was chosen in the IDA advance module.

2.8. Data Extraction and Processing

Chromatographic peak identification and alignment were performed by using Progenesis QI 2.3 (Nonlinear Dynamics, Newcastle upon Tyne, UK). Those unstable metabolites were filtered out by applying a cut-off on the coefficient of variation at >30% in QC samples. Matrix of normalized ion abundance was exported to SIMCA® (version 13, Umetrics AB) for multivariate data analysis. The potential candidates were selected from S-plots of OPLS-DA. The biomarkers were identified with mass fragmentation and matched with Human Metabolome Databases, Kyoto Encyclopedia of Genes and Genomes, METLIN, LipidMap (www.lipidmaps.org, accessed on 16 August 2020) as well as LipidBlast based on their mass fragmentation, retention time and mass accuracy.

2.9. Pathway and Statistical Analysis

Signaling analysis was conducted by KOBAS (KEGG Orthology-Based Annotation System), a software interpreting sequences with KEGG orthology terms and identifing the enriched pathways in the queried sequences, as compared to the background. The pathway datebsese employed here were KEGG, Reactome, Panther, and GO analysis. Pathway analysis was conducted using Ingenuity Pathway Analysis (Qiagen). The multivariate analysis was conducted using SIMCA®. Data were represented as mean ± standard error of mean (SEM). Statistical analysis was performed with student t-test and Dunnett’s test (SPSS, version 13). Statistically, difference was classified as significant: * p < 0.05, ** p < 0.01 and *** p < 0.001.

3. Results

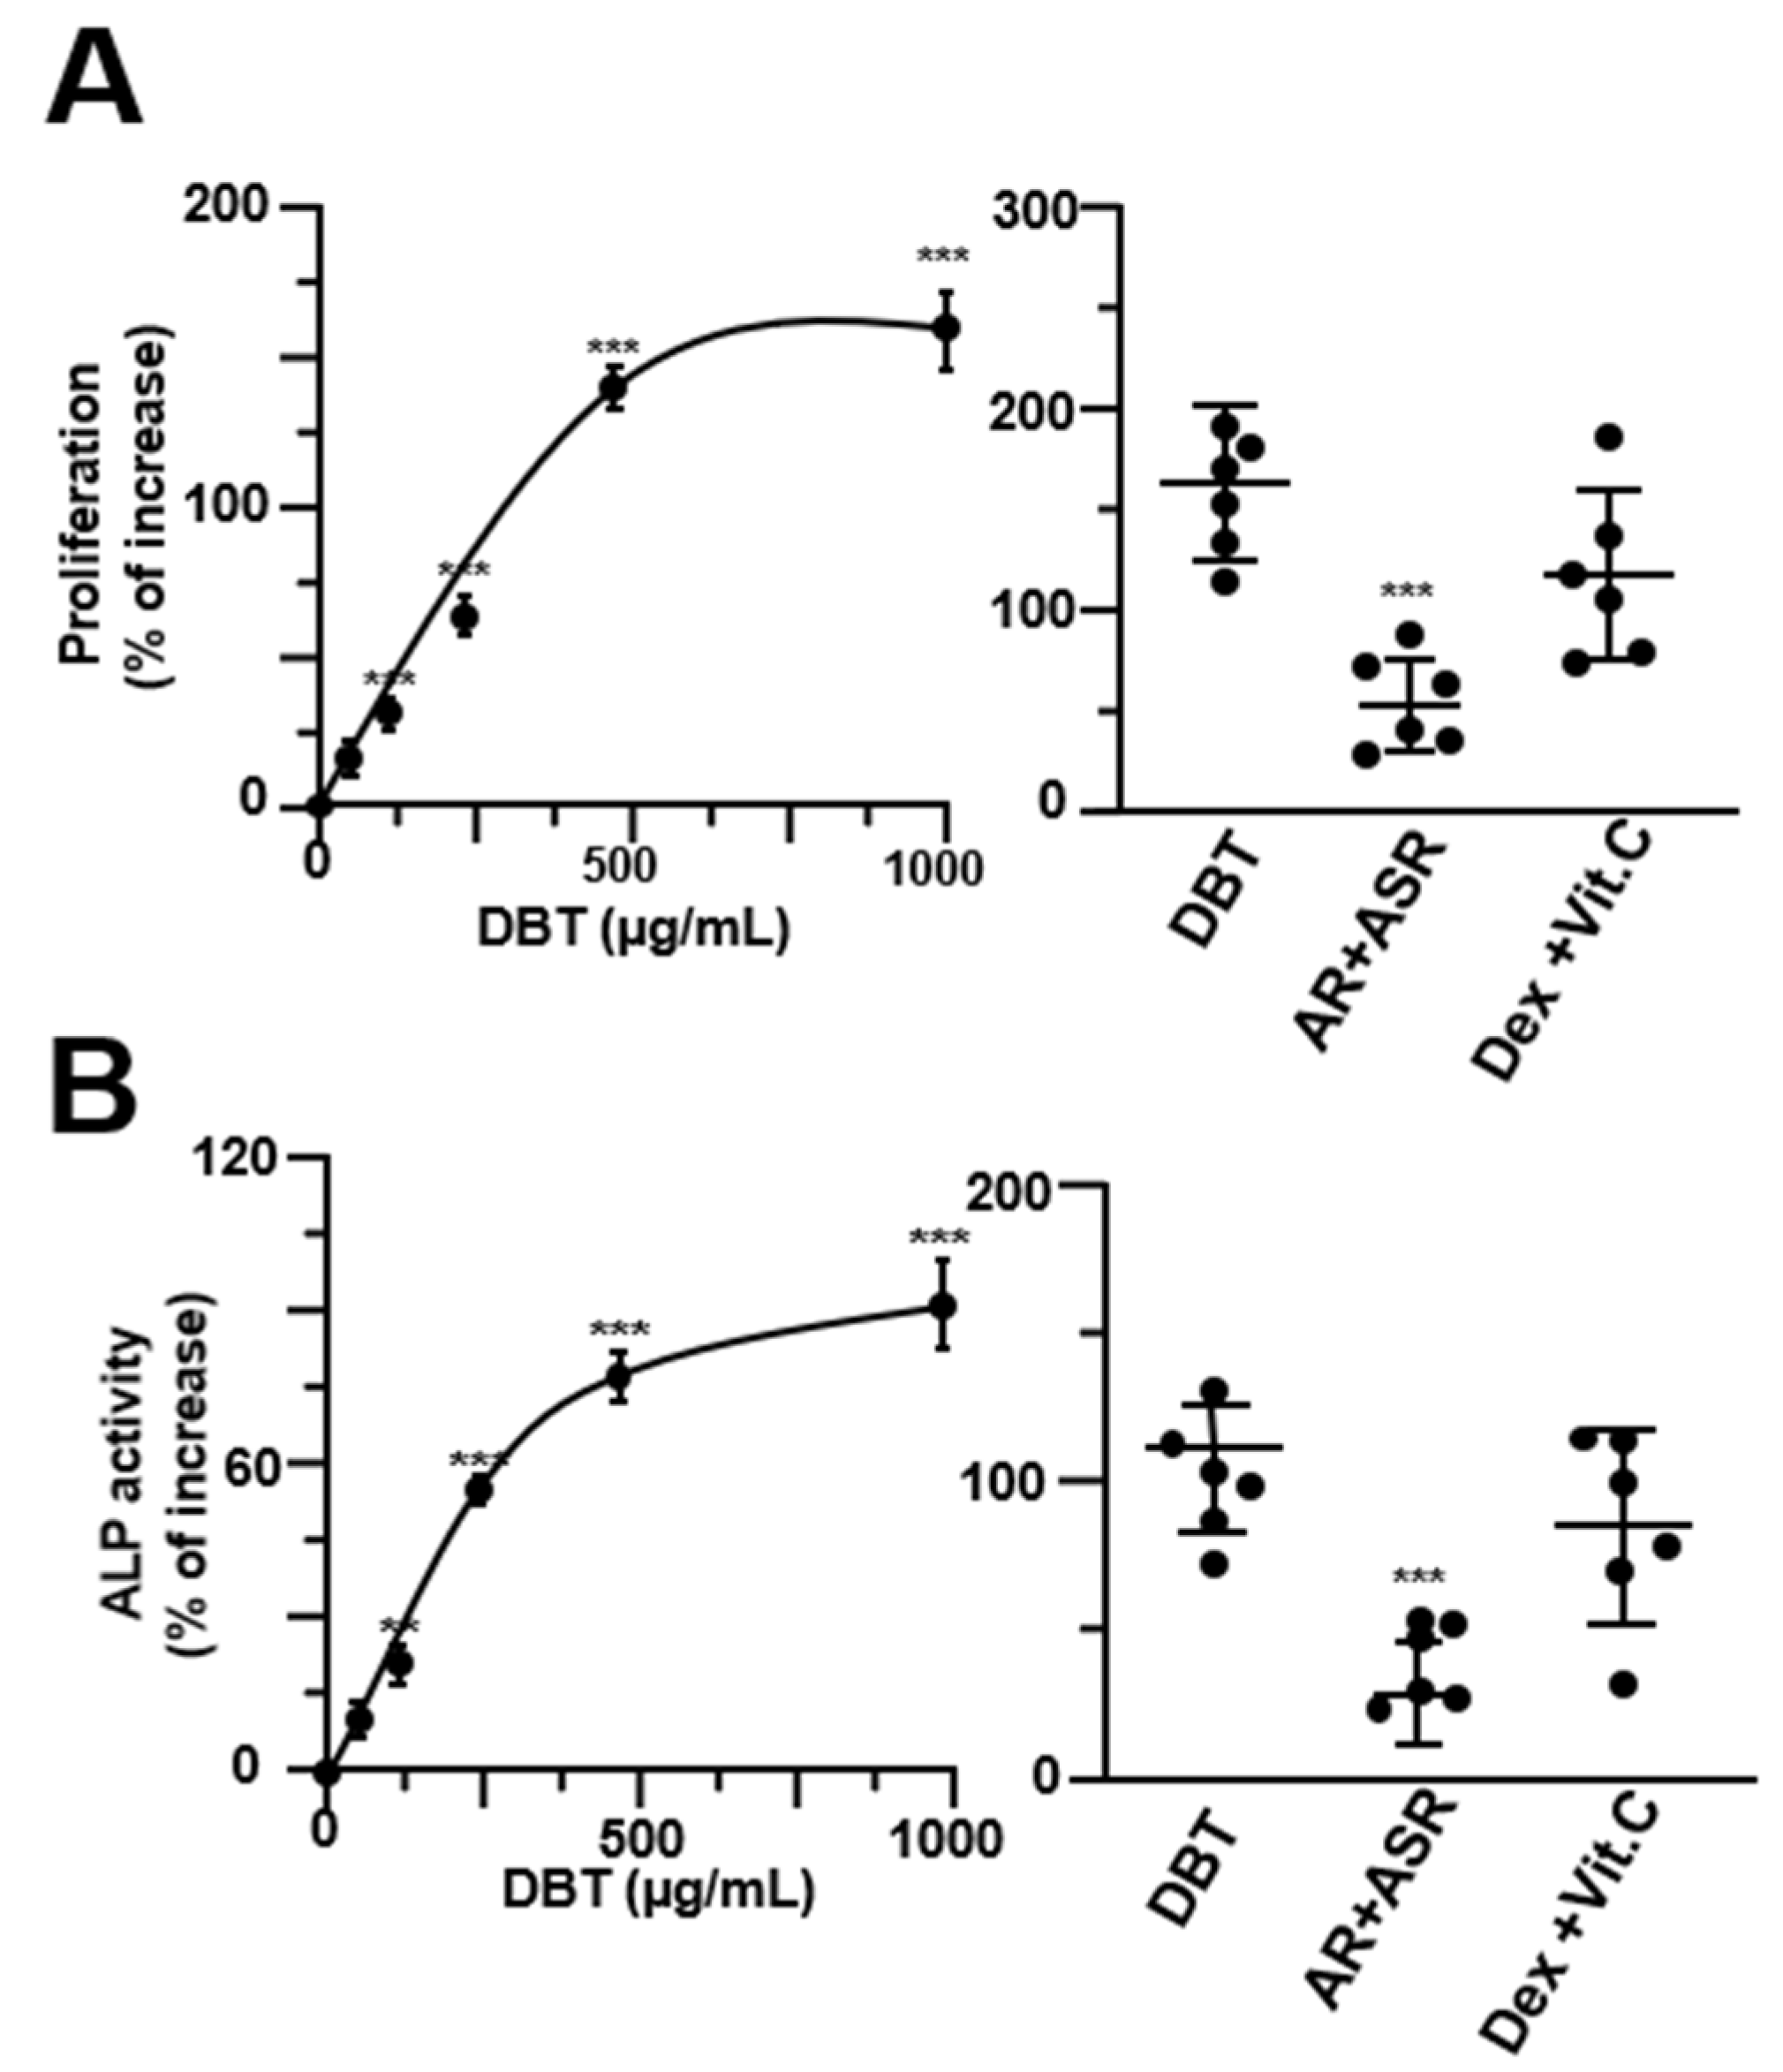
3.1. The Osteoblastic Function of DBT Requires Boiling Herbs Together

The herbal extracts at different conditions were prepared by optimized methods [4], and were chemically standardized by HPLC. The herbal extracts of DBT (authentic decoction), AR and ASR were subjected to HPLC spectrum by using UV and ELSD detectors (Figure S1A,B). In addition, the amounts of key chemicals within the herbal extracts were measured (Figure S1C): the results were in accordance with previous reports [4,6,7,10].
In cultured osteoblasts, application of DBT induced cell proliferation, as well as the differentiation biomarker ALP, in a dose-dependent manner (Figure 1A,B). In both scenarios, the DBT-induced osteoblastic growth and differentiation were markedly higher than that of the herbal extract derived from AR + ASR (simple mixing of two herbal extracts), suggesting an uniqueness of DBT formulation, i.e., boiling two herbs together. To detect the amount of collagen being deposited in osteoblasts, Sirius Red stain was used. In cultured osteoblasts, applied DBT was able to enhance the staining density of collagen, significantly, by at least ~5-fold, as indicated by dark red clusters of collagens distributed throughout the cultures (Figure 2A). The effect of DBT was more robust than that of simple mixing of AR + ASR. Moreover, the herbal-extract-treated osteoblasts were subjected to determination of extracellular matrix, i.e., identifying the adhesion property. The adhesion property of cultured cells was much less in AR + ASR extract, while DBT showed robust induction as compared to the positive control of dexamethasone and vitamin C (Figure 2B).
The role of DBT was further demonstrated in an in vivo model of bone micromass. In DBT-treated micromass, the cells were stained with Alcian blue (showing overall proteoglycan content) and Alizarin Red S (showing calcium deposits). Applied DBT increased the staining of both dyes (Figure 2C). The herbal extract from AR+ASR showed a weak induction of chondrocyte and osteogenic differentiation. In comparison to authentic DBT, the treatment of AR+ASR showed much weaker induction of osteoblastic differentiation in all parameters, suggesting a distinct requirement of boiling the two herbs together during the preparation.

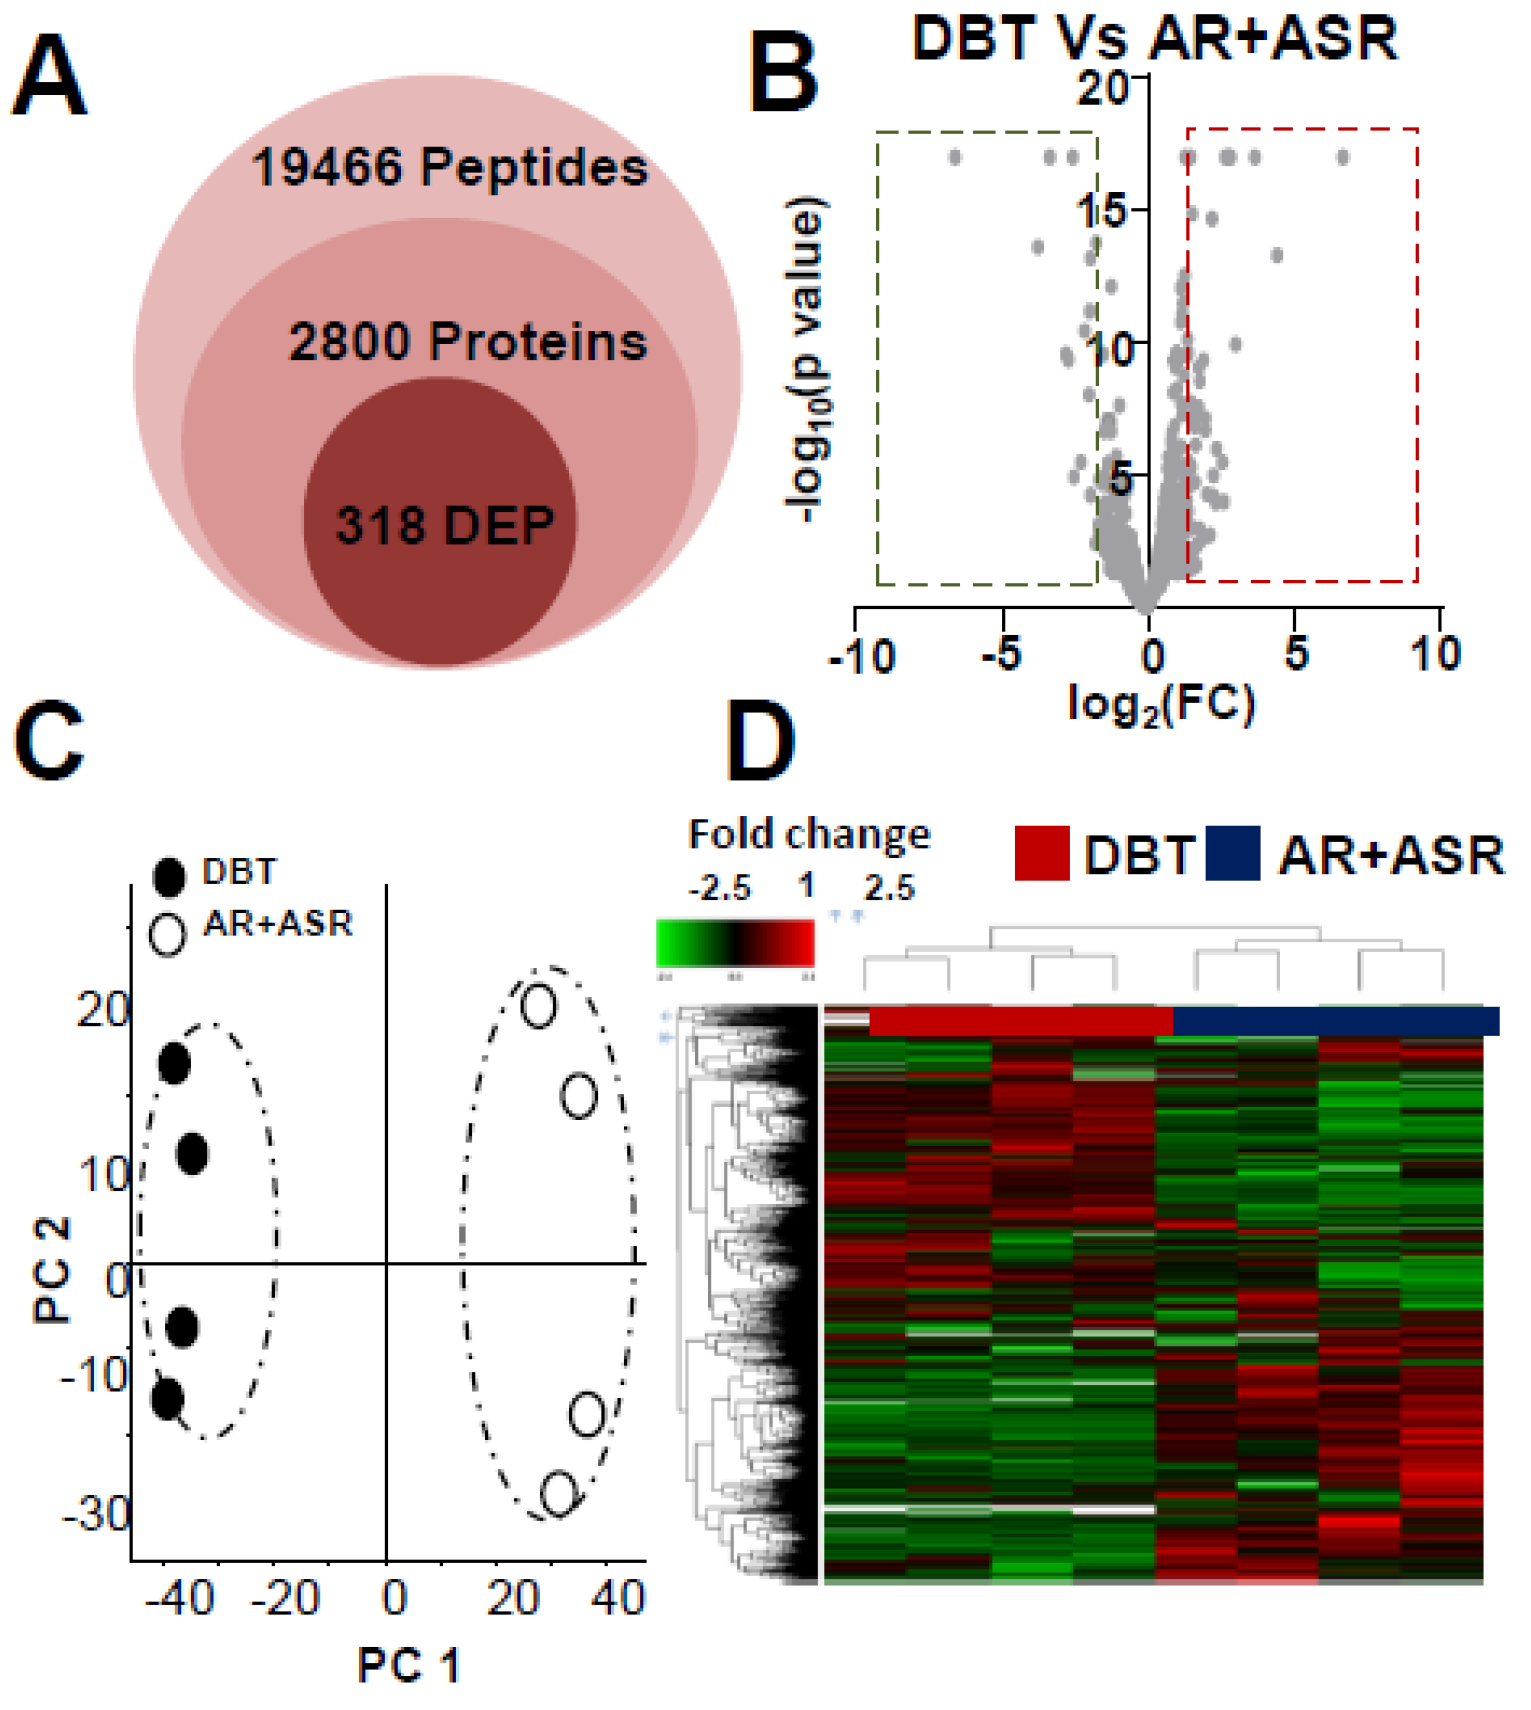
3.2. Proteomics Analysis of Herbal-Extract-Treated Osteoblasts

The proteomics profile of cultured osteoblasts, treated with DBT or AR+ASR, was generated by LC-MS, i.e., comparing the profiles of two herbs boiled together (DBT) against that of two herbal extracts simply mixed together (AR+ASR). The data acquired were subjected to sequence searching and label-free quantitative analysis. Label Free Quantitation (LFQ) proteomics, having a calculation of the intensity of precursor ion, was used to reveal the differential expression protein (DEP) after treatment with DBT, as compared with that of AR+ASR. The overall analysis identified 19,466 peptides, mapping to 2800 proteins (Figure 3A). The “volcano plot” of change against the p-value of LFQ results was constructed: the average spectra number for each comparison was >5 (Figure 3B). A significantly differentially expressed protein was considered when the p-value of the t-test was <0.05, as well as when the fold of change was higher/lower than ±1.5-fold. From the results, 318 proteins (168 up-regulated and 150 down-regulated) were differentially expressed significantly in DBT-treated osteoblasts, as compared to the AR+ASR group (Figure 3B). To reveal the difference between DBT and AR+ASR treatment groups, we subjected the normalized protein abundances to principal components analysis (PCA) and heat map clustering. From PCA projection, the maximum variability was identified between DBT vs. AR+ASR (Figure 3C), the first component covering 41–56% of data variance. In parallel, the heat map showed similar results as that of PCA, where two major clusters separating the protein abundance were identified (Figure 3D).
After revealing all the DEPs, triggered by DBT, the expected and novel signaling pathways were analyzed by KOBAS. The signalling pathways critical for bone development, e.g., cytoskeleton (p = 1.9 × 10⁻⁵), tissue development (p = 4.9 × 10⁻⁷), osteoblast differentiation (p = 0.05) and the Wnt signaling pathway (p = 0.048), were up-regulated after DBT treatment (Figure 4A). This observation was consistent with our previous reports of enhancement of osteoblastic function, triggered by DBT [13]. In addition, the DBT-triggered pathways were identified to be related with lipid metabolism, e.g., response to lipid (p = 1.5× 10⁻⁷) and fatty acid metabolism (p = 0.02) (Figure 4B), and glucose and amino acid metabolism, e.g., cellular amide metabolic process (p = 2.14 × 10⁻⁷) and cellular component biogenesis (p = 2.3 × 10⁻¹⁰) (Figure 4C). Moreover, DBT induced a robust RNA metabolism, e.g., proteomes of the structural constituent of ribosomes (p = 4.5 × 10⁻⁶) and rRNA processing (p = 8.87 × 10⁻⁸) (Figure 4D), and energy metabolism, e.g., oxidoreductase activity (p = 3.6 × 10⁻⁶), proton-transporting ATP synthase activity (p = 1.27 × 10⁻⁴) and mitochondrial membrane (p = 1.02 × 10⁻⁵) (Figure 4E). Furthermore, other signaling pathways were up-regulated, e.g., calcium ion homeostasis (p = 2.8 × 10⁻³), the PI3K–Akt signaling pathway (p = 5 × 10⁻³) and the HIF signaling pathway (p = 1.6 × 10⁻²) (Figure 4F). In comparison to DBT, the induced events were not revealed in the treatment of AR+ASR (Figure 4A–F).
To explore the molecular dynamics of protein–protein interaction from the DEPs, the knowledge-based ingenuity pathway analysis and activated molecular prediction in silico were constructed. Proteome trajectories were categorized into four significant clusters with up- and down-regulated DEPs (Figure 5). The correlation network was centered in activating multiple collagen synthesis (Figure 5A), activating β-estradiol (Figure 5B) and activating ERK1/2 (Figure 5C). These networks are well recorded to be related to bone metabolism, as predicted by treatment with DBT.

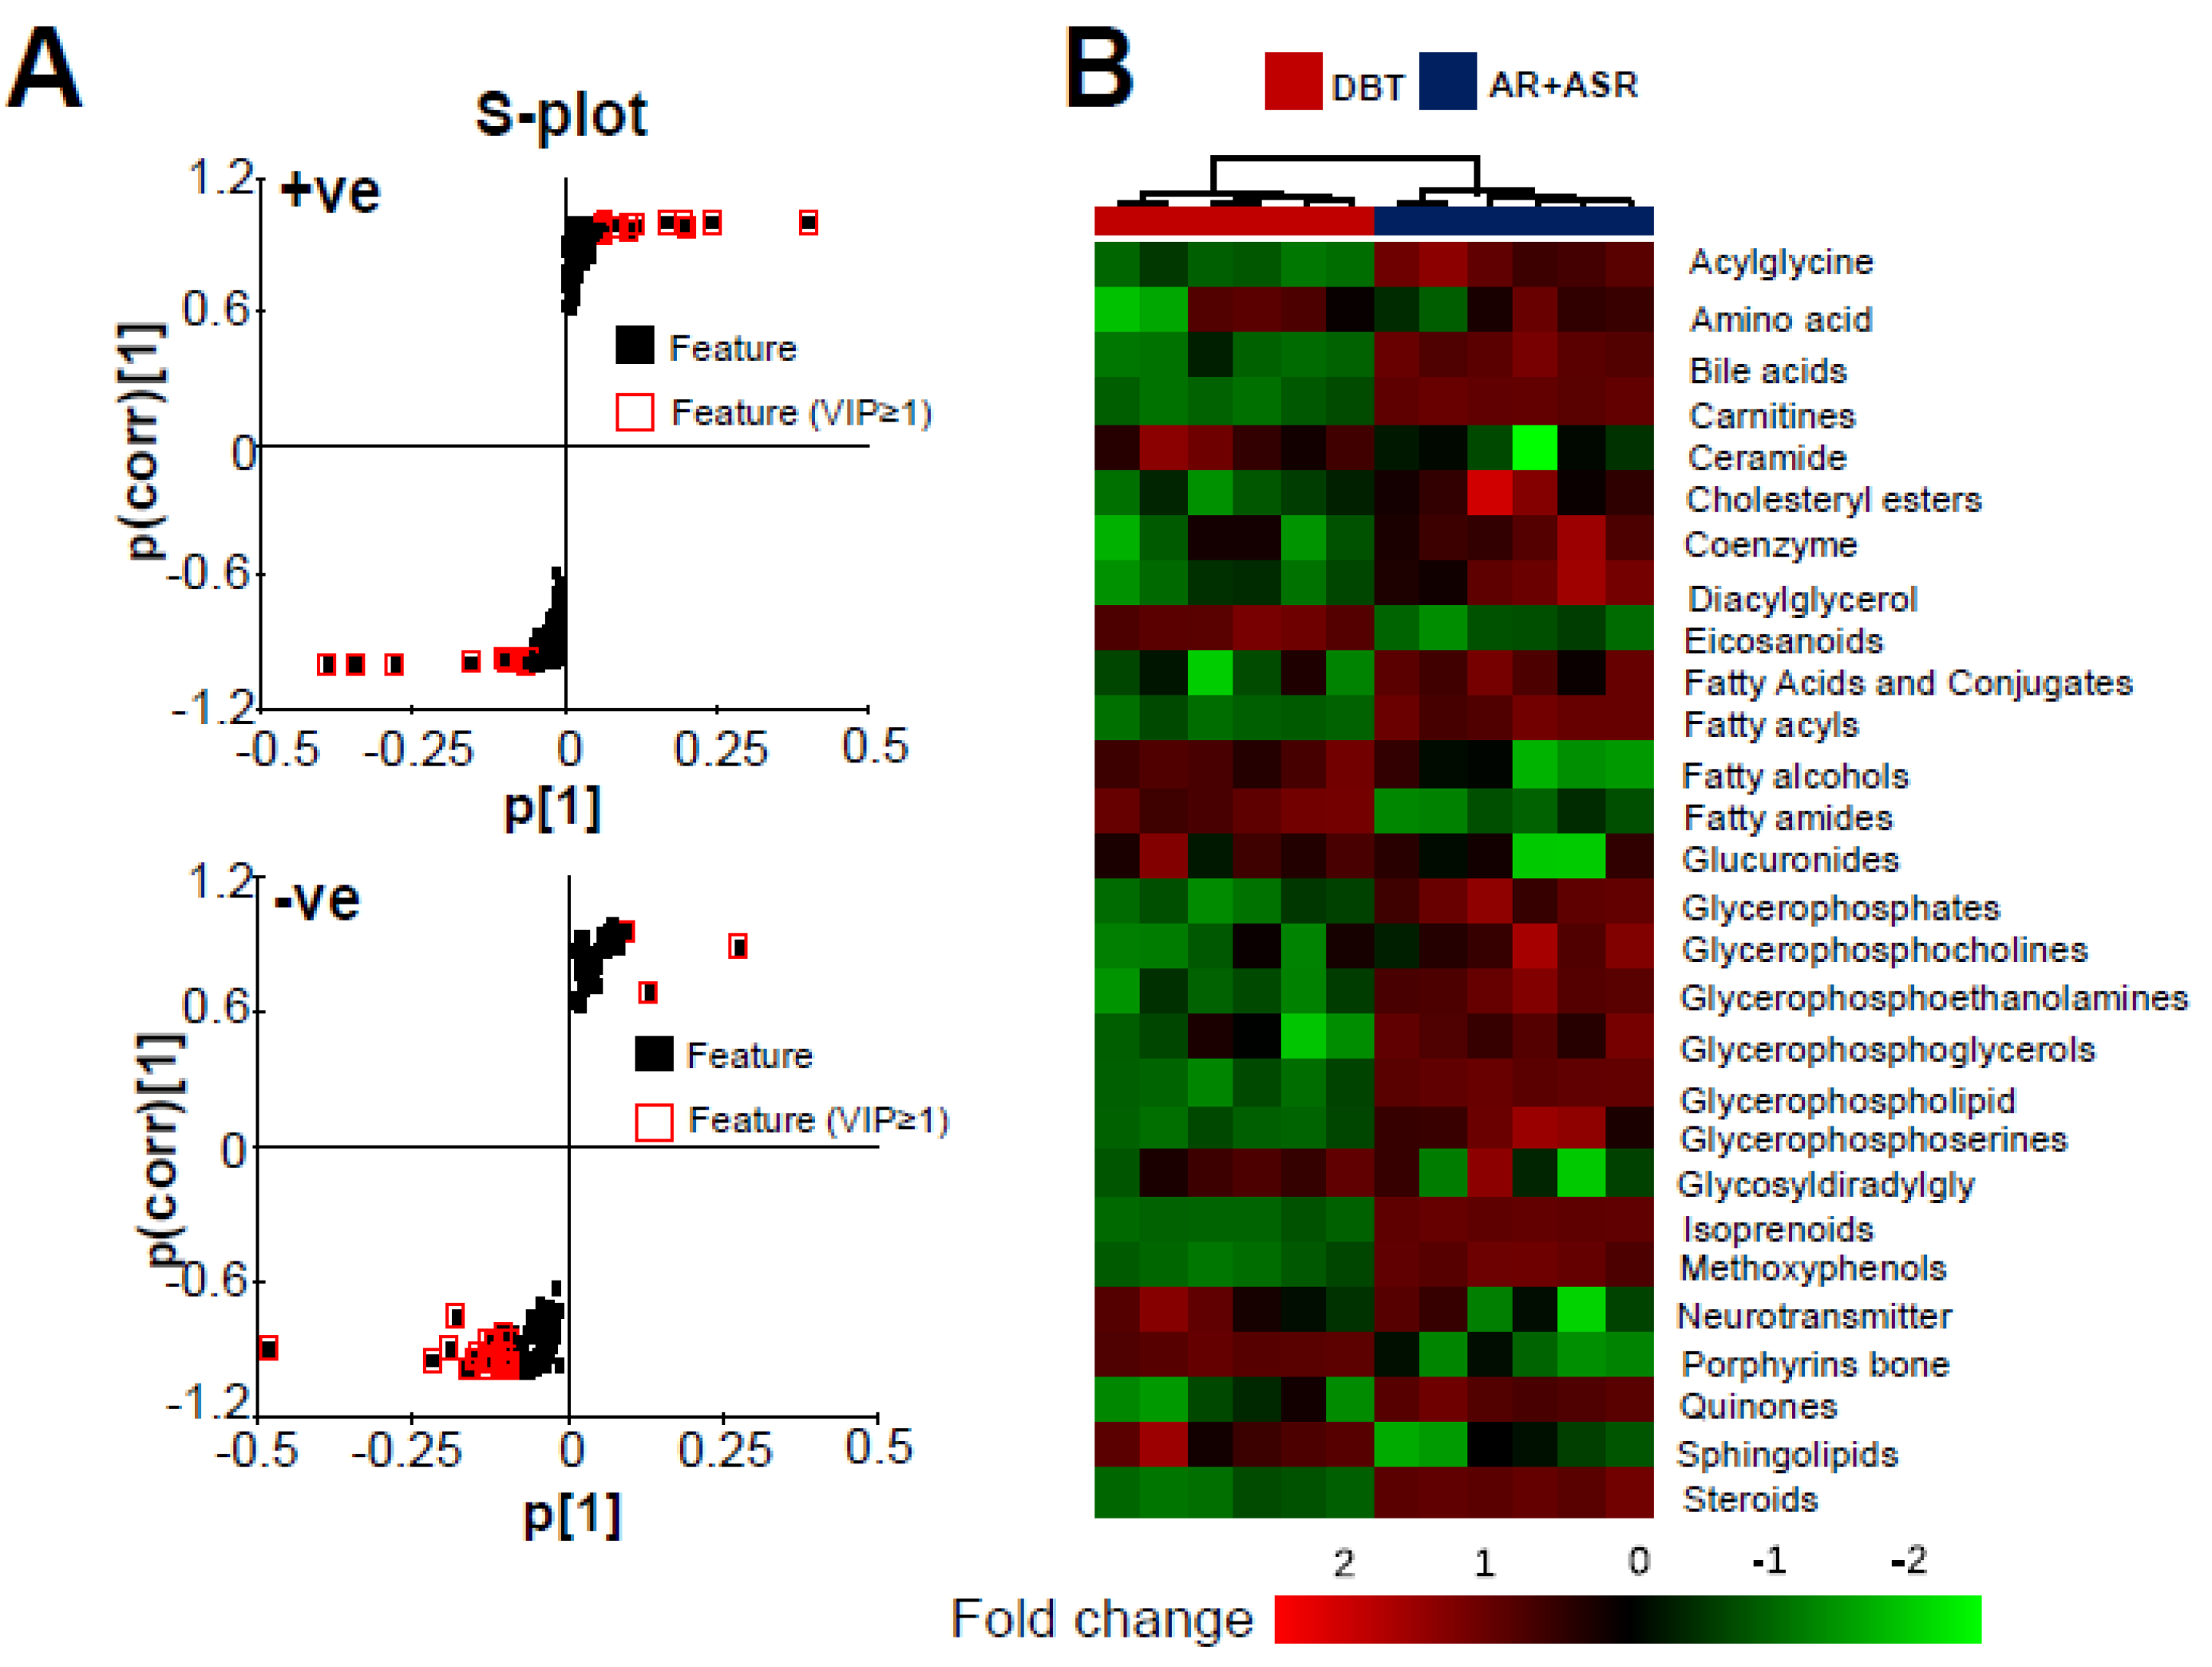
3.3. Lipidomics Analysis of Herbal-Extract-Treated Osteoblasts

In LC-MS analysis, the dispersed location of MS scans along with retention time and m/z illustrated the successfully optimized LC gradient and efficient separation of the acquisition method, both +ve and −ve modes (Figure 6A). Total number of features, detected by the centWave method, an algorithm identifying peak density and the wavelet-based chromatographic peak from LC/MS data, was used as a measure of metabolome coverage of this combined strategy. After feature alignment, a total number of 5611 and 6690 grouped features were obtained from +ve and −ve ionization profiles, respectively. In addition, the statistical analysis was used to find the probability of a real difference in metabolites between experimental groups. After QC filtering, 90% of metabolites had >80% confidence; these values reflected the difference between the two groups.
As a quality control procedure, the following steps were routinely performed to ensure system stability and reproducibility of column performance. A mixture of lipid standards was injected as a QC sample before each experiment. The column pressure was recorded and compared to previous runs. The instrument resolution was optimized for different batches. As shown in Figure S2, the QC pool samples were clustered in the center of the PCA plot, which suggested that the differentiation of samples resulted from metabolome differences but not from systematic variance or technical issues. The cumulative value of Q2 estimates the predictive accuracy of a multivariate statistical model with a threshold of >0.5, and the difference between Q2 and R2Y should not be larger than 0.3. From multivariate statistical analysis, the fit goodness for PLS-DA and OPLS-DA showed acceptable internal cross-validation results, i.e., PLS-DA: R2Xcum = 0.820, R2Ycum = 0.99, Q2cum = 0.998 in +ve mode; R2Xcum = 0.491, R2Ycum = 0.998, Q2cum = 0.962 in −ve mode (Figure 6B); and OPLS-DA: R2Xcum = 0.591, R2Ycum = 0.99, Q2cum = 0.99 in +ve mode; R2Xcum = 0.612, R2Ycum = 0.997, Q2cum = 0.978 in −ve mode (Figure 6C). In the score plot of OPLS-DA, the clustering of DBT-treated group was well separated from that of AR+ASR group (Figure 6C).
The differential identified lipids between DBT vs. AR + ASR groups were selected from the S-plot in terms of the threshold of variable influence on projection (VIP) for OPLS models having VIP values ≥ 1 (Figure 7A). This indicated that the lipid profiles of osteoblasts at different treatments were very different. The differential expression metabolites (DEMs) were listed in a heat map (Figure 7B). Compared to AR+ASR, the treatment of DBT led to an increase in ethanolamine, fatty amide, phosphosphingolipid, quinone and sphingolipid, as well as a reduction in phosphatidyl-choline (PC), phosphatidyl-ethanolamine (PE), phosphatidyl-serine (PS) and steroid, significantly.

4. Discussion

Bone disease, e.g., osteoporosis, is a threat to human health; this problem is dominant in women aged over 50. Unfortunately, osteoporosis remains practically incurable fully at this moment [14]. One of the most crucial reasons for this unfavorable situation is poor efficiency of drug(s). Under this scenario, combined herbal therapies have been proposed to have enhanced effectiveness and minimized side effects [15]; however, the action mechanism and rationale of herbal combination are unresolved. DBT, a Chinese herbal decoction containing two herbs (AR and ASR), is an excellent example to illustrate the synergy of two herbs. The boiling together of two herbs provides better efficacy in inducing osteoblastic proliferation and differentiation. Furthermore, a complete profile of data and an experimental systems biology approach in revealing the functionality of a herbal mixture were presented here. This systems biology approach can overcome the key barriers in revealing the action mechanism of TCM having a mixture of herbs.
Bone formation is composed of the processes of cellular proliferation, cellular differentiation and organelle development. As revealed here, the proteomic data suggest that the up-regulated proteins, induced by DBT but not by AR+ASR, are enriched in collagen formation, integrin signaling and cytoskeleton and cartilage condensation. The regulation of these proteins is in accord with rapid cytoskeleton dynamics and bone regeneration [16,17]. In addition, the identified networks relating to bone differentiation and proliferation are enriched by DBT, consistent with our previous report [18]. In acting on cultured osteoblasts, there are plenty of differences in the signaling/metabolism of AR+ASR compared with boiling two herbs together, i.e., DBT, as identified by systems biology. The central metabolism, a process essential for bone formation [18,19], was triggered by DBT but not by AR+ASR. In line with this notion, Wnt-induced signaling has been known to trigger glycolysis flux during osteoblastic differentiation [20]. Supporting this notion, an increase in grip strength and swimming time was revealed in DBT-treated rats, i.e., DBT had a positive influence in promoting energy metabolism [21]. Moreover, the glycolysis flux and capacity were markedly enhanced by DBT in cardiomyocytes [22]. Meanwhile, DBT could induce the proton-transporting ATP synthase activity and the morphology of the mitochondrial membrane in cultured osteoblasts, compared to AR+ASR [22]. As a hypothesis, DBT is a potential anabolic agent for clinical disorders of substrate-availability-based osteoporosis. Moreover, the current identified pathways have never been identified before under herbal treatment. For example, the metabolism of amino acids, as induced by DBT but not by AR + ASR, is known to catabolize skeletal muscle cells to produce energy during muscle regeneration [23].
From 1H-NMR metabolic profiling, asparagine was found in a significantly higher amount in DBT-treated culture than that in AR- or ASR-treated cultures [24]. Asparagine is a key metabolite in the TCA cycle [25]. Therefore, we believe that asparagine may be a key compound to activate energy metabolism in the case of DBT. In parallel, bone cells respond to change in the microenvironment by altering the profile of gene expression. HIF 1-α is one of the critical proteins in this situation, which binds to the hypoxia response element in regulating the expressions of EPO, VEGF and PDGF; these growth factors are related to bone differentiation [26]. In line with this notion, DBT was shown to regulate HIF signaling in cultured HEK293T cells [3].
The importance of the membrane bilayer in promoting the growth and differentiation of osteoblasts has been proposed [27,28]. The lipid profile of culture after DBT treatment was distinct from that of AR+ASR. Interestingly, we found that the amount of acetylcarnitine was increased after DBT treatment. Carnitine and fatty acids are essential molecules for energy metabolism, which convey carbon sources via acetyl-CoA to the citric acid cycle, happening more robustly during inflammation [29]. Besides, acetylcarnitine, triggered by Wnt signaling, was utilized in β-oxidation in osteoblasts [30]. Thus, fatty acid oxidation in osteoblasts is required for bone acquisition in a sex- and diet-dependent manner [30].
In TCM, preparing a herbal decoction in boiling water is the most simple and common practice [31], and this approach has been utilized for thousands of years without change. DBT is an excellent example to show the requirement of boiling two herbs together to achieve maximal pharmacological efficacy. Supporting this synergy of herbal mixture, other TCM formulae have been demonstrated to have such characteristics. Kai-Xin-San, an ancient herbal decoction containing Ginseng Radix et Rhizoma, Polygalae Radix, Acori Tatarinowii Rhizoma and Poria, can trigger the secretion of neurotrophic factors in cultured astrocytes; this activity is more robust in herbal mixture as compared to a single herb [32].
In TCM, water as a means of herbal processing could be due to the following reasons: (i) water is an excellent solvent for most phytochemicals; and (ii) dissolved phytochemical is easier to be absorbed in the gut. Despite the fact that boiling could increase the solubility of phytochemicals, many unknown chemical changes could happen during the process [33]. In DBT, the AR-derived compounds, including formononetin and calycosin, were demonstrated to play crucial roles in DBT’s functions [34]; these chemicals were shown to have higher amounts in DBT, as compared to that from a single herbal extract of AR or ASR. One hypothesis is that calycosin-7-O-β-D-glucoside and ononin can transform to formononetin and calycosin during the boiling process [32]. In line with our results, calycosin is known to stimulate osteogenic differentiation via activation of IGF1R and PI3K/Akt signaling [34], and formononetin can stimulate osteoblastic differentiation via the p38 MAPK pathway [35]. Thus, their signaling pathways are being matched in our DBT-mediated omics analyses.

5. Conclusions

Here, we have demonstrated an in-depth and integrated pipeline to reveal the requirement of boiling two herbs together, to enhance the osteoblastic function of DBT. First, the integration of multi-omics (proteomics and lipidomics) enables an exploration of molecular perturbation in different levels of osteoblastic development. Second, the osteoblastic function of DBT is related to glycolysis, energy metabolism and lipid metabolism. Third, boiling together the herbs collaborates different compounds within DBT, as to maximize their functions. As a result, the boiling of herbs together has a crucial role in controlling the interactions of DBT components. Our omics approach could serve as a crucial backdrop for future studies that characterize the impact of a broad array of different factors in herbal medicine. In addition, the investigation of action mechanisms in applying multi-target drugs, or combinational therapeutics, should be important for the modernization of herbal medicine.

Supplementary Materials

The following are available online at https://www.mdpi.com/article/10.3390/pr9071119/s1, Figure S1: Chemical analysis of DBT, ASR and AR., Figure S2: Multivariate analyses of lipidomic.

Author Contributions

K.W.K.T., H.H.L.L. and K.K.L.K. conceived and designed the experiments. K.K.L.K., T.Y.W. and A.X.D.Y. performed experiments, analyzed the results and created the figures and tables. H.H.L.L. and T.T.X.D. contributed the scientific discussions. K.W.K.T. and K.K.L.K. wrote the paper. All authors have read and agreed to the published version of the manuscript.

Funding

This work is supported by the Special Project of Foshan University of Science and Technology in 2019 (FSUST19-SRI10); The Key-Area Research and Development Program of Guangdong Province (2020B1111110006); Shenzhen Science and Technology Innovation Committee (ZDSYS201707281432317; JCYJ201704131737 47440; JCYJ2018030 6174903174), Zhongshan Municipal Bureau of Science and Technology (ZSST20SC03); Guangzhou Science and Technology Committee Research Grant (GZSTI16SC02; GZSTI17SC02); Hong Kong RGC Theme-Based Research Scheme (T13-605/18-W); Hong Kong Innovation Technology Fund (UIM/340, UIM/385, ITS/500/18FP; TCPD/17-9); TUYF19SC02, PD18SC01 and HMRF18SC06; HMRF20SC07; and AFD20SC01.

Data Availability Statement

The datasets presented in this study can be found in online repositories. The names of the repository/repositories and accession number(s) can be found in the article/supplementary material.

Acknowledgments

The authors appreciate Melody Wong (The University Research Facility in Chemical and Environmental Analysis, The Hong Kong Polytechnic University) for her guidance and technical support for UPLC-orbitrap MS. This work is supported by the Special Project of Foshan University of Science and Technology in 2019 (FSUST19-SRI10); The Key-Area Research and Development Program of Guangdong Province (2020B1111110006); Shenzhen Science and Technology Innovation Committee (ZDSYS201707281432317; JCYJ201704131737 47440; JCYJ2018030 6174903174), Zhongshan Municipal Bureau of Science and Technology (ZSST20SC03); Guangzhou Science and Technology Committee Research Grant (GZSTI16SC02; GZSTI17SC02); Hong Kong RGC Theme-Based Research Scheme (T13-605/18-W); Hong Kong Innovation Technology Fund (UIM/340, UIM/385, ITS/500/18FP; TCPD/17-9); TUYF19SC02, PD18SC01 and HMRF18SC06; HMRF20SC07; and AFD20SC01.

Conflicts of Interest

The authors declare that the research was conducted in the absence of any commercial or financial relationships that could be construed as a potential conflict of interest.

Ethics Statements

The animal study was reviewed and approved by the Animal Experimentation Ethics Committee of Hong Kong University of Science and Technology and Department of Health, Hong Kong (No. 17-283 for Animal Ethics Approval), under the instructions of “Principles of Laboratory Animal Care” (NIH publication No. DH/HA&P/8/2/3).

References

  1. Wu, X.; Wang, S.; Lu, J.; Jing, Y.; Li, M.; Cao, J.; Bian, B.; Hu, C. Seeing the unseen of Chinese herbal medicine processing (Paozhi): Advances in new perspectives. Chin. Med. 2018, 17, 1–13. [Google Scholar] [CrossRef] [PubMed]
  2. Dong, T.T.; Zhao, K.J.; Gao, Q.T.; Ji, Z.N.; Zhu, T.T.; Li, J.; Duan, R.; Cheung, A.W.; Tsim, K.W. Chemical and biological assessment of a Chinese herbal decoction containing Radix Astragali and Radix Angelicae Sinensis: Determination of drug ratio in having optimized properties. J. Agric. Food Chem. 2006, 5, 2767–2774. [Google Scholar] [CrossRef] [PubMed]
  3. Gao, Q.T.; Cheung, J.K.; Choi, R.C.; Cheung, A.W.; Li, J.; Jiang, Z.Y.; Duan, R.; Zhao, K.J.; Ding, A.W.; Dong, T.T.; et al. A Chinese herbal decoction prepared from Radix Astragali and Radix Angelicae Sinensis induces the expression of erythropoietin in cultured Hep3B cells. Planta Med. 2008, 74, 392–395. [Google Scholar] [CrossRef] [PubMed]
  4. Zheng, K.Y.; Choi, R.C.; Xie, H.Q.; Cheung, A.W.; Guo, A.J.; Leung, K.W.; Chen, V.P.; Bi, C.W.; Zhu, K.Y.; Chan, G.K.; et al. The expression of erythropoietin triggered by Danggui Buxue Tang, a Chinese herbal decoction prepared from Radix Astragali and Radix Angelicae Sinensis, is mediated by the hypoxia-inducible factor in cultured HEK293T cells. J. Ethnopharmacol. 2010, 28, 259–267. [Google Scholar] [CrossRef] [PubMed]
  5. Gong, A.G.; Lau, K.M.; Xu, M.L.; Lin, H.Q.; Dong, T.T.; Zheng, K.Y.; Zhao, K.J.; Tsim, K.W. The estrogenic properties of Danggui Buxue Tang, a Chinese herbal decoction, are triggered predominantly by calycosin in MCF-7 cells. J. Ethnopharmacol. 2016, 2, 81–89. [Google Scholar] [CrossRef]
  6. Lin, H.Q.; Gong, A.G.; Wang, H.Y.; Duan, R.; Dong, T.T.; Zhao, K.J.; Tsim, K.W. Danggui Buxue Tang (Astragali Radix and Angelicae Sinensis Radix) for menopausal symptoms: A review. J. Ethnopharmacol. 2017, 6, 205–210. [Google Scholar] [CrossRef]
  7. Song, Z.H.; Ji, Z.N.; Lo, C.K.; Dong, T.T.; Zhao, K.J.; Li, O.T.; Haines, C.J.; Kung, S.D.; Tsim, K.W. Chemical and biological assessment of a traditional Chinese herbal decoction prepared from Radix Astragali and Radix Angelicae Sinensis: Orthogonal array design to optimize the extraction of chemical constituents. Planta Med. 2014, 70, 1222–1225. [Google Scholar] [CrossRef]
  8. Paananen, J.; Fortino, V. An omics perspective on drug target discovery platforms. Brief. Bioinform. 2020, 1, 1937–1953. [Google Scholar] [CrossRef] [Green Version]
  9. Rinschen, M.M.; Ivanisevic, J.; Giera, M.; Siuzdak, G. Identification of bioactive metabolites using activity metabolomics. Nat. Rev. Mol. Cell Biol. 2019, 20, 353–367. [Google Scholar] [CrossRef]
  10. Gong, A.G.; Lau, K.M.; Zhang, L.M.; Lin, H.Q.; Dong, T.T.; Tsim, K.W. Danggui Buxue Tang, Chinese herbal decoction containing Astragali Radix and Angelicae Sinensis Radix, induces production of nitric oxide in endothelial cells: Signaling mediated by phosphorylation of endothelial nitric oxide synthase. Planta Med. 2016, 82, 418–423. [Google Scholar] [CrossRef]
  11. Yu, A.X.; Xu, M.L.; Yao, P.; Kwan, K.K.; Liu, Y.X.; Duan, R.; Dong, T.T.; Ko, R.K.; Tsim, K.W. Corylin, a flavonoid derived from Psoralea Fructus, induces osteoblastic differentiation via estrogen and Wnt/β-catenin signaling pathways. FASEB J. 2020, 34, 4311–4328. [Google Scholar] [CrossRef]
  12. Langenbach, F.; Handschel, J. Effects of dexamethasone, ascorbic acid and β-glycerophosphate on the osteogenic differentiation of stem cells in vitro. Stem Cell Res. Ther. 2013, 4, 117. [Google Scholar] [CrossRef] [Green Version]
  13. Choi, R.C.; Gao, Q.T.; Cheung, A.W.; Zhu, J.T.; Lau, F.T.; Li, J.; Li, W.Z.; Chu, G.K.; Duan, R.; Cheung, J.K.; et al. A Chinese herbal decoction, Danggui Buxue Tang, stimulates proliferation, differentiation and gene expression of cultured osteosarcoma cells: Genomic approach to reveal specific gene activation. Evid. Based Complement. Alternat. Med. 2011, 307548. [Google Scholar] [CrossRef]
  14. Rodan, G.A.; Martin, T.J. Therapeutic approaches to bone diseases. Science 2000, 289, 1508–1514. [Google Scholar] [CrossRef]
  15. Jun, D.W.; Tak, W.Y.; Bae, S.H.; Lee, Y.J. Recent trends in the treatment of chronic hepatitis C. Korean J. Hepatol. 2012, 18, 22–28. [Google Scholar] [CrossRef]
  16. Huck, K.; Sens, C.; Wuerfel, C.; Zoeller, C.; Nakchbandi, I.A. The Rho GTPase RAC1 in osteoblasts controls their function. Int. J. Mol. Sci. 2020, 21, 385. [Google Scholar] [CrossRef] [Green Version]
  17. Dallas, S.L.; Bonewald, L.F. Dynamics of the transition from osteoblast to osteocyte. Ann. N. Y. Acad. Sci. 2020, 437–443. [Google Scholar] [CrossRef] [Green Version]
  18. Langeland, N. In vitro studies on collagen metabolism in metaphyseal rat bone. A. The effect of pre-treatment with oestradiol-17 beta. Acta Endocrinol. 1975, 80, 775–783. [Google Scholar] [CrossRef]
  19. Suzuki, A.; Minamide, M.; Iwaya, C.; Ogata, K.; Iwata, J. Role of metabolism in bone development and homeostasis. Int. J. Mol. Sci. 2020, 21, 8992. [Google Scholar] [CrossRef]
  20. Esen, E.; Lee, S.Y.; Wice, B.M.; Long, F. PTH promotes bone anabolism by stimulating aerobic glycolysis via IGF signaling. J. Bone Miner. Res. 2015, 30, 2137. [Google Scholar] [CrossRef]
  21. Chang, W.C.; Yen, C.C.; Cheng, C.P.; Wu, Y.T.; Hsu, M.C. 2020, Chinese herbal decoction (Danggui Buxue Tang) supplementation augments physical performance and facilitates physiological adaptations in swimming rats. Pharm. Biol. 2020, 58, 545–552. [Google Scholar] [CrossRef]
  22. Kwan, K.K.L.; Huang, Y.; Leung, K.W.; Dong, T.T.X.; Tsim, K.W.K. Danggui Buxue Tang, a Chinese herbal decoction containing Astragali Radix and Angelicae Sinensis Radix, modulates mitochondrial bioenergetics in cultured cardiomyoblasts. Front Pharmacol. 2019, 10, 614. [Google Scholar] [CrossRef]
  23. Meier, U.; Gressner, A.M. Endocrine regulation of energy metabolism: Review of pathobiochemical and clinical chemical aspects of leptin, ghrelin, adiponectin, and resistin. Clin. Chem. 2004, 50, 1511–1525. [Google Scholar] [CrossRef] [PubMed]
  24. Chan, P.H.; Zhang, W.L.; Cheung, C.Y.; Tsim, K.W.; Lam, H. Quality control of Danggui Buxue Tang, a traditional Chinese medicine decoction, by 1H-NMR metabolic profiling. Evid. Based Complement. Alternat. Med. 2014, 2014, 567893. [Google Scholar] [CrossRef]
  25. Duarte, T.M.; Carinhas, N.; Barreiro, L.C.; Carrondo, M.J.; Alves, P.M.; Teixeira, A.P. Metabolic responses of CHO cells to limitation of key amino acids. Biotechnol. Bioeng. 2014, 111, 2095–2106. [Google Scholar] [CrossRef] [PubMed]
  26. Hu, K.; Olsen, B.R. The roles of vascular endothelial growth factor in bone repair and regeneration. Bone 2016, 2016, 30–38. [Google Scholar] [CrossRef] [Green Version]
  27. Elliott, J.T.; Tona, A.; Woodward, J.T.; Meuse, C.W.; Elgendy, H.M.; Plant, A.L. Osteoblast cell membrane hybrid bilayers for studying cell-cell interactions. IEE Proc. Nanobiotechnol. 2004, 151, 75–81. [Google Scholar] [CrossRef]
  28. Bieberich, E. Sphingolipids and lipid rafts: Novel concepts and methods of analysis. Chem. Phys. Lipids 2018, 114–131. [Google Scholar] [CrossRef]
  29. Wang, H.; Ye, J. Regulation of energy balance by inflammation: Common theme in physiology and pathology. Rev. Endocr. Metab. Disord. 2015, 16, 47–54. [Google Scholar] [CrossRef] [Green Version]
  30. Frey, J.L.; Kim, S.P.; Li, Z.; Wolfgang, M.J.; Riddle, R.C. β-Catenin directs long-chain fatty acid catabolism in the osteoblasts of male mice. Endocrinology 2018, 159, 272–284. [Google Scholar] [CrossRef] [Green Version]
  31. Rong, P.; Zhang, X.; Liu, Q.; Ma, R.; Li, L.; Yan, H.; Xin, D.; Xue, Z.; Ren, X.; Wu, Z.; et al. Clinical practices of traditional Chinese medicine for acute upper respiratory tract infection in children. J. Tradit. Chin. Med. 2018, 38, 504–510. [Google Scholar]
  32. Zhu, K.Y.; Xu, S.L.; Choi, R.C.; Yan, A.L.; Dong, T.T.; Tsim, K.W. Kai-Xin-San, a Chinese herbal decoction containing Ginseng Radix et Rhizoma, Polygalae Radix, Acori Tatarinowii Rhizoma, and Poria, stimulates the expression and secretion of neurotrophic factors in cultured astrocytes. Evid. Based Complement. Alternat. Med. 2013, 731385. [Google Scholar] [CrossRef] [Green Version]
  33. Zheng, K.Y.; Choi, R.C.; Guo, A.J.; Bi, C.W.; Zhu, K.Y.; Du, C.Y.; Zhang, Z.X.; Lau, D.T.; Dong, T.T.; Tsim, K.W. The membrane permeability of Astragali Radix-derived formononetin and calycosin is increased by Angelicae Sinensis Radix in Caco-2 cells: A synergistic action of an ancient herbal decoction Danggui Buxue Tang. J. Pharm. Biomed. Anal. 2012, 2012, 671–679. [Google Scholar] [CrossRef] [PubMed]
  34. Fang, Y.; Xue, Z.; Zhao, L.; Yang, X.; Yang, Y.; Zhou, X.; Feng, S.; Chen, K. Calycosin stimulates the osteogenic differentiation of rat calvarial osteoblasts by activating the IGF1R/PI3K/Akt signaling pathway. Cell Biol. Int. 2019, 43, 323–332. [Google Scholar] [CrossRef]
  35. Gautam, A.K.; Bhargavan, B.; Tyagi, A.M.; Srivastava, K.; Yadav, D.K.; Kumar, M.; Singh, A.; Mishra, J.S.; Singh, A.B.; Sanyal, S.; et al. Differential effects of formononetin and cladrin on osteoblast function, peak bone mass achievement and bioavailability in rats. J. Nutr. Biochem. 2011, 22, 318–327. [Google Scholar] [CrossRef]
Figure 1. DBT and AR+ASR in osteoblastic differentiation. (A): DBT, at different concentrations, was applied onto cultured osteoblasts for 7 days to analyze cell proliferation in dose-dependent manner (left panel). The proliferation was compared between DBT (1 mg/mL), AR+ASR (1 mg/mL) and vitamin C (250 μM) and dexamethasone (20 nM) (right panel). (B): Treatment as in (A), ALP activity was induced by DBT (left panel), and by different treatments, as in (A). Values are expressed as % of increase in the control, mean ± SEM, where n = 6. * p < 0.05, ** p < 0.01, *** p < 0.001.
Processes 09 01119 g001
Figure 2. DBT and AR+ASR induce collagen synthesis and cell adhesion. (A): Cultured osteoblasts were treated with DBT (1 mg/mL), AR+ASR (1 mg/mL) and vitamin C (250 μM) and dexamethasone (20 nM) as in Figure 1, before staining with Sirius Red. Micrographs were taken by phase-contrast microscopy (upper panel). One representative result is shown. The quantification of colorimetric intensity was calculated by image J (lower panel). (B): The treatments of osteoblasts were the same as in (A). The cell adhesion ability was measured (upper panel). The quantification was calculated by image J (lower panel). (C): Micromass cultures of mouse limb bud cells were incubated in DBT or AR+ASR, as in (A), for 7 days. The cartilage formed in an inner tissue core, followed by a ring of mineralization near the periphery, as shown by Alcian blue and Alizarin Red S. Vitamin C (250 μM) and dexamethasone (20 nM) served as a positive control. Values were expressed as % of increase, or fold of change (X basal), of the control, mean ± SEM, where n = 6. * p < 0.05, ** p < 0.01, *** p < 0.001.
Processes 09 01119 g002
Figure 3. Comparison of proteomics between DBT and AR+ASR. The treatment of osteoblasts was as that in Figure 1. (A): The statistical summary of total detected peptide, protein and DEP. (B): In MS results for DBT and AR+ASR, DEPs are deemed significant for p < 0.05, as well as for a fold change higher/lower than ±1.5, corresponding to the rectangular regions. (C): PCA analyses resolve the observations into 2 clusters. The components, PC1 and PC2, reflect the horizontal and vertical axis, respectively. (D): Heat map analysis of identified proteins. The brightness of each color corresponds to the magnitude of difference when compared with the average value. Hierarchical clustering is shown at the top of the map.
Processes 09 01119 g003
Figure 4. Distinction of signaling induced by DBT but not by AR+ASR. KOBAS analysis enriches the signaling pathway in DEPs via analyses of KEGG, Reactome, BioCye, PANTHER and GO. The size of the circle represents -log10(P). (A): Bone development; (B): lipid metabolism; (C): glucose and amino acid metabolism; (D): RNA metabolism; (E): energy metabolism; (F): other responses relating to bone formation.
Processes 09 01119 g004
Figure 5. Network analysis of proteomics data. The treatment of osteoblasts was as that in Figure 1. From the proteomics data, the regulated proteins in responding to treatments of DBT and AR+ASR were identified by molecular network analysis. The network was obtained by analyzing the DEPs using ingenuity IPA. The correlation network was centered in (A) collagen synthesis, (B) β-estradiol signaling and (C) ERK1/2 signaling.
Processes 09 01119 g005
Figure 6. Comparison of lipidomics between DBT and AR+ASR. The treatment of osteoblasts was as that in Figure 1. Lipids were subjected to metabolite analysis by LC-MS. (A): The dispersed location of MS/MS scans (+/−) along with retention time, m/z and intensity shows the optimized LC gradients and efficient separation of the method of acquisition. (B): A direct comparison between PLS-DA analyses identified 2 groups of clustering. The components, PC1 and PC2, reflect the horizontal and vertical axis, respectively. (C): OPLS-DA score plot identified the maximum separation between DBT and AR+ASR.
Processes 09 01119 g006
Figure 7. S-plot and heat map distinction between DBT and AR+ASR. (A): The S-loading plot of OPLS-DA shows the metabolites having a significant difference between DBT and AR+ASR. (B): Heat map analysis of identified DEMs. The brightness of each color corresponds to the magnitude of difference when compared with average value. Hierarchical clustering is shown at the top of the map.
Processes 09 01119 g007
Publisher’s Note: MDPI stays neutral with regard to jurisdictional claims in published maps and institutional affiliations.

