Abstract
This study verified the environmental effectiveness of potentially less aggressive routes for the synthesis of poly(propylene/ethylene oxide) glycol (PPG). The analysis was developed in two stages. Firstly, the environmental performance of the conventional PPG processing route was compared to alternative variants—vegetal PPG and CO2-based PPG—applying the life cycle assessment technique to measure the primary energy demand, global warming potential, acidification, photochemical oxidation, and freshwater ecotoxicity impact categories. The synthesis of vegetable polyols from bio-based assets, such as vegetable oils, and the application of CO2 conversion routes as an alternative to technologies supported by petroleum and natural gas were studied. The use of CO2 recovered through carbon capture and usage practices resulted in environmental gains for PPG production. The processing routes within vegetal assets were not an environmentally attractive option as the performance was worse than the conventional arrangement by 144% for the global warming impact category, an increase related to the deforestation carried out to expand soybean cultivation in Brazil. Secondly, improvement scenarios to mitigate the environmental impacts of alternative routes were performed. The hypothesis of using cleaner inputs to obtain a more ecofriendly route was tested. The analysis concluded that the use of high-purity CO2 brings fewer benefits compared to other capturing sources that need a purification process before feeding the PPG synthesis.
1. Introduction
Polyols are monomers or polymers containing two or more hydroxyl groups per molecule available for reactions [1]. Generally classified into polyether and polyester, these compounds are used in the manufacture of polyurethane products for the production of flexible foam and rigid foam, as well as coatings, adhesives, sealants, and elastomers (CASE) [2]. Therefore, the global polyol market reached USD 25.6 billion in 2020 and is expected to grow at a compound annual growth rate (CAGR) of 6.0% over the 2021–2026 period [3]. In chemical terms, polyols are obtained by carbon, hydrogen, and oxygen atom sequences, with the first two largely provided by crude oil and natural gas. In addition, many transformations throughout their productive cycles, particularly in the synthesis of assets and intermediates, are endothermic, consuming more non-renewable resources [4].
The dependence on raw materials of a fossil origin and the contributions to global warming make the synthesis of polyols and their derivatives subject to proposals for alternative and less impactful industrial production routes. The most recent developments carried out in this regard follow two directions: (i) the synthesis of vegetable polyols obtained from bio-based assets, such as vegetable oils and lignin; and (ii) the application of CO2 conversion routes as an alternative to technologies supported by petroleum and natural gas.
The utilization of CO2 for poly(propylene/ethylene oxide) glycol (PPG) production, one of the broadest and most varied families of polyols, allows an impact reduction of up to 4.0 kg CO2-eq and 2.0 kg oil-eq per kg CO2 utilized [5].
Vegetable oils are probably the most explored bio-based material in the production of renewable polyols. Soybean, castor, rapeseed, and palm, among others, supply the routes that apply these vegetable inputs. The fatty acid-containing oils can be modified by epoxidation, glycolysis, transesterification and ethoxylation in order to achieve the desired number of hydroxyls and viscosities of the final polyol [6]. The literature describes experiences concerning renewable polyol processing—from rapeseed oil, sorbitol and cottonseed, and castor oil associated with crude glycerol—used in the production of polyurethane foams (PUF) [7,8]. Oliviero et al. [8] and Stanzione et al. [9] explored the preparation of polyhydroxyls obtained from succinic polyols originating from different bio-based sources, while Tajau et al. [10] assessed the synthesis of a polyol ester from palm oil to be used as a polymeric drug carrier. In addition, in a typical Brazilian experience, Gandara et al. [11] used polyols from sugarcane bagasse treated by steam to produce high-sorption capacity PUF concerning vegetable oils in water.
Vegetable biomasses are applied in polyol production to improve foam properties. For example, Lei et al. [12] applied the processing of polyurethane elastomer reinforced with cellulosic fiber from paper waste in order to increase this material’s stability at high temperatures (>300 °C), and Oliveira et al. [9] prepared PUF with better mechanical properties using a plant source polyol obtained from lignosulfate and ricinoleic acid derived from castor oil reinforced with sisal fibers, in substitution to its synthetic diethylene glycol- and polyethylene glycol-based counterpart. Blend developments that originated from the partial replacement of fossil polyol with a renewable version obtained from castor oil [13] and rapeseed oil [14], as well as from the synthesis of hybrid polyurethane by associating bio-polyol (liquefaction of cellulose biomass), sisal fiber, and fiberglass [15], are also noteworthy. It is important to note that these studies admitted, without careful verification, that the total (or even partial) replacement of petrochemical assets by bio-based materials is sufficient to improve the environmental sustainability of polyol and generated polymer production.
Another alternative to fossil-based processes is CO2 conversion. Taking into account that the presence of CO2 is abundantly available in the atmosphere, which made it a low acquisition feedstock. Carbon capture and usage (CCU) technologies are noteworthy concerning their potential to reuse the CO2 discarded by a certain process as the input for another anthropic transformation [16]. This approach consolidates CCU techniques as a strategy for global warming potential (GWP) regulation [17], and a part of the scientific community has dedicated efforts to assess the viability of CCU in achieving this objective. Aresta et al. [18] investigated the potential of several CCU applications in converting CO2 into fuels and concluded that cycling large volumes of this gas is a way to control both atmospheric CO2 emissions and fossil fuel extraction.
After evaluating 16 scientific studies in which a CCU technique was coupled with industrial processes, Cuéllar-Franca and Azapagic [19] realized that the global efficiency of the process in reducing GWP impacts is related to the way CO2 is used. This is so true that, on the one hand, improved oil recovery exhibits a 2.3-fold lower GWP than atmospheric CO2 discharging, while, on the other hand, the CO2 capture by microalgae to obtain biodiesel even generated about 2.5-fold more GWP than fossil diesel. Sternberg et al. [4] compared conventional routes for the production of formic acid (CH2O2) using carbon monoxide, methane and methanol with a CO2-based alternative and reported that the CH2O2 synthesis via CCU accumulates the largest GWP and fossil depletion reductions in the entire series.
A conceptual and consistent way to carry out these environmental impact measurements is through the application of the life cycle assessment (LCA) technique, which quantifies environmental impacts throughout the entire product life cycles. Von der Assen and Bardow [20] applied an LCA to investigate the consumption of fossil resources and contributions to GWP during the production of CO2-based polyethercarbonate polyols. When feeding CO2 from a lignite power plant into the CCU system, the authors observed that polyol production using 20% CO2 reduces greenhouse gas (GHG) emissions by 11–19% and fossil use by 13–16% compared to the conventional process. In another experiment, Von der Assen et al. [5] optimized polyurethane production from CO2 conversion using linear programming and an LCA to obtain minimal environmental impacts. In this case, the authors observed that CO2 use indirectly influences the process and that its benefits depend on hydrogen production impacts.
The literature reports LCA applications in determining the environmental performance of polyol synthesis in several situations, such as Baena-Moreno et al. [21] for reducing environmental impacts of raw materials, and Von der Assen and Bardow [20] in order to mitigate GHG emissions. Wang et al. [22] showed that CO2-based polyols can improve the oxidation and hydrolysis resistance with respect to that based on polyether polyol. There are no case records in which the diagnoses are applied to resize the processes in order to make them more sustainable. The present study does so by verifying the effectiveness of actions aimed at reducing the impacts implemented in routes originally designed to overcome the conventional process in this dimension. The study presents results and methodology that might help in scaling up the process on a larger scale.
The synthesis of poly(propylene/ethylene oxide) glycol (PPG) copolymers was selected for this analysis due to their wide use in rigid foam and high-performance paint manufacturing [23]. The investigation was carried out in two stages. In the first, the environmental performance of the conventional PPG route and its two variants was calculated by an LCA and compared to each other. The conventional route involves cyclic ether mixtures, in which complex double-metal cyanides (DMCs), which are inorganic solids containing two or more metal ions linked by cyanides used for the industrial epoxide polymerization, replace potassium hydroxide as catalysis agents. In one of the alternative processes, epoxides were replaced by a chemically modified vegetable oil in order to introduce hydroxyl groups for polyol generation. In the other arrangement, CO2 captured from CCU practices was used to partially replace epoxides in a reaction with propylene oxide and glycerin for PPG synthesis. The impacts of each route were estimated in terms of primary energy demand, global warming potential, acidification, photochemical oxidants, and freshwater ecotoxicity, and the analysis allowed for the identification of adverse effects in each situation. In the second stage of the study, actions aimed towards the mitigation of environmental bottlenecks were proposed and specified, and a second LCA round evaluated their effectiveness. All processes were modeled for typical Brazilian operating conditions.
Polyether polyols are intermediates used in the manufacture of various consumer goods. The verification of the environmental reliability of sustainable alternative production processes, as well as the development of proposals to improve these processes, is, therefore, also a way to mitigate the adverse effects of their production chains. Moreover, to be strategic, this type of assessment, based on the principles of cleaner production and industrial ecology, is innovative within the Brazilian chemical sector, in line with modern environmental management models.
2. Materials and Methods
2.1. PPG Processing Route Specifications and Analysis Scenario Definition
PPGs are produced by an alkoxylation reaction, in which an initiator containing hydroxyl groups reacts with epoxides in an alkaline environment that acts as a catalyst. Glycerin (natural or synthetic) is often used as a starter, while ethylene (EO) and propylene (PO) oxides serve as epoxides in the petrochemical-based process. Although potassium hydroxide (KOH) is the conventional catalyst option for this process, DMC has been successfully used as a substitute, due to process and environmental benefits. The mechanism achieves its highest yield (~85%), selectivity (~90%) and reaction rate under controlled temperature (130–135 °C) and pressure (3.0 bar) conditions. Once the curing time is reached, the reactional mass proceeds to the purification process, which is carried out by assisted distillation using water and organic solvents. Under such conditions, a polyol with an average molecular weight of 3000 g/mol is obtained. PO is present in high amounts in the PPG composition (up to 80% w/w), while EO contributes to less than 15% of the total mass of the polymer chain [24].
With a general formula (Zn3[Co(CN)6]2 x ZnCl2·y H2O·z binder), DMC is a coordinating catalyst that prevents the occurrence of secondary reactions that form allyl alcohol [25]. Because of this, the routes for PPG preparation are widespread, due to reduced utility use. Compared to the KOH technology, PPG synthesis from DMC achieves significant electricity (75%), water (88%) and steam (99%) consumption reductions [26]. In addition, due to its high reactivity in epoxide homopolymerization, low DMC concentrations are incorporated into the PPG (~30 ppm), releasing the use of recovery operations (neutralization and solvent addition), resulting in a less energetically intensive process and eliminating tailings [27].
The second route was modeled considering soybean oil as a fatty acid source, due to its high triglyceride content (~85%) [6], and Brazilian market availability, which surpasses those of other options used in polyol synthesis, such as palm or castor oils, also supplying the food and biofuel segments. The process begins with mechanical oil extraction by hot pressing the soybeans. The pulp generated in this stage receives organic solvents (C6 and C7 alkanes) for residual oil fraction removal, reaching a soybean oil extraction yield of η > 95% [28]. The raw oil is then fed into a reactor equipped with agitation and heating mechanisms, where it receives a live steam injection (150 °C) to remove gums (phospholipids) and impurities. After degumming, oil viscosity is adjusted by stirring and heating (~80 °C). Under these conditions, it becomes an oil blown by self-oxidation when placed in direct contact with air. Gaseous nitrogen is also added to the reactor in order to avoid its polymerization [29]. An epoxide is a cyclic ether with a three-atom arranged as an equilateral triangle. This configuration makes the ring strained and, thus, more reactive than other ethers. Many different epoxidation processes are available, but, in the case of vegetable oils, this transformation occurs via the reaction of fatty acids with formic acid and hydrogen peroxide, followed by dehydration and neutralization. In the process proposed by [30], epoxidized soybean oil is mixed with methanol and a catalyst inside the oligomerization reactor. The system is heated to 55 °C and, as the reaction is exothermic, ethylene glycol is recycled in a cooling jacket to maintain its temperature for 30 min. At the end of the reaction, the oligomeric polyol is conditioned by sparging with N2, while the remaining methanol is removed by vacuum and condensation processes.
The third route considered in this study applies operations similar to those of the conventional process. The difference is in the use of CO2 as a process reactant, replacing ethylene glycol. Although CO2 can be applied in different polyurethane processing stages (e.g., in obtaining methanol and isocyanates, or in expanding foam), its most frequent application is as a building block for poly(ether carbonate)polyols [5]. If dosed in concentrations above 10% v/v, CO2 can fully substitute EO in the PPG formulation without altering thermal and electrical process demands [31]. The technology basically consists in the reaction of CO2 with a hydroxyl source (starter-OH) and an epoxide. The CO2 is dosed in excess in the reactor, due to its chemical stability. The starter-OH should have a molecular weight ranging between 62 and 2000 g/mol, and up to eight hydroxyls. The epoxide is an organic compound with the general formula C2H3O–R, where the radical “R” corresponds to hydrogen (H), an alkyl group (H3C–CH2–), or even an aryl group (benzene-core carbon) [20]. We admitted herein that the epoxide mixture traditionally fed into the reactor would be represented by PO in the modeling. In order to achieve the expected conversions, the system used to catalyze copolymerization, which includes DMC (10–25 ppm), must operate at 1.0–100 bar pressures and temperatures between 90 and 130 °C. A cyclic carbonate is also generated as a by-product [32].
In addition to immobilizing carbon in polymer molecules long enough to mitigate global warming, the CO2-based route reduces the impacts of abiotic depletions, since EO is obtained from fossil sources. We assumed that CO2 would originate from waste gases emitted by another process (CO2 contents ranging between 20 and 25% v/v) and must be treated before proceeding to the PPG synthesis. The CCU technique employed in this treatment comprises two stages: (i) CO2 extraction from the gas stream by contact with monoethanolamine (MEA: 15–20% w/w), and (ii) contaminant removal (including MEA) until the final product reaches 99% v/v CO2. It was assumed that the concentrated gas would be liquefied before proceeding to the PPG synthesis plant. Table 1 presents the average material and energy consumption associated with PPG synthesis by the conventional route, as well as the vegetable and CO2-based alternatives.

Table 1.
The main material and energy inputs used in PPG synthesis in conventional (applying DMC as catalyst), vegetable, and CO2-based routes.
The PPG synthesis routes selected for this study were coded R1: conventional; R2: vegetable polyol; and R3: CO2-based. The processes involved in route R1 and their operating conditions (i.e., pressure and temperature) were established based on Fernández-Dacosta et al. [31]. Data collected by Prazos and Shih [33] and Resse and Hager [34] were used to define the average consumption and emission values associated with the process. The need to establish a consistent and representative technological arrangement for conventional PPG processing has led to the investigation of certain aspects associated with the DMC performance [35]. Kuyper and Schaik-Struykenkamp [36] used an approach similar to what was adopted for glycerin, which played the role of initiator in the model, as it is an active hydrogen-containing compound.
Route R2 specifications were obtained in two stages. In the first, we sought knowledge concerning the reaction mechanisms involved in vegetable polyol processing from soybean oil. Reported by Petrović [1], Desroches et al. [37] and Błażek and Datta [38], this information was decisive in defining the operating conditions for the synthesis of the polyol per se.
In the second stage, the average amounts of raw material and input streams and the utilities involved in the synthesis were established. The applied estimates were developed using data obtained in a pilot plant as described by Stirna et al. [39] and Fridrihsone et al. [40]. Even though Fridrihsone et al. modeled the synthesis of vegetable polyol from rapeseed oil, we admitted that the variability between its mono-unsaturated and poly-unsaturated fats and those presented by soybean oil (the fatty acid source used in R2) would not affect the technical performance of the process and, therefore, its environmental performance.
Finally, in R3, CO2 capture and concentration processes were dimensioned based on experiments carried out in a pilot plant by Von der Assen and Bardow [20]. An adaptation of the qualitative composition of the gas injected in the reactor was required, given that the concentrated CO2 stream considered by Von der Assen and Bardow originated from a thermoelectric plant operated with lignite, while the one used herein originated from the treatment of waste gases resulting from different processes by MEA. Information and parameters available in Haider et al. [41] were, thus, used for this. In addition, the specification of the CO2 purification step was based on Feralpi et al. [42] and Langanke et al. [27].
2.2. PPG Synthesis Life Cycle Modeling
The environmental performance diagnoses followed the methodological guidelines established by the ISO 14044 standard [43] for an attributional LCA applied in a “cradle-to-gate” scope, and considering the production of 1.0 kg of poly(propylene/ethylene oxides) glycol (PPG) as the functional unit. The temporal coverage for all cases was defined as the full year of 2018. In addition, we supposed that the productive units were located in Brazil. Finally, the technological dimension considered certain operational constraints presented in Section 2.
All routes were modeled using secondary data obtained from reference sources. The adaptation to Brazilian conditions was mainly, but not only, due to the suitability of process utilities to that reality. Mass and energy flows with cumulative contributions of less than 1.0% of the total process (or systems) inputs and outputs that make up each route were disregarded. The exception was the DMC catalyst, due to its procedural importance for R1 and R3, and for the agrochemicals added to soybean crops for pest control. Even in amounts lower than the cut-off criteria, these assets were taken into account given their environmental relevance [43]. No multifunctional situations were identified in any of the investigated arrangements.
The life cycle impact assessment (LCIA) was developed from two perspectives. The first observed environmental impacts derived from the consumption of natural resources. Given that all the investigated PPG synthesis routes are energy-intensive, we decided that these effects would be expressed in terms of primary energy demand (PED). PED estimates were calculated using the Cumulative Energy Demand v1.11 method (Frischknecht et al., 2007), which allows for the classification of energy impacts in terms of non-renewable (fossil: NRF; nuclear: NRN; and biomass: NRB) and renewable (wind, solar, geothermal: RWSG; biomass: RB; and hydraulic/water: RW) sources. The second perspective considered impacts arising from the regular emissions of the life cycles of each process. The global warming potential (GWP), acidification (Ac) and photochemical oxidation (PhO) impact categories were selected to verify atmospheric consequences. Damage due to losses to the water were depicted as freshwater ecotoxicity (FWET) contributions.
The GWP for each route was quantified using the Intergovernmental Panel on Climate Change (IPCC) v1.03 method for a time span of 100 years (IPCC, 2013). The selection of this impact category allows for a more precise investigation of the effects provided by the coupling of the bio-based and CO2-based routes to PPG processing under the conditions in which these connections were established. As it is a mixture of residual gases, the original CO2 stream was treated as an elementary flow in R3. This implies that any environmental loads associated with CO2 due to its generation were disregarded by the analysis.
This decision was made based on the fact that CCU practices are considered valuing strategies for this GHG [44,45]. The arguments that support this decision are presented and discussed in Section 3. The contributions were calculated by applying the model proposed by Huijbregts [46] which is based on the concentration of H+ ions present in rainfall. PhO contributions resulting from the emission of non-oxygenated organic compounds were determined using the model developed by Derwent et al. [47], while the magnitude of the effects caused by oxygenated volatile organic compound releases was determined by applying the model developed by Jenkin and Hayman [48]. Finally, impacts in the form of FWET were estimated by the USES-LCA [49], describing toxic substance fates, exposure and effects for an infinite time horizon.
Figure 1a–c presents the product systems established for the comparison carried out in the first step of this study. Otherwise describing the analyzed routes, the schemes highlight natural resources and product system transport operations. The calculations made for both the preparation of the life cycle inventories (LCIs) and the environmental impact diagnoses were performed with the aid of the SimaPro v 9.0 software (PRé Sustainability®). The operational logic applied by SimaPro for such estimates is based on matrix multiplication. For the construction of the consolidated LCI of each product system, the matrix that describes the environmental aspects associated with a certain life cycle stage is multiplied by the transposed matrix of technical coefficients in order to adjust them to the reference flow (i.e., the calculation basis) defined for the study. In the LCIA, the consolidated environmental aspect matrix is multiplied by the transposed matrix of equivalence factors from the selected impact categories [50].
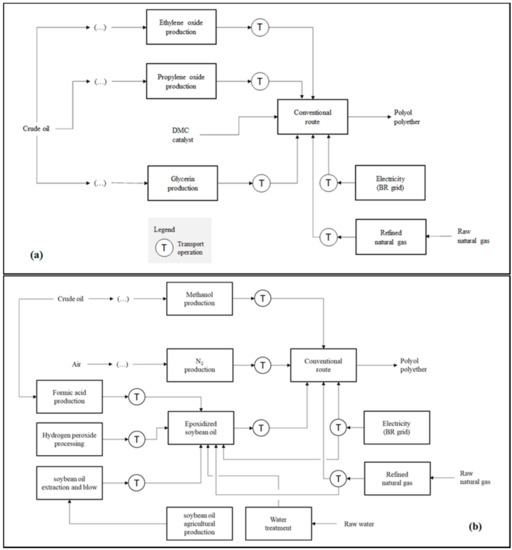
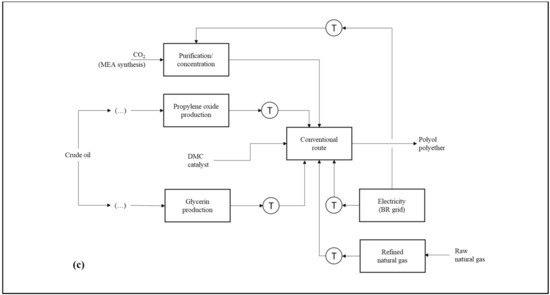
Figure 1.
Product systems that describe the PPG synthesis applying: (a) the conventional route using DMC as catalyst (R1); (b) the vegetable route, including the preparation of epoxidized soybean oil (R2); and (c) the CO2-based route, comprising CCU coupled to the polyol manufacturing plant (R3).
2.3. Life Cycle Inventory
As noted previously, the consolidated life cycle inventory (LCI) for each scenario was prepared based on secondary data obtained from the technical literature and LCA databases, which were adapted to represent the conditions available in Brazil for their operation. The procedure was applied to raw materials (propylene and ethylene oxides, glycerin, methanol and formic acid), inputs (DMC catalyst, N2(g) and hydrogen peroxide), intermediates (propylene and ethylene glycol), and utilities (heat and electricity generation and water treatment). The original data are part of the Ecoinvent database collection, in the form of the following datasets: “Ethylene oxide, at plant/RNA,” “Propylene oxide, at plant/RNA,” “Glycerin, at plant/RER U,” “Propylene glycol, liquid {GLO}|market for|RER, U” and “Tap water, at user|RER U” [51]. Agricultural production and the manufacture of soybean oil used in R2 were also adapted to the Brazilian reality.
The procedure was applied to raw materials (epoxidized soybean oil, nitrogen and methanol) and utilities. The original data are also part of the Ecoinvent database, in the form of the following datasets: “Formic acid {RoW}| production, methyl formate route | APOS, U,” “Methanol {GLO}| production | APOS, U,” “Hydrogen peroxide, without water, in 50% solution state {RoW}| hydrogen peroxide production, product in 50% solution state | APOS, U,” “Nitrogen, liquid {RoW}| air separation, cryogenic | APOS, U” [51] as well as “Soybean oil, refined {RoW}| soybean oil refinery operation | APOS, U,” and “Soybean oil, crude {BR}| soybean meal and crude oil production | APOS, U” [52].
The natural gas life cycle was modeled following the same strategy, with extraction activities (onshore and offshore), refining and product distribution gathered in the “Natural gas, at production/RER” dataset [53]. Consumption and emissions associated with these operations were adapted to the conditions practiced in Brazil from the data collected in Sakamoto et al. [54]. The Brazilian electricity network (BR grid) was edited according to the average share of sources available in 2017 [55]. At that time, most of the electricity generated in the country originated from hydropower plants (65%), followed by thermoelectric processes operated with natural gas (10%), biomass, i.e., sugarcane bagasse (8.2%) and coal (4.1%). Internal road transports were modeled based on the “Transport, truck > 20t, EURO4, 100% LF, empty return/GLO Mass” LCI. Concerning PO displacement from Aratu (in the Brazilian state of Bahia) to the PPG unit considered by R1, located in the municipality of Guarujá (state of São Paulo), the “Transport, barge ship, bulk, 12000t, 100% LF, default/GLO Mass” inventory [56] was used as a reference.
DMC production was not part of the Ecoinvent base. Thus, its synthesis was modeled according to literature data and information [57]. It was assumed that the catalyst would be obtained by a direct and single-stage reaction between sodium cyanide (NaCN), zinc (Zn) and cobalt (Co), to be carried out in a continuous stirred-tank reactor (CSTR). The choice of NaCN is conservative, as this is the cyanide that results in the highest environmental impact present in the Ecoinvent database [51]. The amounts of each component were determined based on Fernández-Dacosta et al. [31].
DMC is the only asset acquired through importation. Its route from China (where it is produced) to Guarujá contains road sections in the origin and destination countries, where truck displacements were admitted. In addition, environmental loads generated from the displacements between the ports of Shanghai (CN) and Santos (BR) were also evaluated by the model.
3. Results and Discussion
Table 2 presents the environmental diagnoses of the PPG processing routes assessed herein. These findings suggest that coupling CCU practices to the process (R3) can result in environmental gains, by reducing impacts in all categories analyzed in comparison with the conventional scheme (R1). On the other hand, the vegetable polyol production route based on soybean oil (R2) presented the worst environmental performance, even with the use of a renewable input.
Table 2.
Environmental PPG processing routes’ performances.
Concerning R1, two factors justify the impacts of PED and GWP. The first refers to the use of fossil ethylene and propylene oxides in the PPG formulation, which directly affects the arrangement′s PED performance. In addition, the production cycles of these raw materials are essentially endothermic. Therefore, although consuming natural gas, a fuel with increased high heat value (typically, 31.7 MJ/m3), to meet these demands, PED effects become appreciable when viewed from a life cycle perspective. As a corollary of this situation, CH4 and CO2 emissions still occur. Methane losses derive from several factors, but are always associated with the natural gas life cycle.
In this case, CH4 releases are due to (i) the reinjection of underground gas (8.82 g/m3 raw gas), given that the Brazilian supply of this input originates mostly from offshore operations; (ii) operational fluctuations in the refining units, termed natural gas processing units (NGPU) (22.3 mg/m3 finished gas); and (iii) leakages in the final product distribution lines (398 mg/m3 distributed gas). The CO2 is discarded into the atmosphere due to ethylene (C2H4: 1.12 kg/kg) and propylene (C3H6: 1.14 kg/kg) manufacturing, both intermediates in the EO and PO processing steps. In fact, the syntheses of such inputs also release CO2 at 210 g/kg EO and 104 g/kg PO rates, respectively. Carbon dioxide is also emitted through the flare systems installed in the NGPU (165 g/m3) to (also) cushion operational deviations.
The electricity demand in R1 also affects PED and GWP, ranging from 200 to 250 Wh/kg in PPG production and at about 330 Wh/kg both for EO and for PO processing. Therefore, although the 2017 BR grid was predominantly of a renewable origin (~80%), the PED impacts associated with natural gas (535 J/kWh), coal (225 J/kWh), and oil derivatives, in this case the depletion of crude oil (283 J/kWh), become significant. Regarding GWP impacts, electricity generation resulted in CO2 and CH4 emissions of 112 g/kWh and 19.6 g/kWh, respectively.
The higher impacts of both categories in R2 compared to those achieved by other scenarios are especially associated with the agricultural stage (77%). According to the Brazilian National Supplying Company (CONAB), the country produced 121 Mt of soybeans in the 2018/2019 harvest. This performance is, in part, justified due to a planted area expansion of ~7.0% [58], partially over primary and secondary forests, resulting in CO2 emissions due to land transformation [59]. Regarding primary energy demand, native forest suppression due to soy cultivation augmentation generated 64 MJ/kg PPG of impacts in terms of non-renewable biomass, which implies 44% of the total impact for that category. In addition, another 40 MJ PED/kg PPG can be attributed to this crop as renewable biomass contributions, due to the gross calorific value (GCV) accumulated by soybean plants.
The substitution of EO by CO2 caused the PED effects observed in R3 to be reduced by 36% compared to R1. In the case of GWP, a 47% decrease was observed. Such results indicate that primary energy demand and GHG emissions associated with the EO life cycle are higher than their counterparts provided by CCU technologies. The decision to treat CO2 as an elementary flow is also responsible for the success of this alternative route. Finally, the CO2 stream purification and compression stages prior to its use in the PPG synthesis caused low environmental impacts of 1.23 MJ/kg and 128 mg CO2eq/kg. This is due to the significant participation of renewable sources in the BR grid. The performances of R3 are auspicious in permitting the expansion of the CO2 range, supplying sources to the assessed processing.
R1 acidification impacts originate from sulfur dioxide (SO2) and nitrogen oxide (NOx) emissions. SO2 losses occur mainly during natural gas extraction and refining (11.1 g/kg PPG) used for heat generation during various stages of the process, as well as coal burning for electricity generation (3.17 g/kg), whose participation in the 2017 BR grid was 4.1% [55]. Coal-fired thermoelectric plants also emit NOx (1.28 g/kg), which adds to another 1.38 g/kg of losses due to natural gas burning in thermal systems, and an additional 1.01 g/kg released in raw material and input transport operations, carried out by diesel-powered vehicles. SO2 and NOx emissions are also the main Ac contribution source in R2. The energy-intensive nature of the process means that, once again, the use of coal in thermoelectric plants (673 g/kg PPG) and natural gas refining (186 g/kg) appears as an important SO2 emission source, along with transport (151 g/kg) and sulfuric acid production (117 g/kg), consumed in the manufacture of phosphate fertilizers applied to soybean cultivation. Apart from causing impacts for PED and GWP, the expansion of soy cultivation over native forest areas also generates negative effects in the form of acidification that regarding SO2 losses (404 g/kg) occurs due to diesel burning by agricultural equipment used in land cleaning. Soybean cultivation is the main focus of NOx emissions. In addition to natural biomass burning for crop installation (1.71 g/kg), soil preparation operations (490 mg/kg), crop treatments (490 mg/kg) and mechanized harvesting (430 mg/kg) contribute to atmospheric NOx releases. Gaseous ammonia (NH3) emissions also cause Ac impacts in R2, because of the incomplete combustion of native forest in the field at a rate of 973 mg/kg PPG. The Ac impact profile in R3 is similar to that of its counterparts in terms of both precursors and generation sources. In this case, SO2 and NOx are emitted during the generation of the heat consumed in the C3H6 processing (1.37 g SO2/kg PPG and 1.25 g NOx/kg PPG), transport activities (139 mg/kg and 1.15 g/kg) and electricity generation in thermoelectric plants (255 mg NOx/kg).
The photochemical oxidation contribution profile varied concerning the precursors in all the analyzed routes. For R1, gaseous SO2, ethylbenzene (C8H10), isoprene (C5H8) and carbon monoxide (CO) emissions originate from PO processing (818 mg/kg PPG), while C5H8 derives from biomass burning for electricity generation. As with other grasses, sugarcane converts glucose into isoprene to stabilize its cell membrane walls (Sharkey et al., 2008).
When bagasse and cane straw are burned in thermoelectric plants, a part of this C5H8 does not degrade, despite controlled combustion conditions, but is released into the atmosphere in its reduced form. In the present case, such fumes correspond to 117 mg/kg PPG. CO losses (4.00 g/kg) originate mostly from combustion processes for thermal and electrical energy production. R2 contributions to PhO stem mainly from formaldehyde emissions (1.05 g/kg PPG), C2H4 (1.49 g/kg) and C3H6 (411 mg/kg) caused by biomass burning from primary and secondary forests in current soy monoculture areas. The series is completed with hexane releases (C6H14: 4.09 g/kg), used as a solvent in soybean oil extraction. The main source of impacts for PhO in R3 lies in C3H6 (1.16 g/kg) emissions, which occur during propylene oxide synthesis.
Barium (Ba) emissions to water and cypermethrin to soil are responsible for almost all the freshwater ecotoxicity impacts caused by R1. Barium salts are formed due to the reinjection of sea water in offshore wells, the main fossil energy resource sources in Brazil, and continue with oil and natural gas transport to refining units, where they must be removed so as not to affect process efficiency nor compromise equipment integrity [60]. When dispersed in the environment in its ionized form (Ba2+), this metal becomes an important impact path for FWET. In the specific case of R1, oil and natural gas extractions result in the accumulated emission of 1.51 g Ba/kg PPG. Cypermethrin is a pyrethroid insecticide that acts through the contact and ingestion routes in biological targets, such as caterpillars (Anticarsia gemmatalis) and the red-banded stink bug (Piezodorus guildinii), that plague soybean crops [61], whose oil transesterification results in the production of glycerin, later used in PPG synthesis. On average, 52 mg cypermethrin per cultivated hectare is released into the soil, equivalent to 245 μg/kg PPG in the case of R1. Along with dichlorophenoxyacetic acid (2,4-D), another widely applied herbicide, cypermethrin is also the main source of R2’s FWET contribution. In this case, soybean crops predisposed the soil losses of these substances, respectively, of 575 mg/kg PPG and 425 μg/kg PPG. Finally, cypermethrin discharges to the soil and barium releases to water comprise about 77% of the FWET impacts in R3. Cypermethrin, again associated with agricultural soy processing, and from there, glycerin production, is disposed of in the environment at a rate of 176 μg/kg PPG. In addition, about 85% of the 10.4 mg Ba/kg PPG liberated by the system in freshwater originates from natural gas refining and the rest, from crude oil processing.
3.1. Carbon Balance
The conceptual framework practiced by the Intergovernmental Panel of Climate Changes (IPCC) in accounting for GHG emissions may lead to inaccuracies in global warming potential estimations associated with PPG processing. This is due to the fact that unlike the premise that supports the concept of carbon neutral to consider biogenic CO2 flows [62], carbon will be immobilized in this active state for long periods of time. Thus, aspects such as potential CO2 fixation from the environment and CO2 status (i.e., product or emission) used as the raw material for obtaining PPG become important, particularly when synthesis occurs from vegetable routes or involving CCU. Von der Assen et al. addressed this topic in studies concerning LCA and CCU [32,45], and in those involving polyol and polyurethane syntheses [5,20]. In the first instance, the authors corroborate the proposal established by Rabl et al. [63], who recommend considering CO2 capture actions (in addition to its emissions) carried out by anthropic systems for the purpose of quantifying their impacts in terms of GWP. From this perspective, CO2 uptake due to photosynthesis or by CCU technologies generate GHG emission credits.
In coupled systems, when CO2 is captured from a gas stream to be reused in another process, it cannot be considered an elementary flow. Thus, Von der Assen et al. suggest applying the concept of system expansion, adopted by consequential LCA for multifunctionality treatment (CO2 becomes a co-product of the unit process in which it is generated). Following this approach, the CO2 generator and user systems must be evaluated together and must, thus, perform the same function. However, as most LCA studies are dedicated to evaluating products (and processes) separately, system expansion is not always a convenient approach. In view of this finding, Von der Assen et al. proposed to resume the attributional approach and perform an allocation to address multifunctional situations.
To justify this procedure, it is necessary that CO2 be configured as a product of the generating system and, therefore, with an associated economic value, and not as a residue. For example, CO2 emissions from a thermoelectric plant have no economic value. On the other hand, if the plant is equipped with CCU technology, the CO2 emanating from the unit will be sufficiently concentrated to serve as an input in another anthropic system, thus becoming a co-product of the thermoelectric power unit. Under this condition, Von der Assen et al. adopted the economic criterion to perform the allocation. Another possibility is to apply exergetic content as an environmental load partitioning criterion. This solution is, however, conditioned to the characteristics of the investigated scenario.
After considering these hypotheses and conceptual requirements, we decided to review the GWP impacts of the three routes taking into account the following premises: (i) biogenic CO2 fixation and emission rates were considered in order to estimate GWP impacts; (ii) the CO2 used in R3 corresponds to the gaseous emission of its generating processes, although its valuation as an input to another process is not enough to make it a co-product of these anthropic activities under the study conditions. Thus, to avoid overlaps and double environmental load counts, this gas was considered an elementary flow in the CO2-based route; and (iii) the CCU unit as part of the PPG synthesis route (R3) in preparing the CO2 flow to be used as a raw material in this arrangement.
A carbon balance considering biogenic CO2 flows is methodologically supported by the ISO 14,067 standard [64]. Hansen et al. and de Léis et al. [65,66] applied the procedure still in the Technical Specification version of the standard (ISO, 2013) to evaluate the GWP associated with polymer synthesis, while Donke et al. [67] followed that guideline in quantifying the impacts of the bioethanol production from sugarcane, corn and sorghum in the same unit. The global warming potential for the PPG synthesis routes considering biogenic CO2 (GWPb) was based on two assumptions: (i) following the same approach practiced by the IPCC, CO2 was defined as the reference substance for this impact category [68] and (ii) the environment was established as a reference for quantifying CO2 flows. Therefore, the impact factors for biogenic CO2 uptake (IFupt) and emissions (IFb) are the same, but with reversed signs (IFupt = (−) 1.0 kg CO2eq/kgCO2,upt and IFb = 1.0 kg CO2eq/kgCO2,b). The fixed and emitted amounts of biogenic CO2 for each route were described in terms of GWP contributions after being multiplied by their respective impact factors (IFupt and IFb). These amounts were then added to the impact totals previously calculated using the IPCC 2013 method. Table 3 describes the GWPb estimates for the R1–R3 routes evaluated herein. The GWPb values for R1 and R3 are equivalent to those obtained without considering the correction provided by biogenic CO2, due to similar CO2upt and CO2,b rates. Particularly, the R3 result is not surprising, since its CO2 uptake potential of only 174 g CO2/kg PPG was restricted to sugarcane photosynthesis, whose biomass supplies the Brazilian electricity matrix.
Table 3.
Global warming potential considering biogenic carbon (GWPb) for routes R1–R3.
On the other hand, considering biogenic CO2 led to a 25% reduction in the total GWP impact from route R2. The gains are due to the carbon sequestration that occurs during sugarcane and soybean cultivation, and also due to photosynthetic action. According to Paula et al. [69], the most explored cultivars in Brazil have an average CO2 uptake rate of 449 g/kg sugarcane in natura. Regarding soybean, this rate was estimated by Rigon et al. [70] as 1.36 kg/kg soybean for plants with moisture content of u = 15%.
3.2. Sensitivity and Uncertainty Analysis
As with other analytical techniques, the environmental estimates made by the LCA approach are subordinate to decisions that practitioners must make during the development of the models that portray the investigated realities. This procedure introduces uncertainties that must be dimensioned, so that the degree of reliability of the diagnoses is known. In the present study, the investigation of uncertainties becomes even more recommended due to the variability of the data sources used to describe each process. Given this circumstance, a sensitivity and uncertainty analysis was applied to this survey.
The sensitivity analysis was used to investigate how the uncertainties associated with the environmental impacts calculated for routes R1 to R3 (model outputs) are influenced by uncertainties intrinsic to the parameter that most contributed to cause those effects in each situation (model inputs). To this end, we opted to apply the one-at-a-time (OAT) method, a simple but highly effective approach in assessments of this type [71]. In the case of R1, the critical parameter corresponded to the mass ratio between the amounts of PO and EO added to the PPG synthesis reactor. According to Langanke et al. [27], this ratio is, on average, 86:11 w/w for most conventional polyether polyol production processes. However, Masy and Babb [72] attest that continuous processes for the production of this class of polymer can operate between extremes ranging from 42:38 w/w to 85:7.0 w/w.
The environmental performance of R2 was greatly influenced by the rate of epoxidized soybean oil (ESO) addition to the process reactor load. According to Haider et al. [41], this participation reaches 79% in processes designed according to COVESTRO technology, or a variant thereof. The same authors warn, however, that the admission of epoxidized oil is conditioned by the number of carbons present in the mixture of vegetable oils used for its formulation. Thus, the COVESTRO process is autonomous and operates without compromising reaction mass specifications, with ESO dosages varying between 68% and 86% of the global reactor supply. Finally, the parameter that most interfered in the impact profile of R3 was the mass ratio between PO and CO2. Von der Assen and Bardow [20] recommend that the ratio be 79:18 w/w, although Reese and Hager [73] argue that it is possible to oscillate the quotient between 80:20 w/w, and a condition of virtual CO2 absence 100:1.0 w/w.
Figure 2 presents the results of the application of the OAT method to the five categories that make up the environmental profile of the investigated processing routes. In the case of R1, impacts generated in terms of PED, GWP, and PhO proved to be quite sensitive to variations in the PO:EO ratio. This was also noted for Ac, but in a less evident way than in the previous situations, especially for low EO dosages in the reactor (<11%), resulting in an unchanged environmental performance. However, the main incompatibilities were observed in relation to epoxide addition for FWET, as the inputs to this category stem mainly from crude oil and raw natural gas extractions, which participate in the life cycles of organic oxides as thermal and electrical utility providers. Thus, FWET impacts are determined by the accumulated energy consumption of each of these production chains, and the PO:EO ratio only indirectly influences aquatic ecotoxicity. As the propylene oxide processing is (significantly) more energy-intensive than that of ethylene oxide, R1 contributions to FWET increase not only when PO participation in PPG synthesis intensifies, but also from the moment when the EO dosage decreases in relation to those of other inputs involved in the process (i.e., glycerin and propylene glycol).
Figure 2.
Behavior of the environmental performances of routes R1 (a–e), R2 (f–j), and R3 (k–o) due to the oscillation of parameters of significant influence on their impact profiles.
For R2, all impact categories reacted sensitively to variations in ESO addition, proving the convergence established in the model between this parameter and the environmental profile of the process. Finally, R3 displayed similar behavior to R2 with regard to the correspondence between the PO:CO2 ratio and the process effects on PED, GWP, Ac and PhO. The exception occurred, again, for FWET, whose contributions are mostly governed by cypermethrin losses to the soil during soybean cultivation. As discussed in Section 4, the effects of this agrochemical are manifested on FWET through glycerin, which reaches its maximum dosage in the PPG synthesis exactly when PO and CO2 are added to the reactor at a 79:18 w/w ratio.
The reliability of the data used in the elaboration of the life cycle inventories for each PPG synthesis route was estimated through a Monte Carlo analysis. In general, Monte Carlo methods consist of numerical approaches based on random sampling and applying probability distribution density functions to process uncertainties and establish confidence intervals for their results [74].
The R1–R3 scenarios presented about 73% of all values containing uncertainty data, with a normal distribution identified in most of these situations. In addition, Monte Carlo simulations were performed for 1000 statistical series in all cases analyzed herein.
Table 4 presents the consumption and emissions whose contributions were greater than 10% of the total impact generated in each PPG processing route for the analyzed categories. Most of the parameters considered for the purpose of modeling the environmental behavior of the R1–R3 routes exhibited homogeneous behavior, with CV < 15%. In the specific case of R1, an exception was noted for the gross calorific value in biomass, which displayed a slight trend towards medium dispersion (CV = 15.9%), and for cypermethrin soil losses (CV = 23.8%). In this situation, however, it must be argued that the impacts caused by this biocidal agent represent 11.6% of the total accumulated freshwater ecotoxicity in R1, much lower than that provided by the release of barium to the water environment (86.0%; CV 5.09%). Concerning R2 and R3, the main heterogeneity indications are also associated with cypermethrin emissions. However, the uncertainty of these situations associated with FWET impacts becomes more significant not only due to the coefficient of variation values (R2: 30.5%; R3: 23.3%), but also because this active principle represents the main impact source for the category (R2: 85.4%; R3: 72.7%).
Table 4.
Results of the Monte Carlo simulation for the environmental models concerning the R1–R3.
Another data dispersion focus related to alternative scenarios is manifested by atmospheric emissions of precursor hydrocarbons from the photochemical oxidation process. In this context, C6H14 losses were noted in R2, contributing to 32.6% of PhO impacts with CV = 21.0%, and C3H6, in R3, whose contribution rate for the same category is even higher (68.3%), with a higher degree of data heterogeneity (CV = 36.1%).
3.3. Development of a Single Performance Indicator
The route that couples CCU practices (R3) surpasses its counterparts (R1 and R2) regarding PPG synthesis (Table 2), even in the context in which biogenic carbon was included in GWP impact determinations (Table 3). However, a broad analysis listing all investigated impact categories could point to important subsidies for proposals that aim to improve the environmental performance of these procedural arrangements. Concerning situations of this nature, the LCA methodology provides for the application of a standardization procedure, in order to obtain a single performance indicator [43].
This strategy has been applied with relative success particularly in environmental performance assessments of anthropic systems that couple transformation processes. Examples include the reports by Guerra et al. [75] concerning the verification of the thermodynamic and environmental behaviors of the expansion of a biomass-operated cogeneration unit and by Sakamoto et al. [54] when investigating alternatives for closing the water circuit of a petrochemical plant using zero liquid discharge practices.
In the specific case of this study, route R1 was considered the reference data processing scenario. Thus, R2 and R3 performances for a certain impact category were divided by the corresponding value obtained by R1, giving rise to an intermediate and dimensionless index. The sum of the indices calculated for the different impact categories results in the single performance indicator for each route. Table 5 describes the intermediate and final values determined by the normalization process.
Table 5.
Development of single performance indicators for PPG production routes R1–R3.
The comparison of the single indicators of the three processes not only ratified the better performance of the route involving CCU over the other processing schemes. In addition, it quantifies the magnitude of this advantage, which corresponds to half the performance achieved by the baseline arrangement, and to 35% of the result accumulated by R2. In addition, when comparing the intermediate indices for R2 with their R1 counterparts, the environmental deficiencies of this alternative in relation to the conventional technology occur as to photochemical oxidation, global warming potential and primary energy demand. This suggests two consecutive actions: (i) the identification of the processes (or stages) of each life cycle that motivated such impacts, and (ii) action proposals based, for example (but not only), on cleaner production and/or industrial ecology concepts, which revert to improving the same performances. If observed within a context of environmental management and from the perspective of continuous improvement, the same logic could be applied to R3 to also improve its performance.
3.4. Identification of Impact Foci and Action Proposals to Improve Environmental Performance
The search for impact foci in R2 and R3 only corroborated the convergence and grouping contribution trends throughout a certain stage of each processing detected during the individual performance analyses for each impact category. For R2, the accumulation converges to the synthesis of epoxidized soybean oil, whose accumulated share in the arrangement’s impact profile ranges between 94%, for Ac, and 99%, for PhO (Figure 3a). In the case of R3, centralization occurs in propylene oxide processing, which accounts for the most PED (92%), GWP (83%), Ac (85%), and PhO (92%) contributions (Figure 3b). The exception is FWET, whose glycerin production accounts for 73% of the impacts for this category, maintaining PO synthesis in the background, with only a 23% share.
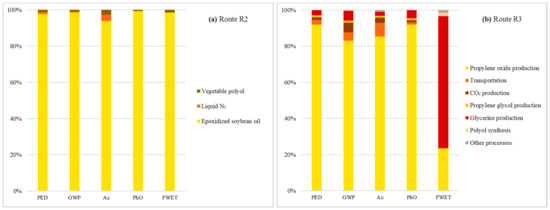
Figure 3.
Cumulative contributions per impact category of R2 (a) and R3 (b) life cycle stages.
A detailed analysis of the epoxidized soybean oil processing cycle indicates that the main contributions to the categories that integrate R2’s environmental impact profile had a common origin, namely the expansion of soybean cultivation areas into primary and secondary forests.
According to Chokkalingam and De Jong [76], primary forests are defined as native tree species without anthropogenic interference, whose ecological processes have not been disturbed. From the same perspective, the authors define secondary forests as the result of regeneration by essentially natural processes of an area subjected to human (or natural) disturbance. The rehabilitation process must have evolved long enough so that the effects of anthropic intervention are no longer evident.
These characteristics justify the intensity of the effects caused by the suppression of natural forests for soy monoculture cultivation on the impacts registered by R2 as the agricultural soy processing modeling was based on CONAB projections for the 2018/2019 period—confirmed later by field measurements—which indicated advancing cultivation over primary forest (60%), secondary forest (4.5%), arable land (30%) and perennial arable land (5.5%) [58].
Therefore, if the environmental variables were among the criteria adopted to drive the expansion process, it might be possible to resize the share of deforestation in native forests in this action and, thus, improve the overall environmental performance of R2.
In order to investigate the validity of this hypothesis, other expansion arrangement options were formulated, whose modeling met the following conditions: (i) cessation of the advance of soybean cultivation over primary forest; (ii) availability of other forms of land use (i.e., secondary forest and arable land) in sufficient quantity to enable the fulfillment of this condition (i); and (iii) maintenance of the global expansion rate of soybean cultivation, estimated at ~ 7.0%, for the 2018/2019 period.
The procedure described above resulted in the formulation of three scenarios: (a) full transfer of the expansion rate from primary forest to secondary forest; (b) weighted distribution of the primary forest quota among the other types of land use; and (c) weighted distribution of the primary forest quota among areas under human intervention (i.e., arable land and perennial arable land). Table 6 describes each of the alternatives for reordering soybean cultivation expansion investigated in this stage of the study.
Table 6.
Alternative scenarios for expanding soy cultivation compared to other types of land use.
Even with the significant participation of glycerin synthesis in FWET impacts, propylene oxide production is characterized as the most significant impact source for the R3 route. An effective proposal to mitigate the impacts associated with this production cycle comprises intensifying the replacement of epoxide by CO2 to the limit that the current technology is capable of providing. According to Haider et al. [41], CO2 content in the formulation of PPG can comprise up to 40% w/w without the resulting polyether polyol presenting stability problems or altered characteristics. Following this guideline, an alternative scenario for the route involving CCU practices (R3A) was also developed in order to verify the effects of this action on the global environmental impact profile of the arrangement. In this context, the mass ratio between PO and CO2, of 79:18 w/w in R3, became 57:40 w/w in R3A.
Table 7 presents the results obtained by the original scenarios (R1–R3) and their respective variants (R2A–R2C and R3A) for all impact categories evaluated in this study. These amounts were described both in terms of absolute performance values and in the form of the single indicator for each arrangement. The estimation of the relativized indices once again considered R1 as the reference scenario.
Table 7.
Environmental performance improvement proposal effects on the alternative PPG synthesis routes.
In global terms, both the proposal to reformulate the advancement rate of soybean cultivation over natural biomes and the rebalancing of the PO:CO2 ratio reached their original objectives by improving the environmental performances of scenarios R2 and R3, respectively. In the specific case of R2, the obstruction of the installation of soybean crops in primary forest areas (R2A) resulted in impact gains of 15% for GWP and 2.4% for FWET. However, the main benefits of the remodeling were noted when the fraction of monoculture advancement over primary forest was redistributed among the other possible types of land use, particularly as secondary forest deforestation is also very reduced (R2B: 11.7%; R2C: 4.5%). In these cases, GWP impacts decreased by 53% for R2B, and 58% for R2C in relation to R2. The same was observed for PhO contributions, whose decreases comprised 52% (R2B→R2) and 56% (R2C→R2), respectively. Such behaviors reinforce the hypothesis that human interventions in balanced biomes not only emit GHG and Ac and PhO precursors due to biomass burning for land cleaning, but also consume the primary energy intrinsic to those species, stored in the form of non-renewable biomass, in addition to contaminating soil and water bodies.
The increased addition of CO2 in the synthesis of PPG replacing propylene oxide also led to environmental advantages, particularly in terms of PhO (24%), PED (22%) and Ac (20%). As discussed in Section 4, the fact that CO2 is treated as an elementary flow in this analysis reduces its environmental life cycle loads to those generated during the treatment it receives prior to being incorporated into the polymer processing chain. Such consumption and emissions are significantly lower than those involved in the PO production chain.
The comparisons of the single indicator values for each scenario confirm, in collective terms, the effectiveness of the proposed measures. Actions taken in R2 not only improved its collective environmental performance compared to the initial assessment, but made it more environmentally sustainable than R1, in versions R2B and R2C, and even potentially competitive compared to R3, in the specific case of R2C, if considering the variations and uncertainties that affect the data considered in the modeling.
In a complementary assessment, this study sought to identify the effects of changing the CO2 source on the global environmental behavior of PPG production. In this analysis, the CCU system performance that extracts CO2 with an MEA solution was compared with that of CO2 provided by a non-diluted gas stream, as in hydrogen synthesis. The modeling of this CO2-based alternative route (R3B) considered the following assumptions: (i) CO2 was generated as a waste gas from the synthesis of H2 and, in such conditions, was (also) considered as an elementary flow in the R3B scheme; (ii) the gas flow was fully constituted by CO2 (~99% v/v) avoiding the installation of a gas purification step prior to its use; and (iii) the H2 production unit is located close enough to the PPG processing plant to eliminate gas compression. All other process conditions remained unchanged concerning the original CO2-based route (R3). The GWP and PED performances of R3A were measured and compared to those obtained for both R1 and R3. Table 8 depicts these results.
Table 8.
PED and GWP performance obtained by R1, R3, and R3B.
A comparison between the environmental results for R3 and R3B also suggests that the option for a source of concentrated CO2 generation, located in the vicinity of the PPG synthesis unit would be justified only for the reduction of GWP impacts as R3B presents impacts 4.9% lower than R3 for this category. The benefits of this action for PED, Ac and PhO were even lower (2.0%, 2.7% and 1.0%, respectively) and virtually nonexistent with regard to FWET. Even so, and as expected, the environmental loads associated with the CO2 supply to produce PPG are much lower than those generated due to the production of EO for all impact categories. This scenario could change if CO2 was a product of the system in which it is generated and, thus, displaying some economic value. Due to its status of co-product, the flow would be subject to treatment by allocation, as suggested by Van der Assen et al. [77], and thus, R3 and R3B contributions to all the investigated effects would inevitably increase.
Finally, from an essentially environmental perspective, the conventional route for PPG synthesis should be replaced by an arrangement in which the total amount of CO2 incorporated into the process via CCU would be the maximum possible.
4. Conclusions
This study verified the environmental effectiveness of impact reduction actions applied to alternative (and potentially less aggressive) routes compared to the conventional polyether polyol production process. The analysis carried out for the synthesis of poly(propylene/ethylene oxide) glycol (PPG) copolymer was developed in two stages. In the first, the environmental behavior of the conventional PPG processing route (R1) was compared to that of its variants (R2: vegetable polyol; R3: CO2-based) from the application of the LCA technique to the primary energy demand (PED), global warming potential (GWP), acidification (Ac), photochemical oxidation (PhO), and freshwater ecotoxicity (FWET) impact categories.
The findings proved that the use of CO2 recovered from other processes through CCU practices can result in significant environmental gains for PPG production, as R3 ranged between 18% (for PhO) and 88% (FWET)—less impacting than R1. Despite the positive results, the environmental burden associated with the manufacture of propylene oxide (PO) indicated the main impact of the CO2-based route. In addition, contrary to expectations, obtaining PPG from epoxidized soybean oil, a renewable asset, was not an attractive option, especially in terms of GWP and PhO, as their performance was worse than R1 by 144% and 160%, respectively. This difference persisted even when global warming potential impact estimates were revised taking into account biogenic CO2 flows, with R2 still lower than R1 at 86%. This was due to primary and secondary forest deforestation for the expansion of soybean cultivation areas in Brazil.
In the second stage of the study, proposals were applied to mitigate the main impacts of the vegetable and CO2-based routes. In the case of R2, three schemes for expanding soybean cultivation areas were proposed, while an increase in the replacement of CO2 by PO up to the feasible technical limit was proposed for R3. Such measures caused R2 to surpass the conventional route in all analyzed impact categories, regardless of the suggested crop expansion alternative. This result reinforces the importance of the holistic approach, expressed in this study by the cradle-to-gate approach for measuring the environmental impacts of anthropogenic processes provided by the LCA technique. Herein, this approach allows a comprehensive and integral measurement of all environmental loads entering and leaving the analyzed system. Lastly, the study investigated the effects of CCU practices on the overall performance of R3. To this end, the use of a CO2 stream from a hydrogen plant was tested in the PPG synthesis reactor. The results indicate only superficial gains, suggesting that the CO2-based route can be operated without environmental compromises, even at low source flow CO2 concentrations.
The study achieved its original purpose of providing elements for both the selection and specification of PPG processing routes and the support of any decision-making processes that may occur in this productive segment, or in others with which it interacts. However, further research in this area is required to accelerate the transition for a large-scale cleaner production of PPG. This study has shown a technically feasible and environmentally more viable arrangement for PPG processing. Further research should include a multi-criteria optimization, taking into account economic criteria, environmental criteria with a single indicator as presented for this research, and technical optimization, choosing performance indicators that allow technical performance improvements, seeking a balance between these three dimensions.
Author Contributions
Conceptualization, L.K.; methodology, L.K. and K.C.; resources, L.K and R.M.B.A.; data curation, L.K. and K.C.; writing—original draft preparation, L.K. and K.C.; writing—review and editing, L.K. and R.M.B.A.; supervision, L.K. and R.M.B.A. All authors have read and agreed to the published version of the manuscript.
Funding
This research was partially funded by the FAPESP-São Paulo Research Foundation (2014/50279-4) and Shell Brazil and by the Coordenação de Aperfeiçoamento de Pessoal de Nível Superior-Brazil (CAPES)—Finance Code 001.
Institutional Review Board Statement
Not applicable.
Informed Consent Statement
Not applicable.
Data Availability Statement
Not applicable.
Acknowledgments
We gratefully acknowledge the support of the RCGI-Research Centre for Gas Innovation, hosted by the University of São Paulo (USP) and sponsored by the FAPESP-São Paulo Research Foundation (2014/50279-4) and Shell Brazil. We also express our thanks to Coordenação de Aperfeiçoamento de Pessoal de Nível Superior-Brazil (CAPES)—Finance Code 001. The support of both funding agencies was essential for this study to be brought to a conclusion.
Conflicts of Interest
The authors declare no conflict of interest.
References
- Petrovic, Z.S. Polyurethanes from vegetable oils. Polym. Rev. 2008, 48, 109–155. [Google Scholar] [CrossRef]
- Fink, J.K. Chapter 2—Poly(urethane)s. In Reactive Polymers Fundamentals and Applications, 2nd ed.; William Andrew: New York, NY, USA, 2013; ISBN 9781455731497. [Google Scholar]
- EMR—Expert Market Research. Global Polyols Market Report and Forecast 2021–2026. Available online: https://www.expertmarketresearch.com/pressrelease/polyols-market (accessed on 7 June 2021).
- Sternberg, A.; Jens, C.M.; Bardow, A. Life cycle assessment of CO2-based C1-chemicals. Green Chem. 2017, 19, 2244–2259. [Google Scholar] [CrossRef]
- Von Der Assen, N.; Sternberg, A.; Kätelhön, A.; Bardow, A. Environmental potential of carbon dioxide utilization in the polyurethane supply chain. Faraday Discuss. 2015, 183, 291–307. [Google Scholar] [CrossRef] [PubMed]
- Furtwengler, P.; Avérous, L. Renewable polyols for advanced polyurethane foams from diverse biomass resources. Polym. Chem. 2018, 9, 4258–4287. [Google Scholar] [CrossRef]
- Hejna, A.; Kirpluks, M.; Kosmela, P.; Cabulis, U.; Haponiuk, J.; Piszczyk, Ł. The influence of crude glycerol and castor oil-based polyol on the structure and performance of rigid polyurethane-polyisocyanurate foams. Ind. Crops Prod. 2017, 95, 113–125. [Google Scholar] [CrossRef]
- Oliviero, M.; Verdolotti, L.; Stanzione, M.; Lavorgna, M.; Iannace, S.; Tarello, M.; Sorrentino, A. Bio-based flexible polyurethane foams derived from succinic polyol: Mechanical and acoustic performances. J. Appl. Polym. Sci. 2017, 134, 1–12. [Google Scholar] [CrossRef]
- Stanzione, M.; Russo, V.; Oliviero, M.; Verdolotti, L.; Sorrentino, A.; Di Serio, M.; Tesser, R.; Iannace, S.; Lavorgna, M. Synthesis and characterization of sustainable polyurethane foams based on polyhydroxyls with different terminal groups. Polymer 2018, 149, 134–145. [Google Scholar] [CrossRef]
- Tajau, R.; Rohani, R.; Wan Isahak, W.N.R.; Salleh, M.Z.; Ghazali, Z. Development of new bio-based polyol ester from palm oil for potential polymeric drug carrier. Adv. Polym. Technol. 2018, 37, 3552–3560. [Google Scholar] [CrossRef]
- Gandara, M.; Mulinari, D.R.; Monticeli, F.M.; Capri, M.R. Sugarcane Bagasse Fibers Reinforced in Polyurethane for Sorption of Vegetal Oil. J. Nat. Fibers 2020, 1–12. [Google Scholar] [CrossRef]
- Lei, W.; Fang, C.; Zhou, X.; Li, Y.; Pu, M. Polyurethane elastomer composites reinforced with waste natural cellulosic fibers from office paper in thermal properties. Carbohydr. Polym. 2018, 197, 385–394. [Google Scholar] [CrossRef]
- Ji, D.; Fang, Z.; He, W.; Zhang, K.; Luo, Z.; Wang, T.; Guo, K. Synthesis of soy-polyols using a continuous microflow system and preparation of soy-based polyurethane rigid foams. ACS Sustain. Chem. Eng. 2015, 3, 1197–1204. [Google Scholar] [CrossRef]
- Prociak, A.; Szczepkowski, L.; Ryszkowska, J.; Kurańska, M.; Auguścik, M.; Malewska, E.; Gloc, M.; Michałowski, S. Influence of Chemical Structure of Petrochemical Polyol on Properties of Bio-polyurethane Foams. J. Polym. Environ. 2019, 27, 2360–2368. [Google Scholar] [CrossRef]
- Olszewski, A.; Kosmela, P.; Mielewczyk-Gryń, A.; Piszczyk, Ł. Bio-based polyurethane composites and hybrid composites containing a new type of bio-polyol and addition of natural and synthetic fibers. Materials 2020, 13, 2028. [Google Scholar] [CrossRef]
- Bruhn, T.; Naims, H.; Olfe-Kräutlein, B. Separating the debate on CO2 utilisation from carbon capture and storage. Environ. Sci. Policy 2016. [Google Scholar] [CrossRef]
- Meys, R.; Kätelhön, A.; Bardow, A. Towards sustainable elastomers from CO2: Life cycle assessment of carbon capture and utilization for rubbers. Green Chem. 2019, 21, 3334–3342. [Google Scholar] [CrossRef]
- Aresta, M.; Dibenedetto, A.; Angelini, A. The changing paradigm in CO2 utilization. J. CO2 Util. 2013, 65–73. [Google Scholar] [CrossRef]
- Cuéllar-Franca, R.M.; Azapagic, A. Carbon capture, storage and utilisation technologies: A critical analysis and comparison of their life cycle environmental impacts. J. CO2 Util. 2015, 9, 82–102. [Google Scholar] [CrossRef]
- Von Der Assen, N.; Bardow, A. Life cycle assessment of polyols for polyurethane production using CO2 as feedstock: Insights from an industrial case study. Green Chem. 2014, 16, 3272–3280. [Google Scholar] [CrossRef]
- Baena-Moreno, F.M.; Rodríguez-Galán, M.; Vega, F.; Alonso-Fariñas, B.; Vilches Arenas, L.F.; Navarrete, B. Carbon capture and utilization technologies: A literature review and recent advances. Energy Sources Part A Recover. Util. Environ. Eff. 2019, 41, 1403–1433. [Google Scholar] [CrossRef]
- Zimmermann, A.; Müller, L.; Wang, Y.; Langhorst, T.; Wunderlich, J.; Marxen, A.; Armstrong, K.; Buchner, G.; Kätelhön, A.; Bachmann, M.; et al. Techno-Economic Assessment & Life Cycle Assessment Guidelines for CO2 Utilization (Version 1.1); Technische Universität Berlin: Berlin, Germany, 2020. [Google Scholar] [CrossRef]
- Ionescu, M. Chemistry and Technology of Polyols for Polyurethanes, 2nd ed.; Simthers RAPRA: Shropshire, UK, 2016; Volume 2, ISBN 9781910242988. [Google Scholar]
- Król, P. Synthesis methods, chemical structures and phase structures of linear polyurethanes. Properties and applications of linear polyurethanes in polyurethane elastomers, copolymers and ionomers. Prog. Mater. Sci. 2007, 52, 915–1015. [Google Scholar] [CrossRef]
- Wegener, G.; Brandt, M.; Duda, L.; Hofmann, J.; Klesczewski, B.; Koch, D.; Kumpf, R.J.; Orzesek, H.; Pirkl, H.G.; Six, C.; et al. Trends in industrial catalysis in the polyurethane industry. Appl. Catal. A Gen. 2001, 221, 303–335. [Google Scholar] [CrossRef]
- Herzberger, J.; Niederer, K.; Pohlit, H.; Seiwert, J.; Worm, M.; Wurm, F.R.; Frey, H. Polymerization of ethylene oxide, propylene oxide, and other alkylene oxides: Synthesis, novel polymer architectures, and bioconjugation. Chem. Rev. 2016, 116, 2170–2243. [Google Scholar] [CrossRef]
- Langanke, J.; Wolf, A.; Hofmann, J.; Müller, K.; Subhani, M.A.; Müller, T.E.; Leitner, W.; Gürtler, C. Carbon dioxide as sustainable feedstock for polyurethane production. Green Chem. 2013, 3, 10715–10722. [Google Scholar] [CrossRef]
- Cheng, M.H.; Rosentrater, K.A. Profitability analysis of soybean oil processes. Bioengineering 2017, 4, 83. [Google Scholar] [CrossRef]
- Mahlum, L. Process for Preparing Blown Vegetal Oil. U.S. Patent 6,759,542 B2, 6 July 2004. [Google Scholar]
- Abraham, T.; Carter, J.; Dounis, D.M. Polyurethane Foams Comprising Oligomeric Polyols. WO Patent 2006/116456 A1, 2 November 2006. [Google Scholar]
- Fernández-Dacosta, C.; Van Der Spek, M.; Hung, C.R.; Oregionni, G.D.; Skagestad, R.; Parihar, P.; Gokak, D.T.; Strømman, A.H.; Ramirez, A. Prospective techno-economic and environmental assessment of carbon capture at a refinery and CO2 utilisation in polyol synthesis. J. CO2 Util. 2017, 21, 405–422. [Google Scholar] [CrossRef]
- Von Der Assen, N.; Müller, L.J.; Steingrube, A.; Voll, P.; Bardow, A. Selecting CO2 Sources for CO2 Utilization by Environmental-Merit-Order Curves. Environ. Sci. Technol. 2016, 50, 1093–1101. [Google Scholar] [CrossRef]
- Pazos, J.F. Preparation of Double Metal Cyanide-Catalyzed Polyols by Continuous Addition of Starter. U.S. Patent 5777177, 7 July 1998. [Google Scholar]
- Resse, J.R.; Hager, S.L. Process for the Production of Polyol Blends. WO Patent 2003000770A1, 3 January 2003. [Google Scholar]
- Le-Khac, B. Double Metal Cyanide Complex Catalysts. U.S. Patent 5470813, 28 November 1995. [Google Scholar]
- Kuyper, J.; Van Schaik-Struykenkamp, P. Process for the Polymerization of Epoxdes. U.S. Patent 4472560A, 18 September 1984. [Google Scholar]
- Desroches, M.; Escouvois, M.; Auvergne, R.; Caillol, S.; Boutevin, B. From vegetable oils to polyurethanes: Synthetic routes to polyols and main industrial products. Polym. Rev. 2012, 52, 38–79. [Google Scholar] [CrossRef]
- Błażek, K.; Datta, J.; Cichoracka, A. Sustainable synthesis of cyclic carbonates from bio-based polyether polyol: The structure characterization, rheological behaviour and thermal properties. Polym. Int. 2019, 68, 1968–1979. [Google Scholar] [CrossRef]
- Stirna, U.; Fridrihsone, A.; Lazdiņa, B.; Misāne, M.; Vilsone, D. Biobased Polyurethanes from Rapeseed Oil Polyols: Structure, Mechanical and Thermal Properties. J. Polym. Environ. 2013, 21, 952–962. [Google Scholar] [CrossRef]
- Fridrihsone, A.; Romagnoli, F.; Kirsanovs, V.; Cabulis, U. Life Cycle Assessment of vegetable oil based polyols for polyurethane production. J. Clean. Prod. 2020, 266, 121403. [Google Scholar] [CrossRef]
- Haider, K.W.; Mcdaniel, K.G.; Hayes, J.E.D.; Shen, J. Polioles de Poliéter Carbonato Fabricados a Través de Catálisis de Cianuro de Metal Doble (CMD). ES Patent 2727400T3, 16 October 2019. [Google Scholar]
- Franklin Associates. Cradle-To-Gate Life Cycle Inventory of Nine Plastic Resins; American Chemistry Council: Prairie Village, KS, USA, 2011. [Google Scholar]
- ISO. ISO 14044:2006 Environmental Management e Life Cycle Assessment e Requirements and Guidelines; International Organization for Standardization: Geneva, Switzerland, 2006. [Google Scholar] [CrossRef]
- Curran, M.A. Life Cycle Assessment Handbook; Wiley: Hoboken, NJ, USA, 2012; ISBN 9781118099728. [Google Scholar]
- von der Assen, N.; Jung, J.; Bardow, A. Life-cycle assessment of carbon dioxide capture and utilization: Avoiding the pitfalls. Energy Environ. Sci. 2013, 6, 2721. [Google Scholar] [CrossRef]
- Huijbregts, M.A.J. Life-Cycle Impact Assessment of Acidifying and Eutrophying Air Pollutants. Calculation of Equivalency Factors with RAINS-LCA; University of Amsterdam: Amsterdam, The Netherlands, 1999. [Google Scholar]
- Derwent, R.G.; Jenkin, M.E.; Saunders, S.M.; Pilling, M.J. Photochemical ozone creation potentials for organic compounds in northwest Europe calculated with a master chemical mechanism. Atmos. Environ. 1998, 32, 2429–2441. [Google Scholar] [CrossRef]
- Jenkin, M.E.; Hayman, G.D. Photochemical ozone creation potentials for oxygenated volatile organic compounds: Sensitivity to variations in kinetic and mechanistic parameters. Atmos. Environ. 1999, 33, 1275–1293. [Google Scholar] [CrossRef]
- Van Zelm, R.; Huijbregts, M.A.J.; Van De Meent, D. USES-LCA 2.0-a global nested multi-media fate, exposure, and effects model. Int. J. Life Cycle Assess. 2009, 14, 282–284. [Google Scholar] [CrossRef]
- Weidema, B.P.; Bauer, C.; Hischier, R.; Mutel, C.; Nemecek, T.; Reinhard, J.; Vadenbo, C.O.; Wenet, G. Data quality guideline for the ecoinvent database version 3. Ecoinvent Report 1 (v3). Swiss Cent. Life Cycle Invent. 2013, 3, 169. [Google Scholar]
- Althaus, H.-J.; Chudacoff, M.; Hellweg, S. Life Cycle Inventories of Chemicals; Swiss Centre for Life Cycle Inventories: Dübendorf, Switzerland, 2007. [Google Scholar]
- Frischknecht, R.; Editors, N.J.; Althaus, H.-J.; Bauer, C.; Doka, G.; Dones, R.; Hischier, R.; Hellweg, S.; Köllner, T.; Loerincik, Y.; et al. Implementation of Life Cycle Impact Assessment Methods; Swiss Centre for Life Cycle Inventories: Dübendorf, Switzerland, 2007; pp. 1–151. [Google Scholar]
- Dones, R.; Bauer, C.; Bolliger, R.; Burger, B.; Heck, T.; Röder, A.; Institut, P.S.; Emmenegger, M.F.; Frischknecht, R.; Jungbluth, N.; et al. Life Cycle Inventories of Energy Systems: Results for Current Systems in Switzerland and Other UCTE Countries; Ecoinvent report No. 5. Paul Scherrer Institut Villigen; Swiss Centre for Life Cycle Inventories: Dübendorf, Switzerland, 2007. [Google Scholar]
- Sakamoto, H.; Maciel, M.; Henrique Cardoso, F.; Kulay, L. Energy and Environmental Contributions for Future Natural Gas Supply Planning in Brazil. Energy Technol. 2019, 1900976. [Google Scholar] [CrossRef]
- EPE—Empresa de Pesquisa Energética. Balanço Energético Nacional 2017; Empresa de Pesquisas Energéticas: Brasília, Brasil, 2018. [Google Scholar]
- Frischknecht, R.; Jungbluth, N.; Althaus, H.; Doka, G.; Dones, R.; Heck, T.; Hellweg, S.; Hischier, R.; Nemecek, T.; Rebitzer, G.; et al. Overview and Methodology; The Ecoinvent Centre: St. Gallen, Switzerland, 2007; pp. 1–77. [Google Scholar]
- Chen, Q.; Lv, M.; Tang, Z.; Wang, H.; Wei, W.; Sun, Y. Opportunities of integrated systems with CO2 utilization technologies for green fuel & chemicals production in a carbon-constrained society. J. CO2 Util. 2016, 14. [Google Scholar] [CrossRef]
- CONAB. Perspectivas Para a Agropecuária. Vol. 6—Safra 2018/2019; Companhia Nacional de Abastecimento—Conab: Brasília, Brazil, 2017; Volume 6.
- Angelo, C.; Rittl, C. Análise das Emissões Brasileiras de Gases de Efeito Estufa e suas Implicações Para as Metas do Brasil; Observatório do Clima: São Paulo, Brasil, 2019. [Google Scholar]
- Abib, G.A.P.; Da cruz, G.F.; Vaz Junior, A.S.L. Study of barium sulfate dissolution by scale dissolver based on solutions of dtpa. An. Acad. Bras. Cienc. 2018, 90, 3185–3196. [Google Scholar] [CrossRef]
- Grigolli, J.F.J. Pragas da Soja e Controles. In Tecnol. Produção Soja—Safra 2017/2018; Fundação MS: Maracaju, Brasil, 2018; p. 209. [Google Scholar]
- IPCC. Climate Change 2013: The Physical Science Basis; World Meteorological Organization: Geneva, Switzerland, 2013. [Google Scholar]
- Rabl, A.; Benoist, A.; Dron, D.; Peuportier, B.; Spadaro, J.V.; Zoughaib, A.; Mines, E. Comment prendre en compte les émissions de CO2 issues de la biomasse dans. ACV Rabl 2007, 12, 86899. [Google Scholar]
- ISO 14067. Greenhouse Gases—Carbon Footprint of Products—Requirements and Guidelines for Quantification; ISO—International Organization for Standardization: Geneva, Switzerland, 2018. [Google Scholar]
- Hansen, A.P.; da Silva, G.A.; Kulay, L. Evaluation of the environmental performance of alternatives for polystyrene production in Brazil. Sci. Total Environ. 2015, 532, 655–668. [Google Scholar] [CrossRef]
- de Léis, C.M.; Nogueira, A.R.; Kulay, L.; Tadini, C.C. Environmental and energy analysis of biopolymer film based on cassava starch in Brazil. J. Clean. Prod. 2017, 143, 76–89. [Google Scholar] [CrossRef]
- Donke, A.; Nogueira, A.; Matai, P.; Kulay, L. Environmental and energy performance of ethanol production from the integration of sugarcane, corn, and grain sorghum in a multipurpose plant. Resources 2017, 6, 1. [Google Scholar] [CrossRef]
- Artaxo, P.; Berntsen, T.; Betts, R.; Fahey, D.W.; Haywood, J.; Lean, J.; Lowe, D.C.; Myhre, G.; Nganga, J.; Prinn, R.; et al. Changes in Atmospheric Constituents and in Radiative Forcing. In AR4 Climate Change 2007: The Physical Science Basis; World Meteorological Organization: Geneva, Switzerland, 2014. [Google Scholar]
- de Paula, M.; Pereira, F.A.R.; Arias, E.R.A.; Scheeren, B.R.; de Souza, C.C.; Mata, D.S. Da Fixação de carbono e a emissão dos gases de efeito estufa na exploração da cana-de-açúcar. Ciência Agrotecnologia 2010, 34, 633–640. [Google Scholar] [CrossRef]
- Rigon Gonsiorkiewicz, J.P.; Calonego, J.C.; Rosolem, C.A.; La Scala, N., Jr. Cover crop rotations in no-till system: Short-term CO2 emissions and soybean yield. Sci. Agric. 2018, 75, 18–26. [Google Scholar] [CrossRef]
- Saltelli, A.; Tarantola, S.; Campolongo, F.; Ratto, M. Sensitivity Analysis in Practice a Guide to Assessing Scientific Models; Wiley: Ispra, Italy, 2004; ISBN 0470870931. [Google Scholar]
- Masy, J.; Babb, D.A. Processo Contínuo Para Produzir Polióis Poliéter. BR Patent 112020005001-6 A2; Instituto Nacional da Propriedade Industrial INPI: Brasília, Brasil, 2020.
- Reese, J.R.; Hager, S.L. Process for Production of Polyol Blends. CA Patent 2450785, 3 January 2003. [Google Scholar]
- Barbu, A.; Song-Chun, Z. Monte Carlo Methods; Springer: Singapore, 2015; ISBN 9789811329708. [Google Scholar]
- Guerra, J.P.; Cardoso, F.H.; Nogueira, A.; Kulay, L. Thermodynamic and environmental analysis of scaling up cogeneration units driven by sugarcane biomass to enhance power exports. Energies 2018, 11, 73. [Google Scholar] [CrossRef]
- Chokkalingam, U.; De Jong, W. Secondary forest: A working definition and typology. Int. For. Rev. 2001, 3, 19–26. [Google Scholar]
- Von Der Assen, N.; Voll, P.; Peters, M.; Bardow, A. Life cycle assessment of CO2 capture and utilization: A tutorial review. Chem. Soc. Rev. 2014, 43, 7982–7994. [Google Scholar] [CrossRef]


Publisher’s Note: MDPI stays neutral with regard to jurisdictional claims in published maps and institutional affiliations. |
© 2021 by the authors. Licensee MDPI, Basel, Switzerland. This article is an open access article distributed under the terms and conditions of the Creative Commons Attribution (CC BY) license (https://creativecommons.org/licenses/by/4.0/).