Article

Research on Prediction Accuracy of Coal Mine Gas Emission Based on Grey Prediction Model

1
Scientific Research Office, Shandong Vocational and Technical University of International Studies, Rizhao 276826, China
2
College of Mining and Safety Engineering, Shandong University of Science and Technology, Qingdao 266590, China
*
Author to whom correspondence should be addressed.
Processes 2021, 9(7), 1147; https://doi.org/10.3390/pr9071147
Submission received: 7 June 2021 / Revised: 26 June 2021 / Accepted: 29 June 2021 / Published: 30 June 2021
(This article belongs to the Special Issue Characterization of Emissions from Fuel Combustion)

Abstract

:
In order to achieve the accuracy of gas emission prediction for different workplaces in coal mines, three coal mining workings and four intake and return air roadway of working face in Nantun coal mine were selected for the study. A prediction model of gas emission volume based on the grey prediction model GM (1,1) was established. By comparing the predicted and actual values of gas emission rate at different working face locations, the prediction error of the gray prediction model was calculated, and the applicability and accuracy of the gray prediction method in the prediction of gas gushing out from working faces in coal mines were determined. The results show that the maximum error between the predicted and actual measured values of the gray model is 2.41%, and the minimum value is only 0.07%. There is no significant prediction error over a larger time scale; the overall prediction accuracy is high. It achieves the purpose of accurately predicting the amount of gas gushing from the working face within a short period of time. Consequently, the grey prediction model is of great significance in ensuring the safety production of coal mine working face and promote the safety management of coal mine.

Graphical Abstract

1. Introduction

Coal mine safety production management is an important research content related to the stable development of energy in China. However, gas disaster is one of the important factors that seriously threatens coal mine safety production [1,2,3,4,5]. Gas explosions, gas outbursts and local gas concentration overrun can cause huge property losses and casualties [6,7,8,9]. In underground coal mining face and working face, the monitoring and prediction of gas is the focus of coal mine safety management [10,11,12]. Safety monitoring is relatively simple, and the gas concentration is mainly monitored by arranging monitoring probes at the working face. Gas prediction can be applied to understand the development trends of gas concentration in advance, so as to formulate a scientific response plan and win valuable time for gas disaster control [13,14,15]. Therefore, finding a model or method that can accurately predict the amount of coal mine gas emissions is key to the prevention and control of gas disasters [16], and scholars have also conducted extensive and in-depth research on it.
In emission prediction methods, the commonly used prediction methods mainly include the neural network analysis method [17,18,19,20], data fusion theory [21,22,23], and multiple regression method [24,25]. Dong et al. [24] thought that the application of Gaussian process regression to gas emission time series analysis is a feasible and effective gas emission prediction method, which has high practical application value. Wu et al. [26] combined the BP neural network (BPNN) algorithm and adaptive learning rate to establish an improved GASA-BP prediction model, which can accurately and quickly predict coal and gas outbursts. By analyzing the effective stress, temperature and gas pressure of coal, Yin et al. [27] constructed a BP neural network of gas concentration, and established a gas prediction model based on a large number of sample data, with a maximum prediction error of 4.298%. Tian et al. [28] studied the self-developed continuous flow method to predict the gas flow in the system, measured the gas emission and drilling depth data, and verified the accuracy of the prediction method. Gao et al. [29] used the genetic projection pursuit method for reference to predict gas emissions, and its prediction accuracy was higher than that of BP neural network method. Xiao et al. [30] revealed the sample set formed by monitoring the historical data of a low gas mine, and established a prediction model combining the kernel principal component analysis (KPCA) and BP neural network, which can realize the rapid and accurate prediction of gas emission. Li et al. [31] evaluated the complex nonlinear characteristics of gas emissions, and proposed a gas emission prediction method based on self-organizing data mining. Thus, it can be seen that gas content prediction is fundamentally based on existing data, and a prediction model is established to predict the gas emissions of the working face in the future.
Deng [32] put forward the grey system theory in 1982. It is a prediction model between a system with all known information and a system without a data source. It solves the problem of establishing a mathematical model under the condition of little basic information and incomplete data collection. The grey theory model can summarize and integrate the limited data, generate a group of regular and effective series, summarize the data development law through data processing and other means, so as to realize the prediction function of the data in the future. At present, it has been applied in a variety of industries [33,34,35]. According to the basic meaning of grey system theory, grey model (GM) is the basic model of the system theory [36,37,38,39]. Based on the GM, the prediction of gas emission was studied. Wu et al. [40] pointed out that GM not only has a small amount of data, but also a high prediction accuracy, which is helpful to evaluate the gas drainage effect and guide gas drainage works. Wang et al. [41] established the Gray–Markov prediction model to predict mine gas emissions based on GM (1, 1). Yuan et al. [42] proposed the grey GM (1,1) gas emission prediction model, which realized the real-time, dynamic and nonlinear prediction of gas emission. Jing et al. [25] used the grey GM (1,1) and linear regression to predict methane emissions, and showed that the former has higher accuracy. Xu et al. [43] proposed using an adaptive GM (1,1) to study traffic pollution emissions in China. To sum up, the grey prediction method needs less sample data and has no typical distribution, so it has been widely used in the prediction of gas emission. In the actual process of coal mining, there are more or less gas emissions in many locations, but when using gray theory to predict the amount of gas emission, the selected location of gas emission is relatively single. This ignores the gray prediction of gas emission in other locations. Therefore, it is necessary to more comprehensively predict the gas emissions of different working face positions in coal mines.
This paper established the grey prediction model of gas emissions at different working faces in a coal mine. By comparing the predicted value and actual value of gas emission in different working face positions, the applicability of the grey prediction method in the coal mine working face was judged, its accuracy was analyzed, and the prediction error of the grey prediction model was calculated. The research content hopes to provide some reference for the prevention and control of coal mine gas disasters.

2. Brief Introduction of Grey Prediction Method

2.1. Characteristics of Grey Prediction Theory

(1) Quantitative data: The main task of grey prediction model is to sort out and analyze the uncertain quantity through the existing data, so as to make it quantitative [32]. It can solve the problems of difficult data sample collection, small data sample collection, and difficult data trend prediction in actual production.
(2) Forecast the trend of data changes in a certain period of time: The commonly used grey prediction models are mainly divided into sequence prediction, catastrophe and outlier prediction, seasonal catastrophe and outlier prediction, topology prediction and system prediction. These five kinds of prediction are related to time, and the main feature is to build a grey prediction model by observing the development trend of sample series in a certain time interval. According to this model, a relationship function between indicators and time is constructed to find the theoretical indicator value at a predetermined time in the future or the theoretical time of appearance of the predetermined indicator value [41,44].
(3) High prediction accuracy for short-term data: For large amounts of data, linear fitting or nonlinear fitting is often used. According to the clear law, the development trend can be predicted. In daily application, there are often a few samples. At this time, using different fitting methods, there will be different prediction indexes, and even the difference of sequence level. At this time, the grey prediction model can predict the data development trend in a short time with high prediction accuracy by a limited data set.

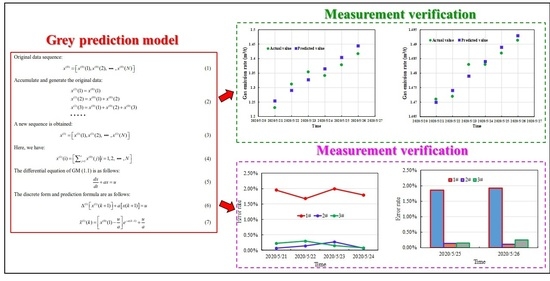
2.2. Calculation Process of Grey Prediction Model

When there is a small number of sample data, the surface rules may not be related to each other, so it is difficult to summarize the internal rules directly from the original data. Therefore, it is necessary to generate the original data to find the internal rules. The commonly used generation methods of grey system are accumulation generation, subtraction generation, average generation, grade generation and so on [25,39]. Among them, cumulative generation is the most widely used in grey system, and this grey model selects cumulative generation for numerical processing [20,42].
The original data sequence:
x ( 0 ) = [ x ( 0 ) ( 1 ) , x ( 0 ) ( 2 ) ,   · · ·   , x ( 0 ) ( N ) ]
Accumulate and generate the original data:
x ( 1 ) ( 1 ) = x ( 0 ) ( 1 ) x ( 1 ) ( 2 ) = x ( 0 ) ( 1 ) + x ( 0 ) ( 2 ) x ( 1 ) ( 3 ) = x ( 0 ) ( 1 ) + x ( 0 ) ( 2 ) + x ( 0 ) ( 3 ) ·   ·   ·   ·   ·
A new sequence is obtained:
x ( 1 ) = [ x ( 1 ) ( 1 ) , x ( 1 ) ( 2 ) ,   · · ·   , x ( 1 ) ( N ) ]
Here, we have:
x ( 1 ) ( i ) = [ j = 1 i x ( 0 ) ( j ) | i = 1 , 2 ,   · · ·   , N ]
The differential equation of GM (1, 1) is as follows:
d x d t + a x = u
The discrete form and prediction formula are as follows:
Δ ( 1 ) [ x ( 1 ) ( k + 1 ) ] + a [ x ( k + 1 ) ] = u
x ^ ( 1 ) ( k ) = [ x ( 0 ) ( 1 ) u a ] e a ( k 1 ) + u a
Here, construct a matrix form B and vector U :
B = [ 1 2 [ x ( 1 ) ( 2 ) + x ( 1 ) ( 1 ) ] 1 2 [ x ( 1 ) ( 3 ) + x ( 1 ) ( 2 ) ] 1 2 [ x ( 1 ) ( 4 ) + x ( 1 ) ( 3 ) ] 1 2 [ x ( 1 ) ( 5 ) + x ( 1 ) ( 4 ) ] ]
y = B U = [ x ( 0 ) ( 2 ) x ( 0 ) ( 3 ) · · · x ( 0 ) ( N ) ]
U = [ a u ] = ( B T B ) 1 B T y

3. Grey Prediction Model of Gas Emission

3.1. General Situation of Coal Mine Geology

Taking the Nantun Coal Mine of Shandong Yankuang Group as an example, the geographical location is shown in Figure 1. It mainly carries out a tunneling operation of three working faces, and intake and return air roadway in two working faces, which are the 411205 working face, 411702 working face, 411306 working face, intake and return air roadway in the 411103 working face and intake and return air roadway in the 411501 working face. Nantun Coal Mine is a low gas mine, and production has not been affected by the gas problem, so the corresponding gas prediction and prediction work is very little. But in recent years, the production process found that the amount of gas emissions has had a significant upward trend. Sometimes it is found that the gas exceeds the standard seriously. During the period from 20–24 May 2020, the gas emission of each important position of the working face was monitored, as shown in Table 1.
The data in Table 1 was drawn into a column chart to intuitively observe the changing trends of gas emissions, as shown in Figure 2 and Figure 3. It can be seen from Figure 2 that the gas concentration of the three working faces increases to a certain extent, and the increase in the range of the 411205 working face is larger than that of the other two working faces. From Figure 3, it can be seen that the gas gushing from the inlet lane of the 411103 working face showed a decreasing trend on the 21 May 2020, and then gradually increased. The amount of gas emission from other entry and return lanes also increased to a certain extent. In order to predict the growth trend of gas concentration in the next few days and take timely prevention and control measures, gray prediction was made for gas concentration at each working face.

3.2. Grey Prediction Analysis of Gas Emission in Coal Mining Face

Taking 411205 working face as an example, the prediction analysis of gas emission is carried out. The GM (1,1) is established to accumulate the original five groups of data:
x ( 1 ) = ( 1.211 ,   2.441 ,   3.753 ,   5.107 ,   6.448 )
B = [ 1.826 3.097 4.43 5.778 ]
y = B U = [ 1.23 1.312 1.354 1.341 ]
U = [ 0.0282 1.2025 ]
Establishing the grey prediction model:
d x d t 0.0282 x = 1.2025
The solution is satisfactory:
x ^ ( 1 ) ( k ) = [ x ^ ( 1 ) ( 1 ) u a ] e a ( k 1 ) + u a = 43.85 e 0.0282 ( k 1 ) 42.64
x ^ ( 1 ) ( 1 ) = x ^ ( 0 ) ( 1 ) = x ( 0 ) ( 1 ) = 1.211
There are also:
x ^ ( 0 ) ( k ) = x ^ ( 1 ) ( k ) x ^ ( 1 ) ( k 1 ) , k 2
Finally, the grey prediction value is obtained as follows
x ^ ( 0 ) = [ x ( 0 ) ( 1 ) ,   x ( 0 ) ( 2 ) ,   · · ·   x ( 0 ) ( N ) ] = [ 1.211 ,   1.254 ,   1.290 ,   1.327 ,   1.365 ,   1.404 ,   1.444 ]
Similarly, the predicted gas emission of the other two working faces are shown in Table 2.
According to the prediction results, the gas emission of the coal mining face presents a continuous growth trend, and the 411205 working face has the fastest growth rate among the three coal mining faces, as shown in Figure 4. During the period of statistical data, the gas emission of the 411702 working face was the largest, but the gas concentration of the 411205 working face increased the fastest, and the gas concentration basically reached the maximum in three working faces within a few days. With the continuous advance of the coal mining face, the gas concentration in the 411205 working face increases faster, and there are risks such as a gas explosion. It is necessary to focus on measuring the gas concentration of the 411205 working face and take gas extraction measures in advance. At the same time, fire prevention and extinguishing measures need to be strengthened to ensure safe and efficient production at the working face.

3.3. Grey Prediction Analysis of Gas Emission in Intake and Return Air Roadway of Working Face

Similar to the coal mining face, there are some dangers such as gas overrun and gas explosions in the excavation process of the intake and return air roadway. For this reason, the gas concentration of four roadways in the mine is predicted and analyzed, and the calculation steps are similar to those of the coal mining face. The predicted gas concentration in the intake and return air roadways of the 411103 working face and the 411501 working face is obtained, as shown in Table 3.
According to the prediction of gas emissions in the air roadways of the two working faces, the gas concentration in the four air roadways increases obviously, and the gas concentration in the air intake roadway is significantly higher than that in the air return roadway, as shown in Figure 5. The gas concentration in the intake and return air roadway of 411103 working face is higher, and the gas growth rate is significantly higher than that in the intake and return air roadway of 411501 working face. Especially in 411103 air intake roadway, a high concentration of gas accumulation could very easily to cause gas concentration overrun, and sparks may easily cause gas explosion accidents. Therefore, in future gas monitoring and fire prevention work, focusing on the 411103 working face gas concentration monitoring, and taking measures such as increasing the amount of ventilation to diluting the gas concentration is very important. Meanwhile, it is essential to increase the prediction density of gas emissions, and timely updates to the prediction scheme for the situation of quickly increasing gas concentrations. Finally, it can ensure a timely and accurate grasp of the gas concentration in the working face, and ensure the safety and efficiency of the working face.

4. Comparison between the Predicted Results and the Actual Values

In addition to the actual gas emission data measured from 20–24 May 2020, the actual data from 25 May and 26 May were monitored to verify the accuracy of the gray prediction model. Figure 6 and Figure 7 show the comparison between the predicted value and the actual value of gas emission in coal mining face and air roadways. From this, it can be seen that the growth trends of the predicted and actual gas emissions from 21–26 May 2020 are basically the same, the matching degree between them is high, and the gap is very small. In order to further quantitatively analyze the accuracy of the grey prediction method in predicting gas content, the relative error between the prediction and actual data is calculated. The calculation results are shown in Table 4 and Figure 8. The error is calculated as follows:
D e r r o r = | Q a c t u a l Q p r e d i c t e d | Q a c t u a l
where, Derror is relative error; Qactual stands for actual gas emissions, m3/t; Qpredicted represents the predicted gas emissions, m3/t.
As can be seen from Figure 8, the maximum error rate appears in the air intake roadway of the 411103 working face, which is 2.41%. The minimum value is 0.07% in the 411702 working face. On the whole, the relative errors between the predicted values and the actual measured values of the seven working face areas are less than 2.5%. In particular, most of the prediction errors of gas emission on 25 May 2020 and 26 May 2020 are less than 1.5%, with lower error and higher prediction accuracy. There is no large error in the prediction of gas emissions in the future, and the overall prediction accuracy is high, which achieves the target of predicting gas emissions in a short time.

5. Conclusions

In order to study gas emissions at the coal mining face, this paper selected the grey prediction model GM (1,1) to make statistics on the gas data of three coal mining faces and air roadways of the other two working faces, and forecasted the gas data over the next two days. After analysis and discussion, the main conclusions are as follows:
(1) Grey prediction model GM (1,1) is able to quantify parameters, find patterns, and predict trends over a certain period of time. It needs less data and has a high prediction accuracy in a short time, so is suitable for the prediction of gas concentrations in mine working faces.
(2) The gas emissions in different areas of seven working faces show different trends. The 411103 working face has the highest gas concentration, so this area should be monitored and measures such as increasing ventilation should be taken to reduce gas concentration and prevent gas disasters.
(3) The overall prediction accuracy in the measured coal mines meets the requirements of field prediction. There is no obvious time area with a large prediction error. Specifically, the maximum prediction error is 2.41%, and the minimum value is only 0.07%, which achieves the purpose of gas emission prediction at the working face of the mine.
(4) By using the grey prediction model, the purpose of predicting the amount of gas gushing out in a short period of time is achieved. Meanwhile, the limited concentration of gas can be known in advance, which is of great significance for coal mine gas control and safety production.

Author Contributions

Conceptualization, J.Z. and Q.L.; methodology, J.Z.; validation, J.Z. and Q.L.; formal analysis, J.Z.; investigation, J.Z. and Q.L.; resources, J.Z.; writing—original draft preparation, J.Z.; writing—review and editing, Q.L.; visualization, Q.L.; project administration, J.Z. and Q.L. All authors have read and agreed to the published version of the manuscript.

Funding

This research was funded by the National Natural Science Foundation of China (Project No. 51974179, 51704187); Shandong Province key research and development plan, China (Project No. GG201809190180); Shandong Province Natural Science Foundation, China (Project No. ZR2017BEE054); Shandong Provincial Natural Science Foundation, China (ZR2019BG007).

Institutional Review Board Statement

Not applicable.

Informed Consent Statement

Not applicable.

Data Availability Statement

Not applicable.

Conflicts of Interest

The authors declare that they have no conflict of interest.

References

  1. Sun, H.; Cao, J.; Li, M.; Zhao, X.; Dai, L.; Sun, D.; Wang, B.; Zhai, B. Experimental research on the impactive dynamic effect of gas-pulverized coal of coal and gas outburst. Energies 2018, 11, 797. [Google Scholar] [CrossRef] [Green Version]
  2. Mou, J.; Liu, H.; Zou, Y.; Li, Q. A new method to determine the sensitivity of coal and gas outburst prediction index. Arab. J. Geosci. 2020, 13, 1–9. [Google Scholar] [CrossRef]
  3. Wang, K.; Du, F. Coal-gas compound dynamic disasters in China: A review. Process. Saf. Environ. Prot. 2020. [Google Scholar] [CrossRef]
  4. D’Alessandro, W.; Kyriakopoulos, K. Preliminary gas hazard evaluation in Greece. Nat. Hazards 2013. [Google Scholar] [CrossRef]
  5. Ke, W.; Wang, K. Impact of gas control policy on the gas accidents in coal mine. Processes 2020, 8, 1450. [Google Scholar] [CrossRef]
  6. Xu, H.; Wang, G.; Guo, Y.; Chang, B.; Hu, Y.; Fan, J. Theoretical, numerical, and experimental analysis of effective extraction radius of coalbed methane boreholes by a gas seepage model based on defined criteria. Energy Sci. Eng. 2020, 8, 880–897. [Google Scholar] [CrossRef]
  7. Tong, R.; Yang, Y.; Ma, X.; Zhang, Y.; Li, S.; Yang, H. Risk assessment of Miners’ unsafe behaviors: A case study of gas explosion accidents in coal mine, china. Int. J. Environ. Res. Public Health 2019, 16, 1765. [Google Scholar] [CrossRef] [Green Version]
  8. Wang, L.; Lu, Z.; Chen, D.P.; Liu, Q.Q.; Chu, P.; Shu, L.Y.; Wen, Z.J. Safe strategy for coal and gas outburst prevention in deep-and-thick coal seams using a soft rock protective layer mining. Saf. Sci. 2020. [Google Scholar] [CrossRef]
  9. Zhou, H.; Dai, H.; Ge, C. Quality and quantity of pre-drainage methane and responding strategies in Chinese outburst coal mines. Arab. J. Geosci. 2016. [Google Scholar] [CrossRef]
  10. Geng, F.; Saleh, J.H. Challenging the emerging narrative: Critical examination of coalmining safety in China, and recommendations for tackling mining hazards. Saf. Sci. 2015. [Google Scholar] [CrossRef]
  11. Wang, H.; Cheng, Y.; Yuan, L. Gas outburst disasters and the mining technology of key protective seam in coal seam group in the Huainan coalfield. Nat. Hazards 2013. [Google Scholar] [CrossRef]
  12. Dong, G.; Ren, X.; Wang, Z. A novel early-warning method for atypical outbursts disasters in mines: Extraction of indexes from gas concentration data for the early warning of atypical outbursts. Arab. J. Geosci. 2019. [Google Scholar] [CrossRef]
  13. Xu, N.; Ding, S.; Gong, Y.; Bai, J. Forecasting Chinese greenhouse gas emissions from energy consumption using a novel grey rolling model. Energy 2019. [Google Scholar] [CrossRef]
  14. Li, Z.; Wang, E.; Ou, J.; Liu, Z. Hazard evaluation of coal and gas outbursts in a coal-mine roadway based on logistic regression model. Int. J. Rock Mech. Min. Sci. 2015. [Google Scholar] [CrossRef]
  15. Yang, Y.; Du, Q.; Wang, C.; Bai, Y. Research on the Method of Methane Emission Prediction Using Improved Grey Radial Basis Function Neural Network Model. Energies 2020, 13, 6112. [Google Scholar] [CrossRef]
  16. Wei, C.; Xu, M.; Sun, J.; Li, X.; Ji, C. Coal mine gas emission gray dynamic prediction. Procedia Eng. 2011, 26, 1157–1167. [Google Scholar] [CrossRef] [Green Version]
  17. Ruilin, Z.; Lowndes, I.S. The application of a coupled artificial neural network and fault tree analysis model to predict coal and gas outbursts. Int. J. Coal Geol. 2010. [Google Scholar] [CrossRef]
  18. Zhu, Z.; Zhang, H.; Han, J. Prediction of Coal and Gas Outburst Based on PCA-BP Neural Network. China Saf. Sci. J. 2013, 23, 45–50. [Google Scholar] [CrossRef]
  19. Zhang, S.; Wang, B.; Li, X.; Chen, H. Research and Application of Improved Gas Concentration Prediction Model Based on Grey Theory and BP Neural Network in Digital Mine. Procedia CIRP 2016, 56, 471–475. [Google Scholar] [CrossRef] [Green Version]
  20. Chen, Y.; Zheng, L.; Huang, J.; Zou, Z.; Li, C. Prediction of gas emission based on grey-generalized regression neural network. IOP Conf. Ser. Earth Environ. Sci. 2020, 467. [Google Scholar] [CrossRef]
  21. Li, Y. Study on the Application of Multi-Source Information FusionTechnology in the Coal and Gas Outburst Prediction; China University of Mining and Technology: Beijing, China, 2018. [Google Scholar]
  22. Zhang, F.; Han, H. Location method of mine gas diffusive position based on multi-source sensor. Meitan Xuebao J. China Coal Soc. 2018. [Google Scholar] [CrossRef]
  23. Liu, Z.; Pang, J. Research on coal mine safety monitoring system based on multi-sensor fusion technology. China Energy Environ. Prot. 2017, 39, 39–42. [Google Scholar]
  24. Dong, D. Mine gas emission prediction based on Gaussian process model. Procedia Eng. 2012, 45, 334–338. [Google Scholar] [CrossRef] [Green Version]
  25. Jing, G.X.; Xu, S.M.; Heng, X.W.; Li, C.Q. Research on the prediction of gas emission quantity in coal mine based on grey system and linear regression for one element. Procedia Eng. 2011, 26, 1585–1590. [Google Scholar] [CrossRef] [Green Version]
  26. Wu, Y.; Gao, R.; Yang, J. Prediction of coal and gas outburst: A method based on the BP neural network optimized by GASA. Process. Saf. Environ. Prot. 2020, 133, 64–72. [Google Scholar] [CrossRef]
  27. Yin, G.Z.; Li, M.H.; Li, W.P.; Cao, J.; Li, X. Model of coal gas permeability prediction based on improved BP neural network. Meitan Xuebao J. China Coal Soc. 2013, 38, 1179–1184. [Google Scholar] [CrossRef]
  28. Tian, S.; Lin, H.; Ma, R. Prediction of correlation between gas emission and tectonic coal. China Saf. Sci. J. 2019, 29, 105–109. [Google Scholar]
  29. Gao, K.; Liu, J.; Liu, Y. Gas emission prediction of working face based on GA-projection pursuit regression. China Saf. Sci. J. 2015, 25, 96–101. [Google Scholar]
  30. Xiao, P.; Xie, X.; Shuang, H. Prediction of gas emission quantity based on KPCA-CMGANN algorithm. China Saf. Sci. J. 2020, 30, 39–47. [Google Scholar]
  31. Li, R.; Shi, S.; Wu, A.; Luo, W.; Zhu, H. Research on prediction of gas emission based on self-organizing data mining in coal mines. Procedia Eng. 2014, 84, 779–785. [Google Scholar] [CrossRef] [Green Version]
  32. Deng, J. Control problems of grey systems. Syst. Control. Lett. 1982. [Google Scholar] [CrossRef]
  33. Chang, C.J.; Li, D.C.; Huang, Y.H.; Chen, C.C. A novel gray forecasting model based on the box plot for small manufacturing data sets. Appl. Math. Comput. 2015. [Google Scholar] [CrossRef]
  34. Wu, L.; Liu, S.; Yang, Y. A Gray Model with a Time Varying Weighted Generating Operator. IEEE Trans. Syst. Man Cybern. Syst. 2016. [Google Scholar] [CrossRef]
  35. Shou, M.H.; Wang, Z.X.; Li, D.D.; Wang, Y. Assessment of the air pollution emission reduction effect of the coal substitution policy in China: An improved grey modelling approach. Environ. Sci. Pollut. Res. 2020, 27, 34357–34368. [Google Scholar] [CrossRef]
  36. Yang, F.; Jiao, Y.; Zhang, J.; Gao, D.; Zhao, K.; Ma, D. Study on simultaneous extraction of coal and gas and clean utilization in high-gas outburst mines. IOP Conf. Ser. Earth Environ. Sci. 2020, 510. [Google Scholar] [CrossRef]
  37. Wang, Z.X.; He, L.Y.; Zheng, H.H. Forecasting the residential solar energy consumption of the United States. Energy 2019. [Google Scholar] [CrossRef]
  38. Ikram, M.; Mahmoudi, A.; Shah, S.Z.A.; Mohsin, M. Forecasting number of ISO 14001 certifications of selected countries: Application of even GM (1,1), DGM, and NDGM models. Environ. Sci. Pollut. Res. 2019. [Google Scholar] [CrossRef]
  39. Zeng, B.; Tong, M.; Ma, X. A new-structure grey Verhulst model: Development and performance comparison. Appl. Math. Model. 2020. [Google Scholar] [CrossRef]
  40. Wu, L.; Liu, S.; Chen, D.; Yao, L.; Cui, W. Using gray model with fractional order accumulation to predict gas emission. Nat. Hazards 2014, 71, 2231–2236. [Google Scholar] [CrossRef]
  41. Wang, Y.; Yao, D.; Lu, H. Mine Gas Emission Prediction Based on Grey Markov Prediction Model. Open J. Geol. 2018, 8, 939–946. [Google Scholar] [CrossRef] [Green Version]
  42. Yuan, B. Study on gas emission prediction of working face based on GM (1, 1) model. J. Phys. Conf. Ser. 2020, 1549. [Google Scholar] [CrossRef]
  43. Xu, N.; Dang, Y. Characteristic adaptive GM(1, 1) model and forecasting of Chinese traffic pollution emission. Xitong Gongcheng Lilun Yu Shijian Syst. Eng. Theory Pract. 2018. [Google Scholar] [CrossRef]
  44. Wang, W.; Peng, L.; Wang, X. Prediction of coal mine gas emission quantity based on grey-gas geologic method. Math. Probl. Eng. 2018, 2018. [Google Scholar] [CrossRef] [Green Version]
Figure 1. Geographical location of the Nantun Coal Mine.
Processes 09 01147 g001
Figure 2. Analysis of measured value of gas emission in working face.
Processes 09 01147 g002
Figure 3. Analysis of measured value of gas emission in intake and return air roadway of working face.
Processes 09 01147 g003
Figure 4. Analysis of coal mining face gas prediction data.
Processes 09 01147 g004
Figure 5. Analysis of gas prediction data in intake and return air roadway of working face.
Processes 09 01147 g005
Figure 6. Comparison of gas prediction and actual data in the intake and return air roadways of the working face. (a) 1# location; (b) 2# location; (c) 3# location.
Processes 09 01147 g006
Figure 7. Comparison of gas prediction and actual data in the intake and return air roadways of the working face. (a) 4# location; (b) 5# location; (c) 6# location; (d) 7# location.
Processes 09 01147 g007
Figure 8. Relative error of the grey prediction method: (a,c) represents the coal mining face; (b,d) stands for the intake and return air roadways of the working face.
Processes 09 01147 g008
Table 1. Actual measured value of gas emissions in each working face.
Working Face NameNo.5/205/215/225/235/24
411205 working face/(m3/t)1#1.2111.231.3121.3541.341
411702 working face/(m3/t)2#1.4671.4711.4721.4831.483
411306 working face/(m3/t)3#1.3541.3651.3641.3751.38
Intake air roadway of 411103 working face/(m3/t)4#1.2121.1021.2051.2211.318
Return air roadway of 411103 working face/(m3/t)5#0.9810.9740.9911.0241.11
Intake air roadway of 411501 working face/(m3/t)6#0.8450.8610.8610.8840.881
Return air roadway of 411501 working face/(m3/t)7#0.7980.8120.8220.8440.857
Table 2. Coal mining face gas prediction data.
No.5/215/225/235/245/255/26
1#/(m3/t)1.2541.291.3271.3651.4041.444
2#/(m3/t)1.471.4741.4791.4841.4891.493
3#/(m3/t)1.3621.3681.3731.3791.3851.39
Table 3. Gas prediction data in the intake and return air roadway of working face.
No.5/215/225/235/245/255/26
4#/(m3/t)1.1131.1761.2421.3121.3861.465
5#/(m3/t)0.9581.0011.0451.0921.1411.192
6#/(m3/t)0.8590.8670.8750.8840.8920.901
7#/(m3/t)0.8110.8250.8380.8520.8660.88
Table 4. Relative error between grey prediction result and measured value.
No.5/215/225/235/245/255/26
1#/(m3/t)1.95%1.68%1.99%1.79%1.86%1.92%
2#/(m3/t)0.07%0.14%0.27%0.07%0.14%0.11%
3#/(m3/t)0.22%0.29%0.15%0.07%0.15%0.25%
4#/(m3/t)1.00%2.41%1.72%0.46%1.41%1.06%
5#/(m3/t)1.64%1.01%2.05%1.62%1.59%1.28%
6#/(m3/t)0.23%0.70%1.02%0.34%0.56%0.26%
7#/(m3/t)0.12%0.36%0.71%0.58%0.39%0.17%
Publisher’s Note: MDPI stays neutral with regard to jurisdictional claims in published maps and institutional affiliations.

