1. Introduction
Distillation is the most often used separation method in the chemical industry, as it is used in approximately 95% of liquid separations in chemical and petrochemical plants [
1]. Separations of multicomponent chemical mixtures have been carried out mainly in distillation columns trains. Ternary mixtures in particular have received special attention in the literature [
2,
3,
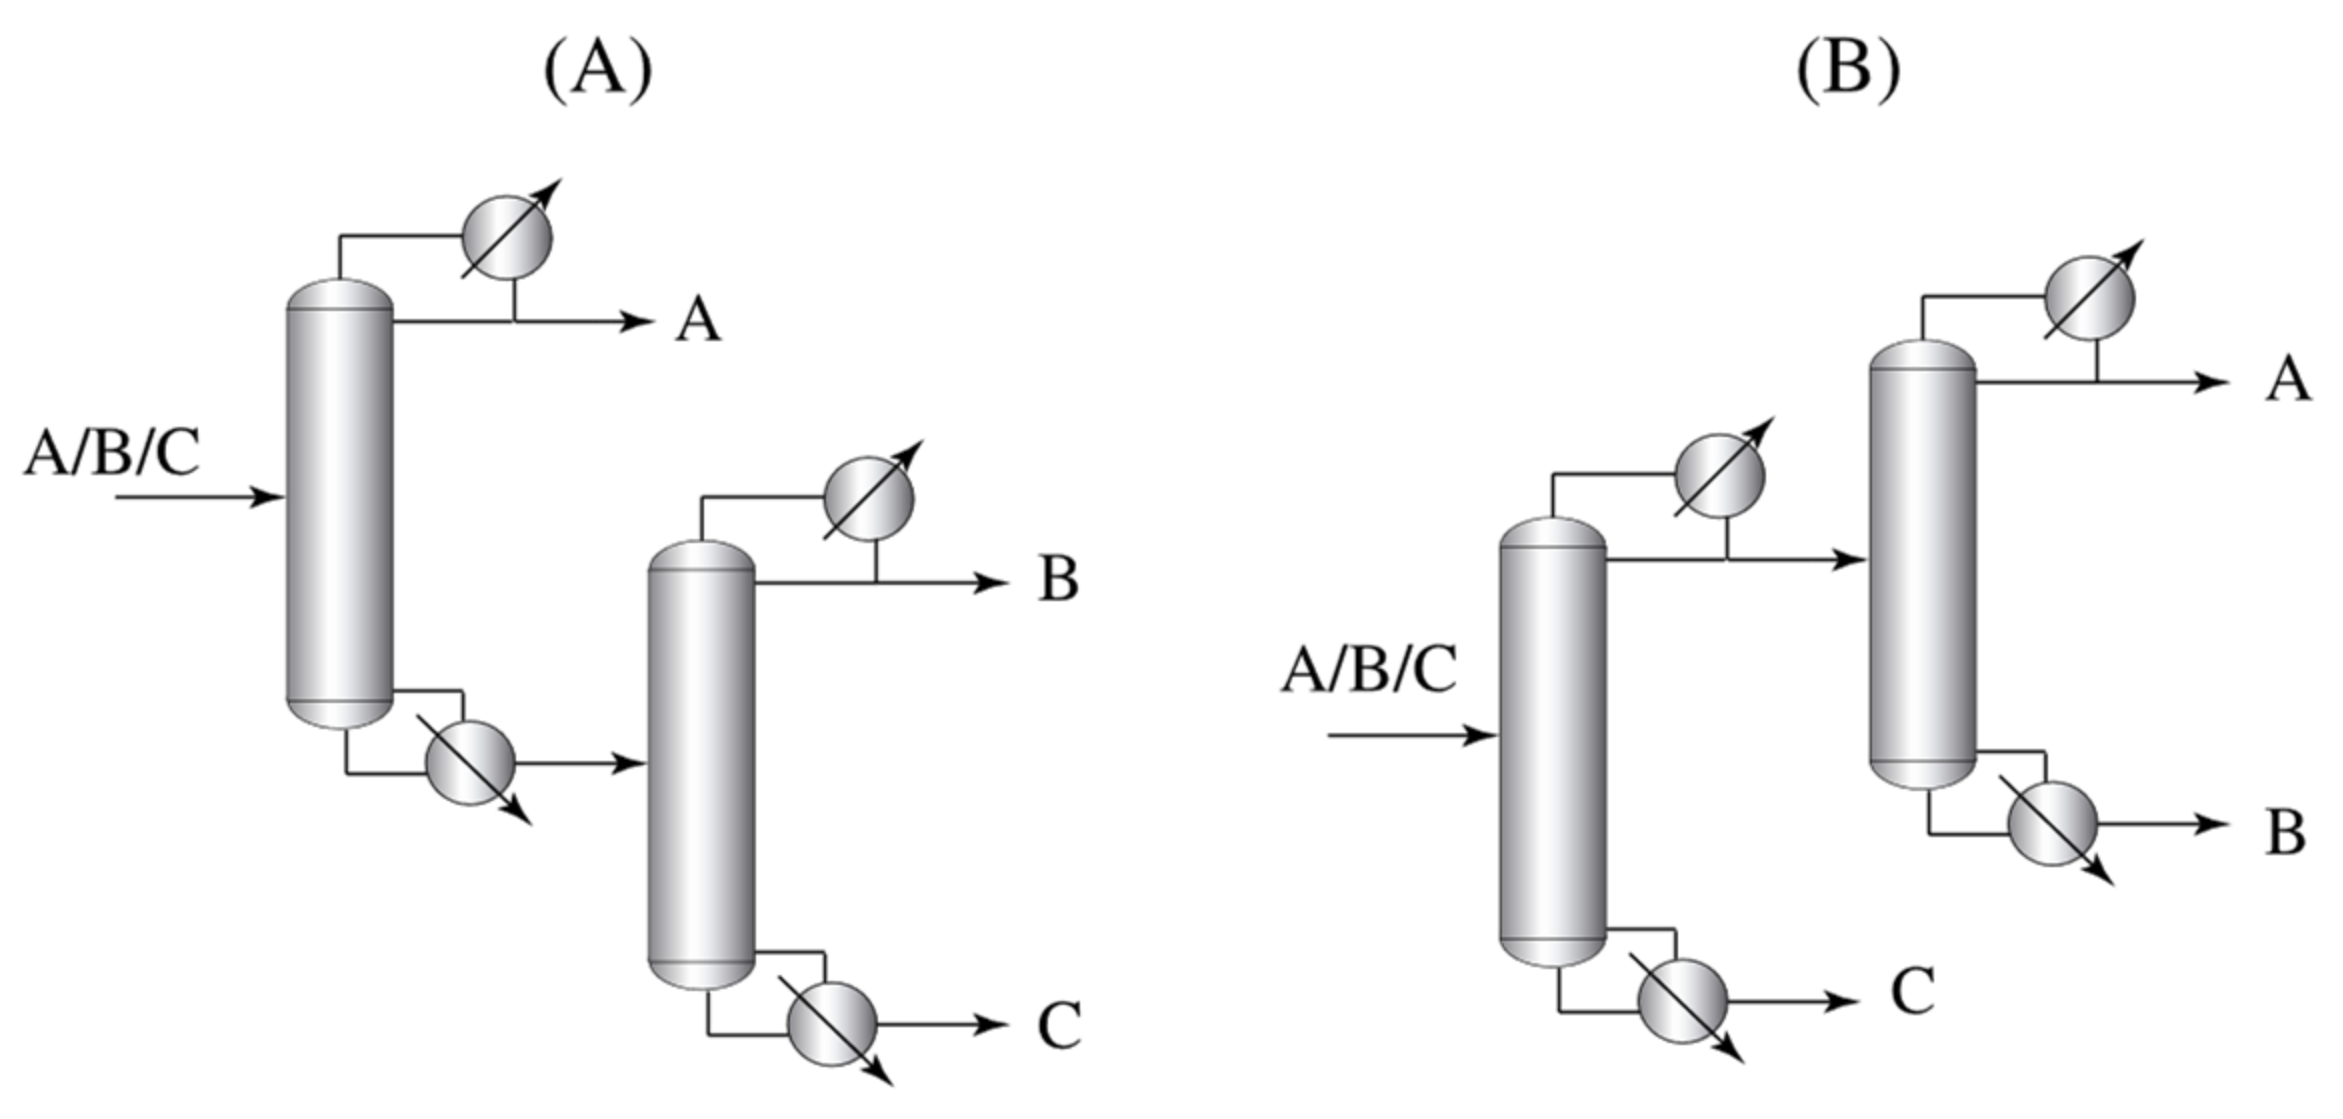
4]. Conventional separation of ternary mixtures can be done by direct and indirect sequences (
Figure 1). These sequences have a low thermodynamic efficiency due to a phenomenon known as remixing, which directly affects the energy consumption of the separation.
Thermally coupled columns provide an attractive option for the separation of multicomponent mixtures. The fully thermally coupled arrangement, also called the Petlyuk column, has been proven to be the most energy-efficient structure for ternary mixtures, and has been implemented in the form of a dividing wall column (DWC) [
5].
Figure 2 depicts the Petlyuk arrangement and its implementation as a DWC. Petlyuk or DWC columns have been shown to provide up to 30% energy reduction and 40% lower capital costs compared to traditional distillation arrangements [
4]. The principal reason for improved energy efficiency is the reduction or elimination of the remixing effect [
6].
The simulation of DWCs via the Petlyuk system has been reported in several publications. However, commercial simulators do not include blocks for dividing wall columns as standard models. Therefore, the design task of a DWC requires adapting the available blocks of conventional columns using the concept of thermal coupling to integrate the Petlyuk column. In addition, the design of DWCs is generally more complex than traditional distillation columns, due to its additional degrees of freedom.
To have a preliminary design of the DWC structure before carrying out rigorous simulations, one needs to initialize the degrees of freedom (i.e., design parameters) such as the feed stage, the number of stages of each section, the side draw, vapor and liquid split ratios, reflux ratio, reboiler heat input and side product flow rate. The choice of the values for these degrees of freedom becomes a challenging task, as they significantly affect the column efficiency. Therefore, investigations have been carried out for simulation initialization procedures in order to converge to a proper solution. Furthermore, before applying any optimization technique, an initial rigorous design with a proper structure (topology) and feasible flows are needed to increase the chances of successful convergence to the optimal design. To achieve feasible rigorous designs that are close to actual distillation systems, different design methodologies have been proposed in the literature, most of them based on shortcut design methodologies such as the Fenske-Underwood-Gilliland equations, aiming to gain a conceptual understanding of the definition of key design parameters for the DWC [
7,
8].
More generally, the classification of design methodologies for thermally coupled and DWC systems can be divided into two categories, namely: (i) the ones that take into account the structural design (topology); and (ii) the ones that consider only the definition of operational variables (i.e., internal flows) of the columns. Some of the methodologies reported in the literature seek to accomplish both objectives, i.e., to have a column with a feasible structure and a column with feasible hydraulics. Fidkowski & Krolikowski [
9] presented a detailed procedure for calculating the minimum energy requirements in thermally coupled columns for ideal ternary mixtures. They conducted an analysis of internal flows through the column to find the minimum vapor flow rate to minimize energy usage, leaving out the structural design by not reporting equations to determine the column number of stages. Based on this work, Halvorsen and Skogestad [
7] developed a graphical method based on a minimum vapor flow (Vmin) diagram for ideal multicomponent mixtures, which is useful to visualize how energy consumption is related to the feed-component distribution. Halvorsen and Skogestad [
10] also applied the methodology to Petlyuk columns, and concluded that the minimum energy is related to the most difficult split between any pair of products. Dejanović et al. [
11] used the Vmin diagram methodology to obtain the minimum internal flows in DWCs, and linked it to setting twice the minimum number of stages to initialize the structural arrangement.
Methodologies that consider the minimum vapor flow rate as a major factor to initialize the column have received less attention compared to the problem of determining the number of stages in the subsections of the column. Some of the methodologies that have proposed structural designs for these types of systems include the one reported by Triantafyllou & Smith [
8]. They proposed a method based on the Fenske-Underwood-Gilliland-Kirkbride (FUGK) equations, assuming constant relative volatility and constant molar flows. The procedure was applied to a three-column model that represents the sections of the Petlyuk column. Even though it is straightforward to obtain the number of stages with this procedure, it requires many iterations to match the net flow compositions. Furthermore, the use of the Gilliland equation can lead to significant errors due to its inherent limitations, and the use of the Kirkbride equation to determine the locations of thermal couplings leads to errors when the initial design is simulated with rigorous modules [
12]. Amminudin and Smith [
12] proposed a design method based on equilibrium stage compositions. While the authors demonstrated that their approach provides more accurate designs than those based on FUGK equations, its semi-rigorous nature requires significant computational effort to tune all design variables to obtain a feasible design. Hernández & Jiménez [
13,
14] proposed a procedure to design thermally coupled columns using the methodology of Triantafyllou & Smith to obtain an initial design, followed by the use of a rigorous dynamic model to meet design specifications for product purities. The authors showed that the methodology of Triantafyllou & Smith is reliable to configure a feasible initial design for rigorous simulations, and concluded that the liquid to vapor split plays an essential role in the column energy consumption, so that it can be varied through a sensitivity analysis to obtain improved designs. Rangaiah et al. [
15] proposed a design procedure for DWCs based on the principles of Triantafyllow and Smith’s methodology, considering as a basis a three-column arrangement using the FUGK shortcut method; the methodology was implemented using the process simulator Aspen Hysys. They mentioned that the reliability of the simulation depends on the accuracy of the thermodynamic model, which can be easily configured on a process simulator. The authors concluded that the three-column shortcut simulation could provide reasonable initial estimates prior to optimization. Sotudeh and Shahraki [
16] proposed an alternative methodology based on the Underwood equations to determine both the internal flows through the calculation of the minimum vapor flow (Vmin) and the column structural design (number of stages of each section of the DWC). However, the authors did not analyze how to set the liquid to vapor split, and the results were not compared with rigorous simulations.
Recent methodologies reported in the literature are based on two stages for designing a DWC. They use first the Vmin diagram as a base methodology to determine the flows throughout the column, and then apply classical equations to assess the structural design, such as FUGK equations [
16,
17,
18], using heuristics [
11] or developing new equations [
19]. However, such methodologies are based on the common assumptions of constant molar flows and constant relative volatilities, so the design may not be close to the optimal one. Furthermore, these methodologies require iterative adjustments, which makes the methods computational expensive.
Although there are design methodologies that have been proven as effective for the conceptual design of DWCs, and new methodologies are still being investigated, so far no investigation has provided a detailed comparison among different design methodologies found in the literature. Thus, this paper aims to (i) study the most commonly used design methodologies reported in the literature for DWCs to assess their advantages and drawbacks compared to each other and their capabilities to provide optimal designs, (ii) compare the methodologies in terms of parameter value effectiveness to initialize the DWCs for rigorous simulation, and (iii) to investigate the effect of the ease of separation index (ESI) on the performance of the design methodologies. We also show how the Sotudeh and Shahraki’s method can be modified to obtain close to optimal designs through its implementation in process simulators.
The paper is organized as follows.
Section 2 describes the design methodologies selected to be analyzed and the proposed modification to the Sotudeh and Shahraki’s methodology.
Section 3 presents the case studies selected based on the ease of separation index.
Section 4 reports and discusses the results, and
Section 5 summarizes the main conclusions of this work.
2. Design Methodologies for DWCs
This section describes the concepts of the methodologies investigated in this work. Regarding the methods that consider a structural design, the Triantafyllou & Smith (T&S) method is discussed. This method was implemented in Aspen Plus®. For the analysis of internal flows, the method of minimum vapor diagram (Vmin) is examined. Finally, the design methodology by Sotudeh & Shahraki (S&S), which provides feasible internal flows, followed by the column topology, is also investigated.
2.1. Triantafyllou & Smith (T&S) Methodology
The Triantafyllou and Smith’s methodology [
8] is based on the Fenske-Underwood-Gilliland-Kirkbride method. The method assumes constant relative volatilities and constant molar flows, and starts the design with a three-column arrangement (see
Figure 3). This approach is the most cited design methodology for DWCs, probably due to its ease of implementation using the concept of thermally coupled columns arranged as a Petlyuk column. Thus, several authors have adapted the T&S methodology into process simulators to avoid exhaustive iterative calculations of the original approach and differences of the final design with respect to rigorous simulations, leading to simplified and practical approaches [
14,
15,
20,
21,
22,
23].
In this work, the T&S methodology was adapted and simulated in Aspen Plus by using two distillation modules, i.e., the DSTWU (Distillation Tower) module for shortcut calculations and the Radfrac module for rigorous simulations. The main idea of transferring the results of the approximate methods to rigorous simulations is to eliminate the assumptions of constant relative volatility and constant flow rates throughout the column. Furthermore, the use of rigorous Radfrac blocks in this methodology avoids the need for the iterative procedure described by Triantafyllou and Smith to equalize internal flows between sections of the main column.
In the adapted methodology, the prefractionator (
of
Figure 3) is first designed using the block DSTWU, specifying a recovery for
for the light key component and
for the heavy key component in the distillate stream, partial reboiler and partial condenser. The reflux ratio was set as 1.2 times the minimum reflux ratio. Then, the results, i.e., the number of stages, actual reflux ratio, feed stage and distillate to feed ratio, are used to define design specifications to simulate the prefractionator in a rigorous Radfrac block. Additionally, two design specifications were used to ensure the mole recovery of light key and heavy key components in distillate and bottoms streams, respectively. The reflux ratio and distillate to feed ratio are used as manipulated variables to achieve the required recoveries. Distillate and bottoms streams of the prefractionator are the feed to the second and third columns, the upper and lower sections of the main column. Note that at this point, the prefractionator with rigorous simulations has already been designed.
For the second column (
in
Figure 3, upper section of the main column)—unlike the procedure by Triantafyllou and Smith’s methodology, in which it was simulated as a sidestream column—a conventional column with specified distillate recoveries of the light and heavy key components was used, similarly to the prefractionator. It is assumed that the heavy key components in the feed go to the bottom of the column. Finally, Column 3 (
) was designed similarly to column
, assuming that all light key components in the feed are obtained at the top of the column. Results from the DSTWU blocks are used to configure columns
and
with Radfrac blocks, which is followed by a comparison of the vapor flow of both Radfrac columns; the design of the column with a higher vapor flow, i.e., the dominant column, is maintained, while the other column must be redesigned with the vapor flow of the dominant column.
When the design of both columns is concluded, the prefractionator () is redesigned in order to have the same number of stages in the prefractionator side as in the sidestream section of the wall; thus, the number of stages in the prefractionator is configured with the number of stages in the stripping zone () of column , plus the number of stages in the rectifying section () of column (same configuration as in Equation (11)). At this stage, the topology of the columns has been evaluated, and the flows through every section of the columns provide feasible values with rigorous modules.
To configure the rigorous simulation for the DWC, the Petlyuk arrangement is used (see
Figure 2), i.e., the total number of stages of the main column is calculated as the sum of the number of stages of the second and third column (
). Furthermore, the sidestream stage of the Petlyuk column is set as the total number of stages of the second column (
). Thus, with the values obtained for the structural arrangement, both the prefractionator and the main column are joined together with two side streams from the main column; these streams are taken as recycle streams for the simulator, using them as tear streams to improve convergence in iterative calculations of the entire system. Initial estimates for these streams can be obtained from the column profiles obtained from rigorous simulations in the Radfrac block of the prefractionator. Suitable stages for the interlinking streams in the main column are given by the feed streams of columns
and
in
Figure 3.
Liquid and vapor splits were configured using liquid and vapor flow rates obtained from the rigorous design of the prefractionator section . Finally, design specifications were set to obtain the required product purities. For a fair comparison with other design methodologies, product purities were set as design constraints. Therefore, three design specifications were configured for each product stream by varying the reflux ratio (L/D), boilup ratio (V/B) and side draw flow rate.
2.2. Vmin Diagram Method
The Vmin diagram method was developed by Halvorsen and Skogestad [
7] for a quick determination of the minimum energy required for a binary column. The Vmin method is based on the Underwood equations for multicomponent mixtures and assumes constant molar flows, constant column pressure, constant relative volatilities and an infinite number of stages. The Underwood equations are used to calculate the reflux ratio and the minimum vapor to perform each possible separation (A/BC, AB/BC and AB/C) of the mixture. A graphical procedure to determine Vmin from a plot of the normalized top vapor flow rate (
) versus the overall product split (
) is shown in
Figure 4.
The minimum vapor of a Petlyuk column for a ternary feed is the vapor flow required for the most difficult binary split (shown as the highest peak in the Vmin diagram) [
24]. Fidkowski and Krolikowski [
9] and Glinos et al. [
25] reported an analytical expression for the determination of minimum vapor flows for saturated-feed liquid, ideal ternary mixtures, as seen Equation (1)
where
is the feed flow rate,
is the Underwood root between
and
and
is the Underwood root between
and
. A general expression in terms of the feed thermal quality
is [
24]
where
is the vapor flow at the top and
is the vapor flow at the bottom of the column. It should be noted that the value of
affects the solution of the Underwood equation from Equation (2) and not only by the term (
)
[
24]. The Vmin diagram reported by Halvorsen and Skogestad [
24] for Petlyuk columns is a useful tool, as detailed vapor flow requirements can be identified directly from such a diagram.
The application of the Vmin methodology within the commercial process simulator Hysys was discussed by Halvorsen and Skogestad [
7]. Furthermore, the implementation of the method with other process simulators such as CHEMCAD was reported by Dejanovic et al. [
11]. In this work, the Vmin methodology was implemented using the shortcut model DSTWU, and then transferring the results to rigorous simulations within the Radfrac module in Aspen Plus. To approximate the vapor flow with an infinite number of stages, as required by the methodology, four times the minimum number of stages (4
) were used for each simulation, where
was calculated by the Winn equation within the DSTWU block. DSTWU and Radfrac columns were specified with recoveries for light and heavy key components in bottoms and distillate streams, respectively. In the Radfrac blocks, the reflux ratio and boilup ratio were configured as manipulated variables to achieve the required recoveries. Vapor flow rates obtained from simulations were used to develop the Vmin diagram for every case study.
Figure 5 shows a typical schematic diagram of the internal liquid and vapor flow rates throughout the column, based on the application of the Vmin methodology.
The Vmin approach provides the information to determine the vapor and liquid flow rates of product streams and internal sections of the column, but it does not provide information about tray arrangements. Therefore, the number of stages of the main column of the Petlyuk arrangement was considered as twice the sum of the minimum number of stages of the A/BC and AB/C binary separations. In contrast, the number of stages of the prefractionator was taken as twice those for the stripping section of the A/BC separation plus twice those for the rectifying section of the AB/C separation, as suggested by Kiss [
26]. Finally, the design is simulated, including design specifications for product purities by manipulating the reflux ratio, the side flow rate and the boilup ratio.
2.3. Sotudeh & Shahraki (S&S) Method
Sotudeh & Shahraki [
16] proposed a method for designing DWCs based only on the Underwood equations. This methodology is carried out in two stages. First, the operational variables are calculated through the minimum vapor methodology, and secondly, the number of trays is calculated through the application of the theoretical Underwood equations for each section of the DWC. The design method can be applied to ternary mixtures [
16] or multicomponent mixtures [
27]. The authors did not include the Fenske equation in their methodology, as the compositions of the liquid and vapor streams are not equal at the interconnecting stages [
16]. Therefore, they used basic Underwood equations to calculate the theoretical number of stages for DWCs.
The Petlyuk system is decomposed using a three-column model, as shown in
Figure 6. The first step in the S&S methodology is to solve material balances to determine the product stream flow rates and compositions using the feed conditions and product compositions. The next step is to define the recovery of the middle boiling component at the top of the prefractionator. The calculation of the minimum vapor flow depends on the selected recovery of middle boiling component, and according to Sotudeh and Shahraki [
16], by setting the preferred split as the distribution of the middle boiling component (minimum vapor flow rate for the sharp split between light and heavy components), suitable designs can be obtained. Christiansen and Skogestad [
28] found that the preferred split provides the best point to find the minimum vapor for the prefractionator. Next, by using constant relative volatilities and the thermal feed quality of the Underwood equations, one can calculate the minimum vapor flow in each section of
Figure 6 from Equation (2), using the Vmin methodology [
7,
9,
16,
25].
The resulting
value is used to determine the number of stages in every section of the column. The reflux ratio, RR, is first calculated by Equation (3).
For our application, the operating reflux ratio was set to 1.2 times
. By applying material balances for each section of the arrangement, one can calculate the flow rates of sections
,
and
, i.e.,
. Then, a new parameter,
, is introduced to account for the liquid split at the top of the column.
The parameter
must be chosen in the range given by Equation (5). Sotudeh and Shahraki [
16] recommend selecting the upper bound in Equation (5) to obtain an economical design.
Once we know the value of
r, the remaining parameters
can be calculated. From the Underwood equations, the number of theoretical plates
and
shown in
Figure 6 are found with Equations (6) and (7).
Here,
and
are known values. The Underwood roots
,
,
and
are determined from Equations (8) and (9):
where
where
The unknown parameters in Equations (6) and (7) are
,
and
, which is the liquid composition entering the prefractionator or
Section 1. Since
, there are only two equations and three unknowns,
,
and
. One can easily compute
from Equation (10), which is related to the minimum number of stages, and use these values in Equations (6) and (7) to determine
and
.
A similar procedure can be followed to determine the parameters of
Section 3 in
Figure 6 [
16]. The required number of stages for
Section 1 (prefractionator) must be equal to the sidestream draw section given by
+
. It should be noted that the condition given by Equation (11) was also used in the methodology of T&S.
A final step is the calculation of the feed stage using the Kirkbride equation:
Sections and can be determined by solving Equations (11) and (12). This methodology was implemented in a spreadsheet. Finally, the Petlyuk arrangement was configured in Aspen Plus, including design specifications for product purities using the reflux ratio, the side draw flow rate and the boilup ratio as manipulated variables.
2.4. A Modified S&S Method (MS&S)
The proposed modification of this work to the S&S methodology is also based on the Vmin concept to obtain the internal flows in the column and the Underwood equations for each section, as reported by Sotudeh and Sharaki [
16]. As discussed above, while the
application provides a good initialization of flows throughout the columns, it lacks equations to determine the columns stages. The S&S methodology uses basic Underwood equations to determine both the flow rates and the structural setup. However, while the method provides initialization values for DWC calculations, they show a systematic deviation from the optimal configuration, as will be demonstrated by the results from this work. Such differences from the optimal design could be attributed to the constant relative volatilities and constant molar flows assumptions used in those methods. Another factor is the selection of the recovery of component B at the top of the prefractionator, which affects the Vmin calculation. Additionally, the selection of the liquid split given by S&S restricts the search for an efficient design. Therefore, in this work, a different approach based on the Vmin calculation is proposed, but instead of assuming constant molar flows, a process simulator is used to obtain the flow rates throughout the column. Once the flows and compositions are obtained, the Underwood’s equations are used to calculate the theoretical number of stages in the column, with the equations given by Sotudeh and Shahraki [
16]. Details of the methodology are discussed next.
Following
Figure 7, the first step in the proposed methodology is to solve the overall mass balance equations to determine the product stream flows, i.e.,
depicted in
Figure 3. Then, the configuration of the shortcut DSTWU and the rigorous Radfrac column blocks for each section of the Petlyuk arrangement are used to calculate Vmin. The specified product recoveries are configured with higher values for this calculation, and the calculation of the number of stages (i.e., Equations (6) and (7)) depends on the internal flow rates obtained from the minimum vapor flow.
Once the minimum vapor has been identified from Equation (2), the liquid and vapor flows and compositions inside the column are obtained using the minimum vapor flow, and the product streams values previously obtained. The calculations are first carried out using in the first iteration; however, if an indetermination is found in the calculation of the number of stages, then the minimum vapor is increased by 10% until real values for the number of stages in column sections are obtained. Furthermore, flows and compositions of streams and at the top and bottom of the prefractionator obtained with the Radfrac module are fixed in order to obtain flows and compositions of and through material balances.
The next step is to evaluate the number of stages of every section of the column using Equations (6) and (7) for
Section 3, along with equations reported by Sotudeh and Shahraki [
16]. It is important to note that in the MS&S method, the heuristic of setting the reflux ratio as 1.2
is not used, as the number of stages are calculated based on the minimum flows.
Once the number of stages for
Section 2 and
Section 3 has been determined (see
Figure 3), Equation (11) is applied to fix the same number of stages for the prefractionator and for the side-draw section of the main column, as in the S&S methodology. Finally, liquid and vapor split between the prefractionator and the main column are specified using 1.2 times the values obtained with the minimum vapor for the split AB/BC in the prefractionator. Equation (12) is used to calculate the location of the feed stage in the prefractionator. The number of stages is configured according to the sections depicted in
Figure 6. Rigorous simulations are used to meet design specifications for the three product purities using the reflux ratio, the side draw flow rate and the boilup ratio (V/B) as manipulated variables.
2.5. Optimal Design of DWCs
The optimal design was developed as a benchmark to compare the structures obtained from the four design methodologies described above. The optimization task was performed using the Genetic Algorithm (GA) code available in MATLAB
®, coupled with the Aspen Plus process simulator. The optimization problem consists of a constrained, mixed-integer optimization model, and the model is given by Equations (13)–(19).
Total annual cost (TAC) was used as the fitness function (Equation (13)), which includes capital and operating costs. Seven decision variables were considered: feed stage (
); number of stages in the prefractionator (
); liquid split stage number (
); number of stages of the main column (
); sidestream stage (
); liquid split (
); and vapor split (
). Additionally, three design specifications were configured to ensure product purities by using the reflux ratio, sidestream flow rate and boilup ratio as manipulated variables. The minimization was subjected to design purity requirements of 99 mol% of the desired products. The parameters considered in the genetic algorithm were 100 individuals, 250 generations, and cross over and mutation factors of 0.8 and 0.05, respectively [
29]. The sizing relationships and economic factors were taken from Luyben [
30]. A price of
$7.78 per GJ of steam was assumed. For the TAC calculations, a plant lifetime of three years was considered [
31]. To initialize the computations, we used the design values obtained with the modified Sotudeh and Shahraki design methodology presented in this work for all case studies.
3. Case Studies and Simulation Parameters
To examine the effect of the relative volatilities of the ternary mixtures on the performance of the design algorithms, five case studies with different ease of separation index
, as defined by Tedder and Rudd [
32], were selected. The ESI is an indicator of the separation difficulty (duty required) of the split A/B, with respect to the split B/C, such that if it is lower than 1, the A/B separation is more difficult; conversely, if it is higher than 1, the B/C separation is the one that is more challenging. The five case studies cover a suitable range of ESI, going from 0.18 to 1.86. Such case studies serve as a basis to investigate the effect of ESI on the methodologies to suggest a proper design methodology.
Table 1 shows the design data for the case studies. Saturated liquid feed was assumed, with a product specification of 99 mol%. As all mixtures were subjected to rigorous Radfrac blocks, the design specification option of the block was activated, along with the adjusted variable through the “
vary” option. Column pressure was set in order to allow the use of cooling water as the coolant. Cooling water is assumed to be available at 25 °C, with a temperature rise of 4 °C. A temperature difference of 10 °C was then used to set the distillate temperature to 39 °C [
31].
Parameter specifications are needed to simulate each design method. For the Vmin methodology, shortcut and rigorous blocks were configured with recoveries of 0.01 of light and heavy key components in the bottom and distillate streams, respectively [
11]. For the Triantafyllou and Smith’s method, the recoveries
for the light key component and
for the heavy key component recoveries in distillate were configured to provide a balance between minimization of overall vapor flow and capital cost [
8]. As far as the MS&S methodology is concerned, the recoveries were configured as
for the light and
for the heavy key components at the top product for each binary separation.
4. Results and Discussion
Each design methodology aims to provide feasible design parameters to initialize the columns and then apply an optimization technique if required. Therefore, this section compares the main parameters of the DWC designs obtained with each methodology. To carry out a fair comparison of the DWC designs, product purity specifications of 99 mole% were used for all products. It is important to note that although product recoveries were not used as product specification constraints, product recoveries for all case studies are greater than 0.99 for the light and heavy products (A and C) and greater than 0.97 for the intermediate product (B).
4.1. Results for Mixtures with ESI Close to 1
4.1.1. Case Study Involving Benzene, Toluene, and o-Xylene (BTX)
Table 2 shows the designs obtained for the benzene, toluene and o-xylene (BTX) mixture for the dividing wall columns. L-p and V-p represent the liquid and vapor flow rates going from the main column to the prefractionator, while QC and QR represent the condenser and reboiler column heat duties. The TAC relative difference of each methodology with respect to the optimal design is reported in the last row of the table.
It can be observed that the MS&S methodology is the closest to the optimum design considering the TAC as the objective function, followed by the Vmin, T&S and S&S methodologies.
It is worth noting that the number of stages of the main column obtained with MS&S methodology has only one stage of difference with respect to the optimal design. In addition, the internal flows are similar, with small differences in the flow rates of liquid and vapor through the prefractionator of 1.3% and 5.8%, leading to a reboiler heat duty 4.6% higher than the optimum design, with an overall TAC difference of 3.9%.
The design based on the Vmin methodology required heuristics to configure the column because this method lacks equations to calculate the number of stages. The main column resulted in five more stages than the optimal design, with different interconnecting stages. Nonetheless, the flow rates obtained with the minimum vapor led to a design with a good economic performance, with a TAC difference of 5.7%.
The arrangement provided by the T&S methodology was 6.1% higher in TAC than the optimal design. The results showed that it had only one more stage in the main column and two more in the prefractionator, providing fairly similar internal flows.
The worst design was provided by the S&S methodology, with a TAC 21% higher than the optimal design. This significant deviation can be attributed to the uncertainty in the definition of parameters such as the reflux ratio and the arbitrary definition of the liquid split. According to the authors [
16], the operating reflux ratio should be fixed at 1.2 times
, and the liquid split is set as the upper bound of Equation (5). It is clear that this selection should be subjected to further analysis.
The MS&S methodology also led to a design close to the optimal one. Its effectiveness is related to the nature of the procedure. The results from the fast methods in the DSTWU block are improved by transferring the information to the rigorous Radfrac block. As a consequence, a reflux ratio close to the optimal value was obtained. Furthermore, the internal flow rates obtained by the adapted minimum vapor (Vmin) methodology provided values close to those from the optimum structure.
4.1.2. Case Study Involving n-Pentane, n-Hexane, and n-Heptane (PHH)
Table 3 contains the results for the PHH mixture. As in the previous case study, the S&S methodology showed a poor economic performance. The calculation of the internal flows and the column structure resulted in lower stages for both the main column and the prefractionator so that a high reflux ratio was required. All other methods provided good designs with respect to the optimal structure.
4.2. Results for the Case Study with ESI > 1.5
Case Study Involving n-Butane, i-Pentane, and n-Pentane (BPP)
Compared to the previous case studies, the system with ESI = 1.86 required a larger stripping section since the P/P separation is more difficult than the B/P split. The optimal design required 102 stages in the stripping section of the main column and 21 in the rectifying section. As shown in
Table 4, most of the methodologies calculated the stripping section with a good degree of accuracy. However, the S&S methodology underestimates the stripping section (95 stages), leading to a very high reflux ratio, and consequently, a TAC value 157% higher than that of the optimal design. It was observed that the liquid (L-p) and vapor (V-p) flow rates from the main column to the prefractionator had deviations from the optimal structure of 47.7% and 53.4%, respectively.
For this case, the MS&S, the T&S and the Vmin methodologies obtained good results compared to the optimal design.
4.3. Results for Mixtures with ESI < 0.5
4.3.1. Case Study Involving i-Butane, n-Butane, and n-Hexane (BBH)
In this case, the rectifying section needed more trays (e.g., 75 stages with the proposed methodology) than the stripping section (10 stages for the same design) of the main column (see
Table 5). The MS&S, as well as the S&S and the T&S methodologies, yielded good designs in terms of TAC. On the other hand, the Vmin methodology provided a poor design, which is related to the interconnecting flows between the prefractionator and the main column estimated by this method. As a complement to this analysis,
Figure 8 shows the results of a sensitivity analysis on interconnecting streams and their effect on the reboiler heat duty. One can see how the operating point provided by the Vmin method lies far from the minimum point.
4.3.2. Case Study Involving i-Pentane, n-Pentane, and n-Hexane (PPH)
Table 6 shows the result for the i-pentane, n-pentane, and n-hexane (PPH) mixture. In this case, the S&S and the Vmin had higher deviations from the optimal design. Therefore, these results seem to indicate that for mixtures with low ESI values, the Vmin methodology may not provide suitable DWC designs.
4.4. Comparison of the Design Methodologies
The results for the economic performance of the four methodologies used in this work are summarized in
Figure 9. It can be observed that for low ESI values, the Vmin approach provided structures with poor economic performance. This result is associated with the calculation of minimum flows that resulted in higher heat duties than those required by the optimum design. As a result, the TAC differences with respect to the optimum were 181% and 236% for the PPH (ESI = 0.47) and BBH (ESI = 0.18) mixtures, respectively. For the mixture with ESI = 0.47, the structure obtained with the S&S method was also far from the optimal design in economic terms.
For the mixture with ESI = 0.83, the differences were the least noticeable from all of the case studies, with the Vmin and T&S methods, along with the MS&S approach, providing excellent results. On the other hand, the performance of the S&S method was not that good, as it deteriorated further as mixtures with higher ESI values were tested; for the mixture with ESI = 1.04, the design provided by that method showed 100% higher TAC than the optimal design, and for the mixture with ESI = 1.86, the deterioration increased to more than 150%. This behavior can be attributed to the trend to underestimate the number of stages, leading to higher requirements of the reflux ratios, and therefore higher energy consumption. Additionally, interconnecting flow rates differed significantly from the optimal design. The other methods performed well for these last three cases. The T&S method stands out when taking into account all case studies. TAC differences with respect to the optimal design ranged from 4% to 38%.
If one design method analyzed here is considered for a specific application, the results given in
Figure 9 can be used as an initial selection guide based on the separation properties of the mixture. Overall, it can be observed how the MS&S methodology was consistent in its effectiveness to provide designs close to the optimal solutions, with better economic performance than the other three methodologies considered in this work. The differences observed in TAC ranged from 1% to 26% with respect to the optimal structures. This methodology overcomes the shortcut methods limitations by correcting the values obtained in each column section with rigorous methods. It also highlights that theoretical Underwood equations give reasonable estimations of column stage numbers in the sections, if appropriate values for the flows in the column are available. In terms of its computational performance, the case studies dealing with BTX and PHH required only one iteration to converge; internal vapor flow rate
(see
Figure 6) at the top of the main column provided a good specification. Case studies BPP and PPH required two iterations, while case study BBH needed four iterations to converge.
Figure 9 shows the significant differences provided by the Vmin methodology with respect to the S&S methodology. Although both methodologies use the Vmin diagram as a basis to determine the internal liquid and vapor flow rates, the equations to configure the structural arrangement are different. While the S&S methodology uses the basic Underwood equations for such calculations, the Vmin lacks equations for the structural arrangement. In this work, the DWC structural arrangement with the Vmin method was obtained by setting the number of stages of the main column as twice the sum of the minimum of stages of the A/BC and AB/C binary separations. Therefore, the differences in the economic performance between these two methods can be attributed to the equations used to determine the structural arrangement and to the mixture properties, characterized by the ESI.
4.5. Selection of the Liquid Split in the S&S Methodology
According to Sotudeh and Shahraki [
16] the upper limit of the liquid split in Equation (3) should be selected to carry out the internal flow calculations. To examine the effect of this variable,
Table 7 contains the results of the designs obtained with other limits for each case study. Mixtures with ESI values near 1.0 obtained improved designs with the use of the lower limit; for the BPP design, which had a difference of 157% compared to the optimal TAC, the difference was reduced to 20%. On the other hand, the designs obtained for the BBH and PPH mixtures moved away from the optimum. As the optimal parameters of the DWC are not available in the early stages of design, this methodology should analyze structures obtained for both extreme points of the liquid split (Equation (3)). It should be noted that this problem of liquid split selection is avoided in the proposed MS&S approach presented in this work.
4.6. Perspectives and Future Directions
DWCs stand out as a potential sustainable separation technology. The proper selection of the design methodologies becomes an essential step towards designing near-optimal DWCs, with an associated reduction of energy consumption with respect to conventional separation sequences. This work aimed at providing useful rules for the selection of a suitable DWC design method related to the ESI values of the mixture to be separated. Still, additional case studies can be investigated to broaden the results from this work. Furthermore, the effect of feed composition on the behavior of each design methodology remains to be analyzed; this will be the subject of future work.
Table 8 summarizes the advantages and drawbacks of the design methodologies investigated in this work. It is important to note that such methodologies have been developed for their application to separate non-azeotropic mixtures. The application to azeotropic mixtures is an intriguing avenue for future research.
5. Conclusions
Analysis of commonly used design methodologies such as the Triantafillow and Smith (T&S), Vmin and the Sotudeh and Shahraki methods, and a proposed modified methodology (MS&S) have been presented. A comprehensive discussion of the comparison of the parameter effectiveness for rigorous simulation initialization has been made. Furthermore, comparisons were conducted with respect to optimal economic designs considering the total annual cost as the design objective, which allowed identifying the advantages and drawbacks of each methodology. Five case studies with significantly different ease of separation indexes were investigated.
Methodologies are based on different principles, either fixing operational variables or structural arrangements as the main factors. It was demonstrated that the implementation of the T&S methodology in a process simulator provides efficient designs, which showed excellent economic performance, particularly for the mixtures with ESI values higher than 0.5. The Vmin methodology also provided very good designs for mixtures with ESI > 0.5, but its performance for low ESI values in economic terms was rather poor; liquid and vapor split values become critical design parameters. Designs obtained with the S&S methodology can return feasible designs, but only if liquid splits are carefully configured. In this case, one action could be to compare two different designs obtained by using the upper and lower limits of the liquid split .
The proposed modification (MS&S) approach follows the basic principles of the S&S methodology, combined with the assumptions made in the Vmin calculations, which were then corrected with rigorous models in a process simulator. Thus, it eliminates the need to arbitrarily select a liquid split value within an interval, as is the case in the S&S method. A major advantage of the proposed modification is that it can be easily implemented in any process simulator to provide excellent, near-optimal economic designs.


 ,
, 


