Abstract
The pressure fluctuation inside centrifugal pumps is one of the main causes of hydro-induced vibration, especially at the blade-passing frequency and its harmonics. This paper investigates the feature of blade-passing frequency excitation in a low-specific-speed centrifugal pump in the perspective of local Euler head distribution based on CFD analysis. Meanwhile, the relation between local Euler head distribution and pressure fluctuation amplitude is observed and used to explain the mechanism of intensive pressure fluctuation. The impeller blade with ordinary trailing edge profile, which is the prototype impeller in this study, usually induces wake shedding near the impeller outlet, making the energy distribution less uniform. Because of this, the method of reducing pressure fluctuation by means of improving Euler head distribution uniformity by modifying the impeller blade trailing edge profile is proposed. The impeller blade trailing edges are trimmed in different scales, which are marked as model A, B, and C. As a result of trailing edge trimming, the impeller outlet angles at the pressure side of the prototype of model A, B, and C are 21, 18, 15, and 12 degrees, respectively. The differences in Euler head distribution and pressure fluctuation between the model impellers at nominal flow rate are investigated and analyzed. Experimental verification is also conducted to validate the CFD results. The results show that the blade trailing edge profiling on the pressure side can help reduce pressure fluctuation. The uniformity of Euler head circumferential distribution, which is directly related to the intensity of pressure fluctuation, is improved because the impeller blade outlet angle on the pressure side decreases and thus the velocity components are adjusted when the blade trailing edge profile is modified. The results of the investigation demonstrate that blade trailing edge profiling can be used in the vibration reduction of low specific impellers and in the engineering design of centrifugal pumps.
1. Introduction
The centrifugal pump is a typical kind of vane pump working as rotating machinery that makes use of the centrifugal force of the convey fluid as the impeller rotates. The fluid obtains mechanic energy from the impeller while flowing through the passages between the blades rotating at a high speed. Considering that there is an inseparable relation between flow field and pump fluctuations generated by hydraulic factors, emphasis should be laid on the improvement of flow field quality.
It is believed that hydraulic fluctuations are fundamentally generated by the non-uniformity of energy distribution at the impeller outlet [1]. This kind of non-uniformity comes into existence due to multiple reasons, for instance, the flow separation in the impeller, or the interaction between the impeller and the volute tongue or guide vane [2,3]. Several studies have been carried out to improve the flow field for the purpose of reducing hydraulic fluctuations. Dong et al. [4] experimentally confirmed that noise and pressure fluctuations were significantly reduced by enlarging the gap between the impeller and the tongue by up to 20%, and by inserting short vanes between blades. Yan et al. [5] stated the importance of the uniformity of circumferential energy distribution on pressure fluctuation performance. They employed the local Euler head as a tool to visualize the energy growth inside the impeller and energy distribution in the impeller as well as the volute. Gao and Zhu [6] predicted the pressure fluctuations in a centrifugal pump with static guide vanes numerically and compared the numerical results to the experimental data. The unsteady RANS (URANS) method is used to capture the flow detail of a propeller’s unsteady hydrodynamics. Majidi [7] applied the URANS model to solve unsteady three-dimensional viscous flow inside the entire impeller and volute case of a centrifugal pump, and the periodically unsteady results confirmed the interaction between impeller and volute tongue. Barrio et al. [8] applied a well-validated URANS to study the flow pulsations associated with the interaction between the impeller blades and the volute tongue under several flow rates ranging from 20% to 160% of the nominal flow rate. Capurso et al. [9] designed a novel impeller for a double suction pump and analyzed the flow fields by solving 3D URANS in an openFOAM platform. Stuermer and Akkermans [10] used URANS with high spatial and temporal resolution on aerodynamic and aeroacoustic predictions of a contra-rotating open rotor. The noise directivities of the rotor as well as the interaction tones showed a good correlation with the experimental data both in terms of shape and magnitudes. Wei and Wang [11] studied the unsteady hydrodynamics of blade forces of a submarine propeller based on the URANS method.
There are also former research works that focused on the suppression of pressure fluctuation and vibration by modifying the geometry of pump parts. Wu and Yan [12] presented a methodology for improving pump performance by changing the blade trailing edge profile. They compared mixed flow impellers with different profiling, finding out that the flow field in impeller is influenced. Gao and Zhang [13] studied a series of centrifugal impellers with different blade trailing edge profiling. They concluded that the impeller with modification on the pressure side of trailing edge has better pressure pulsation performance, which is explained by the improvement of vortex intensity around the blade trailing edge area. Zhang and Liu [14] investigated the effects of the blade trailing edge profile on pressure pulsations and flow structures in a centrifugal pump with low specific speed. It was found that the head and efficiency rise when the pressure side of impeller trailing edge is trimmed. Weme and van der Schoot [15] introduced a prediction method based on the simplified description of flow field in the impeller to assess the influence of trimming on the hydraulic performance. Binama and Su [16] studied the influence of blade trailing edge position on pressure field in a pump as turbine (PAT). Ni and Yang [17] conducted a numerical study on the influence of diffuser blade trailing edge profile on flow instability. They found that the vortex shedding can be diminished by modifying the blade trailing edge profile and that the suction surface trailing edge trimming can reduce pressure pulsations at diffuser outlets. In addition, a good example of active control is Akkermans et al. [18], who applied trailing-edge blowing to actively reduce the momentum deficit of the front rotor wake, and therefore the interaction with the aft rotor. They found the aerodynamic performance is barely changed, and the interaction tone noise is notably decreased.
Li and Gao [19] reduced pressure fluctuation and radial force of a centrifugal impeller by adjusting the blade load distribution along a streamwise location. They found that an impeller model with fore-loading had a better performance in reducing pressure fluctuations and vibration. Tao and Yuan [20] modified slurry pump impeller blade thickness and investigated the difference in transient flow character. They found that the pressure fluctuation intensity at the impeller outlet increases when the blade thickness increases. Li et al. [21] introduced an impeller, whose blades had variable thickness along a streamwise location, into a low specific-speed centrifugal pump and achieved a good performance of pressure fluctuation. Barrio et al. [22] investigated the relation between radial load and unsteady pressure fluctuation. Tan et al. [23] studied the influences of a radial diffuser on a single-stage centrifugal pump and improved radial diffusers by controlling the diffusion coefficient. Alemi et al. [24] studied radial force reduction by changing the geometry of the volute and introducing a triple-volute to help reduce radial forces. Solis et al. [25] studied the influence of splitter blades and radial gap on pressure fluctuation reduction and emphasized the importance of splitter blades and volute geometry. Zeng et al. [26] investigated the effect of the parameter of splitter blades on unsteady pressure radial force pulsation and the vibration was reduced by moderately adding splitter blades.
Although numerous studies have investigated the cause of pressure fluctuation in centrifugal pumps and introduced methods to reduce it, there are few works on reducing pressure fluctuation by modifying the blade trailing edge profile and analyzing it in light of energy redistribution.
In this study, the flow field in the centrifugal pump is investigated with Euler head distribution analysis at a nominal flow rate, since the pressure fluctuation is induced by the nonuniformity of energy circumferential distribution and can be reduced by improving the energy distribution uniformity. In order to describe energy distribution uniformity, the Euler head is introduced and used in the numerical investigations. It can be assumed that impellers with better uniformity of circumferential Euler head distribution have lower pressure fluctuation intensity [1]. A method to improve the circumferential distribution uniformity of the Euler head to suppress pressure fluctuation is proposed. The blade trailing edge profile of the prototype pump is trimmed to a different scale to improve the circumferential distribution uniformity of the Euler head. The relevance between energy distribution uniformity and pressure fluctuation intensity is also displayed in the results.
The paper is organized as follows: Section 2 introduces the reference pump and validates the computational grid quality, Section 3 presents the pressure pulsation and Euler head analysis at nominal flow rate on reference impeller and three modified impellers and is validated through experiments, and Section 4 elaborates on the conclusions drawn from this research.
2. Model and Numerical Methods
2.1. Pump Parameters
This study is based on a single suction centrifugal pump with a volute. The pump was designed to operate at a flow rate of 18 m3/h, which is also the simulation flow rate for all unsteady cases in this paper. The required head is 24.5 m. The impeller of the pump has 7 blades and 7 splitters. Its specific speed is , where (rpm) is the rotational speed of the impeller, and (m3/s) and (m) are the flow rate and head, respectively. The parameters of the prototype pump are shown in Table 1. The blade angle of the inlet varies from 61.2°
to 21.7° along with the spanwise location from hub to shroud. It is worth noting that in this paper, the prototype impeller refers to the impeller with an ordinary blade trailing edge profile.

Table 1.
Factors and their levels.
2.2. Computational Domain and Grid
The computational domain was divided into four parts, which were impeller, front impeller side room, back impeller side room, and volute. Meanwhile, the inlet of impeller and outlet of volute were both extended with tubes to minimize the effects of reverse flow on the key flow field in the impeller and volute. The computational domain is shown in Figure 1. It consists of an impeller, a volute, two impeller side gaps, and extension tubes. The commercial software ANSYS ICEM CFD was used to generate structured grids. The grid of the prototype impeller is displayed in Figure 2. The grids near the walls were carefully refined and the y+ of the key surfaces in the impeller and impeller side gaps was within 50 and 15, respectively.
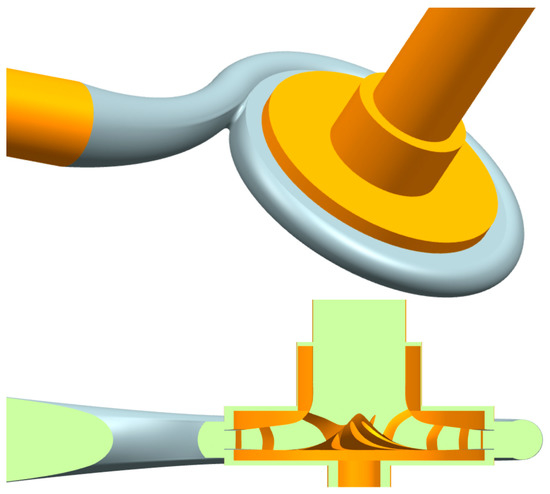
Figure 1.
Model view of the pump.
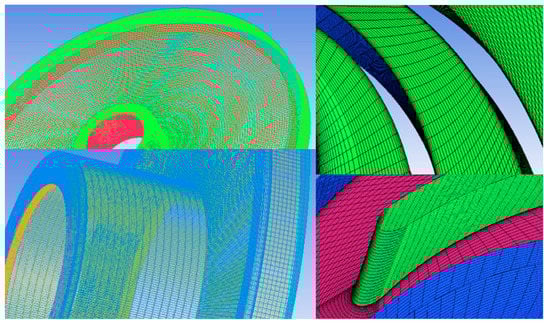
Figure 2.
Mesh view of the prototype impeller.
Figure 3 shows the results of the grid sensitivity test on the prototype impeller at the designed flow rate. It is noticeable that the results converged when the number of impeller grid cells was 1.6 million. The total quantity of grid cells of the whole model was 2.2 million and the grid quality was checked.
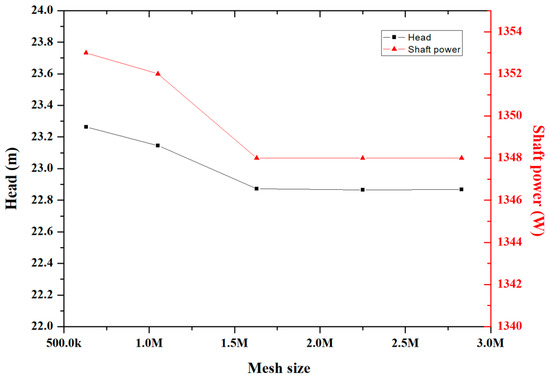
Figure 3.
Results of mesh sensitivity test at the designed flow rate.
2.3. CFD Method and Boundary Conditions
The commercial CFD code ANSYS Fluent 14.5 was used to conduct the numerical simulation. Two-equation models are widely used in industry applications due to relatively low calculation costs and good accuracy. The steady realizable k-ε model was employed to treat the incompressible fluid with the Enhanced Wall Treatment function. The Multiple Reference Frame approach was used in steady simulations. The boundary types of inlet and outlet were set as “velocity inlet condition” and “pressure outlet condition”, respectively. The SIMPLEC algorithm was selected to couple velocity and pressure. The second order upwind scheme was selected for the discretization of the convection terms in the momentum, turbulent kinetic energy, and turbulent dissipation rate equations.
The unsteady Reynolds-averaged Navier–Stokes (URANS) was applied for the unsteady simulation of the models, whose results were prepared for pressure fluctuation analysis. The URANS method can deal well with near-wall and far-field flows, and can predict non-equilibrium regions in boundary layers with adverse pressure gradients accurately [11]. The time-step length of the unsteady simulations was 5.65 × 10⁻⁵ s, which was the length of time for the impeller to rotate one degree. The other settings were the same as the steady simulation.
3. Results
3.1. Pressure Fluctuation and Euler Head Analysis
3.1.1. Introduction of Euler Head
The Euler head is the centrifugal pump theoretical equation indicating the kinetic energy of fluid in the rotating impeller and can be used to study the internal energy distribution in the impeller flow area. Former investigations have employed the Euler head to study the energy distribution in impellers [5,22]. Equation (1) shows the definition of the Euler head:
is the peripheral speed (m/s) of the control volume at the local position and is the absolute circumferential component velocity (m/s) of the control volume at the local position.
The Euler head distribution along the circumferential location can reflect the energy distribution uniformity. Measures can be taken to improve the uniformity of Euler head circumferential distribution to reduce the pressure fluctuation intensity of the impeller. The blade trailing edge profile in the traditional impeller is normally like the prototype impeller in Figure 4. This blade trailing edge profile pattern usually induces wake shedding near the impeller outlet, which contributes to the disorder of the circumferential Euler head distribution, strengthening the pressure fluctuation. For the purpose of mitigating this effect, a series of modifications to the blade trailing edge profile were put forward.
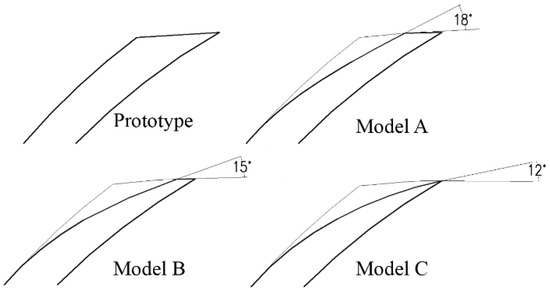
Figure 4.
Modifications to the blade trailing edge.
3.1.2. Modifications
Based on the prototype pump introduced above, a set of modifications to the blade trailing edge profiles were conducted. As a result of the modifications, the outlet angle of the blade pressure side became relatively smaller than the blade suction side outlet angle. These modifications had different outlet angles. Figure 4 shows the details of these modifications. The blade angle at the trailing edge () of prototype was 21 degrees. The pressure side outlet angle of models A, B, and C was 18 degrees, 15 degrees, and 12 degrees, respectively.
3.1.3. Pressure Fluctuation Analysis
The pressure fluctuations performances of the modifications and prototype pump were predicted and compared through unsteady numerical simulations for the purpose of investigating the influence of the blade trailing modifications on the hydraulic fluctuation. The unsteady numerical simulations were conducted at the nominal flow rate of 18 m3/h with a rotating speed of 2950 r/min. The virtual monitor points were set near the impeller outlet, whose specific positions are presented in Figure 5. These monitor points were equidistantly distributed in a circle with a diameter of 152 mm, and the angle varied from θ = 0° to θ = 315°. The pressure fluctuation of the prototype pump and the modifications were predicted at the nominal flow rate and processed into pressure spectra by means of Fast Fourier Transformation (FFT), with the spectra at four monitor points, which are shown in Figure 6.
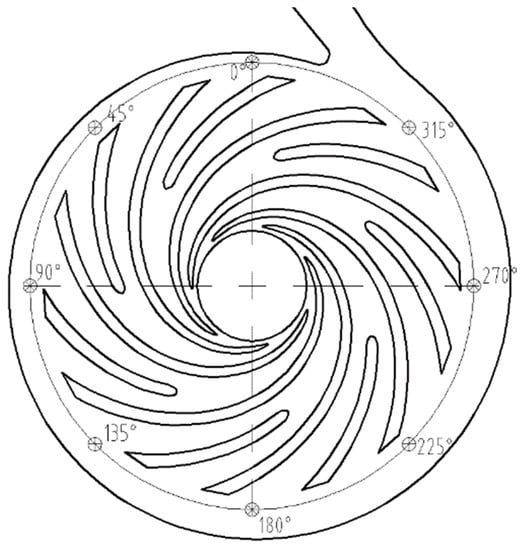
Figure 5.
Position of the virtual monitor points.
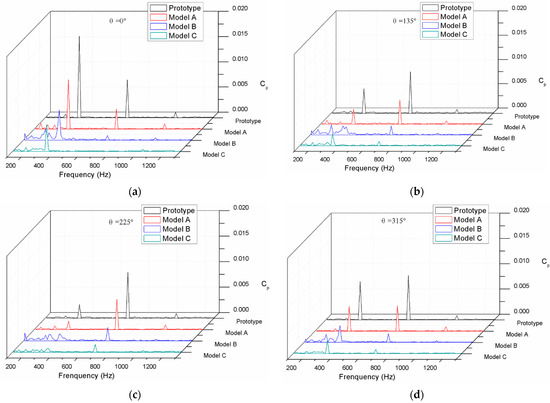
Figure 6.
Pressure fluctuations spectra of the prototype and the modifications at monitor points: (a) ; (b) ; (c); (d).
According to Figure 6, the blade-passing frequency was 688 Hz where the amplitudes were dominant among the frequency domains. The simulation result that the amplitudes were dominant at agrees with former research that showed that the blade–tongue interaction is the main source contributing to pressure fluctuations [21,25]. The amplitudes of the spectra at eight monitor points were normalized and are presented in Figure 7. Because of the employment of splitter blades, there was another peak, whose amplitudes are shown in Figure 8, and was motivated at the frequency of 344 Hz, which is half of the . As is seen in Figure 7, the spectra amplitudes at and 0.5 of the four models were distributed at the eight circumferential positions in a nearly synchronized manner. The difference of the amplitudes of the four models can be clearly figured out, which indicates that there was a gradient of pressure fluctuation intensity among the four models. The prototype had the strongest pressure fluctuation intensity, followed by models A, B, and C. Former investigations [5,13] have demonstrated that the amplitudes at the circumferential position should present a tendency with 14 local peaks and valleys because of the blade–tongue interaction. However, there were only eight monitor points, so it was unable to be exhibited. The pressure fluctuation curves of the prototype and the modifications at the circumferential positions against the time domain are presented in Figure 8. The figures show the static pressure plots within the time of one circle. It is shown that the curves of the prototype had stronger fluctuation and the fluctuation intensity was gradually mitigated from Model A to Model C. The standard deviations of the pressure fluctuation plots around the circumference of the impeller outlet were also extracted and normalized in Equation (2), which can be regarded as an indicator of pressure fluctuation intensity.
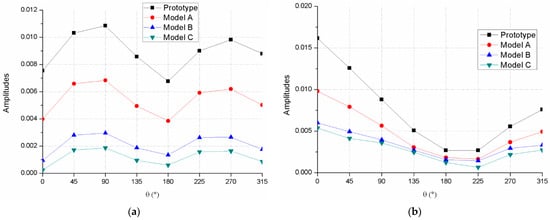
Figure 7.
Comparison of spectra amplitudes at (a) ; (b) .
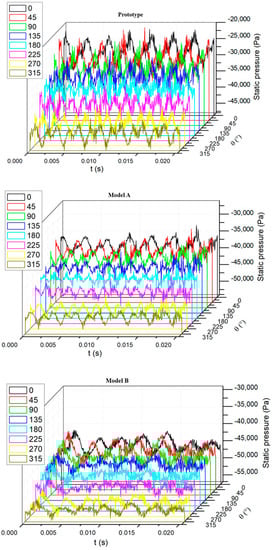
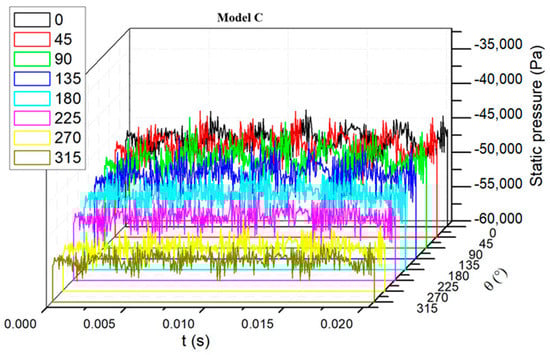
Figure 8.
Pressure fluctuation at the circumferential positions against the time domain.
is the time step number in a circulation and is the time-averaged static pressure of control volume at the local position.
Figure 9 shows the circumferential distributions of the pressure fluctuation intensity of the models. As is shown in Figure 9, the normalized standard deviations of the four models showed a similar pressure fluctuation intensity distribution. The pressure fluctuation intensity of the models can be compared. Therefore, it is concluded that with the enhancement of blade trailing edge modification, the pressure fluctuation is suppressed.
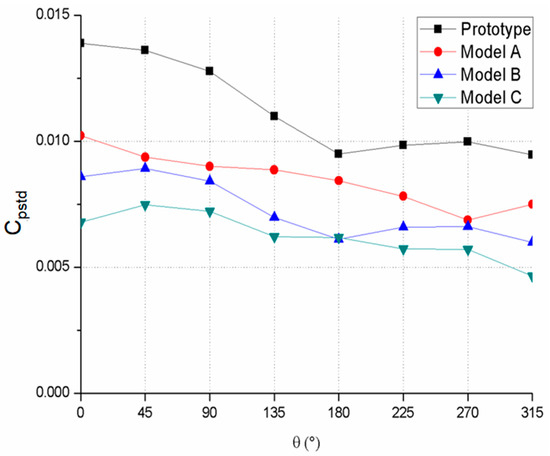
Figure 9.
Circumferential distributions of the pressure fluctuation intensity.
3.1.4. Euler Head Distribution Analysis
Figure 10 gives the normalized Euler head distribution of the four models on the streamwise location. The rising curves display how the fluid obtained kinetic energy in the impeller. The Euler head was averaged on the circumference and normalized with Equation (3). The streamwise location in the impeller was specially defined. The inlet of impeller was set as 0 and the outlet as 1 on the streamwise location in a linear order. The leading edge of the splitter blade was at 0.5 in the streamwise location, so it was noticeable that the curve slope was higher in the second half. The modifications had almost the same tendency along the whole range, which is similar to the results of the blade trailing edge modification on a mix-flow pump conducted by Wu et al. [12]. In addition, the curve of the prototype rose faster than the three modifications. There was a Euler head drop near the outlet area, where there were no impeller blades transporting energy. The Euler head drop of the prototype was evidently larger than those of the modifications. This shows that the trailing edge trimming made the streamwise change in energy become milder. There were still slight differences between the modifications, which means that the scale of trimming on the blade trailing edge also made a small difference. It can be explained that when the impeller blade trailing edge is cut on the pressure side, the change of blade angle affects the work capacity of the blade near the trailing edge, thus affecting the energy distribution.
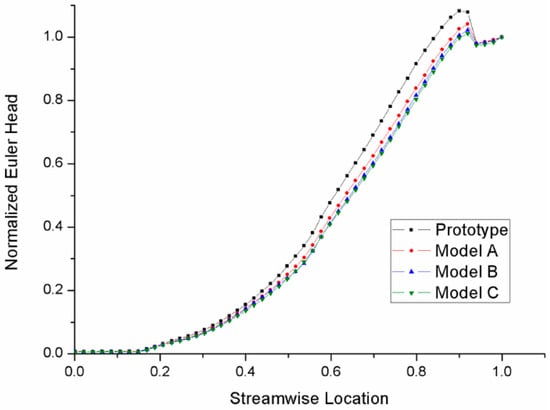
Figure 10.
Normalized Euler head distribution in the streamwise location (span = 0.5).
Figure 10 displays the energy distribution in the whole streamwise range. The energy distribution near the outlet area of the impeller on the circumference was also analyzed. The circumferential Euler head distributions were extracted out of the impellers of the four models from static simulation results and are displayed in Figure 11. The Euler head data were collected at a surface of revolution whose center was located at the axis of the impeller. The radius of the surface of revolution was 72 mm, with a gap of 6 mm to the trailing edge of the impeller blades. The Euler head data at the same angular position were recorded. As observed in Figure 11, the normalized Euler head curves of the prototype and Model A were similar, with 14 peaks and 14 valleys due to the 14 impeller blades. The deep valley among θ = 300° and θ = 330° area was influenced by the volute tongue. When it comes to Model B, the normalized Euler head distribution had a different pattern than the prototype and Model C. As for Model C, there were only seven peaks and valleys. In addition, the peaks and valleys of the Model C curve were two times the width of the peaks and valleys of the prototype and Model A curves. It is assumed that the sharpened blade trailing edge of Model C had an evident influence on the circumferential distribution of the Euler head so that the two adjacent high Euler head regions combined together. The pattern of the Model B curve was supposed to be a transition state between Model A and Model C, whose peaks and valleys fluctuated much more mildly than those of the prototype and Model A. The fluctuation intensity in Figure 11, which is also regarded as the uniformity of the circumferential Euler head distribution, is a direct scale of energy uniformity. To assess the fluctuation intensity quantitatively, the standard deviation of the normalized Euler head was calculated. For the purpose of getting rid of the influence of the volute tongue, the standard deviation calculation area was set from θ = 0° to θ = 270°.
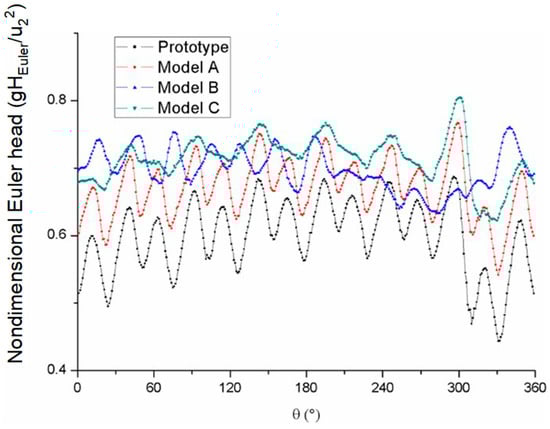
Figure 11.
Circumferential distributions of the Euler head.
Table 2 shows the standard deviations of the Euler head of the four models. The standard deviations of the three modified models were smaller than the prototype, which means that the modifications had better uniformity than the prototype. Meanwhile, there was a sequence of the three modifications rating by the scale of reduction in standard deviation, from which it can be inferred that the enhancement of the blade trailing modification led to a better uniformity of energy circumferential distribution at the impeller outlet. The effect of the blade trailing edge modification on the pressure side was obvious, as shown in Table 2.
Table 2.
Comparison of standard deviations.
3.1.5. Pressure and Local Velocity Analysis
Analysis in light of the Euler head distribution shows the influence of blade trailing edge modification on fluid kinetic energy, and its influence on static pressure distribution was recorded. Figure 12 shows the streamlines of the prototype and Model C between blades in a midspan surface in blade-to-blade mode. The streamlines were similar in the former part of the impeller, whereas there were differences near the outlet area. There were small higher relative velocity areas spreading at the outlet of the prototype than at the upstream area, which were induced by the blade trailing edge, whereas the relative velocity was almost uniform at the Model C outlet. The comparison of static pressure distribution between the prototype and Model C is shown in Figure 13. The static pressure distributions of the prototype and Model C were rather similar in most parts of the impeller, as was the state of the Euler head distribution in the streamwise location, as shown in Figure 10. The blade trailing edge modification did not affect the static pressure distribution in most of the impeller. Although there was an exception at the blade trailing edge, the contour lines of Model C showed better parallelism than those of the prototype, which means the static pressure was distributed more evenly at the same streamwise location.
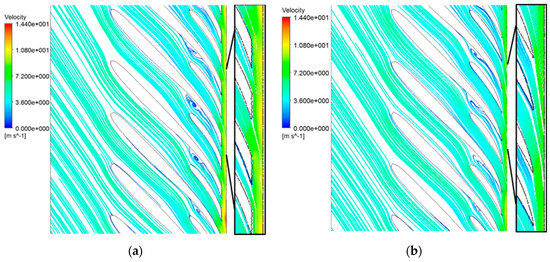
Figure 12.
Velocity streamlines of (a) the prototype; (b) Model C.
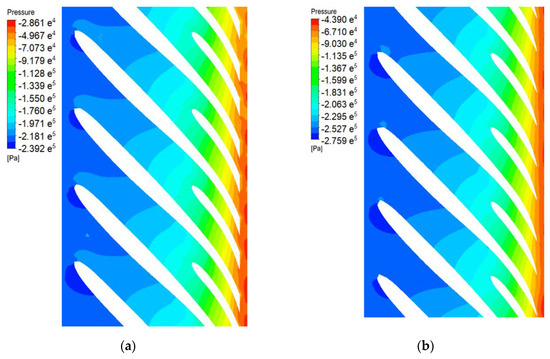
Figure 13.
Comparison of static pressure contours (span = 0.5) between (a) the prototype; (b) Model C.
In order to study the influence of blade trailing modification on the pressure side quantitatively and make the explanation above more persuasive, a set of monitor points was set up near end of the blades and the local velocities at the monitor positions were extracted and averaged. The monitor points were set near the blade walls because firstly, the main aim was to investigate the change in local velocity near the wall and secondly, the influence of blade trailing edge modification attenuated as the distance increased. Figure 14 shows the positions of the monitor points. Given the outlet of the impeller was near the interface with the volute, numerical error may have accumulated due to interpolation. The monitor points were respectively arranged on both sides of the blades 1 mm away from the blade wall and with radii of 65 mm, 63 mm, 61 mm, and 59 mm at span = 0.5. Moreover, there were other monitor points set around other blades with the same order of arrangement to ensure accuracy. The interaction between impeller and volute tongue may have influenced the local velocity of the blade nearby, so only the blades between θ = 45° and θ = 270° were selected as monitor blades. Table 3 shows the averaged local velocities of the monitor points. The letter w represents the relative velocity, β2 represents the fluid flow angle, and is same as Equation (1), representing the circumferential component of absolute velocity, which can be regarded as a feature of energy when compared to the same radius. As seen in Table 3, the relative velocity, fluid flow angle, and circumferential component of the absolute velocity of the two models on the suction side were basically the same, indicating that the blade trailing modification had almost no effect on the velocity there. Figure 15 provides images of the pressure side velocity triangle of averaged local velocities shown in Table 3. The blue arrow represents the relative velocity of the prototype and the red arrow represents the relative velocity of Model C. The letter u represents the circumferential velocity in the impeller and the fluid flow angles are marked respectively. The fluid flow angles of all points were similar to the nearby tangential blade angles, so the area from the R = 59 mm position to the R = 65 mm position could be considered one flow stream. The blade trailing modification of Model C starts at the radius of 59 mm on the pressure side. The relative velocities and fluid flow angles on the pressure side of the two models were quite similar, with a radius of 59 mm. The fluid near the blade flowed along the blade wall without any obvious flow separation and the flow angle at the pressure side of Model C gradually became small as it approached the pressure side outlet angle. The relative velocity of Model C rose as the flow stream went and eventually became bigger than the prototype on the pressure side. As a result, at a radius of 65 mm, the circumferential component of absolute velocity on the pressure side of Model C became smaller than the prototype. Therefore, the high Euler head area marked by a black circle in Figure 14 was adjusted. The adjustment was beneficial to the jet-wake phenomenon, and thus the slip factor phenomenon, which also explains why there was more curve and less peak and valley for Model C, as seen in Figure 11.
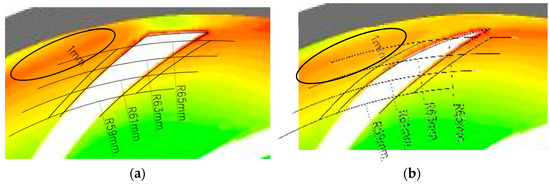
Figure 14.
Arrangement order of local velocity monitor points near the blades (span = 0.5): (a) prototype; (b) Model C.
Table 3.
Averaged local velocities of monitor points.
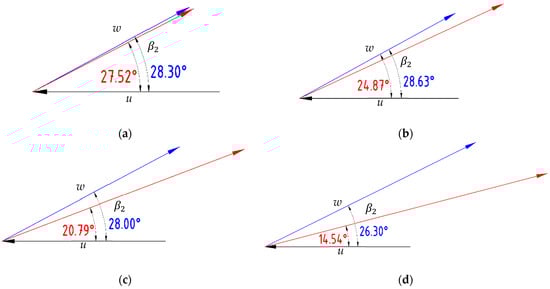
Figure 15.
Pressure side velocity vector triangle of averaged local velocities in Table 3: (a) R = 59 mm; (b) R = 61 mm; (c) R = 63 mm; (d) R = 65 mm. Black: peripheral velocity; blue: relative velocity of the prototype; red: relative velocity of Model C.
3.2. Methodology and Validation of Pressure Fluctuation Suppression
3.2.1. Hydraulic Performances
The hydraulic performances of the prototype and the modifications under five operating conditions were predicted by means of steady CFD calculations. The heads at different flow rates were normalized and the curves were fitted by B-Spline. The comparison of the head coefficients is shown in Figure 16. According to Figure 16a, the head of the prototype was under the modifications in all operating conditions. The difference in the three modifications also shows that the head rose as the blade trailing edge trimming advanced from Model A to Model C. The experiment results of Model B also agree well with the simulated results. Figure 16b shows the hydraulic efficiencies of the prototype and the modifications. According to Figure 16b, the hydraulic efficiencies of the modifications were above the prototype in all operating conditions. The high efficiency areas of the modifications were wider than those of the prototype at a large flow rate. The hydraulic efficiency also rose when the blade trailing edge trimming scale was enhanced. There were BEP shifts at the modifications but the efficiencies of the modifications at the designed flow rate were still acceptable, as they were not lower than those of the prototype. The numerical simulations demonstrate that the blade trailing modifications influenced the head and hydraulic efficiency at the same time.
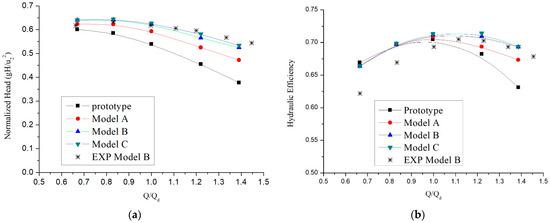
Figure 16.
Comparison of the external characteristics: (a) head coefficients; (b) hydraulic efficiencies.
3.2.2. Experimental Analysis
The Model B impeller in this study was manufactured and tested for hydraulic performance and vibration characteristics. In consideration of structural strength of the blade trailing edge, the Model B impeller rather than Model C was selected as an actual product. Figure 17a displays the schematic of the pump test rig. Two pressure sensors were deployed to measure the suction and discharge pressure and an electromagnetic flowmeter was set to monitor the flow rate. The accuracy and calculated errors of the instruments applied in the test are list in Table 4. The stars in Figure 16 are the heads and efficiencies of the Model B impeller at different flow rates. The experimental normalized head of the Model B impeller was close to the numerical result at the designed flow rate and partial flow rate, and the efficiency deviation exceeded no more than 5% at partial load, which shows good agreement with the CFD experimental results. The vibration acceleration of the pump with the Model B impeller at the designed flowrate was also collected. The reference sensitivity of the vibration sensor was 513.0 mV/g (52.31 mV/ms−2) at 159.2 Hz, 20 ms-2 RMS, and at 23.9 °C. The frequency range of the vibration sensor was between 0.3 Hz and 12.8 kHz (amplitude ± 10%) and 2 Hz to 1.5 kHz (phase ± 5°). The sampling frequency was 20,480 Hz. According to the parameters of the vibration sensor, it is considered adequate for the requirements of this study. The collecting position was set on the basal board between motor and pump, which is shown in Figure 17b. The real-time signal could be obtained to extract the frequency spectrum through FFT. The vibration acceleration spectrum against the frequency domain is displayed in Figure 18. It is clear that the vibration component mainly sat at the 694 Hz in the low-frequency band. This frequency corresponds to the total number of impeller blades together with the splitter blades. The experimental results show that the vibration acceleration of the pump at the nominal flow rate was well controlled with the modified impeller, which proves that the effect of the blade trailing edge profile modification had a good effect on the pressure fluctuation reduction. This blade trailing edge profiling pattern can also be applied to impellers with similar specific speeds for similar purposes.
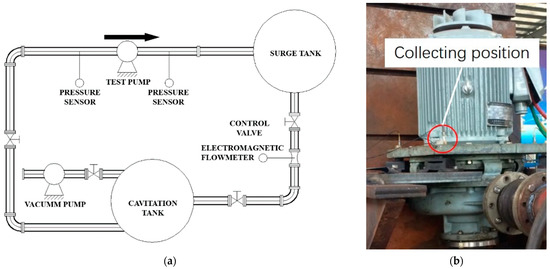
Figure 17.
Schematic of (a) the pump test rig; (b) the vibration acceleration sensor.
Table 4.
Accuracy and calculated errors of other instruments.
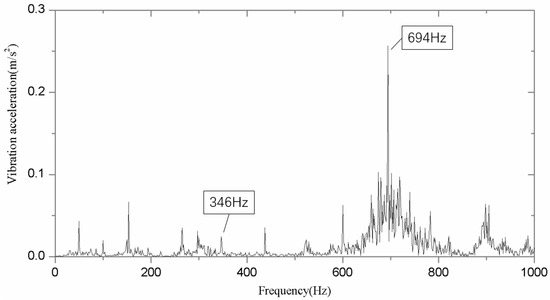
Figure 18.
Vibration acceleration spectrum against frequency domain.
4. Conclusions
The relation between energy distribution uniformity and pressure fluctuation intensity was seriously considered. The Euler head as introduced as a feature of fluid energy to assess the uniformity of energy distribution. The circumferential distribution of the Euler head was employed to describe the uniformity flow field near the impeller outlet. The circumferential Euler head distribution around impeller outlet was used as an index to evaluate the pressure fluctuation intensity. Therefore, the goal of reducing pressure fluctuation became improving the uniformity of the circumferential distribution of the Euler head.
For the purpose of improving the circumferential Euler head distribution uniformity, impeller blade trailing profile modifications were put forward and investigated for its influence on pressure fluctuation performance.
The blade trailing edge profile of the prototype induced wake shedding that brought nonuniform distribution of the Euler head. The blade trailing edge profile should be modified to adjust the Euler head distribution pattern. A series of modifications with different scales of blade trailing modifications were generated. By means of CFD simulation, the pressure fluctuation performances of the prototype and the modifications were compared. Although the prototype pump already employed splitter blades and the pressure fluctuation was well minimized, the blade trailing modification still made an obvious difference in suppressing pressure fluctuation further. The three modifications were set with different blade outlet angles of 18 degrees, 15 degrees, and 12 degrees on the pressure side. The CFD results show that Model C with a blade pressure side outlet angle of 12 degrees had the best pressure fluctuation performance, with hydraulic performance as good as the prototype.
Model C, with the best pressure fluctuation performance, had the most uniform circumferential distribution of the Euler head. The local velocities near the impeller blade trailing edge of the prototype and Model C were collected and compared. The relative velocity and the fluid flow angle changed as the pressure side blade angle changed. Consequently, the Euler head distribution of the impeller outlet became more uniform and the pressure fluctuation performance was improved.
In consideration of the structural strength of the blade trailing edge, Model B was selected as a test impeller. Experiments on its hydraulic and vibration performance were conducted. The vibration acceleration component had a high amplitude at a blade-passing frequency of 694 Hz, which matched well with the blade-passing frequency in the numerical results. The methodology of the blade trailing edge profile modification can also be applied to impellers with similar specific speeds.
Author Contributions
Conceptualization, B.H. and D.Q.; methodology, G.Z.; software, B.Q.; validation, G.Z., B.H., and B.Q.; formal analysis, G.Z.; investigation, B.Q.; resources, P.W.; data curation, P.S.; writing—original draft preparation, G.Z.; writing—review and editing, G.Z.; visualization, P.W.; supervision, G.Z.; project administration, B.H.; funding acquisition, B.H. All authors have read and agreed to the published version of the manuscript.
Funding
This study was supported by the National Natural Science Foundation of China (Grant No. 52076186 and Grant No. 51839010) and Key Research and Development Program of Zhejiang Province (Grant No. 2021C03133).
Institutional Review Board Statement
Not applicable.
Informed Consent Statement
Not applicable.
Acknowledgments
This study was also supported by the HPC Centre of ZJU (ZHOUSHAN CAMPUS).
Conflicts of Interest
The authors declare no conflict of interest.
References
- Gülich, J.F. Centrifugal Pumps, 2nd ed.; Springer: Berlin, Germany, 2010; pp. 110–116. [Google Scholar]
- Kaupert, K.A.; Staubli, T. The Unsteady Pressure Field in a High Specific Speed Centrifugal Pump Impeller—Part I: In-fluence of the Volute. J. Fluids Eng. 1999, 121, 621–626. [Google Scholar] [CrossRef] [Green Version]
- Gonza’Lez, J.; Ferna’Ndez, J.N.; Blanco, E.; Santolaria, C. Numerical Simulation of the Dynamic Effects Due to Impeller-Volute Interaction in a Centrifugal Pump. J. Fluids Eng. 2002, 124, 348–355. [Google Scholar] [CrossRef]
- Dong, R.; Chu, S.; Katz, J. Effect of Modification to Tongue and Impeller Geometry on Unsteady Flow, Pressure Fluctuations, and Noise in a Centrifugal Pump. J. Turbomach. 1997, 119, 506–515. [Google Scholar] [CrossRef] [Green Version]
- Yan, P.; Chu, N.; Wu, D.; Cao, L.; Yang, S.; Wu, P. Computational Fluid Dynamics-Based Pump Redesign to Improve Efficiency and Decrease Unsteady Radial Forces. J. Fluids Eng. 2016, 139, 011101. [Google Scholar] [CrossRef]
- Gao, Z.; Zhu, W.; Lu, L.; Deng, J.; Zhang, J.; Wuang, F. Numerical and Experimental Study of Unsteady Flow in a Large Centrifugal Pump With Stay Vanes. J. Fluids Eng. 2014, 136, 071101. [Google Scholar] [CrossRef]
- Majidi, K. Numerical Study of Unsteady Flow in a Centrifugal Pump. J. Turbomach. 2005, 127, 363–371. [Google Scholar] [CrossRef]
- Barrio, R.; Parrondo, J.; Blanco, E. Numerical analysis of the unsteady flow in the near-tongue region in a volute-type centrifugal pump for different operating points. Comput. Fluids 2010, 39, 859–870. [Google Scholar] [CrossRef]
- Capurso, T.; Bergamini, L.; Torresi, M. Design and CFD performance analysis of a novel impeller for double suction centrifugal pumps. Nucl. Eng. Des. 2019, 341, 155–166. [Google Scholar] [CrossRef]
- Stuermer, A.W.; Akkermans, R.A. Validation of Aerodynamic and Aeroacoustic Simulations of Contra-Rotating Open Rotors at Low-Speed Flight Conditions. In Proceedings of the 32nd AIAA Applied Aerodynamics Conference, Atlanta, GA, USA, 10–16 June 2014. [Google Scholar]
- Wei, Y.; Wang, Y. Unsteady hydrodynamics of blade forces and acoustic responses of a model scaled submarine excited by propeller’s thrust and side-forces. J. Sound Vib. 2013, 332, 2038–2056. [Google Scholar] [CrossRef]
- Wu, D.; Yan, P.; Chen, X.; Wu, P.; Yang, S. Effect of Trailing-Edge Modification of a Mixed-Flow Pump. J. Fluids Eng. 2015, 137, 101205. [Google Scholar] [CrossRef]
- Gao, B.; Zhang, N.; Li, Z.; Ni, D.; Yang, M. Influence of the Blade Trailing Edge Profile on the Performance and Unsteady Pressure Pulsations in a Low Specific Speed Centrifugal Pump. J. Fluids Eng. 2016, 138, 051106. [Google Scholar] [CrossRef]
- Zhang, N.; Liu, X.; Gao, B.; Wang, X.; Xia, B. Effects of modifying the blade trailing edge profile on unsteady pressure pul-sations and flow structures in a centrifugal pump. Int. J. Heat Fluid Flow 2019, 75, 227–238. [Google Scholar] [CrossRef]
- Detert Oude Weme, D.G.J.; Van Der Schoot, M.S.; Kruyt, N.P.; Van Der Zijden, E.J.J. Prediction of the Effect of Impeller Trimming on the Hydraulic Performance of Low Specific-Speed Centrifugal Pumps. J. Fluids Eng. 2018, 140. [Google Scholar] [CrossRef]
- Binama, M.; Su, W.-T.; Cai, W.-H.; Li, X.-B.; Muhirwa, A.; Li, B.; Bisengimana, E. Blade trailing edge position influencing pump as turbine (PAT) pressure field under part-load conditions. Renew. Energy 2019, 136, 33–47. [Google Scholar] [CrossRef]
- Ni, D.; Yang, M.; Gao, B.; Zhang, N.; Li, Z. Numerical study on the effect of the diffuser blade trailing edge profile on flow instability in a nuclear reactor coolant pump. Nucl. Eng. Des. 2017, 322, 92–103. [Google Scholar] [CrossRef]
- Akkermans, R.A.; Stuermer, A.W.; Delfs, J. Active Flow Control for Interaction Noise Reduction of Contra-Rotating Open Rotors. AIAA J. 2016, 54, 1413–1423. [Google Scholar] [CrossRef]
- Li, X.; Gao, P.; Zhu, Z.; Li, Y. Effect of the blade loading distribution on hydrodynamic performance of a centrifugal pump with cylindrical blades. J. Mech. Sci. Technol. 2018, 32, 1161–1170. [Google Scholar] [CrossRef]
- Tao, Y.; Yuan, S.; Liu, J.; Zhang, F.; Tao, J. Influence of blade thickness on transient flow characteristics of centrifugal slurry pump with semi-open impeller. Chin. J. Mech. Eng. 2016, 29, 1209–1217. [Google Scholar] [CrossRef]
- Li, S.; Wu, P.; Wu, D. Hydraulic Optimization and Loss Analyses of a Low Specific-Speed Centrifugal Pump with Variable-Thickness Blades. Am. Soc. Mech. Eng. 2016, 50299, V01BT27A003. [Google Scholar]
- Barrio, R.; Fernández, J.; Blanco, E.; Parrondo, J. Estimation of radial load in centrifugal pumps using computational fluid dynamics. Eur. J. Mech. B Fluids 2011, 30, 316–324. [Google Scholar] [CrossRef]
- Tan, M.-G.; He, X.-H.; Liu, H.-L.; Dong, L.; Wu, X.-F. Design and analysis of a radial diffuser in a single-stage centrifugal pump. Eng. Appl. Comput. Fluid Mech. 2016, 10, 500–511. [Google Scholar] [CrossRef] [Green Version]
- Alemi, H.; Nourbakhsh, S.A.; Raisee, M.; Najafi, A.F. Development of new “multivolute casing” geometries for radial force reduction in centrifugal pumps. Eng. Appl. Comput. Fluid Mech. 2015, 9, 1–11. [Google Scholar] [CrossRef]
- Solis, M.; Bakir, F.; Khelladi, S. Pressure Fluctuations Reduction in Centrifugal Pumps: Influence of Impeller Geometry and Radial Gap. In Proceedings of the ASME 2009 Fluids Engineering Division Summer Meeting, Vail, CO, USA, 2–6 August 2009. [Google Scholar]
- Zeng, G.; Li, Q.; Wu, P.; Qian, B.; Huang, B.; Li, S.; Wu, D. Investigation of the impact of splitter blades on a low specific speed pump for fluid-induced vibration. J. Mech. Sci. Technol. 2020, 34, 2883–2893. [Google Scholar] [CrossRef]
Publisher’s Note: MDPI stays neutral with regard to jurisdictional claims in published maps and institutional affiliations. |
© 2021 by the authors. Licensee MDPI, Basel, Switzerland. This article is an open access article distributed under the terms and conditions of the Creative Commons Attribution (CC BY) license (https://creativecommons.org/licenses/by/4.0/).