1. Introduction
The higher the corn ear threshing rate of a corn thresher, the lower the losses in corn production [
1,
2]. At present, it is always difficult to exceed 85% of the corn thresher’s threshing rate [
3,
4], which undoubtedly causes a huge waste. The high rate of corn ear threshing depends mainly on whether the rotation speed setting of the threshing component in the thresher is reasonable [
5]. The corn thresher uses the rotation of the threshing components to repeatedly knead the kernels [
6,
7]. Under the action of kneading forces, a relative displacement between the kernel and the corn cob is constantly occurring [
8,
9]. The greater the relative displacement, the greater the bonding force between the kernel and the corn cob used to resist separation [
10]. When the bonding force between the two is greater than the bonding force limit, the corn kernels detach from the corn cob [
11,
12]. Apparently, the magnitude and frequency of changes in the kernel-to-cob bonding force during threshing are influenced by the rotation speed of the threshing component [
13,
14]. Additionally, numerous studies have shown that the kernel-to-cob bonding force is also influenced by the moisture content of the corn ear. Therefore, the key to achieve the optimal setting of the threshing component rotation speed is to clarify the effect of the threshing component rotation speed on the bonding force between the kernel and the cob under different conditions of moisture content of the corn ear.
The separation process of corn kernels and cobs in the corn threshing operations is extremely complex [
15,
16], and the threshing speed of corn threshers can reach more than 1000 kernels/second. At the meantime, the separation time of a single corn kernel is extremely short, generally not exceeding 1 ms [
17,
18]. Obviously, it is difficult to analyze precisely the variation of the bonding force during the corn threshing operation by traditional research means [
19], which causes producers to adopt only an empirical setting for the rotation speed of the threshing component [
20]. In recent years, discrete element simulation technology has been widely used in agricultural engineering, where it can provide high-precision observation and analysis of the kinematic and mechanical characteristics of granular objects [
21]. The core of discrete element simulation is the establishment of a mechanical model [
22]. Therefore, if a high-precision computational model of the corn kernel–cob bonding force can be established, the characteristics of the bonding force changes during the corn threshing operation can be simulated and analyzed with high precision by discrete element simulation, and then the influence of the threshing component rotation speed on the corn ear threshing rate can be revealed.
At present, there are very few studies related to the computational model of the corn kernel–cob bonding force [
5], while the few studies that have been conducted have focused only on the elastic variation of the bonding force. Yu et al. developed the most widely used linear elastic damping (LSD) model by treating the changes in bonding forces during threshing operations uniformly as elastic changes [
1,
16], but their calculation errors sometimes reached more than 10% [
1,
16]. The threshing component applies force to the corn kernels by loading and then unloading [
23,
24], and repeats this cycle until the kernels are separated from the cob [
25]. Therefore, the authors of this paper argue that it is highly likely that there is a simultaneous inelastic variation in the bonding force during the corn threshing process.
In summary, this paper uses an electronic universal testing machine to analyze the change characteristics of the bonding force during the threshing process by first loading and then unloading, and then establishes an elastic–plastic (EP) damping model for the corn kernel–cob bonding force. The EP model achieves a comprehensive consideration of elastic and plastic changes by adding a bonding restitution coefficient e. In this paper, the values of EP model parameters (loading stiffness KX(Y,Z), bonding restitution coefficient e, and limit value of bonding force FX(Y,Z)max) under different conditions were obtained by testing the relationship between the corn ears’ own properties and EP model parameters. Based on the EP model established in this paper, a high-precision simulation test of the corn threshing process was realized on the self-developed AgirDEM software, and an optimization model of the threshing component rotation speed was derived. In future corn threshing operations, researchers will only need to measure the moisture content of the corn ear to obtain the optimal value of the rotation speed through the threshing component rotation speed optimization model. Finally, this paper compared the simulation test results with the actual measurement results of the corn thresher to verify the calculation accuracy of the EP model. Meanwhile, by comparing the calculation errors of the LSD model and the EP model, it is verified that EP model has the advantage of calculation accuracy. This paper may provide a new, efficient, and accurate research means and method for future research on corn threshing.
2. Models and Methods
2.1. Elastic–Plastic Damping Model for Kernel–Cob Bonding Force
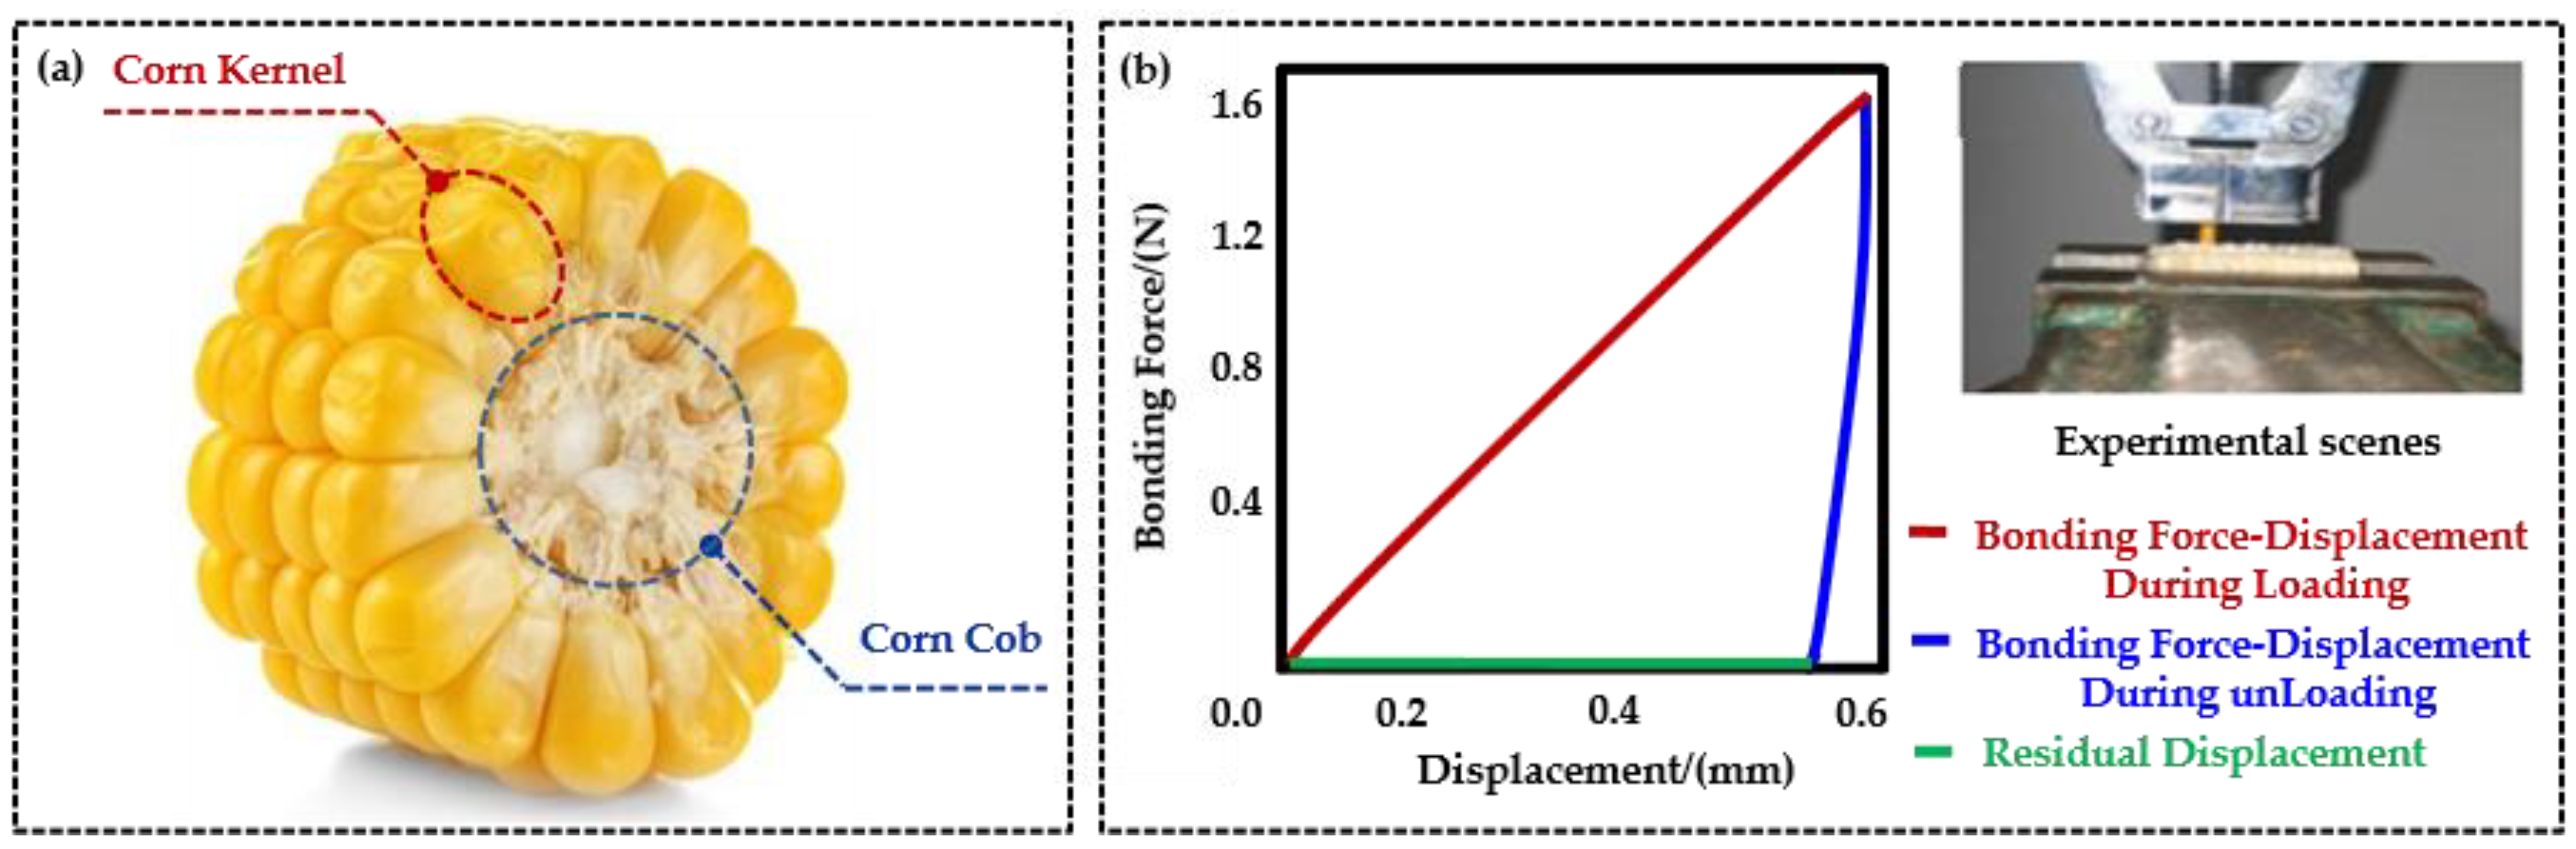
As shown in
Figure 1a, the corn ears consist of a bonding between the kernels and the cob. During the corn threshing operation, a break occurs between the kernel and the cob by repeated kneading of the threshing component [
16]. Therefore, the force applied to the corn kernels by the threshing component is first loaded and then unloaded [
22,
23]. In this paper, the mechanics characteristic test of the loading and then unloading of the corn ear was carried out by the WDW-20 J electronic universal testing machine (Shanghai Hualong Testing Instrument Factory, the maximum test force 20 kN, relative error: ±0.5%), and then the change law of the bonding force between the kernels and the cob in the process of corn threshing was obtained. As shown in
Figure 1b, the bonding force is linearly related to the kernel displacement during the loading of external force, indicating that the bonding force changes elastically at this time. Meanwhile, in the process of unloading the external force, the bonding force becomes nonlinear with the kernel displacement, which indicates that there is energy dissipation and plastic change in the bonding force at this time. Special attention was paid to the fact that the kernels did not return to their original position after a loading and unloading cycle, indicating that a displacement residual phenomenon occurred in the kernels.
Based on the characteristics of the mechanics behavior of the bonding force between the kernel and the cob during the threshing process, a new elastic–plastic (EP) damping model of the kernel–cob bonding force is established in this paper by simultaneously introducing three parameters of the loading stiffness and the restitution coefficient of the bonding force and the limit value of the bonding force (Formula (1)). The loading stiffness can reflect the elastic change trend of the bonding force during the external force loading. The bonding force restitution coefficient reflects the energy dissipation during the unloading of external forces. When
FX (Y,Z) is greater than the bonding force limit
FX (Y,Z)max, the model considers that the corn kernel detaches from the corn cob. By inputting the EP model into the self-developed AgriDEM’s corn threshing analysis module, the mechanics behavior characteristics of the kernels during the corn threshing process can be accurately observed, and the corn ear threshing rate can be predicted.
Note: X, Y, Z means the height, width, and thickness directions of corn kernels, respectively; FX (Y,Z) means the bonding force between the kernel and the cob along the X, Y, and, Z axis directions; KX (Y,Z) means the loading stiffness of the bonding between the kernel and the cob along the X, Y, and Z axis directions; UX (Y,Z), UX (Y,Z)0 means the relative displacement and residual displacement between the kernel and the cob along the X, Y and Z axis directions, respectively; UX (Y,Z)0 needs to be updated at every time step, is the coefficient of restitution of the bonding between the kernel and the cob along the X, Y, and Z axis directions.
2.2. Testing the Relationship between Corn Ears’ Own Properties and EP Model Parameters
For accurate calculation of the bonding force between the kernel and the cob by the EP model, appropriate EP model parameters (loading stiffness, coefficient of restitution of the bonding, and limit values of the bonding force) also need to be set. Obviously, all three EP model parameters are the own mechanics properties of the corn ear [
17]. Therefore, the EP model parameters change when the corn ear of the threshing operation is different. Numerous studies have shown that the mechanical properties of the corn ear are mainly influenced by the moisture content of the ear [
26]. Furthermore, the mechanics properties of the corn ear vary in different directions, as well as the geometric characteristics of different segments [
27]. Therefore, in this paper, the moisture content of the corn ear, the loading direction of the ear under force, and the segment of the ear under force were selected as dependent variables, and three model parameters were selected as target values for a three-factor multilevel test.
The moisture content of the corn ear where the corn threshing operation is performed is generally between 12% and 30% [
28]. Therefore, corn ear moisture content was set at four levels of 12%, 18%, 24%, and 30%. As shown in
Figure 2a, the force directions of the kernels during corn ear threshing can be simplified to four directions: radial tension (r.t.), radial compression (r.c.), axial shear (l.s.), and tangential shear (t.s.). As shown in 2b, the corn ear can be divided into three segments according to its thickness: the upper, middle, and the lower segment.
In summary, the test was set up with a total of 48 level combinations, and each level was repeated five times. The moisture content of harvested corn ears was generally more than 30%, and this paper used natural air-drying to reduce the moisture content. At the meantime, the moisture content of the corn ear is checked in real time by means of a moisture content detector. When the moisture content of the corn ear reaches a set level, the cob is sealed in a sealed bag to keep the moisture content constant. The rest of the corn ear continues to air dry naturally to the next set level value. Therefore, the full range of moisture content levels set in this paper can be obtained. The test relies on the WDW-20 J electronic universal testing machine produced by Shanghai Hualong Testing Instrument Factory to conduct the test. WDW-20 J electronic universal testing machine can realize the precise control of loading direction of force and force position of the corn ear by controlling the relative position of the ear and fixture. After each test, WDW-20 J electronic universal testing machine can directly input the test value of loading stiffness, the bonding force restitution coefficient, and the bonding force limit value into the computer. Finally, the statistical analysis of the test results enables the establishment of a model of the relationship between the properties of the corn ear itself and the parameters of the EP model. The researcher only needs to measure the moisture content of the corn ear to obtain the corresponding EP model parameter values.
2.3. Simulation Test of Corn Threshing Operation Based on Discrete Element Model of Kernel–cob Bonding Force and AgriDEM
It was important to reveal the interaction law between the corn ear moisture content and the thresher rotation speed on the corn ear threshing rate, and to optimize the optimal value of the thresher rotation speed under different conditions of ear moisture content. In this paper, the EP model is used as the simulation algorithm, and the self-developed AgriDEM is used as the simulation software to conduct discrete element simulation experiments of the corn threshing operation. The moisture content of the corn ear and the rotation speed of the thresher were selected as the test factors in the discrete element simulation test, and the corn ear threshing rate was selected as the test index. The corn ear moisture content was set at four levels of 12%, 18%, 24%, and 30%. Four levels of thresher rotation speed, 122.70 rpm, 187.50 rpm, 252.10 rpm, and 317.15 rpm, were selected as the most common in actual operation [
1].
In summary, the discrete element simulation experiments were performed with 16 level combinations, and five simulations were performed for each combination. As shown in
Figure 3a, the discrete element simulation tests were performed relying on the self-developed AgriDEM software in the corn threshing analysis module. As shown in
Figure 3b, the corn ear discrete element model used a multi-sphere modeling approach and composed the complete corn ear by the EP model [
29]. As shown in
Figure 3c, the discrete element model of the drum-type corn thresher consists of a hopper, threshing drum, spike teeth, and a concave. As shown in
Figure 3d, in the simulation test, the corn ear started to fall off after contact with the threshing component, and most of the threshing occurred in the front half of the drum, and the kernels were separated from the threshing area by the concave plate after falling off. Obviously, the phenomenon of kernel movement in the simulation test is basically consistent with the actual corn threshing process.
Corn ear threshing rate was measured by the ratio of threshed kernel mass to total kernel mass [
29], and the results of each test can be directly derived from AgriDEM software. Finally, the statistical analysis of the test results was conducted to reveal the interaction effect law between the moisture content of the corn ear and the thresher rotation speed on the corn ear threshing rate. At the meantime, an optimization model of the thresher rotation speed parameters was derived, and the researchers only needed to measure the moisture content of the kernels to obtain the optimal value of the thresher rotation speed.
To verify the simulation accuracy of the EP model, the most common drum-type corn thresher (YT-4 drum type corn thresher, China Agricultural Engineering Research and Design Institute, 22 kW.) was selected as a simulation test comparison group [
1,
29]. Meanwhile, the most widely used LSD model [
1,
30] was selected as the simulation test comparison group. The optimum values derived in the previous paper were chosen for the rotation speeds of the threshing components in the EP model, drum-type corn thresher, and LSD model tests. The simulation test results of the EP model and the LSD model are directly derived from AgriDEM software. The test results of the roller type corn thresher were measured by an SL4001 electronic scale (Shanghai Minqiao Electronic Instrument Factory, (4000 ± 0.1) g) to measure the corn ear mass before and after the threshing operation, and the measured value of the corn ear threshing rate was obtained by Formula (2). Finally, the calculation accuracy of the EP model is verified by comparing the experimental results of the EP model and the drum-type corn thresher. By comparing the calculation error of EP model and LSD model, the EP model is verified, whether it is advantageous or not. The calculation error can be derived from Formula (3).
Note:
means the actual measured corn ear threshing rate of drum-type corn thresher, %. M means the mass of the corn ear after threshing operation, kg. M’ means the mass of corn ear after threshing operation, kg.
Note: Y means the calculation error of the model, %. means the corn ear threshing rate of the discrete element simulation test, %. means the measured corn ear threshing rate of drum-type corn thresher, %.
2.4. Statistical Methods
In the test of the relationship between the corn ear moisture content and the EP model parameters, ANOVA was used to evaluate whether or not corn ear moisture content, loading direction of the corn ear by force, and segments of the corn ear by force had significant effects on the EP model parameters. After removing the non-significant factors, the parameter relationship model of the corn ear moisture content EP model was established by curve fitting.
In the simulation test of corn threshing operation, the regression model of the corn ear moisture content and the thresher rotation speed of the corn ear threshing rate was established by regression analysis. The model significance was evaluated by ANOVA. The regression model was used to analyze the interaction effect of moisture content of corn ear and rotation speed of thresher on the corn ear threshing rate. At the meantime, the optimal value of the drum rotation rate under different corn ear moisture content conditions was obtained by regression model. Finally, the accuracy of the EP model was evaluated by LSD. All test results in this paper were processed and analyzed using MATLAB and Design-Expert software for data processing, and Origin software for plotting.
4. Discussion
The EP model established in this paper was set with a total of three model parameters that depend on the properties of the corn ear itself. The loading stiffness reflects the amount of increase in the bonding force when the relative displacement of the kernel and the cob occurs [
28,
29]. Under the same conditions of relative displacement, the greater the loading stiffness, the greater the increase in bonding force, and the easier it is for the corn kernels to detach from the cob. The bonding force limit reflects the ability of the kernel to prevent the kernels from detaching. The higher the bonding force limit, the more difficult it is for the kernels to detach from the cob. The test results in part 3.1 showed that the loading stiffness in tangential shear (t.s.) is the largest and the limit value of the bonding force is the smallest. This indicates that the vast majority of corn kernels are detached from the ear during the threshing operation by tangential shear damage, which is the same phenomenon observed by many scholars in experimental tests on threshers.
From the models x-k
r.t. and x-
Fr.t.max in
Section 3.1, it follows that, as the moisture content increased, the increase in the bonding force to shear in the tangential direction gradually decreased, but the ability of the corn ear to resist tangential shear damage also decreased. This indicates that the moisture content of the corn ear does not significantly affect the threshing rate during the loading of kneading force on the corn kernels by the threshing component. The test results in
Section 3.2 showed that, under the same conditions of the threshing component rotation speed, the higher the moisture content of the corn ear, the lower the corn ear threshing rate. In summary, it is clear that the moisture content of the corn ear should have an effect on the corn ear threshing rate during the unloading process. During the unloading process, the kernels do not fully return to their original position, but a relative displacement remains. During the repeated kneading of the kernels by the threshing component, the relative displacement of the residues accumulates. Thus, even if the kneading force applied to the kernels by the threshing component is less than the bonding force limit each time, the bonding force increases until it exceeds the bonding force limit. This indicates that, in corn threshing operations, when the kneading force loaded on the kernels by the threshing element is small, assuming that there is an accumulation of residual displacement during the unloading process, the kernels can still be separated by repeated kneading.
The faster the rotation speed of the threshing component, the lower the torque of the threshing component, the lower the kneading force of the threshing component loaded on the corn kernels, and the lower the probability that the kernels will be separated from the threshing component by a single kneading, under the same conditions of the operating power of the thresher. At the meantime, the faster the rotation speed of the threshing component, the higher the frequency of the kernels being threshed by the threshing component, the faster the accumulation of residual displacement in the unloading process, and the easier it is to achieve kernel detachment by repeated kneading. Therefore, the influence of the rotation speed of the threshing component on the corn ear threshing rate has two sides. At the slower speed of the threshing component, the kneading force of the threshing components on the kernels is at a higher level and the frequency of being kneaded is at a lower level. Therefore, the change in kneading frequency has a more significant effect on the threshing rate when the rotation speed of the threshing component is slow. Based on the same principle, the threshing rate is more significantly affected by the kneading force when the speed of the threshing component is faster. In summary, as the rotation speed of the threshing component increases, the corn ear threshing rate rises first and then decreases. Meanwhile, the experimental results in
Section 3.1 show that, as the moisture content of the corn ear increases, it increases the bonding restitution coefficient, resulting in less residual displacement during each unloading, making it more difficult to detach the corn kernels from the cob. Obviously, when the moisture content increases, the kneading frequency needs to be increased to guarantee the corn ear threshing rate. The optimization results in
Section 3.2 also prove the above view, as when the moisture content increases, the optimal value of the threshing component rotation speed gradually becomes larger. Therefore, the nature of the interaction between corn ear moisture content and threshing component rotation speed on the corn ear threshing rate is that both jointly determine the amount of residual displacement accumulated.
Compared with the most widely used LSD model, the core improvement of the EP model is the addition of the bonding restitution coefficient e. The LSD model only takes into account the elastic variation of the bonding force, resulting in the kernels returning to their original position during each unloading. Therefore, in the discrete element simulation based on the LSD model, only one kneading can be simulated to achieve corn kernel detachment. Obviously, the EP model is closer to the actual situation of the corn threshing operation, so it has higher calculation accuracy for the corn ear threshing rate. Meanwhile, the larger the corn ear moisture content, the larger the bonding restitution coefficient, and the greater the influence on the accuracy of simulation calculation. Therefore, the higher the moisture content of the corn ear, the more obvious the advantage of the EP model, in terms of calculation accuracy compared with the LSD model.
5. Conclusions
In this paper, it is found that, during the separation of corn kernels from corn cobs, there is both elastic and plastic changes in the connecting forces between the kernels and the cobs. In this paper, it was found that, due to the presence of plastic change, the kernels do not return to their original position during the unloading of the kneading force, i.e., the displacement residual phenomenon occurs. In this paper, an elastic–plastic (EP)_ damping model of the corn kernel–cob bonding force is established by introducing the bonding restitution coefficient e, and then the residual displacement phenomenon of the kernel can be simulated in the discrete element simulation. The results of this paper showed whether the plastic change in the bonding force that is considered in the calculation model can have a significant impact on the calculation accuracy. Therefore, compared with the most widely used LSD model, the EP model can reduce the calculation error by 3.35–6.05%, and there is no significant difference between the calculated and measured values of the EP model (p > 0.05). In this paper, based on the discrete element simulation of the EP model, it is found that the moisture content of the corn ear and the rotation speed of the threshing component jointly determined the residual displacement accumulation of the kernels during the unloading process. Therefore, in the corn threshing operation, the rotation speed value of the threshing component should correspond to the moisture content of the corn ear. As established in this paper, producers can solve the optimal value of the threshing component rotation speed by using the regression model of the moisture content of the corn ear and the thresher rotation speed on the corn ear threshing rate. The test results showed that the corn ear threshing rate could reach 92.40–97.25% with the optimized rotation speed value of threshing component in this paper. This paper can provide a high-precision calculation model based on the discrete element simulation method for the study of the mechanics characteristics of the corn threshing process and the optimization of the operating parameters of the corn thresher.


