Article

Optimization of Process Parameters and Kinetics Analysis of Cd Removal in ZnSO4 Production

1
China University of Mining and Technology-Beijing, Beijing 100083, China
2
Lingwu Hengye Nonferrous Metal Smelting Co., Ltd., Yinchuan 751400, Ningxia, China
3
Ningxia Survey and Monitor Institute of Land and Resources, Yinchuan 750002, Ningxia, China
*
Author to whom correspondence should be addressed.
Processes 2021, 9(8), 1437; https://doi.org/10.3390/pr9081437
Submission received: 22 July 2021 / Revised: 11 August 2021 / Accepted: 16 August 2021 / Published: 19 August 2021
(This article belongs to the Special Issue Treatment and Utilization of Waste Materials)

Abstract

:
In order to optimize the process parameters of Cd removal in the ZnSO4 production process and study the mechanism of Cd removal reaction, the response surface methodology was used to arrange Cd removal experiments and analyze the optimal production conditions, and the mechanism of Cd removal was studied using kinetics. The results show that the optimal process conditions for Cd removal are as follows: reaction temperature 55 °C, reaction time 13.43 min, and the zinc powder dosage should be 2.14 times that of Cd; the main effects of the three variables from large to small are zinc powder dosage, reaction temperature and reaction time; Cd removal is a second-order reaction, and the activation energy of the reaction is 29.6986 kJ/mol, so the reaction conforms to the diffusion control mechanism.

1. Introduction

With the continuous development of the automobile industry and electric vehicle industry, the waste lead-acid battery has become a huge renewable and recoverable resource [1]. The recycling process of waste lead-acid batteries usually includes transportation, dismantling, melting and other links [2]. Among them, the waste electrolyte (that is, waste acid) produced by the dismantling process is often treated by chemical neutralization [3]. However, the neutralization method requires a large amount of neutralizing agent (lime or calcium carbide emulsion), and the running costs are high. Furthermore, the gypsum produced is a waste without a recycling value, and the subsequent disposal cost of the gypsum residue is about 600 ¥/t, so the processing costs are high [4]. In addition, when the lead paste and alloy gate plates in the battery are melted into lead ingots, the soot produced by the furnace body mainly contains inferior zinc oxide which is collected by the cloth bag dust collector, and the inferior zinc oxide can be used as raw material to produce zinc products such as zinc sulfate products.
The traditional process of producing zinc sulfate is to use sulfuric acid and zinc ore [5], so the cost of raw materials is high. If the waste electrolyte of the waste lead-acid battery and the inferior zinc oxide collected by the cloth bag dust collector are used to produce zinc sulfate products, there are more benefits. On the one hand, the treatment cost of the two kinds of waste can be reduced, and on the other hand, the waste can be turned into a valuable resource. The zinc sulfate produced can be used in the agriculture, industry, and medical and health fields, and thus the economic benefits are increased. However, when inferior zinc oxide is used as raw material to produce zinc sulfate, it inevitably carries heavy metal impurities [6,7], which is harmful to the environment and human health. Therefore, the production process of zinc sulfate must include the removal of impurities.
Lingwu Hengye Nonferrous Metals Smelting Co., Ltd. has carried out the industrial practice of producing zinc sulfate from waste electrolyte and secondary zinc oxide. The factory mainly uses the wet leaching method to produce zinc sulfate. The production process mainly includes sulfuric acid leaching, solid-liquid separation, oxidation impurity removal, displacement impurity removal, evaporation and concentration, cooling and crystallization, centrifugal dehydration, and other processes. Among them, oxidation impurity removal mainly serves to remove Fe impurities, and replacement impurity removal mainly serves to remove Cd impurities. Because Cd is highly toxic to the human body and is the most abundant heavy metal impurity in the factory and the Cd content has a great influence on product quality, the Cd removal reaction plays an important role in the production of zinc sulfate.
This paper mainly analyzes the influence of process conditions on Cd removal, finds the optimal process conditions, and analyzes the reaction mechanism. Then, the analysis method and scientific guidance for removing impurities in the zinc sulfate production process are provided, which provides a certain support for spreading the process of producing zinc sulfate from waste.

2. Experimental Method

The experimental materials used in this paper were from Hengye Nonferrous Metal Metallurgical Co., Ltd. (Beijing, China) which is located in Lingwu city of Ningxia province. The Cd removal experiment method was as follows: first, we poured 1 L ZnSO4 slurry containing Cd2+ into a beaker using a measuring cylinder, and this slurry, from which iron impurities had been removed, was scooped out of tanks in the factory; then, the beaker was placed on the electric furnace, and the electric furnace was turned on to make the slurry temperature rise to the reaction temperature, which was set in the experiment; next, the required 200 mesh zinc powder was weighed and poured into the slurry and placed in the blender, centered and down, about 1/4 of the height of the beaker, and the mixer and timer were started; finally, each experiment was carried out under different reaction temperatures, zinc powder dosages and reaction times, and the slurry after the reaction was stirred with a glass rod and filtered by filter paper; the Cd content in the filtrate was measured by an atomic absorption spectrometer.

3. Optimization Experiment by Response Surface Methodology

3.1. Experimental Design

Since the stirring speed is fixed in the production, the size of the zinc powder purchased is 200 mesh, so the Cd removal process is mainly affected by the zinc powder dosage, reaction temperature and reaction time. At present, the process conditions used in the production are as follows: the reaction temperature is 45 °C, reaction time is 10 min, and the ratio of the zinc powder dosage to Cd content is 3:1. In order to further analyze the influence rules of the above three main influencing factors and their interaction on the Cd removal rate, find the optimal process parameters and provide scientific guidance for production, this paper uses Design-Expert software to design a total of 17 experimental sites with three factors and three levels [8,9,10,11,12,13]. The factors and levels in the scheme are shown in Table 1 below.

3.2. Experimental Results and Regression Analysis

The experimental scheme and results are shown in Table 2 below. The reaction temperature, reaction time and zinc powder dosage are independent variables. The Cd removal rate η is the response value. The regression analysis results of the response surface experiment are shown in Table 2 and Table 3.
According to the above table, the Cd removal rate is low when the temperature is low, the reaction time is short and the amount of zinc powder is small. With the increase of temperature, time and the amount of zinc powder, the Cd removal rate increases in varying degrees. In order to rank the effects of temperature, time and the amount of zinc powder and find the best matching conditions for the three, the use of the Design-Expert software for a regression analysis of the above experimental results is required. The analysis results are shown below.
As can be seen from the above table, A, B, C, AB, AC, BC, A2, B2, C2 and A2B are highly significant influencing factors, A2C is a significant influencing factor, and AB2 is a nonsignificant influencing factor. According to the F value, the main effect of the variables from large to small are the zinc powder dosage, reaction temperature and reaction time.
According to the experimental results, the response value of the Cd removal rate is regression-fitted with the three variables by the Design-Expert software, and the third-order regression equation of the Cd removal rate is as follows:
η = 98.03 + 4.11T + 2.49t + 16.15N − 5.07Tt − 4.07TN − 2.22Tn − 2.26T2 − 4.39t2 − 10.11N2 + 5.36T2t − 2.01T2N + 1.48TN2
Figure 1 below shows the corresponding relationship between the experimental value of the Cd removal rate and the predicted value of the above model. As can be seen from the figure, the points of the experimental results are all close to the predicted line. This indicates that the experimental detection value is very close to the predicted value of the model. In other words, the model fits well with the actual results.
According to Figure 2, Figure 3 and Figure 4, the interaction of the influencing factors on the Cd removal rate can be evaluated by the 3D diagram. Figure 2 is the response surface of the reaction temperature and reaction time on the Cd removal rate. In general, as the temperature increases and the reaction time lengthens, the Cd removal rate is high. Furthermore, it is clear that when the reaction time is greater than 11 min and the temperature is greater than 45 °C, the response surface color is redder and the Cd removal rate is higher. However, a higher temperature and longer reaction time are not better. The surface has radians and convex parts. This means that in the interaction of time and temperature, there is an optimal value of the Cd removal rate. That is, there is an optimal collocation condition for time and temperature.
Figure 3 is the response surface of the reaction temperature and zinc powder dosage on the Cd removal rate. As can be seen from the figure, with the increase of the reaction temperature, the Cd removal rate increases first and then decreases. Additionally, with the increase of the zinc powder dosage, the Cd removal rate increases. Therefore, these are the optimum combination conditions of the reaction temperature and zinc powder amount. In addition, it is obvious that the higher the temperature is, the more red areas there are; when mZn:mCd is greater than 2, the red area increases more and more. The more red areas there are, the redder the response surface color is and the higher the cadmium removal rate is.
Figure 4 is the response surface of the reaction time and zinc powder dosage on the Cd removal rate. As can be seen from the figure, with the prolongation of the reaction time, the Cd removal rate increases first and then decreases. Additionally, with the increase of the zinc powder dosage, the Cd removal rate increases. Therefore, these are the optimum combination conditions of the reaction time and zinc powder amount. In addition, when the response time is about 13 min, there are more red areas; when mZn:mCd exceeds 2, the color of the response surface becomes redder, which indicates that the Cd removal rate is higher under the above conditions.
Because zinc powder is expensive, the zinc powder dosage should be as low as possible. The reaction temperature and reaction time are within the range of experimental settings. Under these conditions, in order to improve the Cd removal rate, according to the response surface curve analysis, the optimal process conditions for Cd removal are as follows: the reaction temperature is 55 °C, the response time is 13.43 min, and the ratio of zinc powder dosage to Cd content is 2.14:1.

4. Kinetic Analysis of Cd Removal Reaction

4.1. Reaction Order Judgment

When zinc powder replaced Cd in the solution, the rate at which Cd2+ decreased reflected the rate of the whole reaction [14,15,16,17]. Furthermore, as the reaction went on, the concentration of Cd2+ in the solution was decreasing. When the reaction temperature was fixed at 45 °C and when changing the amount of zinc powder, the changes of the Cd2+ concentration over time were shown in the following table.
According to Table 4 below, with the increase of the reaction time, the concentration of Cd2+ in the solution decreases continuously. At 900 s, the concentration of Cd2+ has been reduced to below 0.01. After that, as time continues to increase, the concentration of Cd2+ decreases slightly. With the increase of the amount of zinc powder, the concentration of Cd2+ basically shows a trend of continuous decrease, but when the reaction time exceeds 300 s, even though the amount of zinc powder increases, the concentration of Cd2+ does not change much.
According to the above Table 4, we drew a relationship graph between C Cd 2 + and t, a graph between ln C Cd 2 + and t, and a graph between 1 C Cd 2 + and t. Furthermore, the graph lines needed to be fitted into straight lines because the three relationship graph lines of the zero-order reaction, first-order reaction and second-order reaction all had to be straight lines. It is necessary to mention that the degree of closeness between these graph lines and the corresponding fitting line is called the fitting degree. A higher fitting degree means that the reaction type belongs to the corresponding reaction order. The fitting degrees of the three fitting lines are listed in Table 5 below.
According to Table 5, the second-order reaction has the highest fitting degree. Thus, the replacement of Cd2+ with zinc powder is a second-order reaction. According to the differential equation of a second-order reaction, the rate of the reaction is proportional to the concentration of the reactants squared, so the rate of the reaction depends greatly on the amount of reactants. The differential equation of the second-order reaction is as follows:
d C A d t = k A C A 2
where, d C A d t —the reaction rate, mol·m−3·s−1;
kA—the reaction rate constant, (mol·m−3)−1·s−1;
CA—the reactant concentration, mol·m−3.
The second-order reaction fitting lines are shown in Figure 5 below.

4.2. Activation Energy Calculation

The Cd removal reaction will go through the following five steps: (1) Cd2+ diffuses to the surface of zinc powder; (2) Cd2+ is adsorbed on the surface of zinc powder; (3) Chemical reactions take place at the interface; (4) The reaction products are desorbed from the interface; (5) The product diffuses into the solution, and the replacement reaction is completed [18].
In order to calculate the activation energy and judge the main control steps of the Cd removal reaction, the following experiment was arranged. The ratio of zinc powder dosage to Cd content was fixed at 3:1. At 35 °C, 45 °C and 55 °C, the change of Cd2+ concentration with time was explored. Specific values are summarized in Table 6 below.
According to the data in the above table, first, the curve of the reciprocal of the Cd2+ concentration changing with the reaction time was drawn, three curves were drawn at three different temperatures, and then the fitting function in the Origin software was used to fit the three curves, and the fitting diagram was shown in Figure 6 below. The reaction rate constants (the slope of these fitting lines) at different temperatures were obtained.
The slope (K value) of the above fitting line and the different temperatures (T value) were listed in Table 7 below.
According to Table 7, the Arrhenius diagram was shown in Figure 7 below [19,20,21].
According to the diagram above, the slope and intercept of the line are −3.57 and 15.25. In addition, according to the Arrhenius equation, the activation energy of the replacement reaction Ea can be calculated. The Arrhenius equation is as follows, where the slope of the line is Ea RT = −3.57 and the intercept is ln A = 15.25:
ln k = E a R T + ln A
According to the slope of the line and (Equation (2)), the activation energy Ea is 29.6986 kJ/mol. Because of the fact that when the activation energy is less than 42 kJ/mol the chemical reaction rate belongs to the diffusion control, otherwise belonging to the chemical reaction control, the reaction is diffusion-controlled.

5. Conclusions

(1)
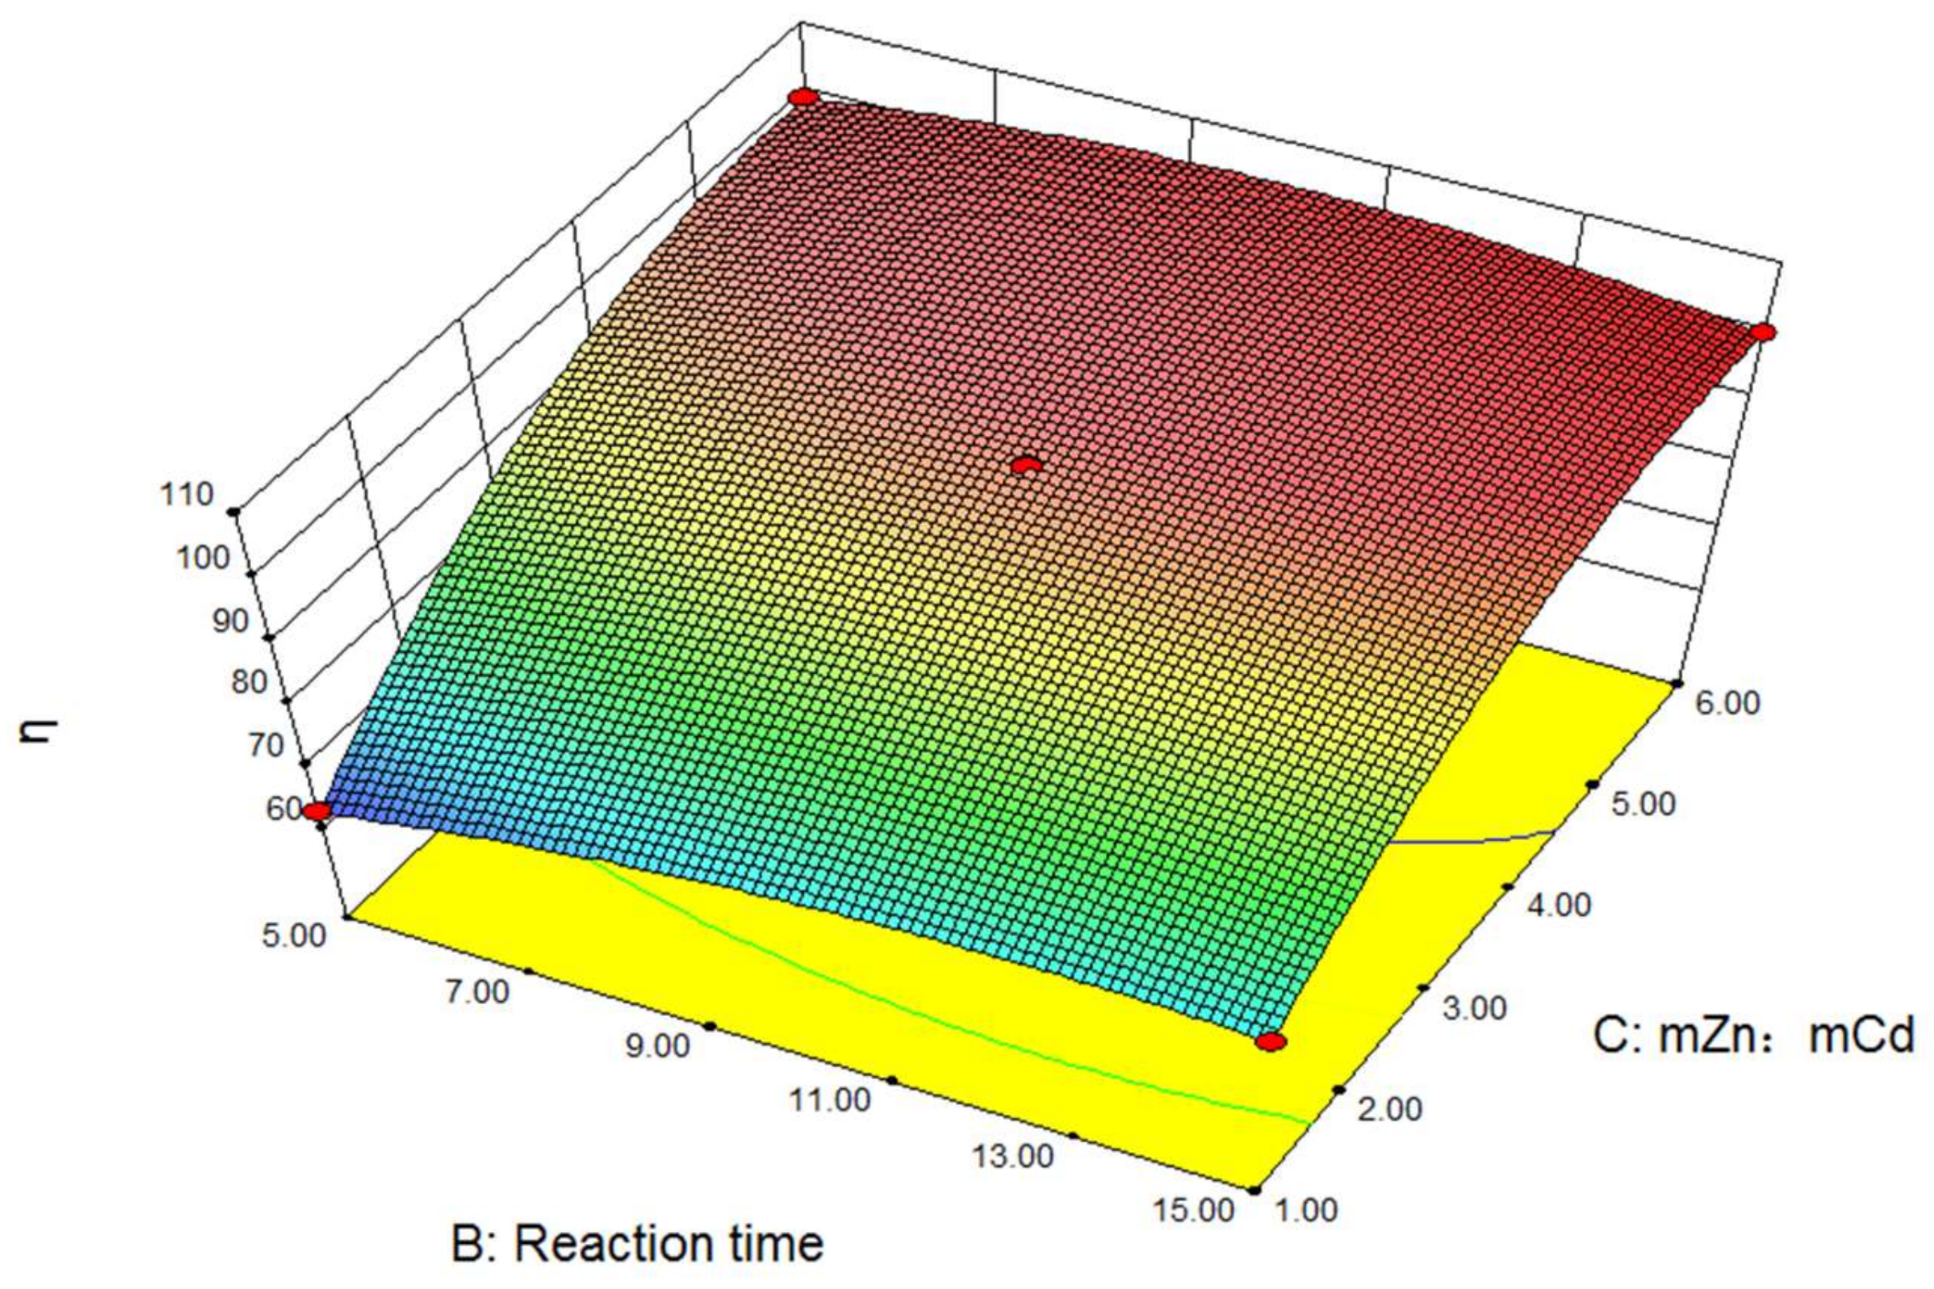
According to the response surface analysis, it is not the case that the longer the time or the higher the temperature, the better the Cd removal effect. The Cd removal rate is higher when zinc powder is used more. However, the cost is higher when zinc powder is used more. Therefore, there is an optimal process condition for Cd removal production. The specific conditions are as follows: reaction temperature 55 °C, reaction time 13.43 min, and the zinc powder dosage should be 2.14 times that of Cd. The main effects of the three variables from large to small are the zinc powder dosage, reaction temperature and reaction time. The three variables of reaction temperature, reaction time and zinc powder dosage are regression-fitted with the Cd removal rate. The third-order regression equation is obtained. That is: η = 98.03 + 4.11T + 2.49t + 16.15N − 5.07Tt − 4.07TN − 2.22tN − 2.26T2 − 4.39t2 − 10.11N2 + 5.36T2t − 2.01T2N + 1.48TN2. The predicted value of the equation is close to the real experimental result, and so the fitting degree is high.
(2)
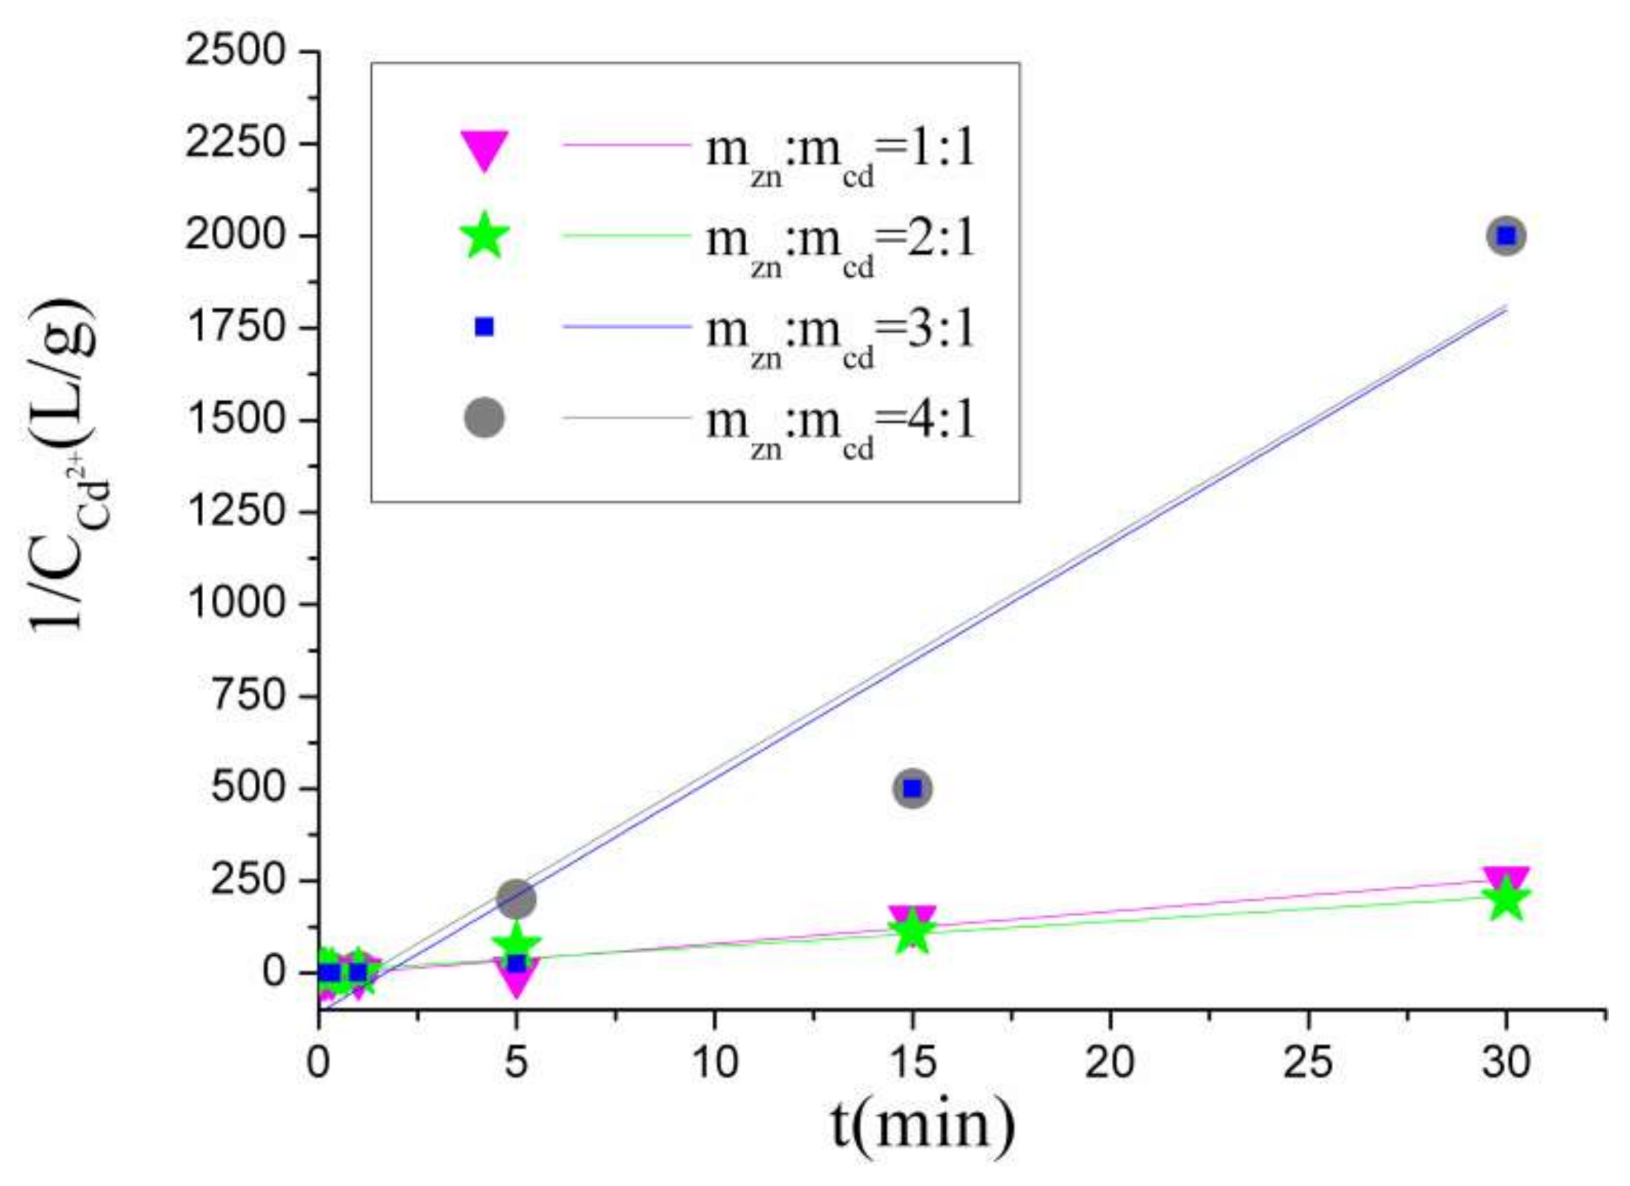
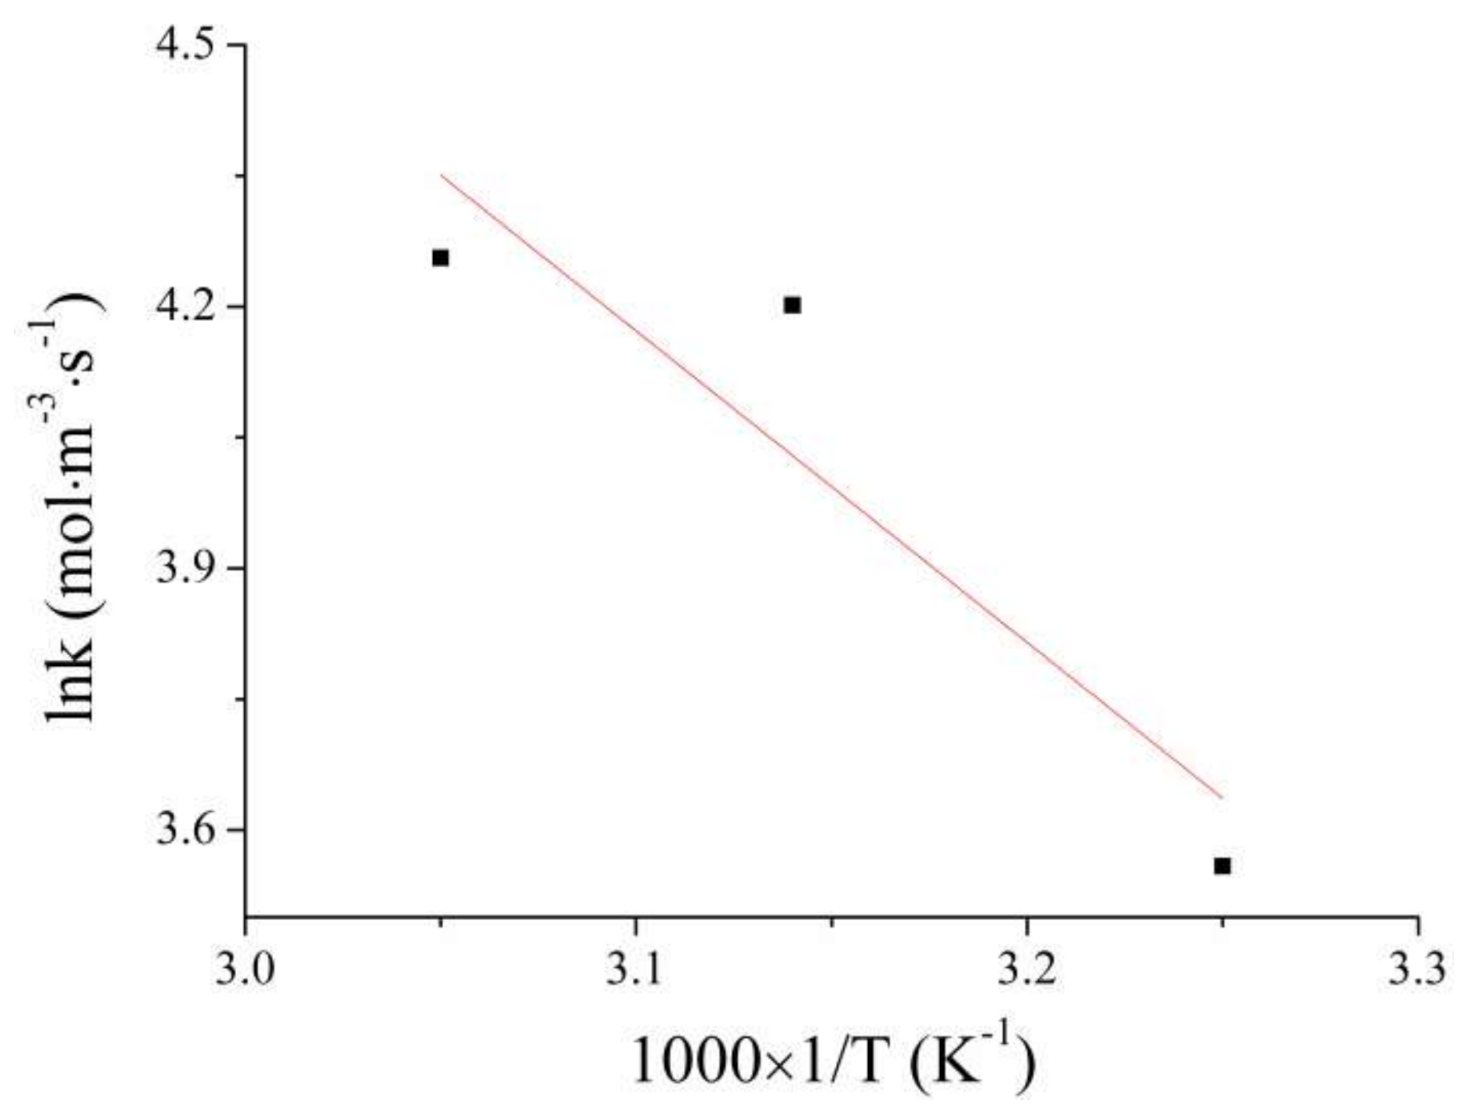
According to the kinetics analysis, the Cd removal reaction is a second-order reaction. That is, the reaction rate has a great relationship with the amount of reactants. Furthermore, the activation energy of this reaction is 29.6986 kJ/mol, so the reaction conforms to the diffusion control mechanism.

Author Contributions

The division of labor among the authors is as follows: writing—original draft preparation, X.R.; writing—review and editing, X.S.; software, J.D.; resources, H.L.; experimental operation, P.L. and S.Q. All authors have read and agreed to the published version of the manuscript.

Funding

This research received no external funding, it is mainly paid by me personally.

Institutional Review Board Statement

Not applicable.

Informed Consent Statement

Not applicable.

Data Availability Statement

Not applicable.

Conflicts of Interest

The authors declare no conflict of interest.

References

  1. Tian, X.; Wu, Y.F.; Gong, Y.; Zuo, T.Y. The lead-acid battery industry in China: Outlook for production and recycling. Waste Manag. Res. 2015, 33, 1–9. [Google Scholar] [CrossRef]
  2. Yu, H.J.; Zhang, T.Z.; Yuan, J.; Li, C.D. Trial study on EV battery recycling standardization development. Adv. Mater. Res. 2013, 610–613, 2170–2173. [Google Scholar] [CrossRef]
  3. Li, M.Y.; Yang, J.K.; Sha, L.G.; Hou, H.J.; Hua, J.P.; Liu, B.C.; Kumar, R.V. Review on clean recovery of discarded/spent lead-acid battery and trends of recycled products. J. Power Sources 2019, 436, 226853. [Google Scholar] [CrossRef]
  4. Li, L.L. Research and practice on the resources utilization of waste acid in waste lead acid battery. Sulphuric Acid Ind. China. 2019, 1, 33–36. Available online: https://kns.cnki.net/kcms/detail/detail.aspx?dbcode=CJFD&dbname=CJFDLAST2019&filename=LSGY201901014&v=icvBmaR3U%25mmd2B%25mmd2FNuolbo70LHD2IdvyFWThVyWmvtXpHD9R3F%25mmd2Fl0YVWKGkyUGK9SnYP4 (accessed on 11 August 2021).
  5. Li, B.; Wei, Y.G.; Wang, H.; Yang, Y.D.; Yin, Y.G. Preparation of ZnSO4·7H2O and separation of zinc from blast furnace sludge by leaching-purification-crystallization method. ISIJ Int. 2019, 59, 201–207. [Google Scholar] [CrossRef]
  6. Palden, T.; Machiels, L.; Regadío, M.; Koen, B. Antimony recovery from lead-rich dross of lead smelter and conversion into antimony oxide chloride (Sb4O5Cl2). ACS Sustain. Chem. Eng. 2021, 9, 5074–5084. [Google Scholar] [CrossRef]
  7. She, X.F.; Wang, J.S.; Wang, G.; Xue, Q.G.; Zhang, X.X. Removal mechanism of Zn, Pb and alkalis from metallurgical dust in direct reduction process. J. Iron Steel Res. Int. 2014, 21, 488–495. [Google Scholar] [CrossRef]
  8. Feng, H.; Liu, M.; Zeng, W.; Chen, Y. Optimization of the O3/H2O2 process with response surface methodology for pretreatment of mother liquor of gas field wastewater. Front. Environ. Sci. Eng. 2021, 15, 78. [Google Scholar] [CrossRef]
  9. Tasca, A.L.; Mannarino, G.; Gori, R.; Vitolo, S.; Puccini, M. Phosphorus recovery from sewage sludge hydrochar: Process optimization by response surface methodology. Water Sci. Technol. 2021, 82, 2331–2343. [Google Scholar] [CrossRef] [PubMed]
  10. Nanda, V.; Singh, S.; Raina, C.S.; Jindal, N.; Singh, K.; Saxena, D.C. Optimization of the process variables for the preparation of processed paneer using response surface methodology. Eur. Food Res. Technol. 2004, 218, 529–534. [Google Scholar] [CrossRef]
  11. Mei, Z.Y.; Zhang, R.F.; Zhao, Z.M.; Zheng, G.D.; Xu, X.J.; Yang, D.P. Extraction process and method validation for bioactive compounds from citrus reticulata cv. chachiensis: Application of response surface methodology and hplc–dad. Acta Chromatogr. 2020, 33, 270–280. [Google Scholar] [CrossRef]
  12. Rebollo-Hernanz, M.; Canas, S.; Taladrid, D.; Segovia, A.; Bartolome, B.; Aguilera, Y.; Martin-Cabrejas, M.A. Extraction of phenolic compounds from cocoa shell: Modeling using response surface methodology and artificial neural networks. Sep. Purif. Technol. 2021, 270, 118779. [Google Scholar] [CrossRef]
  13. Feki, F.; Klisurova, D.; Masmoudi, M.A.; Choura, S.; Denev, P.; Trendafilova, A.; Chamkha, M.; Sayadi, S. Optimization of microwave assisted extraction of simmondsins and polyphenols from jojoba (simmondsia chinensis) seed cake using box-behnken statistical design. Food Chem. 2021, 356, 129670. [Google Scholar] [CrossRef] [PubMed]
  14. Mgm, A.; Ht, B.; Jcd, B.; Jpkb, C.; Actvd, A. Understanding the chemistry of cation leaching in illite/water interfacial system using reactive molecular dynamics simulations and hydrothermal experiments. Acta Mater. 2020, 186, 564–574. [Google Scholar] [CrossRef]
  15. Adamou, A.; Nicolaides, A.; Varotsis, C. Bio-hydrometallurgy dynamics of copper sulfide-minerals probed by micro-ftir mapping and raman microspectroscopy. Miner. Eng. 2019, 132, 39–47. [Google Scholar] [CrossRef]
  16. Zekavat, M.; Yoozbashizadeh, H.; Khodaei, A. Leaching of antimony from stibnite ore in koh solution for sodium pyroantimonate production: Systematic optimization and kinetic study. Miner. Met. Mater. Soc. 2021, 73, 903–912. [Google Scholar] [CrossRef]
  17. Peng, H.; Shang, Q.; Chen, R.H.; Leng, Y.M.; Guo, J.; Liu, Z.H.; Tao, C.Y. Oxidative leaching kinetics of vanadium from the vanadium-chromium-reducing residue with K2Cr2O7. ACS OMEGA 2021, 5, 8777–8783. [Google Scholar] [CrossRef] [PubMed] [Green Version]
  18. Liu, H.P. Hydrometallurgy—Leaching Technology; Metallurgical Industry Press: Beijing, China, 2010; pp. 28–50. [Google Scholar]
  19. Wu, S.H.; Liu, C.Y.; Lan, Y.Z. Kinetic study on the precipitation of spongy bismuth by substitution of iron powder. Hydrometall. China 2007, 26, 139–141. [Google Scholar] [CrossRef]
  20. Jin, Y.H.; Wu, S.X. Kinetics of surface transpositional coating of copper on iron powder. Mater. Rev. China 2007, 21, 226–229. Available online: https://kns.cnki.net/kcms/detail/detail.aspx?dbcode=CJFD&dbname=CJFD2007&filename=CLDB2007S1069&v=vAUlZHPBoRhbFoJsrzzULpaJONrl05hJ%25mmd2FOJ1a3uCTd8Xe9XAWtUYiJ3MO03oEkDI (accessed on 11 August 2021).
  21. Li, S.L. Physical Chemistry; Higher Education Press: Beijing, China, 2017; pp. 551–569. [Google Scholar]
Figure 1. Corresponding relation diagram between the predicted value and actual value.
Processes 09 01437 g001
Figure 2. Influence of the reaction temperature and reaction time on the Cd removal rate.
Processes 09 01437 g002
Figure 3. Influence of the reaction temperature and zinc powder dosage on the Cd removal rate.
Processes 09 01437 g003
Figure 4. Influence of the reaction time and zinc dosage on the Cd removal rate.
Processes 09 01437 g004
Figure 5. Second-order reaction fitting lines under different zinc powder dosages.
Processes 09 01437 g005
Figure 6. Fitting diagram of the second-order reaction at different temperatures.
Processes 09 01437 g006
Figure 7. Arrhenius diagram.
Processes 09 01437 g007
Table 1. Factors and levels of the Cd removal rate optimization experiment.
LevelsFactors
T (°C)t (min)mZn:mCd
−13551:1
045103:1
155156:1
Table 2. Experimental scheme and results of the Cd removal rate.
Sequence NumberT (°C)t (min)N (mZn:mCd)η/%
13553:172.85
25553:194.19
335153:198.71
455153:199.76
535101:163.35
655101:179.71
735106:199.75
855106:199.85
94551:162.67
1045151:172.10
114556:199.40
1245156:199.95
1345103:197.17
1445103:198.08
1545103:198.19
1645103:198.42
1745103:198.30
Table 3. Regression analysis results of the Cd removal rate.
Sources of VariationQuadratic SumDegree of FreedomMean Sum of SquareF Valuep ValueSignificance
Regression model3067.9112255.661030.18<0.0001Highly significant
A(T)67.73167.73272.93<0.0001Highly significant
B(t)24.90124.90100.330.0006Highly significant
C(N)1042.6411042.644201.33<0.0001Highly significant
AB102.921102.92414.72<0.0001Highly significant
AC66.10166.10266.34<0.0001Highly significant
BC19.71119.7179.440.0009Highly significant
A224.97124.97100.620.0006Highly significant
B287.10187.10350.96<0.0001Highly significant
C2711.481711.482866.92<0.0001Highly significant
A2B47.43147.43191.140.0002Highly significant
A2C8.0818.0832.560.0047significant
AB20.8810.883.540.1330Nonsignificant
Pure error0.9940.25
Total deviation3068.9016
Note: ABC, AC2, B2C, BC2, A3, B3 and C3 are all 0, so they are not listed separately in the table above.
Table 4. Cd2+ concentration (g/L) in solution with different zinc powder dosages and reaction times.
Reaction Time
(S)
mzn:mcd
1:12:13:14:1
59.18.68.06.8
106.955.75.82.7
2063.43.11.7
602.41.51.50.19
3000.30.0140.040.005
9000.0070.0090.0020.002
18000.0040.0050.00050.0005
Table 5. Summary of the fitting degree of each reaction.
mzn:mcdReaction Series
Zero-Order ReactionFirst-Order ReactionSecond-Order Reaction
1:10.350.830.97
2:10.230.600.95
3:10.250.810.92
4:10.080.650.93
Table 6. Cd2+ concentration (g/L) changes at different temperatures.
TemperatureReaction Time
20 s1 min5 min15 min30 min
354.21.60.030.0020.001
453.11.50.040.0020.0005
552.80.80.030.0010.0005
Table 7. The variables of the Arrhenius equation.
TemperatureK (mol·m−3·s−1)ln K
(mol·m−3·s−1)
T (K)1000 × 1/T (K−1)
3535.123.56308.153.25
4566.814.20318.153.14
5570.524.26328.153.05
Note: K is the rate constant, and T is the Kelvin temperature in the table above.
Publisher’s Note: MDPI stays neutral with regard to jurisdictional claims in published maps and institutional affiliations.

