Article

Universal Model for the Cogeneration of Heat, Power and Char in a Decoupled Pyrolysis and Gasification Process for Techno-Economic Assessment

1
Scientific Research Centre—SRC Bistra Ptuj, Slovenski trg 6, 2250 Ptuj, Slovenia
2
SynCraft Engineering GmbH, Münchner Straße 22, 6130 Schwaz, Austria
*
Authors to whom correspondence should be addressed.
Processes 2021, 9(8), 1442; https://doi.org/10.3390/pr9081442
Submission received: 12 July 2021 / Revised: 16 August 2021 / Accepted: 17 August 2021 / Published: 19 August 2021

Abstract

:
Present work aims to present a complete and detailed heat-mass balance data, streams elemental and species composition as crucial input data for Techno-Economic Assessment (TEA). Combined heat, power and char (CHPC) generation in decoupled pyrolysis and gasification processes ensures a highly efficient, reliable and sustainable economic use of biomass. Innovative process model based on simultaneous heat-mass balance with the elemental (C, H, O) and species (CO, H2, CO2, CH4 and H2O) composition of each stream provides reliable data with a general/average variability in a range of ±10% and ±5% for the main outputs. Thermodynamic calculations verified not only the concept but also a numerical range of the results. Comparisons with recently published, scientific and data from technology providers, prove their general applicability and consistency. TEA cases, presented in a complete and detailed table, allow selection of the relevant calculation basis providing reliable data for doubtless evaluation at investors/entrepreneurs striving for a successful business model.

1. Introduction

On average, forests cover 43% of European Union land area but in some Member States forests account for more than 60% of total land area [1]. The European Forest area grows [2] and woody biomass offers a valuable perspective for a green, low-carbon, circular economy. In the energy sector, especially for residential heating, Combined Heat and Power (CHP) offers an optimal solution. Applying smaller (village) or larger (city) open district heating systems, several smaller decentralised heat providers can be integrated. Combined heat and power CHP plants using wood Biomass (BM) in the cheapest form of wood chips and operating at low OPEX without problematic waste offer an optimal solution for the local economy and investors. A highly efficient, proven and reliable technology is a challenge to meet all these requirements.
In the presented model of Techno-Economic Assessment (TEA) CAPEX and OPEX issues are not in the focus of attention. We assume that CAPEX is the result of a commercial offer and negotiation between investor and technology provider. Characteristically, in the gasification technology market, each type of technology offers only one provider or technology owner and influence most. OPEX, on the other hand, depends primarily on local conditions. Generally, it is affected by various costs such as labour costs, process equipment maintenance, Internal Combustion Engine (ICE) maintenance, insurance situation, BM logistics and storage costs. The revenue side mostly influences electricity prices and government incentives (types of operation), char product price, heat prices and operational mode and possibilities to utilise products a whole year for various purposes (e.g., cooling by using heat in summer). Investors evaluate these circumstances thoroughly trough business model.
By understanding and, above all, reducing the uncertainties associated with investments in gasification technologies, investors are becoming aware of the existing threats. First, every investor expects a positive income from the calculated profit and loss account, which is undoubtedly a primary economic indicator. The second important “milestone” for the investor is the guarantee to secure the operating hours per year. Sticking to the technical side of the problem, the analysis of the mentioned guarantee not only provides the quantity of the product (kWh of energy produced) but also ensures the quality of the running process itself. Tars and condensates should present no problem during operation, and the process must run smoothly with little or even no intervention. Thirdly, tolerances of an input BM quality in terms of water, fines and ash content provide a window for the use of low-cost input.
State of the art on the market in Europe and worldwide still offers many solutions but relatively small numbers of reliable technologies at TRL level 9 [3]. The market analysis exposes only a few technologies with the largest power volume in terms of kW sold. The first five technologies dominate, others are relatively small; only a few are growing. A Cogeneration of Heat, Power and Char (CHPC), carbon-negative technology tends to grow and represents one of the most technically advanced and reliable technologies for biomass gasification on the market.
A robust, realistic, detailed and complete universal process model improves TEA calculation and helps investors to create a reliable investment program. A business model based on supplier guarantees for technical process data helps investors to avoid wrong decisions and investment failure at the end. With the detailed and complete TEA data [4], most of the technical and economic circumstances become evident and help to reduce the uncertainties to an acceptable low level. Investors need to understand some social or even cultural issues at a local level that influence the investment. The universal model helps to clarify uncertainties by providing a deep understanding of mass and energy streams, including efficiency and losses [5]. Based on such an understanding, work aims to contribute to:
evaluation and calculation of the theoretical process model of CHPC process based on elemental (C, H, O) and species (CO, CO2, H2, H2O, N2) composition at each process stage;
building typical-standard case using wet wood chips input;
upgrading and fulfilment of published process technical data;
developing a model of mass and heat balance adapted to support TEA entirely,
clarifying of mass and energy streams details presenting the potential for process improvement.
CHPC technology is designed as a reliable technical solution for the conversion of chemical energy of solid biomasses (inputs) into energetic gases (CO and H2), which can be used for cogeneration of electric, thermal energy and charcoal (CH). This way, all outputs are considered as an equivalent product with market value. The efficiency of the process is equally focused on electricity and heat production. The process is suitable for local district heating systems or energy supply to the production process (steam generation can easily be added if needed) towards the use biomass as a substitute for fossil fuels and reduction of the CO2 emissions.

2. Materials and Methods

2.1. Materials

Only two materials occur in the gasification process, BM as input material and Char (CH) as output one. Since there are many types of BM and its definitions, a precise standardised type of wood-based material was BM taken. In the case of output, the characteristics of the char product are decisive for its use, and appropriate selection criteria must be applied.

2.2. Wood Biomass

The definition of “standard” wood BM use in the model is described in detail in previous work [4]. Following the summary of the standard BM definition in the form of wood chips of size P16 according to EN ISO 17225-1: particle size, P16 (≥75% in the range of 3.15 mm to 16 mm, ≤5% fines (smaller than range) and ≤3% larger than the size), fines F05, moisture M10, ash A0.5 and LHV Q16. Definition complies with widely recognised Austrian ÖNORM M7133 quality types G30 and G50. Widely available “standard” biomass used in a model and their thermal properties are presented in Table 1.

2.3. Char

CH product generally determines different properties such as composition (Cfix, ash content, volatile matter, Polycyclic aromatic hydrocarbon (PAH) content, …) and physical properties (specific surface area, water retention, particle size and others). Analysis results suggest or limit some applications possibilities of CH. Attractive application of CH is its use in the soil as Biochar (BC), carbon sequestration additives, manure stabilisation, barbecue charcoal and others. To compare the properties of CH, as a product of the CHPC process, with the BC guidelines, a European Biochar Certification (EBC) c platform [6] provides reliable data.

2.4. Brief Overview of the Gasification Processes in the EU Market

The development and installation of gasification systems have increased remarkably over the last 20 years. A short overview of the specific market development [3] shows that only a few technologies reach the first three places in the EU market share. Characteristically, most of the successful first two processes run autothermal with air gasification in a single reactor operate as a fluidised bed and fixed bed process.
The first, most widespread technology has achieved a total installed capacity of almost 30 MW Pel at the end of 2016 [3]. This technology differs from others by using wood pellets as fuel. The feedstock is fed into the gasifier from the bottom, and the producer gas leaves the gasifier from above. An updraught concurrent flow gasification takes place in the reactor while forming a stationary fluidised bed. This is generated with airflow from the compressor. The gasification stages (drying, pyrolysis, oxidation and reduction) are performed inside the gasifier from bottom to top. The design maximises the retention time of the fuel in the gasifier and provides enough time for the gases to react with the char. The process weakness is the sensitivity of the reactor to a high ash content of the fuel (only A1—pellet quality with low ash can be used), the fuel path in the reactor causes the ash to melt and form a lump within the gasifier and block the input flow. Consequently, the use of pellets guarantees a homogeneous input BM form such as particle size, low moisture (10%) and high density (up to 750 kg/m3). Heat is recovered from both the hot producer gas and the CHP engine, which operates in dual fuel mode and requires the use of biodiesel oil. Another feature of this gasification plant is the integration of cyclone scrubber for the removal of tar compounds [7,8], which ensures a low tar content in the synthesis gas. The main advantage of this technology lies in the excellent electromechanical and manufacturing solutions of the technology supplied by the manufacturer, which allows providing a full guarantee for the planned annual operating hours. The exclusive use of (A1-pellets) low ash quality restricts the possibilities of combining different pellet origins and thus the prices, resulting in relatively higher BM input costs.
The second most widely used technology in an EU market reached a total installed capacity of around 26 MW Pel [3] at the end of 2016. Technology is commonly referred as “Joos gasifier”, from the name of the inventor of this design [7]. A stationary downdraft biomass gasifier is susceptible to the BM used, defined as particle size P31S, fines F10, water content (WC) M10 and ash content (AC) A1.0 according to EN ISO 17225 standard. Characteristically, BM drying process is not integrated into the whole CHP process left to the user initiative. BM enter through metal particles separator and pass to downdraft reformer, hot gases (syngas) together with solid residues leaves the reactor through the heat exchanger to be cooled down to the temperature suitable for filtration. In the last stage of the process, syngas and solid particles are separated inside special bag filter. Solid part, char and ash with absorbed tars leaving the process. Cold and clean syngas (wood-gas) finally enters the ICE to generate electricity and heat. The process achieves a nominal electrical efficiency of 23% and a thermal efficiency of 52% [7,8]. The advantage of considered technology is the available sizes (10, 25, 45, 49 and 68 kW of Pel) adapted to small, mostly rural users and the possibility of modular combination for larger sizes. The manufacturing and electromechanical technological solutions of the equipment are excellent, enables the supplier can guarantee the planned operating hours. The overview of the structure of operating costs (OPEX) gives figures that may be relatively higher due to the amount of maintenance and monitoring work required. Finally, the combination of efficiency and operating hours to OPEX figures indicates the final financial effect of the technology used and reveal its shortcomings.
Over the last decade, the multistage approach to gasification has been the main driver of the innovations in the field [9,10]. Staged systems physically separate some reactors of the subprocesses involved such as drying, pyrolysis, reforming, separation, condensation; occurred during thermochemical conversion and synthesis gas conditioning [11]. The separation of the pyrolysis and gasification stages enables precise control of the overall process, resulting in a high-quality of the producer gas in terms of composition and tar loading. On the contrary, the additional equipment and reactors required can cause higher costs compared to single-stage gasifiers. The advantages of the technology are not limited to a better controllable operation. The technology accepts a wide range of BM quality, enables very high efficiency, opens possibilities of energy recovery, reports low maintenance, long uninterrupted working periods and consequently a relatively low OPEX. A CHPC technology unifies the characteristics mentioned above into a remarkably efficient and reliable process.

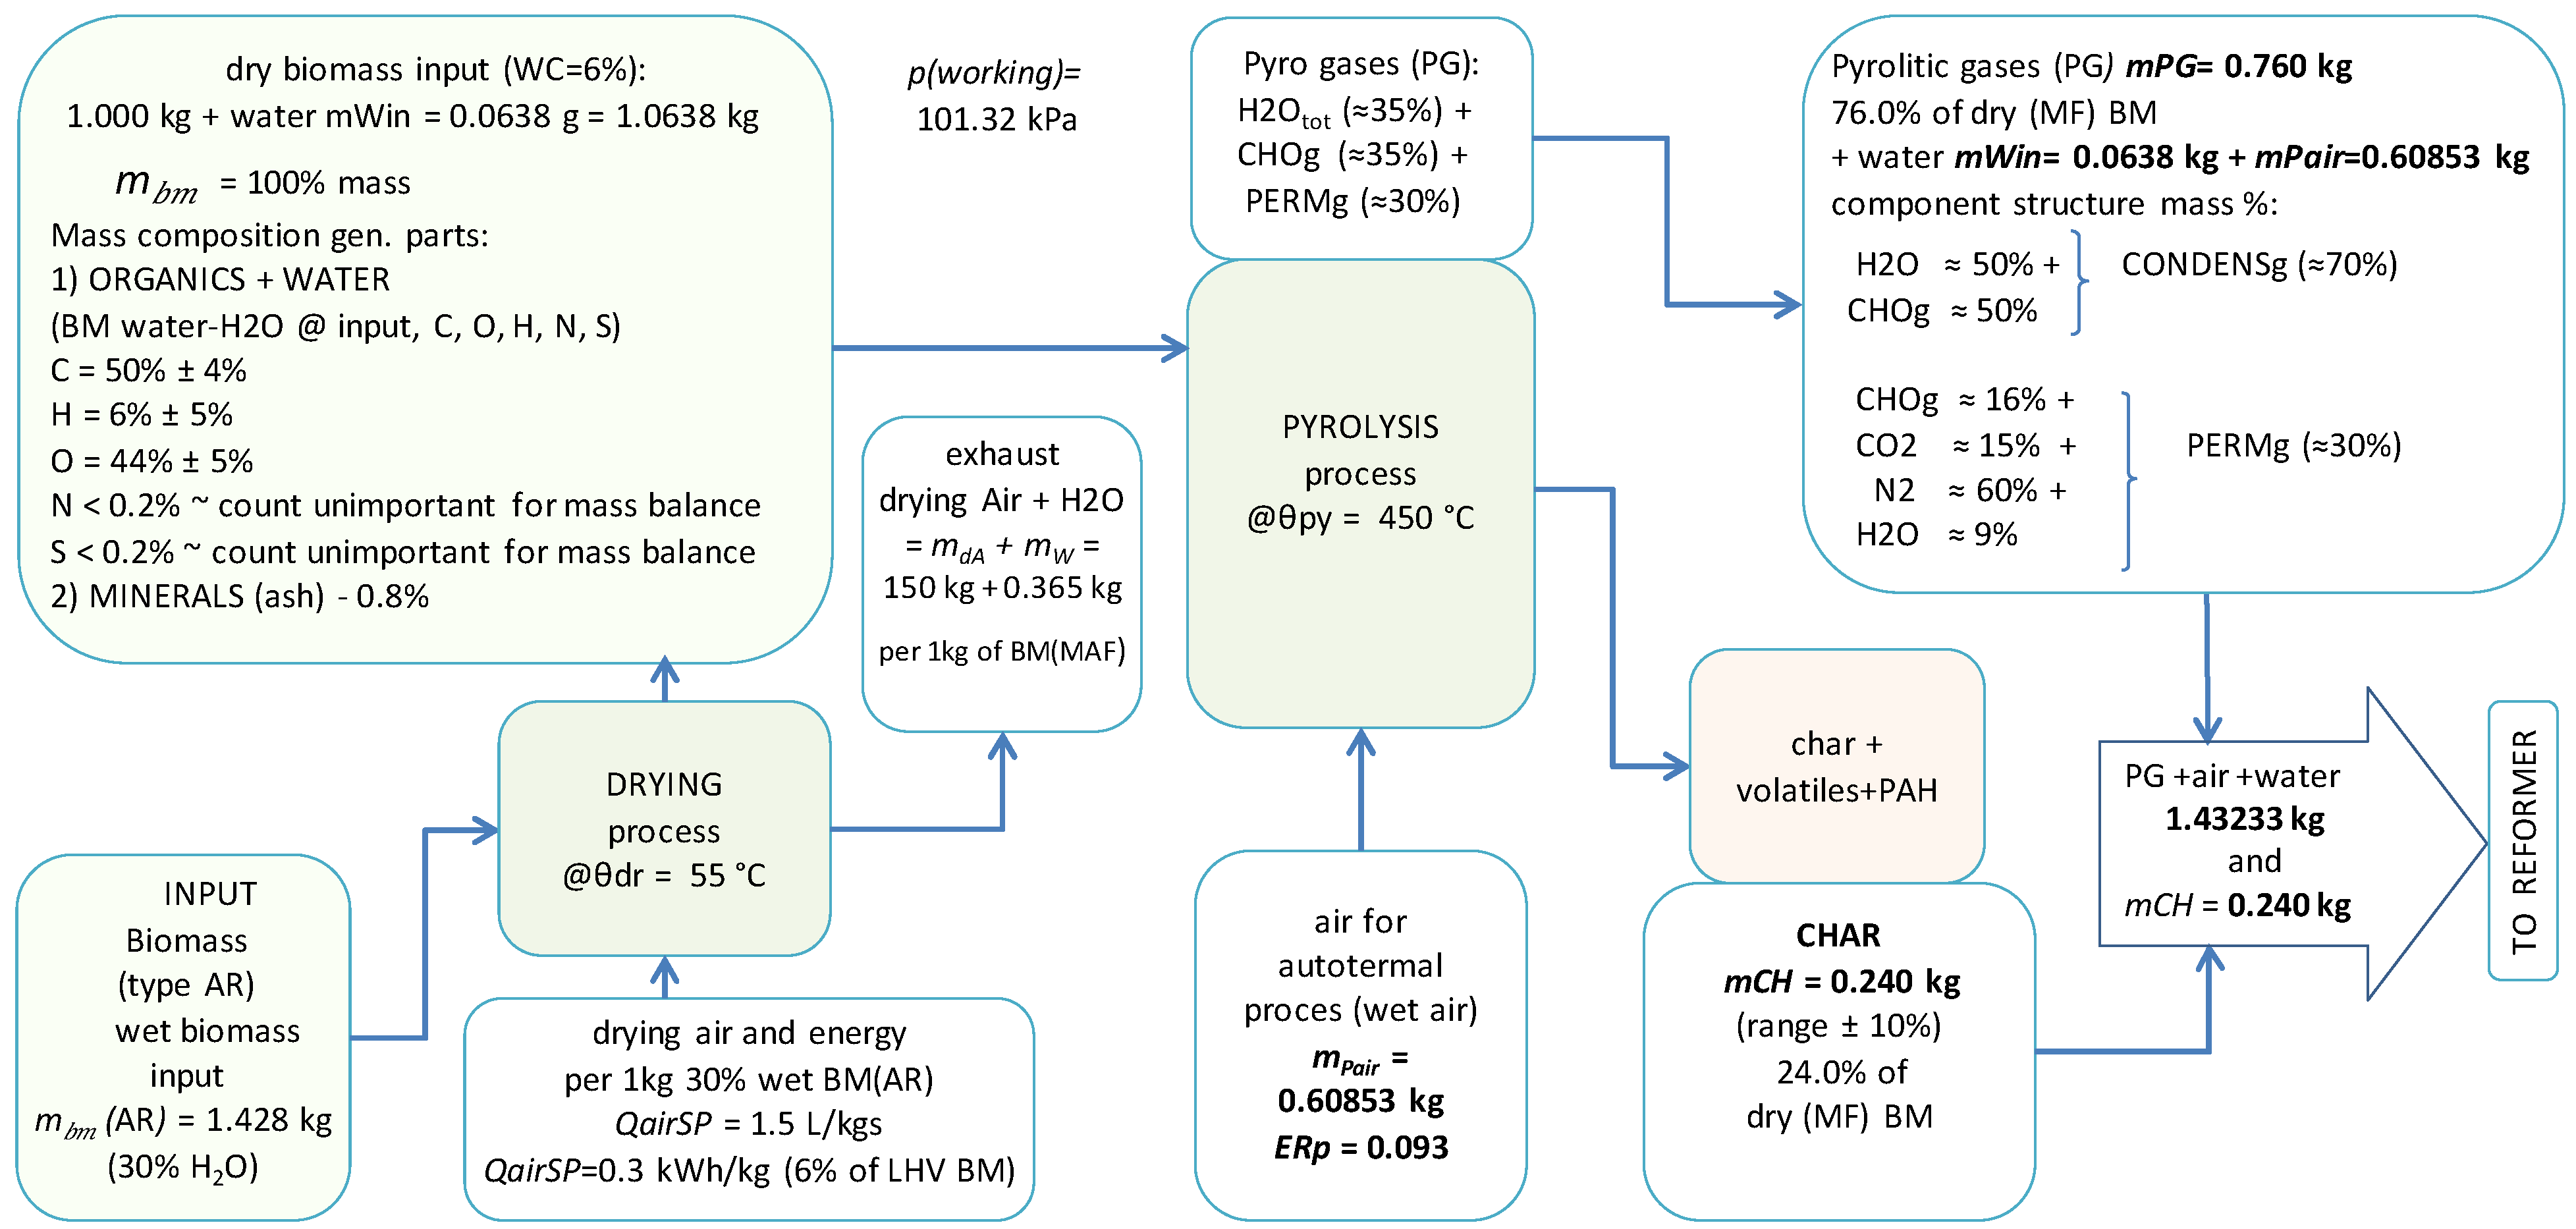
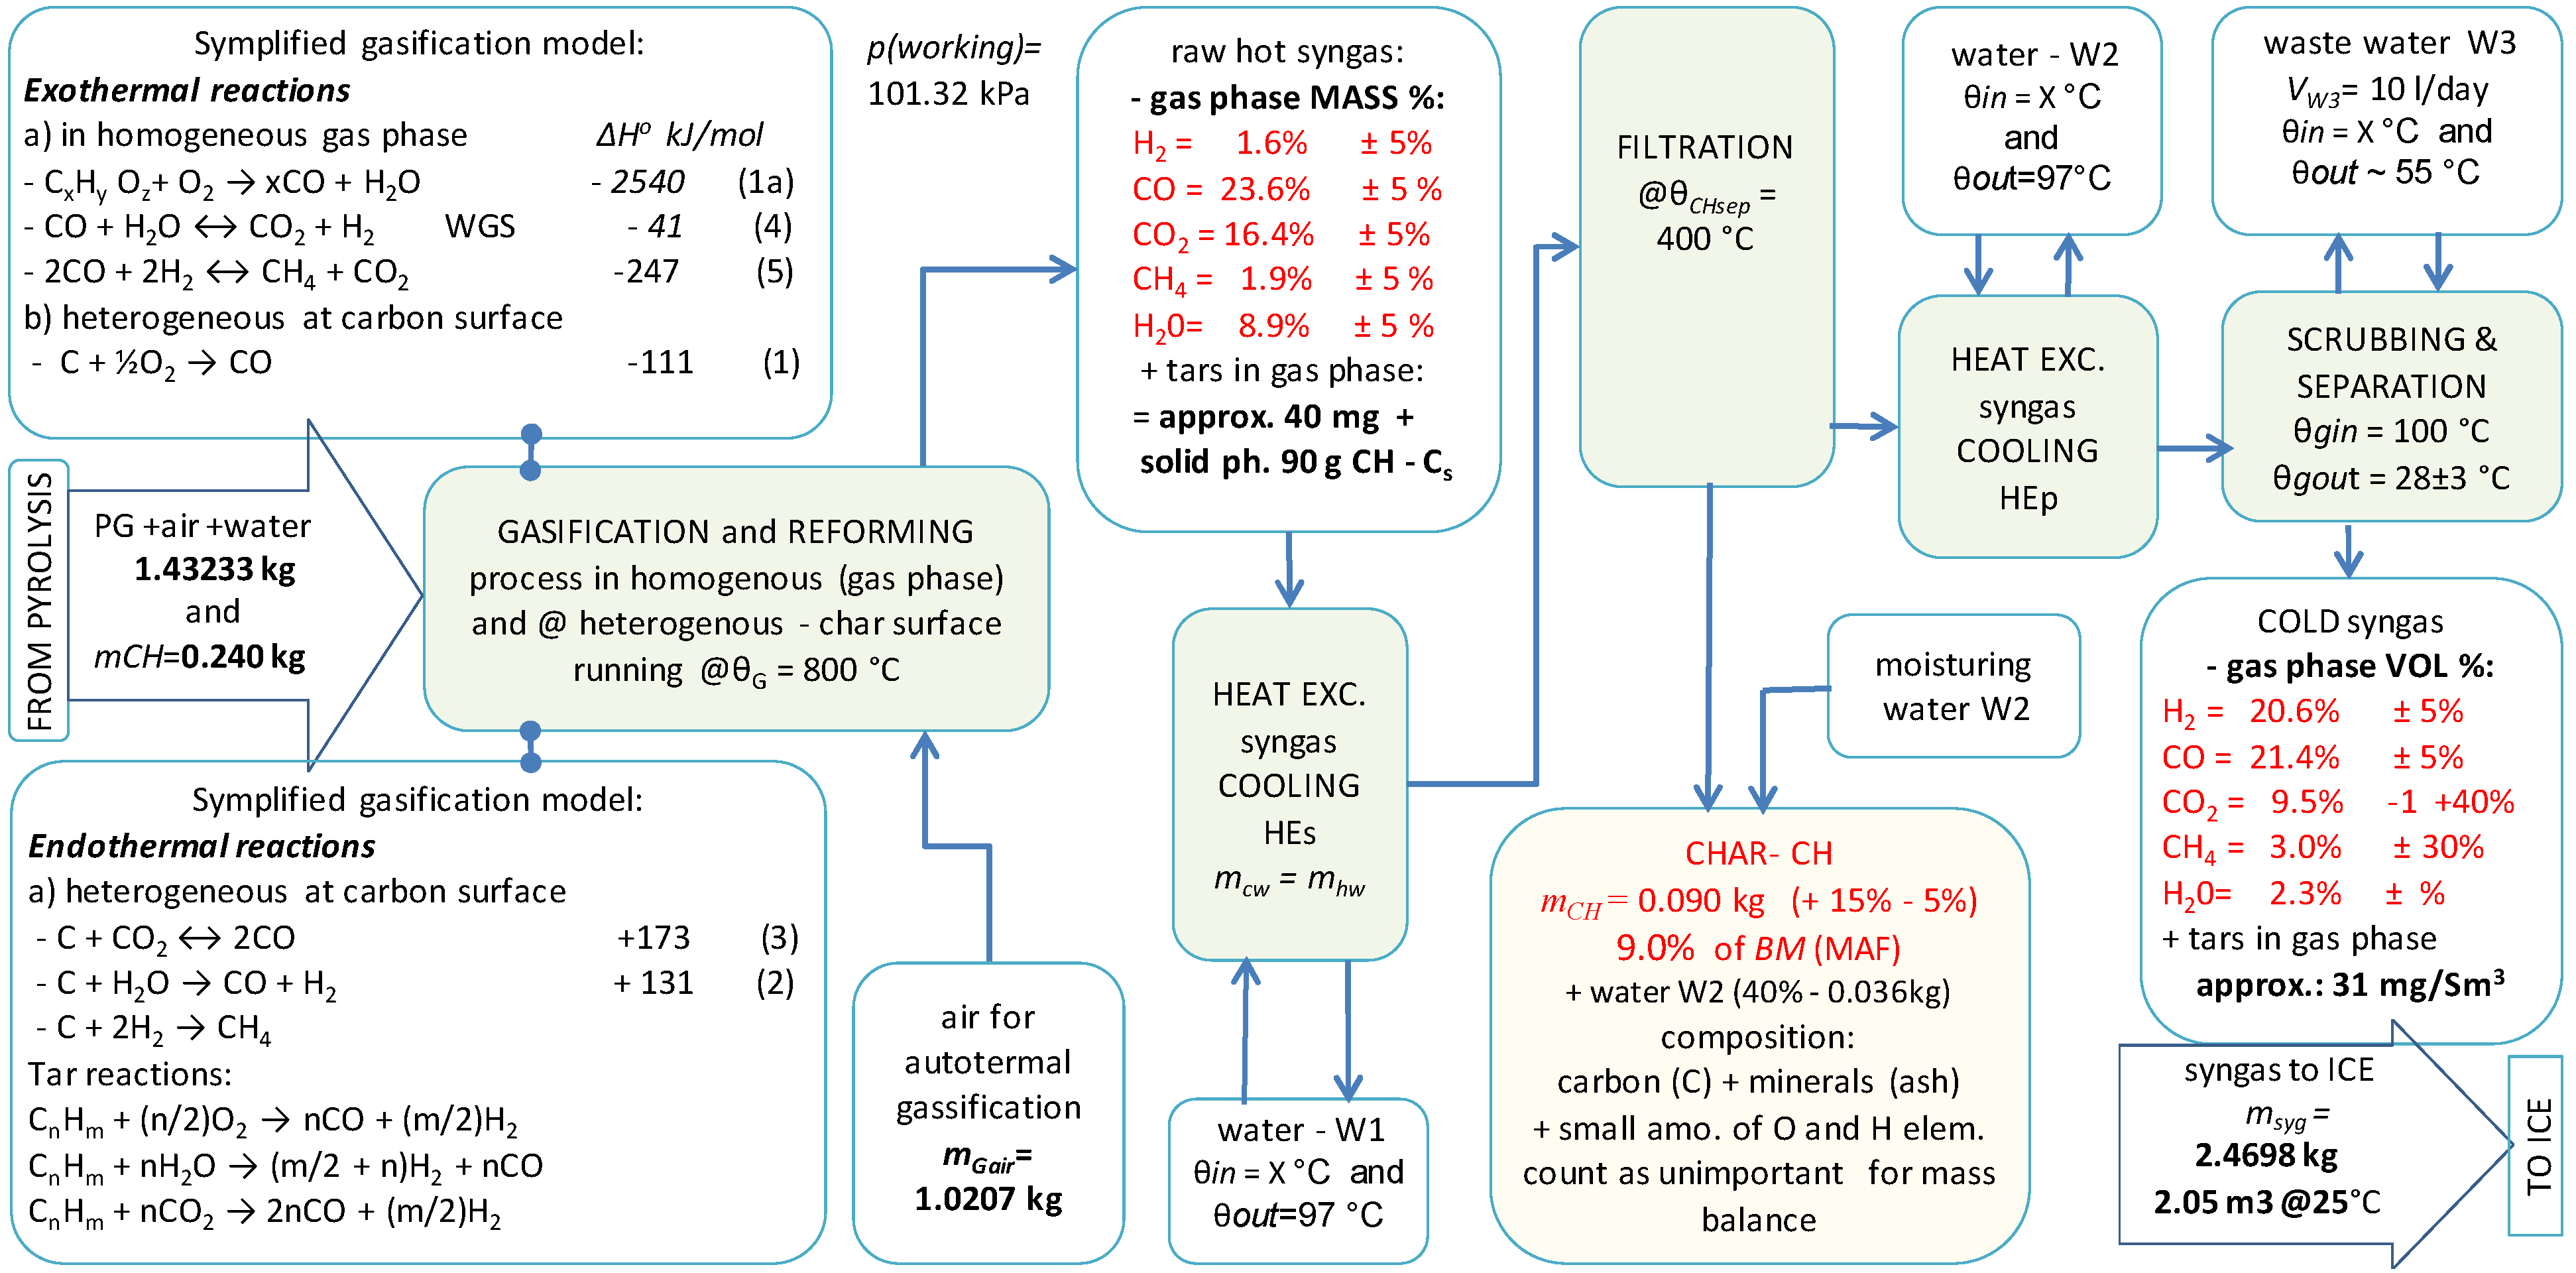
2.5. CHPC Process Description

Since 25–30 years ago, a market boom of BM gasification systems for cogeneration come up [12], a syngas or producer gas purity becomes a central issue. The development of spouted bed gasifier [13], in which tars from pyrolysis are catalytically decomposed and gasified with char (carbon) particles, allows the production of very clean syngas (<35 mg of tars/Sm3).
Figure 1 shows a complete detailed process diagram of the CHPC process for unambiguous discussion. A separation of pyrolysis and gasification reactors, burning of tars and the integration of drying are the main features of the CHPC process. No gasification/cogeneration process has integrated dryer unit into a standard process configuration; even some authors clearly show enhanced efficiency of the whole process [14]. The reason lies in knowledge about the drying process. Applying extensive drying process fulfil the gap with low equipment price, simple servicing and robust operation. The gasification reactor, separated from the pyrolysis, allows both sub-processes to be precisely controlled by air dosing in order to maintain process temperatures stable and within a narrow range. Generally, this made the process more elementary and consequently less complicated. Separated pyrolysis process developed as an autothermal reactor with mowing bed allows a very wide range of BM particles to be used. Reactor tolerates dust and fine particles together with large particles up to 50 mm. Wide particle range, including dust, ash and moisture content up to 40% gives a very tolerant range of feasible BM input. Such a tolerant quality range of BM gives a lot of freedom at purchasing prices.
After fresh BM drying, on a Figure 2, a hot and relatively dry (calculate on 6% of WC) BM enters the pyrolysis process. Autothermal pyrolysis process runs at Equivalence Ratio (ER) of 0.093—(ER—actual air-fuel ratio to the stoichiometric air-fuel ratio for combustion). Means the addition of air controls the process to run in a reductive atmosphere and generates enough energy to maintain the process at θpy = 450 °C. Complete pyrolysis products, char (CH) and whole pyrolysis gases (PG) enter the reformer/gasifier reactor via screw conveyor (TR 4, Figure 1). At reformer entrance, a separation device removes heavy particles (stones, glass, metal parts…) from CH stream. Particles are collected in a drum at the bottom. In the same separator, a second portion or gasification air is added to the input stream. Exponential cone at the spouted bed gasifier construction input causes a high velocity of the gas stream assures long residence time for large CH particle to react until becomes so small (approx. ≤50 μm) to start float on gases stream at the top of the reactor. Precise addition of air to gasifier maintains process temperature at θpy = 800 °C with a total ER ratio of 0.25. Generated heat covers all reactions heat needed (model reactions 1, 1a, 2, 3, 4, 5 on Figure 3 with contain all losses and material heat up to θG. ER ratio used in the whole process (in our case 0.25) indicates an equipment quality regarding insulation and heat loses. Consequently, CO2 content in syngas leaving the gasifier indicate the process quality while most of the energy generates reactions 1, 1a and 5 from Figure 3. Model calculation gives an excellent result of 9.5 vol% with a possible result variability of −1 + 40%. A large positive range of variability implies to the sensitivity of the parameter and process behind.
As mentioned above, when char particles become so small that start to float on gases at the top of the reformer, the last stage of the gasification process begins. Gasification process from Figure 3 continues until the diameter of the char particles falls to a size small enough that synthesis gas transports them out of the reactor. A syngas loaded with fine char particles leaving the gasifier/reformer is cooled in a heat exchanger HEp to the filtration temperature θCHsep = 400 °C. After the separation in a ceramic hot gas filter system, char remains as a by-product (9% of the input BM). All solid particles, including the mineral components (ash) from BM, remain in the char by-product leaving the filter system. Hot CH needs to be cooled and moisten with water. Mixer on Figure 1 homogenise wet char with 40% of water and transport to automatic big bag filling device large enough to last several days before removing. Char produced has the potential to be used for several purposes mentioned above [15,16].
Heat exchanger HEs cool dust free and hot syngas leaving the filtering unit with high temperature water circuit. Syngas contains a relatively high amount of water, around 9 mass% of all gases which can condense by cooling in the range below 50 °C. To condense a surplus of water, fine clean of dust particles and absorb ammonia gas, a water scrubber (SC) is applied. Clean, cool syngas (θsyg = 28 ± 3 °C) saturated with water (Xsyg = 20 g/kg) contain only 1.7 mass% of water means most of the water is separated. As the gas is saturated with water, a problem of possible condenses in gas ramp connected to the ICE exists. A heating cable with moderate heating and thermostat assures a constant temperature and avoid condensation.
Cold wastewater leaving the SC (W3 on Figure 1) contain ammonia (from nitrogen in BM) is not dirty and can be disposed to the wastewater system. Syngas burns in the ICE to generate power and run an electric generator. The efficiency of generators could be between 80 to 95% depending on construction (type of product) used. Generator cooling air (HEge on Figure 1) blow out all energy loses. ICE contains a rather large amount of lubricating oil dissipating heat and need to be cooled by heat exchanger—HEoc. ICE block water cooling system exchanges energy with the heat exchanger—HEmc transfers energy to the main hot water stream—W1 Figure 1 The same happened with the flue gas energy collected by HEfg. In this way, the collection of useful, sensible energy from ICE is ensured, except for the flue gas-water condensation energy. The CHPC process achieves an electrical efficiency of 28%, a high temperature of 44% and a low temperature of 14%. The overall efficiency of BM energy conversion reaches 86%, without self-consumption counted as 10% of the electricity generated [16]. Own energy consumption in the form of electricity and low-temperature heat for BM drying reduces the overall efficiency of the plant to 84%.
Small gas storage—damper (GS on Figure 1) compensates small gas flow fluctuations after gasification and before entering the gas ramp supply the ICE. A flare as a standard component ensures safe operation during start-up or ICE maintenance.
The CHPC technology guarantees as a contraction obligation a continuous operation of more than 6000 h per year. In practice, the continuous operation of the plant has succeeded without the need for maintenance and cleaning. The main interruption of the continuous operation is caused by ICE oil change intervals (>2000 h means 2–3 times per year) as one-day operation; the gasifier runs continuously at low capacity with the combustion of syngas in the flare.

2.6. The CHPC Process Model and Simultaneous Mass and Heat Balance

Simultaneously build CHPC process model of mass and heat balance consists of the basic premise to run pyrolysis and gasification autothermal in separate reactors. The energy required for the conversion of BM is generated by the oxidation of the products in both processes. In the pyrolysis process, PG partially oxidise in oxygen-deficient to cover the process energy demand (Qproc) and to keep θpy constant at 450 °C. All the energy and material—char (CH)—are transported directly to the next stage gasification. In the gasification process, CH and PG partially oxidise and convert into syngas components—CO, H2, CO2, CH4 and H2O. In both processes, no energy leaves the process (to be used), and Qout is set to zero. Consequently, all the energy required comes from the processes. The combustion of the final product covers the indirect energy demand (e.g., BM drying) in a ICE or through energy losses in the steady-state operation of the overall process. The process model with integrated elemental (C, H, O) and species composition (CO, H2, CO2, CH4 and H2O) calculation provides additional equations to solve all unknowns. The analysis considers the real plant configuration shown in Figure 1, and process streams data from real processes in a steady-state operation [13]. Such an approach also supports the most likely product distribution and its variability range, which is the focus of the TEA analysis.

2.7. Pyrolysis and Gasification Model Equations

In continuous processes at steady-state BM (after drying) reach the hot zone and begin to pyrolyse to CH and PG. PG partially oxidises in an oxygen-deficient atmosphere and produces the energy required for pyrolysis (QPproc), the same reaction occurs during gasification (QGproc) according to Equation (1). In general, the energy of the BM at input provides all energy requirements in autothermal processes, as stated by Equation (2).
QPproc = QPburn and QGproc = QGburn
Qin = QBM = mBM (MAF)∙LHVBM
The energy required to perform both processes consist of three types of energy: (i) sensible and water evaporation energies, (ii) energy losses around reactors and (iii) energy of chemical reactions to run the conversion. The energy requirement for pyrolysis is defined by Equation (3) and for gasification by equation Equation (4).
QPproc = QPdem = qBM+vh + qBMwe + qPair + qPlos + Qpy
QGproc = QDdem = qPGheat + qCHarh + qGair + qGlos + QG
The total energies of the reactions (Qpy and QG) depend on the reactions and final product conditions and coordinate as Crombie [17] and Higman [18] indicate. Consequently, the result of the energy balance of involved reactions can be exothermic or endothermic [19]. A rather tricky calculation of the reaction energies (Qpy and QG) is solved with a simultaneous carbon mass balance calculation of both processes. Magnitude of the values is proportional to the Cold Gas Efficiency (CGE) calculation from the composition of the syngas [18] and the CO2 content. This way calculated CGE defines the efficiency of energy conversion from biomass, and the CO2 content indicates the magnitude of the energy losses in processes. The energy for the gasification process QG was taken as the sum of the selected six characteristic endothermic and exothermic reactions—1, 1a, 2, 3, 4, 5 shown in Figure 3 in the left corner. Selection of the reactions resulted from the calculation of the gas composition in Figure 2 and Figure 3 within the CHPC process model.
Calculation of the sensible and water evaporation energies (assigned as qx) go directly from material properties and solved mass balance by Equation (5).
q x = m x · θ i n θ p r o c C p x · d T         and   q we = m w · H ev
The only unknown in Equations (3) and (4) remains the energy for heating the reaction air qPair and qGair (actually their mass); furthermore, they are resolved by simultaneous calculation in the Mathcad spreadsheets. Sensible energies are recoverable during the process, except for water evaporation. Information about the water vapor content in process streams additionally opens possibilities for improving process efficiency in future development.
The heat and mass balance model of the CHPC process becomes significantly reliable by including the simultaneous calculation of the elemental composition of the streams (C, H, O), proposed by Higman [18] and species composition such as CO, CO2, H2O, H2 together with CH4, respectively. The calculation of the carbon, hydrogen and oxygen balance in this order was essential for successful convergence of the model calculation [18,20]. Both compositions were calculated at process output as pyrolysis, gasification, condensation and separation. Such an approach significantly improves the reliability of the model calculations achieving an average variability of the product composition and heat-mass balance data in a range better than ±10%. Enthalpies of solid and gaseous species are taken in the middle of the temperature range considered. Enthalpies of the gaseous species at p = const. can be replaced by Q according to ∆H = Q:
a t   p = c o n s t .     m e a n s   Δ H = Q     a n d   H i ( T ) = H i , 0 + θ i n θ p r o c e s C p , i d T
Calculated case based on the unit mass at the input means 1 kg BM Moisture and Ash Free (MAF), real BM contains the equilibrium moisture after drying (WC = 6%) and is declared As Received (AR). According to this definition, 1 kg of BM(MAF) and 63.8 g of water were taken at the input, i.e., 1063.8 g of BM(AR). BM and presented water must be evaporated (qBMwe) and heated (qBM+wh) to θpy Equation (6):
q B M + w h = B M ( AR ) · { C p B M · ( θ p y θ i n ) + W C · [ ( H W v ( θ p y ) H W v ( 100   ) ) ] }
Simultaneous solution of the Equations (3) and (4) using Equations (2) and (5), together with the elemental (C, H, O) and component composition from Figure 2 and Figure 3 for qPair and qGair converging for qPair = 270 kJ at mPair = 0.604 kg and qGair = 793.1 kJ at mGair = 1.021 kg for a unit mass input. Results allow the calculation of the main indicators of the autothermal process, such as the equivalence ratio of the air used (ER) and the cold gas efficiency (CGE). For the pyrolysis, ER is calculated as 0.093 and 0.25 for the gasification, at the same time CGE reach 0.75 for the cold gas output-entering ICE. Results indicate a highly efficient process, Equations (3) and (4) allow detailed mass and energy flow calculations within process streams, providing an opportunity for further process development. Table 2 and Table 3 show the exact results of the simultaneous calculation of the heat and mass balances and the corresponding outputs in the case of a unit mass input.
In autothermal processes, energy for the process initiation must be provided by external ignition and additional oxidation in both processes until θpy and θG are reached.
Static calculation applied in the model can be transformed to a dynamic one by replacing the masses (m) by the mass flow ()—consequently, energy transforms into energy flow or power—Q (MJ/kg)· (kg/h) → P (kW).

2.8. Case Studies Description

The case study considers (i) the views of investors or process owners on TEA, (ii) the economic potential of process streams and (iii) technical data such as mass-heat balance and composition. Results are relevant for comparison with published data or data from competitors, which can be evaluated concerning reliability and variation limits. The results of the calculation of the unit mass case open up possibilities for linear interpolation to create economic relevant cases such as (1) the plant capacity, defined by the total power of the plant, (2) a BM mass flow at the input (BM), (3) the electrical power generated in the plant (Pel-out) and (4) the definition based on the heat output of the plant (Pheat-out). A previously developed economic mathematical function [4] presented in Equation (7) was used to calculate the required dependent parameters. Investors or users define independent parameters, while the process model provides the solution of the dependent parameters.

3. Results and Discussion

Decoupled pyrolysis and gasification in the CHPC process assure efficient process control and, in particular, the quality of the syngas with regard to tar content. Controlled gasification in char rich environment efficiently catalyses tar decomposition [21] to a technically very low, practically insignificant level [22]. Despite such an advantage, separate reactors do not cause any energy loss. Direct transfer of energy and material between stages and in-situ heat generation (autothermal process) minimises losses during conversion reactions [18] and during heat transfer. Equations (3)–(5) allow the optimisation and further development of the CHPC process structure since the individual streams are defined in detail (process parameters + mass and heat balance). The energy required for the evaporation of the input water (from BM) (qBMwe) remains in Equation (3) but also consumes energy directly from the input BM. Integration of the drying process into the CHPC process solves the energy problem and improves the process reliability. The elimination of the two critical (economic) concerns: (1) Variation of the WC at the input BM and (2) potential obstruction of the process in case of high-water input becomes manageable. The CHPC process is the first among the most successful commercial processes [3] with the integration of the drying process into the structure of the gasification process. A tricky old story about the allowable WC of the input material (how much WC can process accept) becomes clearly obsolete.

3.1. Unit Mass at Input Case

Model calculations, which are particularly suitable for TEA analysis, start with a unit mass case at the BM input. BM(AR) with 6% water (63.8 g) and 1000 g MAF material enter the pyrolysis stage, while fresh BM water may contain up to 50% water in some cases, but mostly at a level below 30%. Table 2 and Table 3 show the heat balance, while Figure 2 and Figure 3 show the mass balance and process model structure. The initial case of the unit mass input case allows the calculation of almost all linear combinations of input and output (product) streams relevant for the TEA analysis. A dryer shown in Figure 1 receives fresh wet BM (WC approx. 30%) and dry moisture in an extensive process (low temperature, long residence time—days) to residual equilibrium moisture of approx. 6%. Low-temperature water—W2 provides 11 MJ of energy (6.11% of input BM energy) to run the entire drying process. Hot and dry BM with approx. 6% of the water passes transport and dosing feeder to the pyrolysis reactor. Autothermal pyrolysis runs at θpy = 450 °C and air is added to maintain the temperature in a reductive atmosphere by generating QPdem = 1.837 MJ energy The generated energy QPproc heats biomass and water vapor qBM+wh, evaporates water from BM—qBMwe, heats pyrolysis air—qPair and covers heat losses from the reactor body—qPlos. In this way, the entire pyrolysis process QPdem = Qburn = QPproc = 1.837 MJ uses about 10.21% of the input BM energy, with an estimated uncertainty range of ±10%. A large part of this energy consists of a reversible (recyclable) part (qBM+wh + qBMwe + qPair)—1.4415 MJ (8.0%) and a smaller, non-recyclable part—qPlos (2.2%) is lost.
Products of pyrolysis—pyrolysis gases (PG) and char are transported directly to the gasification reactor. Screw feeder connects both reactors, on the gasification side of the feeder a gasification air enters (mGair) to the small separation chamber where heavy particles (stones, glass, metal parts or unwanted waste material) fall to collection drum—Figure 1. A mixture of PG, air and char particles enters to spouted bed gasification/reforming reactor. At the bottom of the reactor, large particles circulate and react in the gas mixture until they become so small to float on a gas stream at the top of the reactor. Gasification air maintains the temperature of an autothermal process at the average temperature of θref = 800 °C and generate heat needs for the whole process (QGdem = QGproc). Reactants as PG, char (CH) and air are heated from θPy up to θref according to Equation (3). Energy losses at reactor body—qGlos are also included. Overall heat for the process—is summarised as 2.419 MJ or 13.44% of input BM, a significant part—12.44% (92.5%) represents a reversible—recyclable part.
The energy loss in both reactors (qPlos and qGlos) is relatively low—2.2% and 1% of Qin [12] means that very effective solutions are used in the reactor design and the selection of insulation materials. The hot product stream leaving the reformer consists of producer gas—msyg = 2.7400 kg and char—mCH = 0.090 kg enters the heat exchanger HEp—Figure 1. HEp cools the mixture of gas and char to 430 °C and enters the candle filter to separate char from the product gas. The candle filtration operates at about 400 °C and completely separates syngas or producer gas from solid particles of char to level below <1 mg/Nm3. Tars in the form of very fine aerosols are efficiently destroyed and absorbed downstream in the reformer and separated in the candle filter to a value well below 50 mg/Nm3 [12].
After filtration, heat exchanger—HEs—Figure 1 cools the syngas from 400 °C to 100 °C. Both heat exchangers HEp and HEs are cooled by a high-temperature water stream (W1 and W2) with a temperature of hot water output of 95–97 °C connected to the district heating network as the main heat user.
As the producer/syngas contains a large amount of water—8.9% by mass (Figure 3—Mass composition of raw hot gas) separation is required. In the scrubber—SC syngas is cooled down to condense the excess water. The water condensate leaves the process as wastewater—W3 in a quantity of 10 L per day for unit mass BM input. The producer gas, from SC cooled to 25–28 °C and saturated with water, is transported to the gas storage tank—GS as a buffer and damper in the event of capacity fluctuations or if a switch to flare is required. The flare is activated in case of maintenance, emergency shutdown and in case of ICE malfunction.
Producer gas enters the ICE gas ramp, where a gas-air mixer ensures volumetric ratio of Air: Syng = 1.6–1.99. Flue gases, leaving the ICE are cooled down to 125 °C (HEfg) before entering the chimney. 75% of the input energy (CGE = 0.75) enters the ICE and 28.5% is converted into electricity (by electric generator). Another 43.9% of the energy can be used as high-temperature water (95 °C) and 14.3% as low-temperature water (55 °C)—Table 3. In summary, the CHPC process achieves an efficiency of 72.4% and 86.6% together with low-temperature energy.

3.2. TEA Relevant Cases

A linear transformation into a dynamic situation (mass and energy flow) was derived from the unit mass input calculations of the mass balance shown in Figure 2 and Figure 3. The TEA supporting model [4] consists of dependent variables (Y) and given or independent variables (x) Equation (7).
( Y 1 ,   Y 2 ,   Y 3 ) = f ( P t o t ,   P e l ,   P t h ,   B M ( MAF ) )
P t o t = P i n
P t h = P t o t · f a ( P t h )
  B M ( MAF ) [ kgh 1 ] = P t o t ( kW ) · 3.6 · ( L H V B M )
B M ( AR ) = B M ( MAF ) / ( 1 W V i n ) · ( 1 A C )
P e l = P t o t · f a ( P el )

Cases of Plant Capacity Definition

Case (1), ( P t o t )—total energy processed, power of the input BM defines the plant capacity; ( P tot ) is given or defined. Equation (13) defines dependent variables, starting calculation with Equations (9) and (10), and finish with Equation (12) for P e l
Y 1 = B M ( MAF )         Y 2 = P t h         Y 3 = P e l
Case (2), ( P e l )—given electric energy demand. Equation (14) defines dependent variables, calculation start with Equations (9) and (12), and finish with Equation (10).
Y 1 = B M ( MAF )         Y 2 = P t h         Y 3 = P t o t
Case (3), ( P t h )—given thermal energy demand. With Equation (15) dependent variables are defined. Calculation runs from Equations (9) and (12), and finishes with Equation (10).
Y 1 = B M ( MAF )         Y 2 = P e l         Y 3 = P t o t
Case (4), ( B M ( MAF ) ) —given biomass input. With Equation (16) dependent variables are defined. Calculation runs from Equations (10) and (12), and finishes with Equation (9).
Y 1 = P t h         Y 2 = P e l         Y 3 = P t o t
CHPC technology has achieved a relatively high degree of reliability in terms of mass and energy balance data over the last five years. Technology supplier assures at least 10% variability (±10%) for all technical performance inside the technical specification. In the same period, the evaluation of the plant capacities results in four available plant modules based on electrical energy production—Pel. A combination of two plant modules simultaneously ensures the final capacity and operational reliability in the contingency events or maintenance periods.
In Table 4, calculated results are presented as relevant TEA cases corresponding to CHPC plant modules already in production. The figures represent the increase in plant capacity numbers by 0.5 steps from minimum to maximum in a ratio of 1:2.5.
The smallest capacity of 200 kWel (electricity) P e l , Case (4) consume approx. 16 m3 of BM per day means at least three transports (with tracks contain 50 m3 of cargo) per week and storage place around 80 m3. Generated thermal energy assures heating for around 50 family houses or industrial halls of approx. 8500 m2. Amount of electricity is not enough to cover the consumption of a medium-sized (e.g., 200 employees) company with connected electric power on average between 600 to 900 kW. The ideal combination gives solar panels generates heat and electricity to ensure year-round self-sufficiency with high reliability and the probability of uninterrupted operation in a range of P ( A ) = 0.80   to   0.95 .
Important economic consideration is the CH produced in an amount of 1.9 m3 per day or 9% of BM feed. The valorisation of the produced CH on a local market is essential, or we need even to pay for its permanent removal. Relatively high calorific value around 25 MJ/kg direct application solutions toward its energy utilisation or valorisation as char material. Utilising CH as an energy source ( 89   kW @ 12.6   kg / h ) need additional investment in a boiler of a 100 kW size. Produced energy valorisation lie in a range of 21 EUR per day @10 EUR added value for 1 MW of thermal energy. On the other side, a valorisation of CH as carbonaceous material for soil amendment (BIOCHAR) or briquettes promise larger numbers in a range of 60 EUR per day based on the market value of 200 EUR per kg for CH.
Larger plant modules up to 500 kWel with 100 kWel per step, gives options to assemble large plant or battery of them. The largest plant Case (1) provides 500 kWel of electricity and 770 kWth of heat presented in Table 4. At this size of plant special attention should be paid on logistics for input BM. Daily consumption of BM—37.3 m3/day needs one large transport of 50 m3 BM per day, five days per week and two transports every 14 days. Storage place of 200 m3 satisfy this logistic plan but assure only 3.4 days of safety stock at continuous operation. A very similar situation come up with CH; by producing 4.7 m3 per day and 219 kW @30.8 kg/h material presents a logistic problem. At this plant size solutions for CH product should be solved in advance. Considering CH energy value of 12.5% of plant total power ( P t o t = 1.754   MW ) numbers seem high, but market value is in a range of 52 EUR per day @10 EUR added value for 1 MWth energy. Investment in the boiler of 250 kW size to valorise CH energy can be a relatively high; a reliable calculation of ROI is necessary before the decision.
As the CHPC technology has matured over several years, the reliability of the mass and heat balance data provides robust and accurate TEA input data. Symmetrical variations (±10%) announce no unpredictable backgrounds or conservative estimations of some results occurrence—this way high probability (typically P ( A ) > 0.85 ) of results occurs. The technical side of energetical projects based on CHPC technology—TEA data, reached a very high level of reliability and most of the uncertainties shift to the economic side or main elements of a Business Model (BuM).
The economic evaluation of investment projects consists of several parts, of which BuM is the broadest and general concept how management intent to realise the entire business or entrepreneurial venture. TEA should provide reliable mass and energy balance with all technical background, including the distribution of products and possibilities of their use. On the other hand, the elaboration of CAPEX and OPEX presents concise figures of investment and operating costs, based on TEA enhanced with some economical decisions. In the course of investment preparation, some other documents such as Basic Engineering, Investment Program and others appear but not discussed here.

4. Conclusions

Innovative process model calculations, of CHPC technology, converge with real process parameters data at the input providing reliable heat-mass balance and composition data of all process streams. General results variability is within ±10% and ±5% for the main outputs. Use of vast published thermodynamic and kinetic data on gasification/reforming for various limitations and ratios allows comparison, ensures consistency and reliability of the calculated results. A clear picture of the process streams for the TEA input supports the views and needs of the investors/entrepreneurs seeking a successful business model for investments in reliable BM utilisation technology.

Author Contributions

Conceptualisation, D.K.; methodology, D.K.; software, D.K.; validation, D.K., K.R. and N.B.Š.; formal analysis, D.K., K.R. and N.B.Š.; investigation, D.K., K.R. and N.B.Š.; resources, D.K., K.R. and N.B.Š.; data curation, D.K., K.R., N.B.Š. and M.H.; writing—original draft preparation, D.K., K.R. and N.B.Š.; writing—review and editing, D.K., K.R., N.B.Š. and M.H.; visualisation, D.K.; supervision, D.K.; project administration, D.K.; funding acquisition, K.R. All authors have read and agreed to the published version of the manuscript.

Funding

This research was funded by Slovenian Research Agency—ARRS under research program P2-0346.

Data Availability Statement

Not applied.

Acknowledgments

Many thanks to Janvit Golob for his persistent support as a research program leader on Chemical Engineering thinking.

Conflicts of Interest

Authors declare that they are not aware of any competing financial interests or personal relationships that may have influenced the work reported in this paper. Marcel Huber as a one of CHPC technology owner cooperates as a Chemical Engineer providing exact data from plant operation.

Nomenclature

ACAsh content in solid residue (%)
ARAs Received definition of samples
BuMBusiness Model
CAPEXCapital Expenditures
CfixFixed (pure) carbon in the solid residue (%)
CHChar
CHOHydrocarbons with CHO content
CHPCCogeneration of Heat Power and Char
CpSpecific heat at constant pressure for Biomass
HEnthalpy of assigned stream (MJ kg−1)
EREquivalence Ratio; actual air-fuel ratio to the stoichiometric air-fuel ratio for combustion
GSGas storage reservoir
HEHeat Exchanger
HEfgHeat exchanger for flue gases cooling
HEgeHeat exchanger for electric generator cooling
HEmcHeat exchanger for motor block (cylinders) cooling
HEocHeat exchanger for engine oil cooling
HEsHeat exchanger for syngas cooling after char separation
HEdHeat exchanger for heating drying air
ICEInternal Combustion Engine
LHVLower Heating Value of assigned stream(MJ kg−1)
Mass flow (kg h−1)
mMass of stream (kg)
MAFMoisture and Ash Free definition of samples
MFMoisture Free
OPEXOperational Expenses
PPower (kW)
P(A)Probability function
PAHPolyaromatic hydrocarbons
PERMPermanent gases
PGPyrolysis Gases
QEnergy (heat) (J)
SCScrubber for water
TEATechno Economic Assessment
W1Hot (90 °C) Water stream
W2Low temperature (90 °C) Water stream
W3Waste-water stream
W4Char cooling and moisturising water
WCWater content of the material based on wet (AR-as received) material (%)
XWater vapor concentration in gas (g/g)
θCelsius Temperature of the assigned stream or process inside the whole process (°C)
ηEfficiency (%)

Subscripts

airSPAir Specific Parameter
BMBiomass (wood chips)
BM+vhBiomass and vapor heating
BMweBiomass water evaporating
CHChar material (Cfix > 50%)
CHarhEnergy to heat char
CHdryChar dry
CHsepChar separation process
CHwetChar wet
dADrying Air
DdemGasification demand
drDrying
elElectric
fgFlue gasses
GGasification
gGas phase
GairHeating of air needed for gasification
GburnBurning in gasification process
ginGas at input
GlosEnergy Losses in Gasification process
goutGas at output
GprocGasification process
inInput, assignment of characteristics at input
outParameter of the output stream
pPyrolysis
PairHeating of air need for running pyrolysis
PburnBurning in Pyrolysis process
PdemPyrolysis demand
PGheatEnergy needed to heat Pyrolysis Gases
PlossEnergy Losses in pyrolysis process
PprocPyrolysis process
procProcess
pyPyrolysis
refReforming
sygSyngas
thThermal
totTotal
VVolume (m3)
wWater
weWater evaporation
whWater heating
WVWater vapor
wvWater vapors
wvapWater evaporation

References

  1. Bórawski, P.; Bełdycka-Bórawska, A.; Szymańska, E.; Jankowski, K.J.; Dubis, B.; Dunn, J.W. Development of renewable energy sources market and biofuels in The European Union. J. Clean. Prod. 2019, 228, 467–484. [Google Scholar] [CrossRef]
  2. Sherwood, J. The significance of biomass in a circular economy. Bioresour. Technol. 2020, 300, 122755. [Google Scholar] [CrossRef] [PubMed]
  3. Böcker-Riese, B.; Bräkow, D. Status quo from Biomass gasification CHP-plant systems in Germany. In Proceedings of the Task33 Workshop. Small Scale Gasification for CHP, Innsbruck, Austria, 2–4 May 2017; FEE—Society for the Promotion of Renewable Energies: Berlin, Germany, 2017. [Google Scholar]
  4. Dahmen, N.; Sauer, J. Evaluation of Techno-Economic Studies on the bioliq® Process for Synthetic Fuels Production from Biomass. Processes 2021, 9, 684. [Google Scholar] [CrossRef]
  5. Klinar, D. Universal model of slow pyrolysis technology producing biochar and heat from standard biomass needed for the techno-economic assessment. Bioresour. Technol. 2016, 206, 112–120. [Google Scholar] [CrossRef] [PubMed]
  6. EBC. European Biochar Certificate—Guidelines for a Sustainable Production of Biochar; European Biochar Foundation (EBC): Arbaz, Switzerland, 2012; Version 8.3E of 1st September 2019; Available online: http://www.europeanbiochar.org/en/download (accessed on 14 December 2020). [CrossRef]
  7. Ciuta, S.; Tsiamis, D.; Castaldi, M.J. Gasification of Waste Materials: Technologies for Generating Energy, Gas, and Chemicals from Municipal Solid Waste, Biomass, Nonrecycled Plastics, Sludges, and Wet Solid Wastes; Elsevier: Amsterdam, The Netherlands, 2017; ISBN 9780128127162. [Google Scholar]
  8. Patuzzi, F.; Prando, D.; Vakalis, S.; Rizzo, A.M.; Chiaramonti, D.; Tirler, W.; Mimmo, T.; Gasparella, A.; Baratieri, M. Small-scale biomass gasification CHP systems: Comparative performance assessment and monitoring experiences in South Tyrol (Italy). Energy 2016, 112, 285–293. [Google Scholar] [CrossRef]
  9. McKendry, P. Energy production from biomass (part 1): Overview of biomass. Bioresour. Technol. 2002, 83, 37–46. [Google Scholar] [CrossRef]
  10. McKendry, P. Energy production from biomass (part 3): Gasification technologies. Bioresour. Technol. 2002, 83, 55–63. [Google Scholar] [CrossRef]
  11. Vakalis, S.; Patuzzi, F.; Baratieri, M. Thermodynamic modeling of small scale biomass gasifiers: Development and assessment of the ‘‘Multi-Box’’ approach. Bioresour. Technol. 2016, 206, 173–179. [Google Scholar] [CrossRef] [PubMed]
  12. Hofbauer, H.; Rauch, R.; Bosch, K.; Koch, R.; Aichernig, C. Biomass CHP Plant Güssing—A Success Story. In Proceedings of the Expert Meeting on Pyrolysis and Gasification of Biomass and Waste, Strasbourg, France, 30 September–1 October 2002; Bridgewater, A.V., Ed.; CPL Press: Newbury, UK, 2003; pp. 527–536. [Google Scholar]
  13. Huber, M.; Huemer, M.; Hofmann, A.; Dumfort, S. Floating-fixed-bed-gasification: From Vision to Reality. Energy Procedia 2016, 93, 120–124. [Google Scholar] [CrossRef] [Green Version]
  14. Damartzis, T.; Zabaniotou, A. Thermochemical conversion of biomass to second generation biofuels through integrated process design—A review. Renew. Sustain. Energy Rev. 2011, 15, 366–378. [Google Scholar] [CrossRef]
  15. Hansen, V.; Müller-Stöver, D.; Ahrenfeldt, J.; Holm, J.K.; Henriksen, U.B.; Hauggaard-Nielsen, H. Gasification biochar as a valuable by-product for carbon sequestration and soil amendment. Biomass Bioenergy 2015, 72, 300–308. [Google Scholar] [CrossRef] [Green Version]
  16. Huber, M. Technical Specification CraftWERK CW1800-500; SynCraft Engineering GmbH: Schwaz, Austria, 2017. [Google Scholar]
  17. Crombie, K.; Mašek, O. Investigating the potential for a self-sustaining slow pyrolysis system under varying operating conditions. Bioresour. Technol. 2014, 162, 148–156. [Google Scholar] [CrossRef] [Green Version]
  18. Higman, C.; van der Burgt, M. Gasification, 2nd ed.; Gulf Professional Publishing: Burlington, MA, USA, 2008; ISBN 9780750685283. [Google Scholar]
  19. Yu, J.; Smith, J.D. Validation and application of a kinetic model for biomass gasification simulation and optimization in updraft gasifiers. Chem. Eng. Process. Process. Intensif. 2018, 125, 214–226. [Google Scholar] [CrossRef]
  20. Narobe, M.; Golob, J.; Klinar, D.; Francetič, V.; Likozar, B. Co-gasification of biomass and plastics: Pyrolysis kinetics studies, experiments on 100 kW dual fluidized bed pilot plant and development of thermodynamic equilibrium model and balances. Bioresour. Technol. 2014, 162, 21–29. [Google Scholar] [CrossRef] [PubMed]
  21. Benedetti, V.; Patuzzi, F.; Baratieri, M. Characterization of char from biomass gasification and its similarities with activated carbon in adsorption applications. Appl. Energy 2018, 227, 92–99. [Google Scholar] [CrossRef]
  22. Dumfort, S.; Huemer, M.; Hofmann, A.; Dumfort, S.; Huemer, M.; Hofmann, A.; Huber, M.B.; Krueger, J. Tar Decomposition at low Temperatures within staged Gasification Reactors-first Approach towards Mechanisms and Background. Artic. J. Eng. Technol. 2015, 3, 45–49. [Google Scholar]
Figure 1. Process arrangement of CHPC technology, cogeneration of heat, power and char.
Processes 09 01442 g001
Figure 2. Block diagram of the CHPC process—part I pyrolysis; mass balance, process parameters and streams in detail; unit mass case—1 kg of air dry BM input.
Processes 09 01442 g002
Figure 3. Block diagram of the CHPC process—part II gasification; mass balance, process parameters and streams in detail; unit mass case −1 kg of air-dry BM input.
Processes 09 01442 g003
Table 1. Overview of the material and process parameters for the model.
Parameter DescriptionNotationUnitsValue
Biomass water contentWC%6
Biomass ash contentAC%0.8
Biomass lower heating valueLHVBMMJ kg−118
Process input temperatureθin°C20
Process heat up temperature differenceTpyK480
Pyrolysis temperatureθpy°C500
BM specific heat in temp. range up to θpyCpBMkJ kg−1 K−12.16
Char specific heat in temp. range up to θpyCpCHkJ kg−1 K−11.67
Enthalpy of water vaporisationHwvapMJ kg−12.260
Enthalpy to heat water vapor to θpyHwvMJ kg−10.9696
Char heating valueLHVCHMJ kg−129
Corrected—MAF BM lower heating value MJ kg−116.2
Table 2. Heat balance of unit mass input model calculation and mass outputs—accurate data.
Mass Unit Results Pyrolysis Gasification
ParameterQin BM inputmWin
BM water input
qBM+whqBMweqPairqPlosener.
QPdem
qPGheatqCHarhqGairqGlosener.
QGdem
qCH
energy of char (CH) output
qdry
energy to dry input BM
qwcfg
energy of water cond. from flue gas
mCH
char mass (CH) output
msyg
syngasmass output
Units: MJ per kg input *)18.00.0638 (kg)1.02700.14430.27020.39601.8371.32120.12420.79310.18002.4192.52011.0061.23120.090 (kg)2.4698 (kg)
%1006.05.710.801.502.2010.217.340.694.411.0013.4414.006.116.849.0 w%
givengivencalc.calc.calc.sel.calc.calc.calc.calc.sel.calc.calc.calc.calc.calc.calc.
Data are based on dry BM (MF) input, but with ash < 1% neglected, actually (MAF) input. *) based on (MAF) input.
Table 3. Heat balance of unit mass input model calculation and energy outputs with efficiency—accurate data.
Mass Unit Results
ParameterQin BM inputqdryingqcond-fgqHEpqHEsqsc PinPthPelPth lowTenergy
efficiency
el. + highT
energy
efficiency
el.+ highT
+ lowT
energy
losses
total
waste- water W3
Vw3
Units: MJ per kg input *)18.01.10061.23121.0381.10150.558Units: kW perkg input *)5.002.19441.4250.7125ηe+hηtot1 − ηtot10 L/day
%1006.116.845.86.123.10η (fa)10043.928.5014.372.486.613.4-
givencalc.calc.calc.sel.calc. givencalc.calc.calc.calc.calc.calc.-
*) based on (MAF) input. Data are based on dry BM (MF) input, but with ash < 1% neglected.
Table 4. Summary of the results of mass and heat balance of four plant capacity definition.
Cases:
ParameterUnits(1)(2)(3)(4)Px/Pinx/BMEquation No.:
Ptot = PinkW175413681067721100%/8/10
PelkW50040030020028.5%/12
PthkW77061548832643.9%/9
BM(MAF)kg/h342267208140/110
BM(MAF)t/day8.216.415.003.40///
VBM(MAF) *m3/day37.3029.1022.7015.30///
Pth lowTkW25019515210314.25%//
CHdrykg/h30.824.318.712.612.5%9.0%/
CHdrykg/day739577449302//
CHwetkg/h43.133.626.217.6/12.6%
(40% water)
VCHwet**m3/h0.1960.1530.120.08///
VCHwet**m3/day4.73.72.91.9///
Vwaste waterm3/day3.422.672.081.4///
bold = given: Data acc. to modules produced, numbers inside variation range of ±10%. * based on BM bulk density: 220 kg/m3; ** based on wet CH bulk density: 220 kg/m3.
Publisher’s Note: MDPI stays neutral with regard to jurisdictional claims in published maps and institutional affiliations.

