Article

Optimization of Friction Welding Parameters to Maximize the Tensile Strength of Magnesium Alloy with Aluminum Alloy Dissimilar Joints Using Genetic Algorithm

by
Radosław Winiczenko
1,*,
Andrzej Skibicki
2 and
Paweł Skoczylas
3
1
Institute of Mechanical Engineering, Warsaw University of Life Sciences, Nowoursynowska 166, 02-787 Warsaw, Poland
2
Faculty of Mechanical Engineering, Bydgoszcz University of Science and Technology, Kaliskiego 7, 85-789 Bydgoszcz, Poland
3
Institute of Mechanics and Printing, Warsaw University of Technology, Narbutta 85, 02-524 Warsaw, Poland
*
Author to whom correspondence should be addressed.
Processes 2021, 9(9), 1550; https://doi.org/10.3390/pr9091550
Submission received: 15 July 2021 / Revised: 21 August 2021 / Accepted: 28 August 2021 / Published: 30 August 2021
(This article belongs to the Section Manufacturing Processes and Systems)

Abstract

:
The friction rotary welding (FRW) of magnesium alloy to aluminum alloy was presented in a paper due to significant interest in the manufacturing industry. A genetic algorithm (GA) method for optimizing FRW process parameters of dissimilar light alloys was presented. After obtaining the welding parameters by GA method, it was possible to determine the best tensile strength of the friction joint. The obtained joints were subjected to tensile strength. The highest tensile strength TS = 178 MPa was found using a genetic algorithm for the following friction welding parameters: friction force FF = 16 kN, friction time FT = 4 s, and upsetting force UF = 44 kN. The optimized values were compared with the experimental results. The application of the genetic algorithm method allowed increasing the tensile strength joint from 88 to 180 MPa. The maximum tensile strength of the friction welded magnesium alloy-aluminum alloy joints was 73% of the base AZ31B metal. The relationship between welding parameters and strenght of welds was also demonstrated in this study.

1. Introduction

Magnesium alloys are ideal for reducing vehicle weight, as they have a lower mass density than aluminum [1]. Hong and Shin [2] draw attention to the need to develop welding technology to apply magnesium alloys in mass production. Due to the wide use of magnesium alloys in various industries, such as aviation or automotive, there is a need for welding them with other metals like aluminum, copper, or steel [3].
Friction welding is a solid-state welding process used to weld heat-resisting materials for similar structural and dissimilar components [4,5]. Friction welding of Mg alloy to Al alloy has important application in the manufacturing industry, so the welding of these alloys was studied in the last papers. It is important to realize the joining of solid magnesium and aluminum bars by friction method [6]. In this welding method, the formation of IMCs can be controlled effectively with lower heat input and less welding time, as suggested authors [7]. Additionally, the welding parameters such as friction and upsetting pressure, rotational speed, and welding time play a significant role in determining the joint strength [6]. Kato and Toksiue [7] have received tensile strength of 90 MPa during welding magnesium alloy. According to the authors [8], with increasing axial pressure, the thickness of the intermetallic layer and microcracks decreased. The tensile strength was comparable to the parent material received in friction welding pure magnesium to pure aluminum with post-heat-treatment [9]. The maximum tensile strength of 138 MPa received during continuous drive friction welding of 5A33 alloy to AZ31B magnesium alloy in a paper [10]. Moreover, the mechanical study of inertia friction welding of AA7A04 to AZ31B Mg alloy was conducted [11]. The maximum tensile strength of 96 MPa was achieved under the friction pressure of 124 MPa.
From the literature review [1,2,3,4,5,6,7,8,9,10,11], it is noticed that to estimate a good strength weld, it is vital to predic the best process parameters combination using an appropriate optimization method. In the previous works, selecting parameters for welding usually was carried out by trial and error. The traditional optimization techniques do not work effectively when the search space is large. In such cases, non-traditional optimizing techniques are preferred. Such optimization methods include genetic algorithms.
In many works, genetic algorithms (GAs) were used for the precise selection of welding parameters. A design of experiments (DOE) model in friction welding of austenitic stainless steel to low alloy steel was established by Murti et al. [12]. Paventhan et al. [13] successfully predicted the tensile strength of aluminum alloy and stainless steel joints. Sathiya [14] has conducted the optimization of welding parameters using neural networks and GAs. Kumaran et al. [15] optimized a pure aluminum tube plate using an external tool by GA and Taguchi method. Canyurt estimated welded joint strength and fatigue strength using the GA approach in the papers [16,17]. Meran [18] developed the GA model to improve the tensile strength of the welded joint for brass material. Padmanaban et al. [19] predicted the mechanical properties of the magnesium AZ31B welds. Additionally, the above authors determined the optimal parameters of the FSW process. Winiczenko et al. [20] optimized welding parameters of ductile cast iron joints using a support vector machine (SVM), imperialist competitive algorithm (ICA), and GA. The same author successfully developed a hybrid response surface methodology and GA techniques to modeling, simulate, and optimize welding parameters for ductile iron/low carbon steel joints [21]. Combined RSM and Modified Differential Evolution for parameter optimization of FSW of aluminum alloy were proposed in paper [22].
From the literature, it is found that GA optimization technique was not used to optimize the process parameter settings for dissimilar Al/Mg friction welded joints. Therefore, the aim of this study is to find the optimal process parameters that maximize the ultimate tensile strength of dissimilar AZ31B/AA7075 friction welded joints. It may be possible to improve joint efficiency by using a genetic algorithm. Moreover, the empirical relationships concerning welding parameters and tensile strength were determined.

2. Materials and Methods
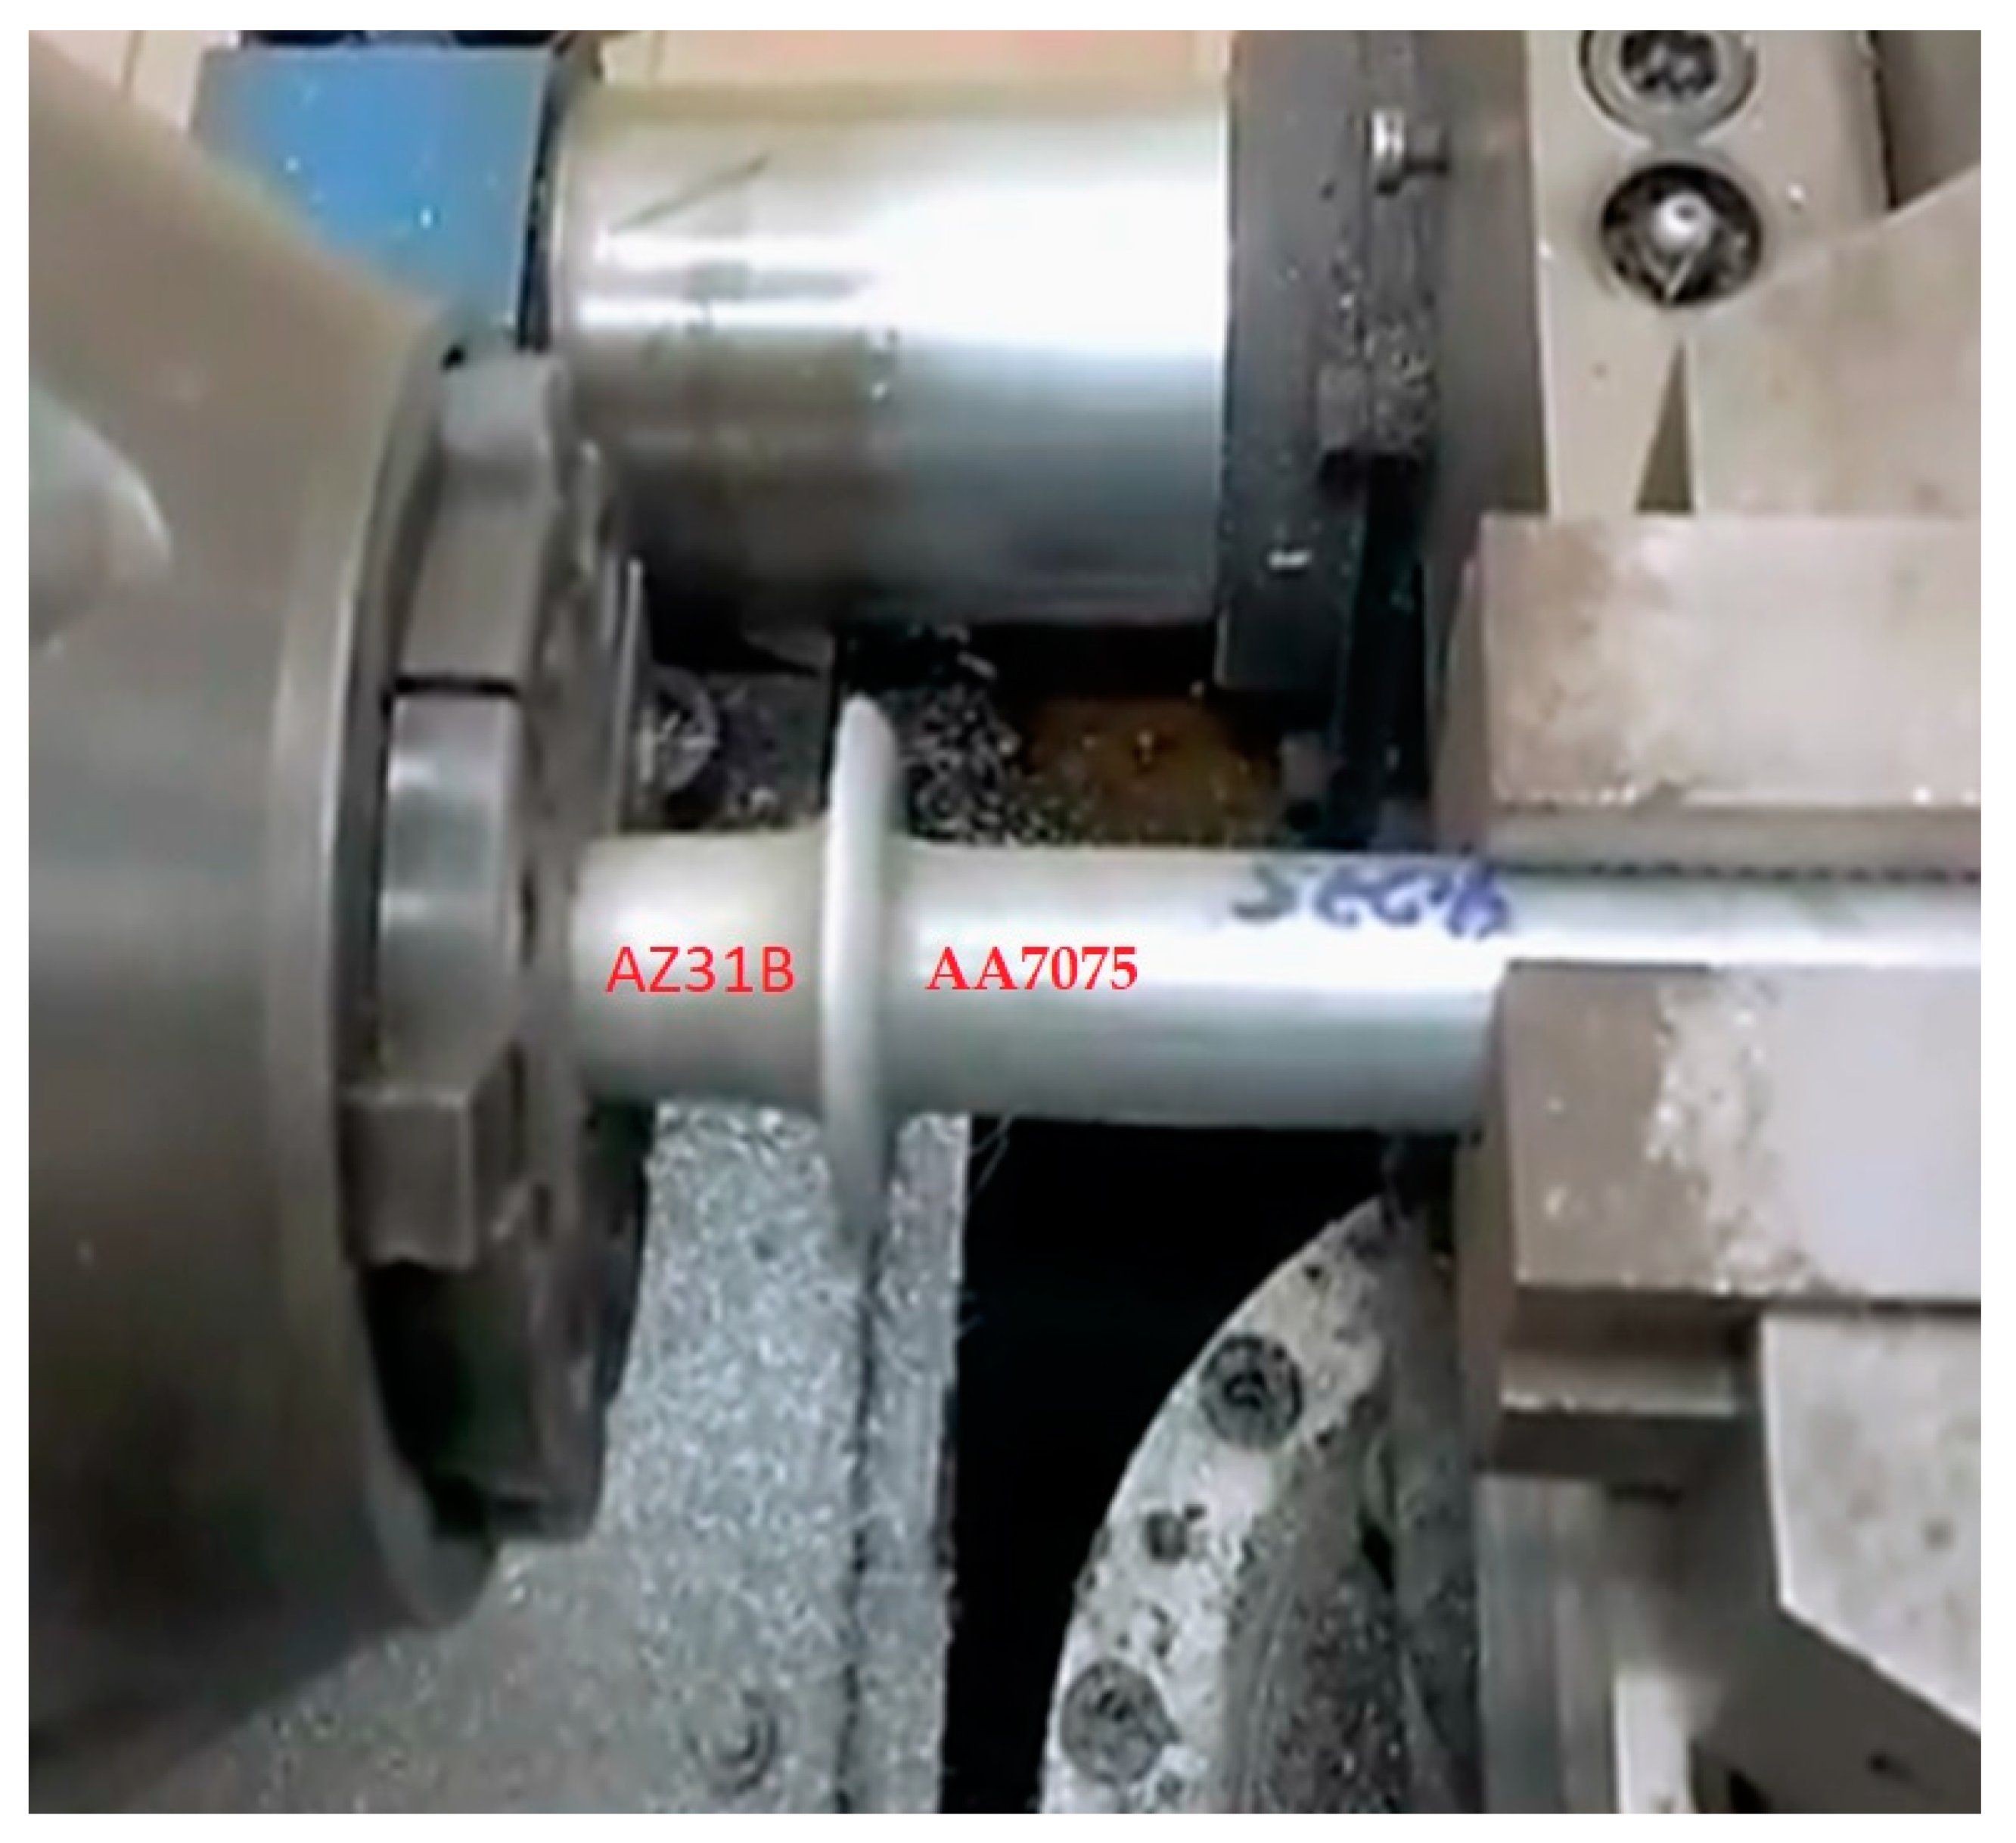
2.1. Materials

The magnesium and aluminum rods prepared on the abrasive cut-off machine were 100 mm in length and 20 mm in diameter. The mechanical properties and alloying elements of materials are shown in Table 1. Before welding, the surfaces were polished by grit silicon carbide papers to remove the effect of oxide films and surface roughness and then cleaned in acetone to remove dirt and grease, as suggested [10,11].

2.2. Welding Parameters

Figure 1 shows a continuous drive friction machine (ZT4-13 type, ASPA, Wrocław, Poland) with the samples. During the welding process, the magnesium alloy bar is rotated with the spindle, and the aluminum bar is moved axially under the axial pressure. When the appropriate rotational speed is reached, the specimens are brought together under axial force. Abrasion at the weld interface heats specimens locally and upsetting starts. Finally, the rotation of the workpiece stops, and upset pressure is applied to consolidate the joint (see Figure 1).
The choice of welding parameters was based on the previous reports [9,10,11]. The upsetting time (UT) was 6 s for all samples. The ranges of parameters were established by the capabilities of the welding machine. For this welder, the rotational speed (RS) of 1450 rpm was constant. Also, the maximum axial force was limited to 50 kN. Table 2 shows the welding parameters used in the experiment.

2.3. Tensile Test

A tensile test was carried out on a 100-kN servo-controlled universal testing machine (Instron 1115 type) at a constant displacement rate of 1 mm/min at room temperature (see Figure 2) according to the ASTM:E8/E8M-13a standard specimen configuration [5]. For each group of welding parameters, three samples were made. The mean results from the tensile tests are presented in Table 2.

3. Modeling and Optimization

3.1. Mathematical Models

Two mathematical models were considered to represent the ultimate welding strength (UTS) of the AZ31B/AA7075 joints. The quadratic and cubic models were written in terms of design parameters of the friction force, friction time, and the upsetting force shown as
UTS qudratic = β 1 + β 2 · X 1 + β 3 · X 2 + β 4 · X 3 + β 5 · X 1 · X 2 + β 6 · X 1 · X 3 + β 7 · X 2 · X 3 + β 8 · X 1 2 + β 9 · X 2 2 + β 10 · X 3 2 + β 11 · X 1 · X 2 · X 3
UTS cubic = β 1 + β 2 · X 1 + β 3 · X 2 + β 4 · X 1 · X 2 + β 5 · X 1 X 3 + β 6 X 2 X 3 + β 7 X 1 2 + β 8 X 2 2 + β 9 X 3 2 + β 10 · X 1 3 + β 11 · X 2 3 + β 12 · X 3 3
where X1, X2, and X3 are the friction force (FF), friction time (FT), and upsetting force (UF), respectively, and β i are the weights for decision variables.
The quadratic model describing the dependence of the welding parameters on the joint strength, developed by genetic algorithm procedure, are given below
UTS qudratic = 0.462 + 0.787 · FF + 10.737 · FT + 1.45 · UF + 0.1 · FF · FT 0.45 · FF · UF + 0.785 · FT · UF + 0.149 · FF 2 + 0.108 · FT 2 + 0.225 · UF 2 + 0.012 · FF · FT · UF

3.2. Fitness Function
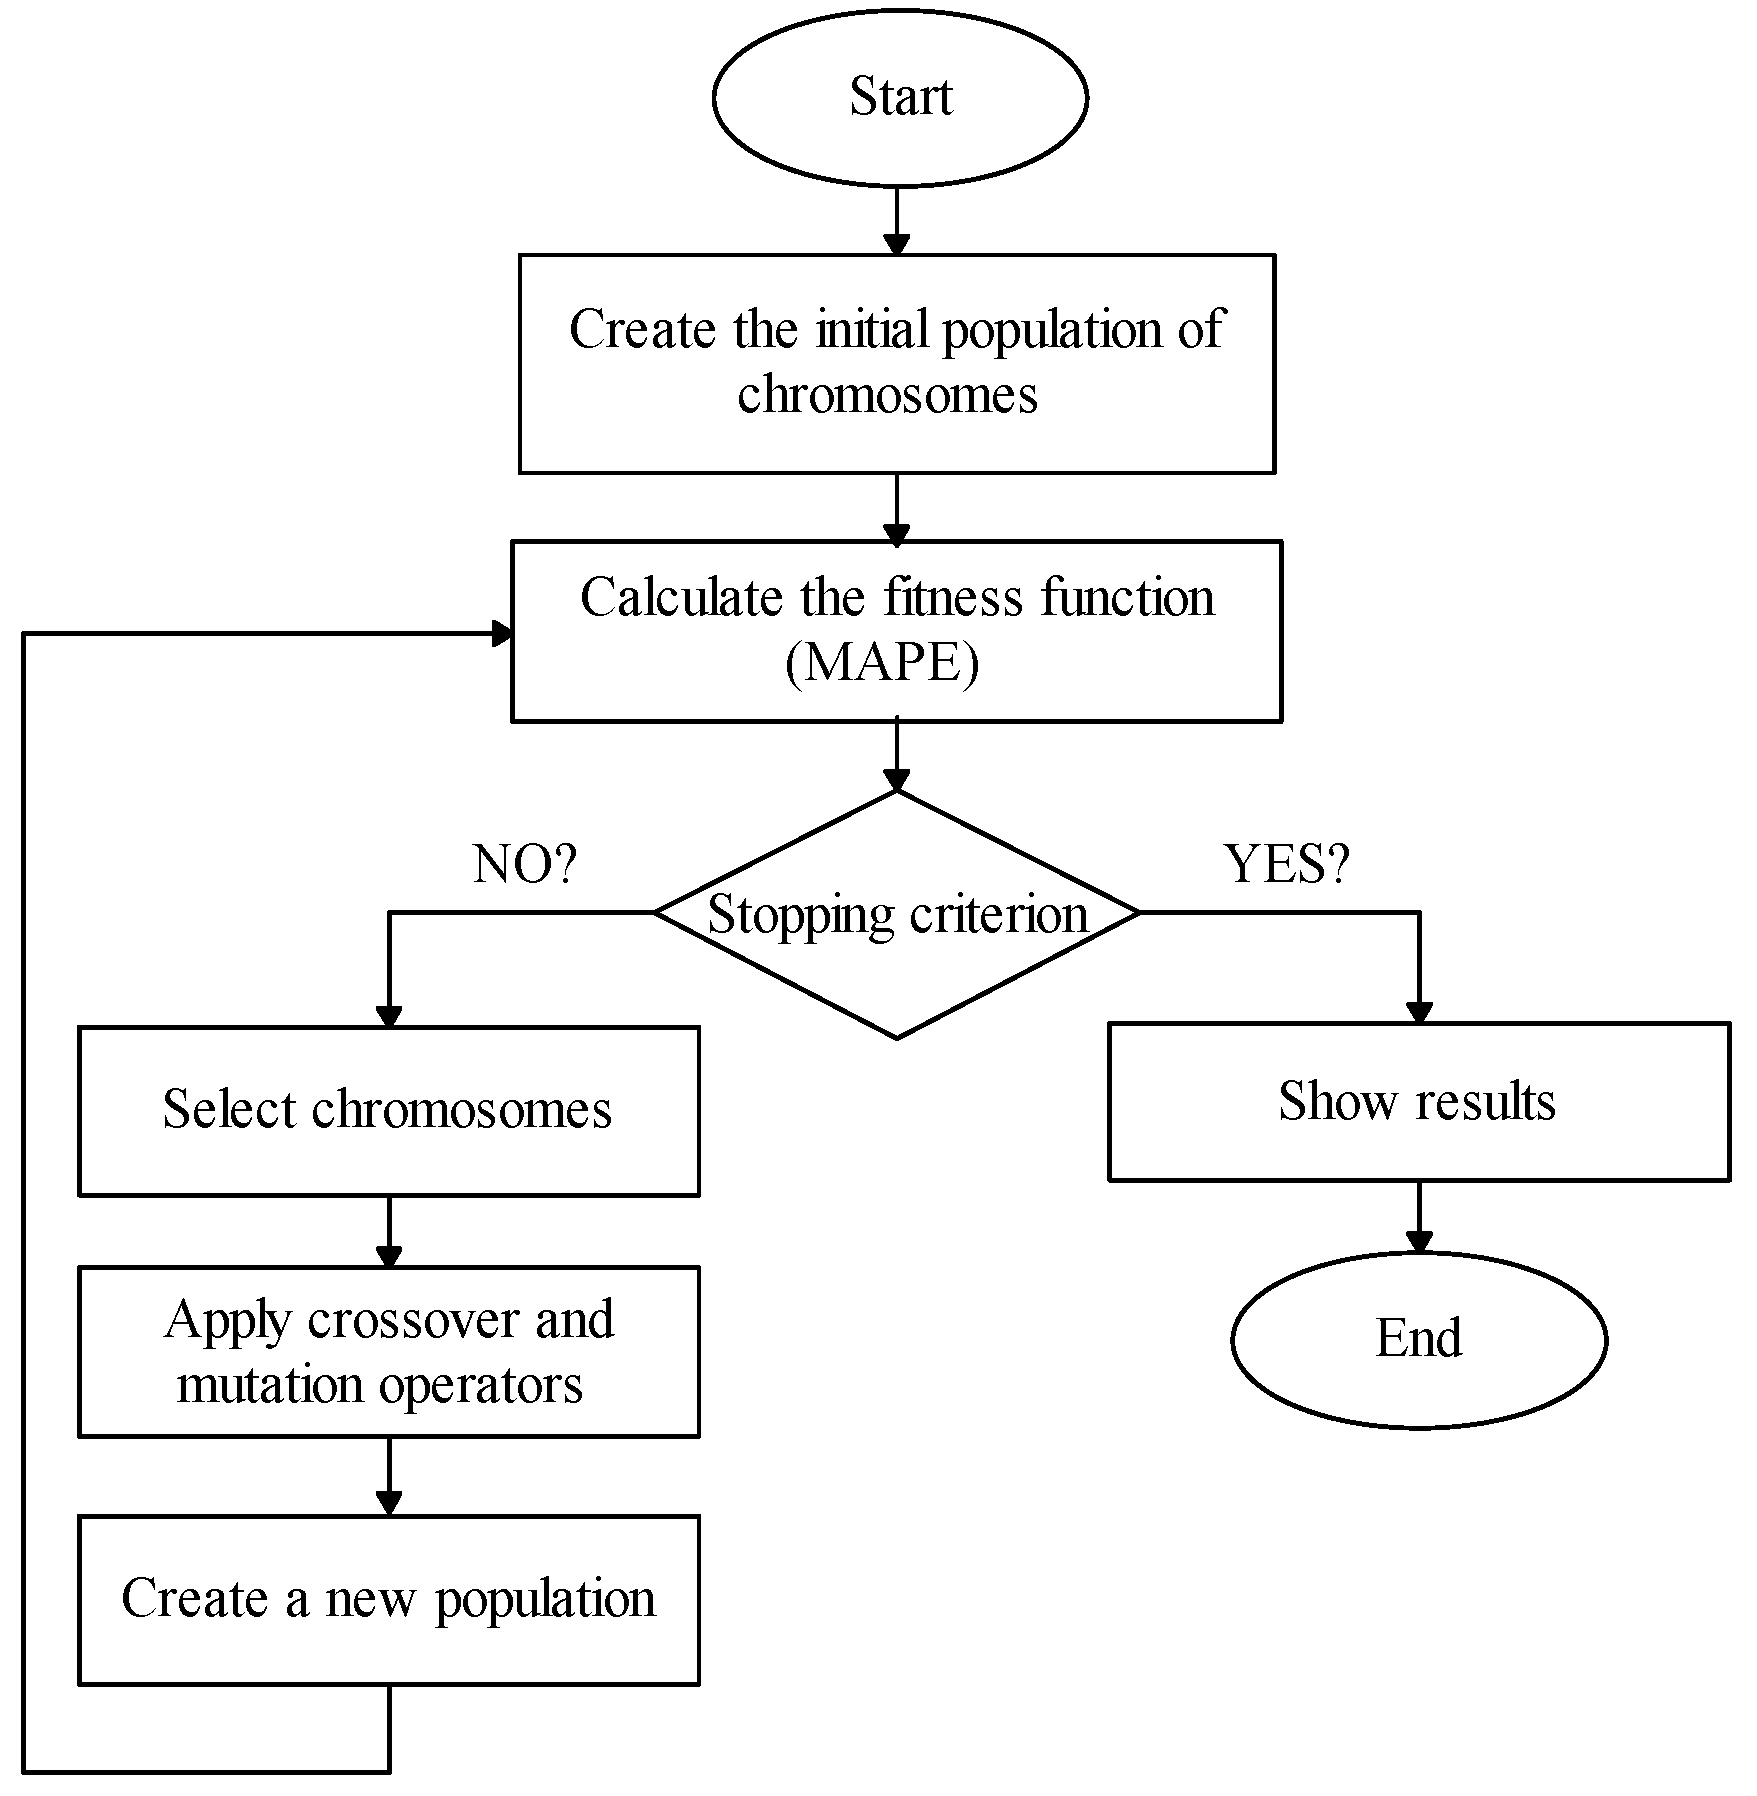
The goal function is the minimum mean absolute percentage error (MAPE), and it is shown below, where σ j   exp and σ j   pred represent the experimental and predicted strength of the j-th joint, and m is the number of observations. After each algorithm generation, the individuals with the best fitness function proceed to the next generation.
The objective function f(x) has the form:
f ( x ) min = 1 m j   = 1 m ( | σ j   exp σ j   pred | σ j   exp )
The welding parameters such as FF, FT, and UF were used as input in the model. Table 3 presents the ranges of process parameters for which the best UTS can be predicted. The model is a best-fitted structure with these measured in the tests.

3.3. Optimization

A genetic algorithm was chosen to found the best process parameters because it is a powerful optimization tool. GA performs exceptionally well in nonlinear regions. In the welding process, complex and highly nonlinear phenomena take place [23]. Therefore, it was easy to estimate relationships between the input and the output of this complex system using the GA method. The main characteristic of GA over the other optimization techniques is that they operate simultaneously with a huge set of searching points to find optimal architecture instead of a single point [24].
The main steps of the genetic algorithm are shown in Figure 3. The main GA operators, such as type of selection, crossover, and mutation were used in the algorithm. The size of the initial population identifies how many chromosomes there are in each generation. With a large population size, the genetic algorithm searches the solution space more thoroughly, thereby reducing the chance of returning a local minimum that is not a global minimum. Moreover, too large a population extends the duration of the simulation, as reported [25].
Selection is the choice of parents for the next generation. The selection is made using the objective function. Four selection types such as uniform, roulette, remainder, and tournament, were included in this study.
Uniform selection chooses parents using the expectations and number of parents. Un is useful for debugging and testing but is not a very effective search strategy.
Roulette election chooses parents by simulating a roulette wheel, in which the area of the section of the wheel corresponding to an individual is proportional to the individual’s expectation. The algorithm uses a random number to select one of the sections with a probability equal to its area.
Remainder selection assigns parents deterministically from the integer part of each individual’s scaled value and then uses roulette selection on the remaining fractional part.
Tournament selection chooses each parent by choosing ‘Tournament size’ players at random and then selecting the best individual out of that set to be a parent. ‘Tournament size’ must be at least 2 [25,26].
Crossover is the genetic operator that creates new individuals from the parents. These individuals pass to the next generation. Five types of crossover operators like scattered, single point, two-point, intermediate, and heuristic, were defined.
Scattered crossover creates a random binary vector and selects the genes where the vector is a 1 from the z1, and the genes where the vector is a 0 from the z2. Sc combines the genes to form the child. For example, if z1 and z2 are the parents
z1 = [a b c d e f g h]
z2 = [1 2 3 4 5 6 7 8]
and the binary vector is [0 0 0 0 1 1 0 0],
the function returns the following child (ch1)
ch1 = [1 2 3 4 e f 7 8]
Single-point chooses a random integer n between 1 and the number of variables. It then selects vector entries numbered less than or equal to n from the z3, selects vector entries numbered greater than n from the z4. Concatenates these entries to form a child vector (ch2). For example, if z3 and z4 are the parents
z3 = [a b c d e f g h]
z4 = [1 2 3 4 5 6 7 8]
and the crossover point is 5; the function returns the following child (ch2).
ch2 = [a b c d e 6 7 8]
Two-point selects two random integers m and n between 1 and the number of variables. The function selects vector entries numbered less than or equal to m from the z5, vector entries numbered from m + 1 to n, inclusive, from the z6, vector entries numbered greater than n from the z5. The algorithm then concatenates these genes to form a single gene. For example, if z5 and z6 are the parents
z5 = [a b c d e f g h]
z6 = [1 2 3 4 5 6 7 8]
and the crossover points are 2 and 5; the function returns the following child (ch3).
ch3 = [a b 3 4 5 f g h]
Intermediate creates children by taking a weighted average of the parents (z7 and z8). You can specify the weights by a single parameter, R, a scalar or a row vector of length number of variables. The default is a vector of all 1’s. The function creates the child (ch4) from z7 and z8 using the following formula.
ch4 = z7 + rand∙R∙(z8 − z7)
Heuristic returns a child that lies on the line containing the two parents, a small distance away from the parent with the better fitness value in the direction away from the parent with the worse fitness value. The default value of R is 1.2. If z9 and z10 are the parents, and z9 has the better objective value, the function returns the child (ch5)
ch5 = z10 + R∙(z9 − z10)
The mutation operator makes small random changes in the individuals in the population, which provide genetic diversity and enable the GA to search a broader space. Specify the function that performs the mutation function field. Three types of mutation, like a uniform, Gaussian, and adaptive feasible, were described in GA.
Uniform mutation is a two-step process. First, the algorithm selects a fraction of the vector entries of an individual for mutation, where each entry has a probability ‘rate’ of being mutated. The default value of ‘rate’ is 0.01. In the second step, the algorithm replaces each selected entry with a random number chosen uniformly from the range for that entry.
Gaussian mutation adds a random number taken from a Gaussian distribution with a mean 0 to each entry of the parent vector.
Adaptive Feasible mutation randomly generates adaptive directions concerning the last successful or unsuccessful iteration. The mutation chooses a path and step length that satisfies bounds and linear constraints.
The model parameters in Equations (1) and (2) have been optimized using GA that minimizes MAPE (Equation (4)). The genetic algorithm settings for process optimization are shown in Table 4.
The numerical simulation was done on a computer Intel Core i5-10310U CPU processor 2.21 GHz speed, with the 16 GB memory. Coding with the use of a genetic algorithm was performed in the Matlab environment, version 7.0 (R2008a) [26].

4. Results and Discussion

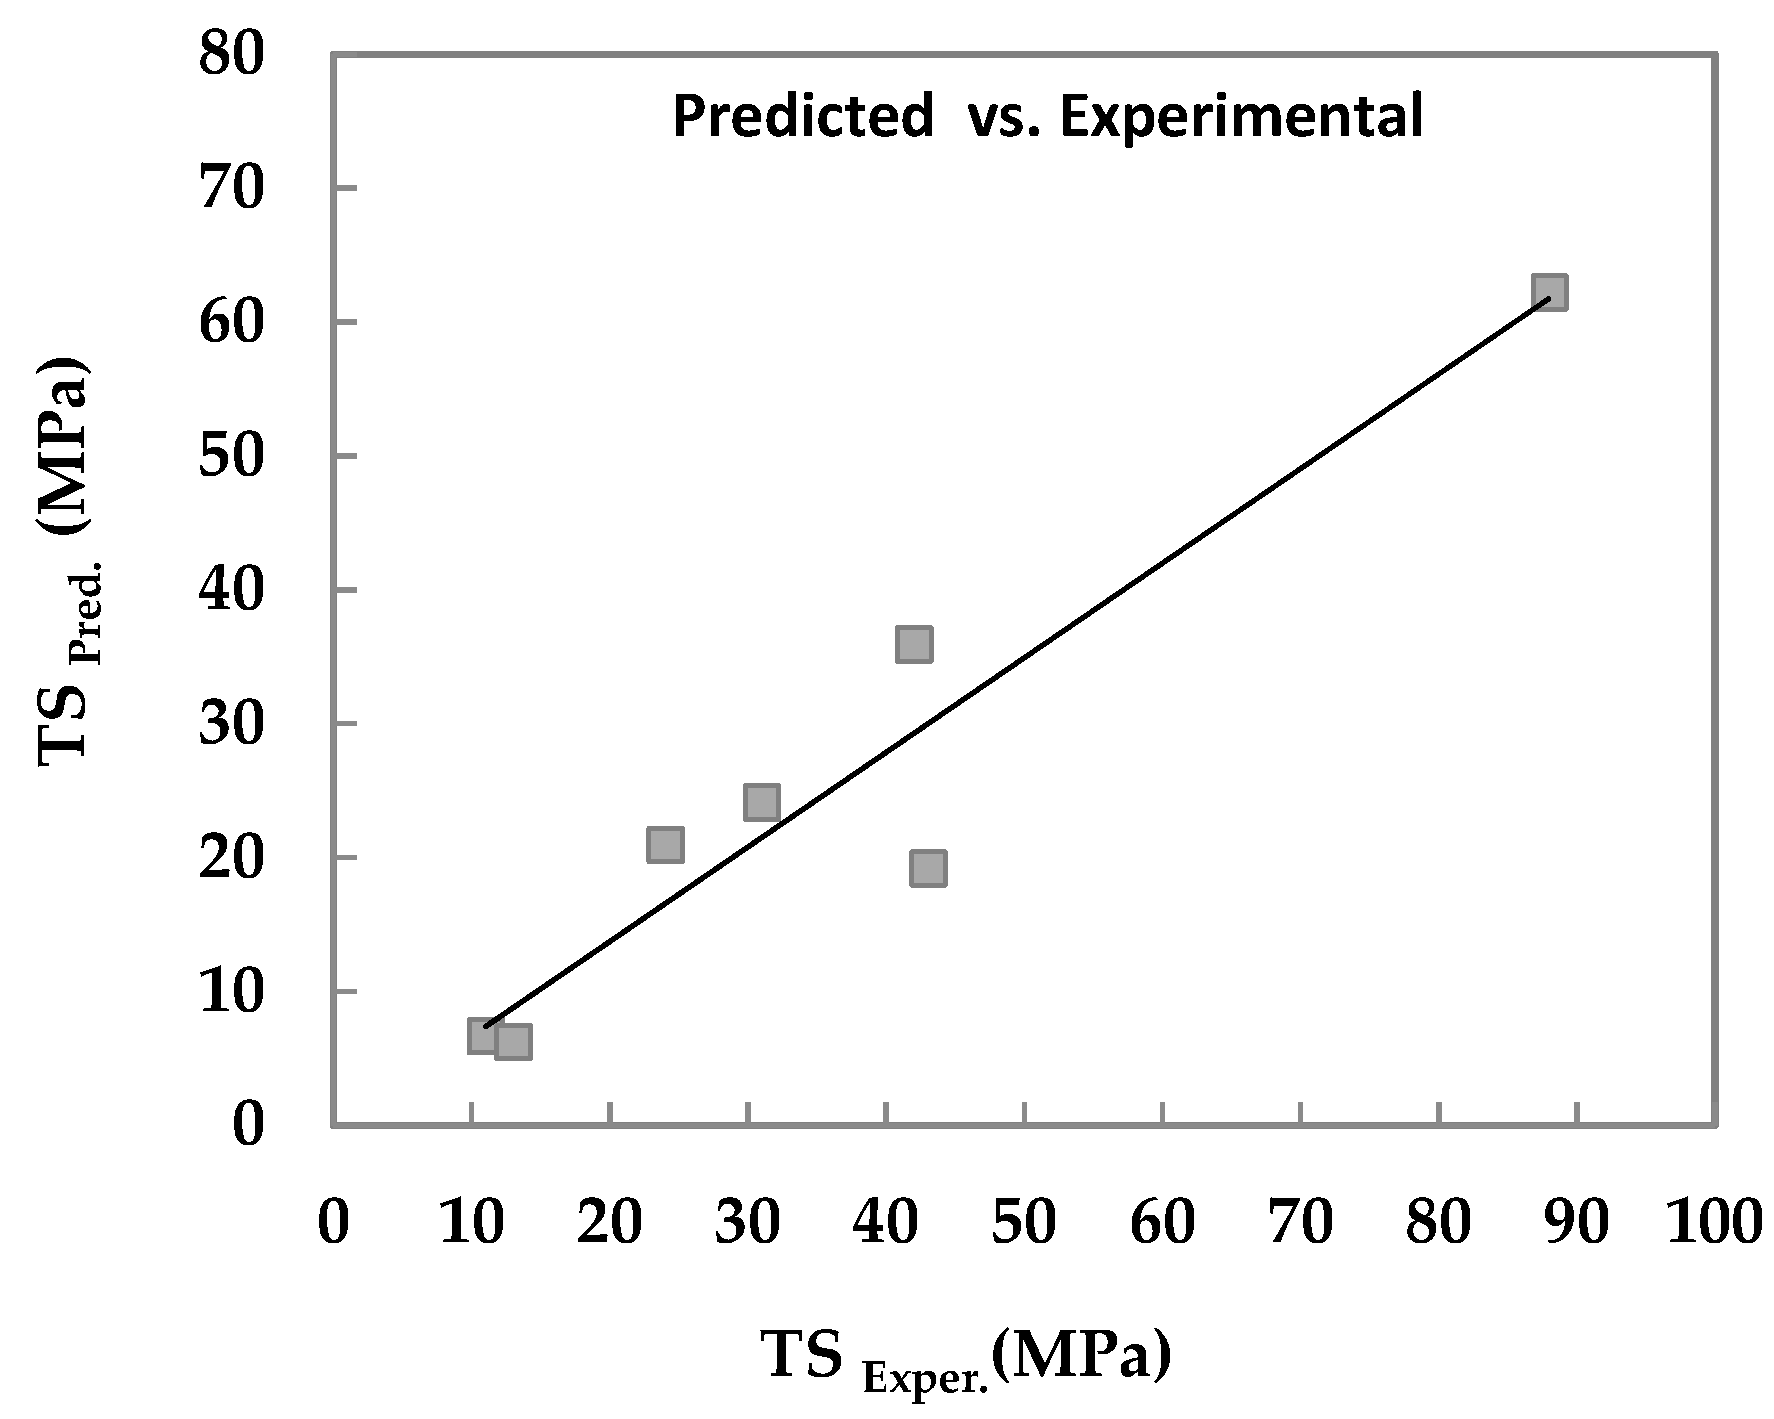
4.1. Results of Modeling

The results of the modeling are shown in Table 5. In this study, four types of Selection: Uniform (Un), Roulette (Ro) and Tournament (To), five types of Crossover: Heuristic (He), Scattered (Sc), Intermediate (In), Single-point (Sp), Two-point (Tp), and three types of Mutation: Uniform (Um), Gaussian (Ga), and Adaptive feasible (Af), were processed. In total, it gave sixty simulations. The values 0.8 and 0.2 have been applied for crossover and mutation fraction, respectively.
The modeling results show that quadratic model No.9 in Table 5 was the best GA model among all simulation models. The minimum MAPE value for the No.9 quadratic model is 0.00093. It can be seen that for heuristic crossover, uniform mutation and uniform selection types determined the best MAPE. Therefore, the 9th GA quadratic model was selected to compute the UTS of the joints.

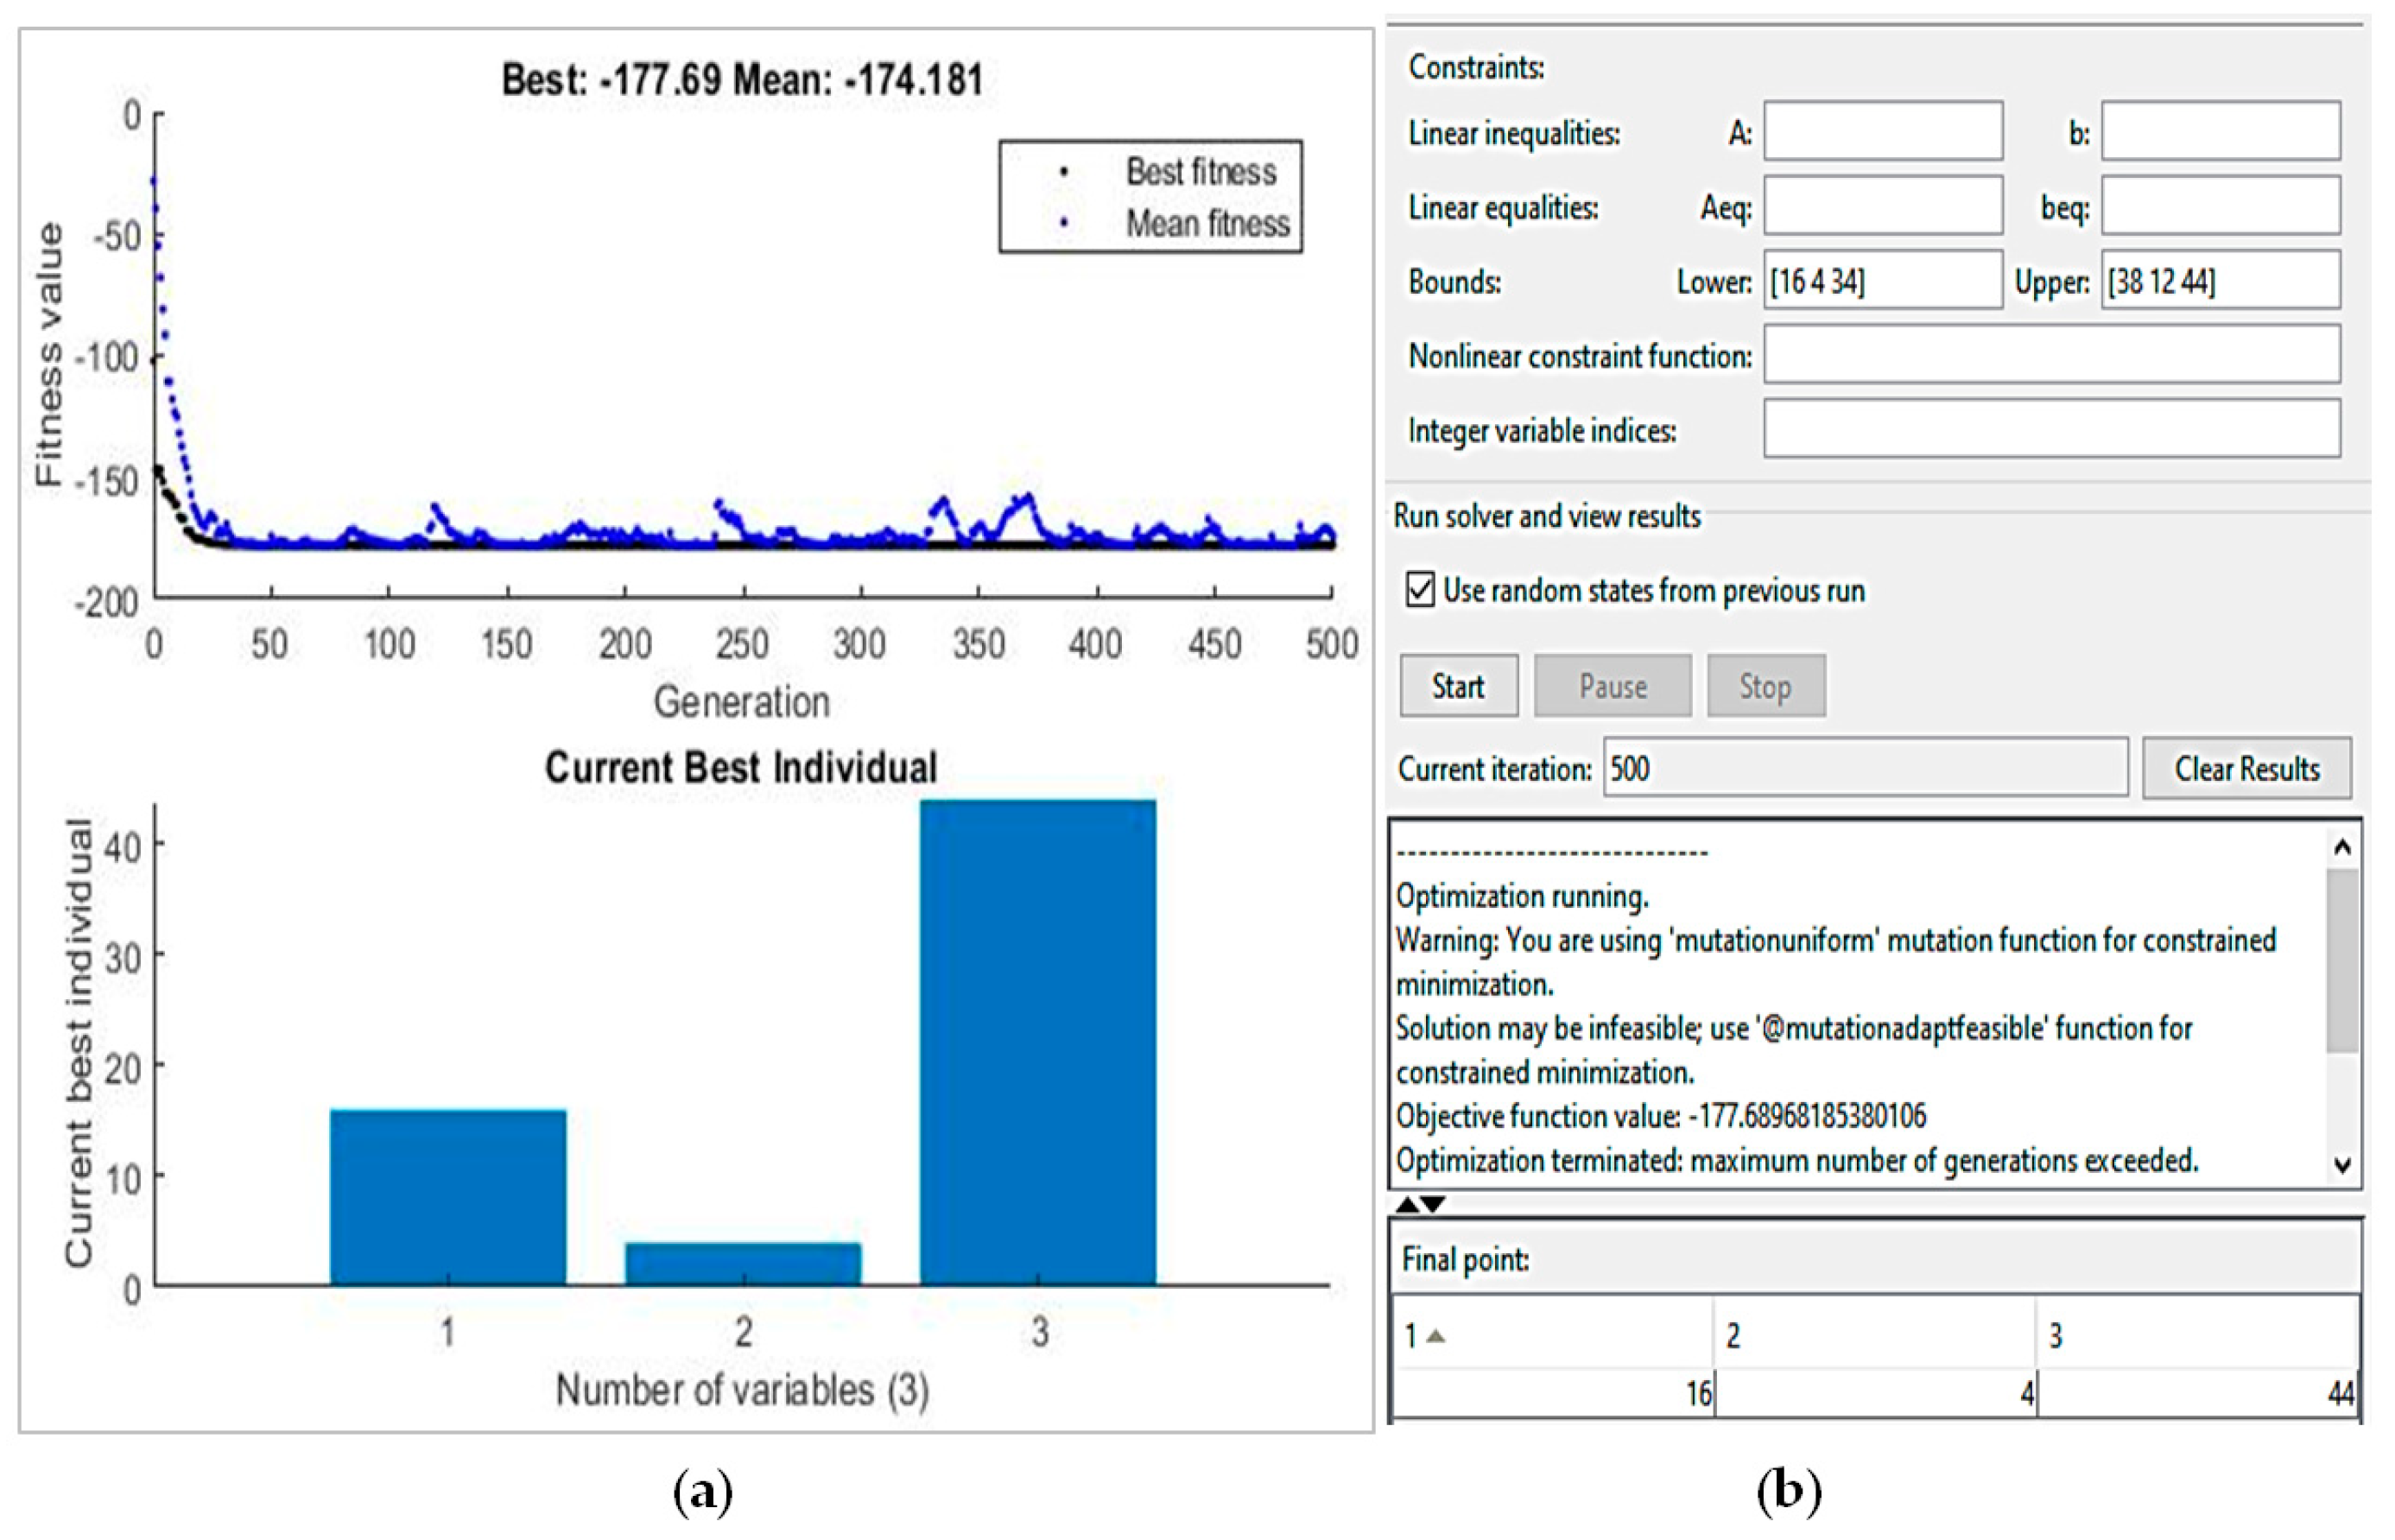
4.2. Results of Optimization

Figure 4 shows the results of the genetic algorithm optimization. The course of the objective function for the 500 generations is shown in Figure 4a. It can be observed that the function reached its mean value of 177 MPa in the 45-th generation. The graph also shows the results of the best process parameters. Therefore, the highest tensile strength can be obtained for the welding parameters: FF = 16 kN, UF = 44 kN, and FT = 4 s (Figure 4). As shown in Figure 4b, the optimization was successful, and the maximum number of generations has been reached. The “final points” are the optimum process parameters.

4.3. Validation of Experiment

For optimal process parameters, FF = 12 kN, UF = 44 kN, and FT = 4 s an additional experiment was carried out. The highest tensile strength was 180 MPa. The tensile results of the investigation were close to the optimization results and confirmed compliance with the assumed model. The largest relative error was 1.69 % (see Table 6). Despite the improvement in TS results, all samples were broken at the line boundary. Comparison of the experimental with predicted values of tensile strength is shown in Figure 5.
The model compliance tests were carried out for various process parameters. The new results, which are presented in Figure 5, confirmed the fit of the model at the level of 95%.

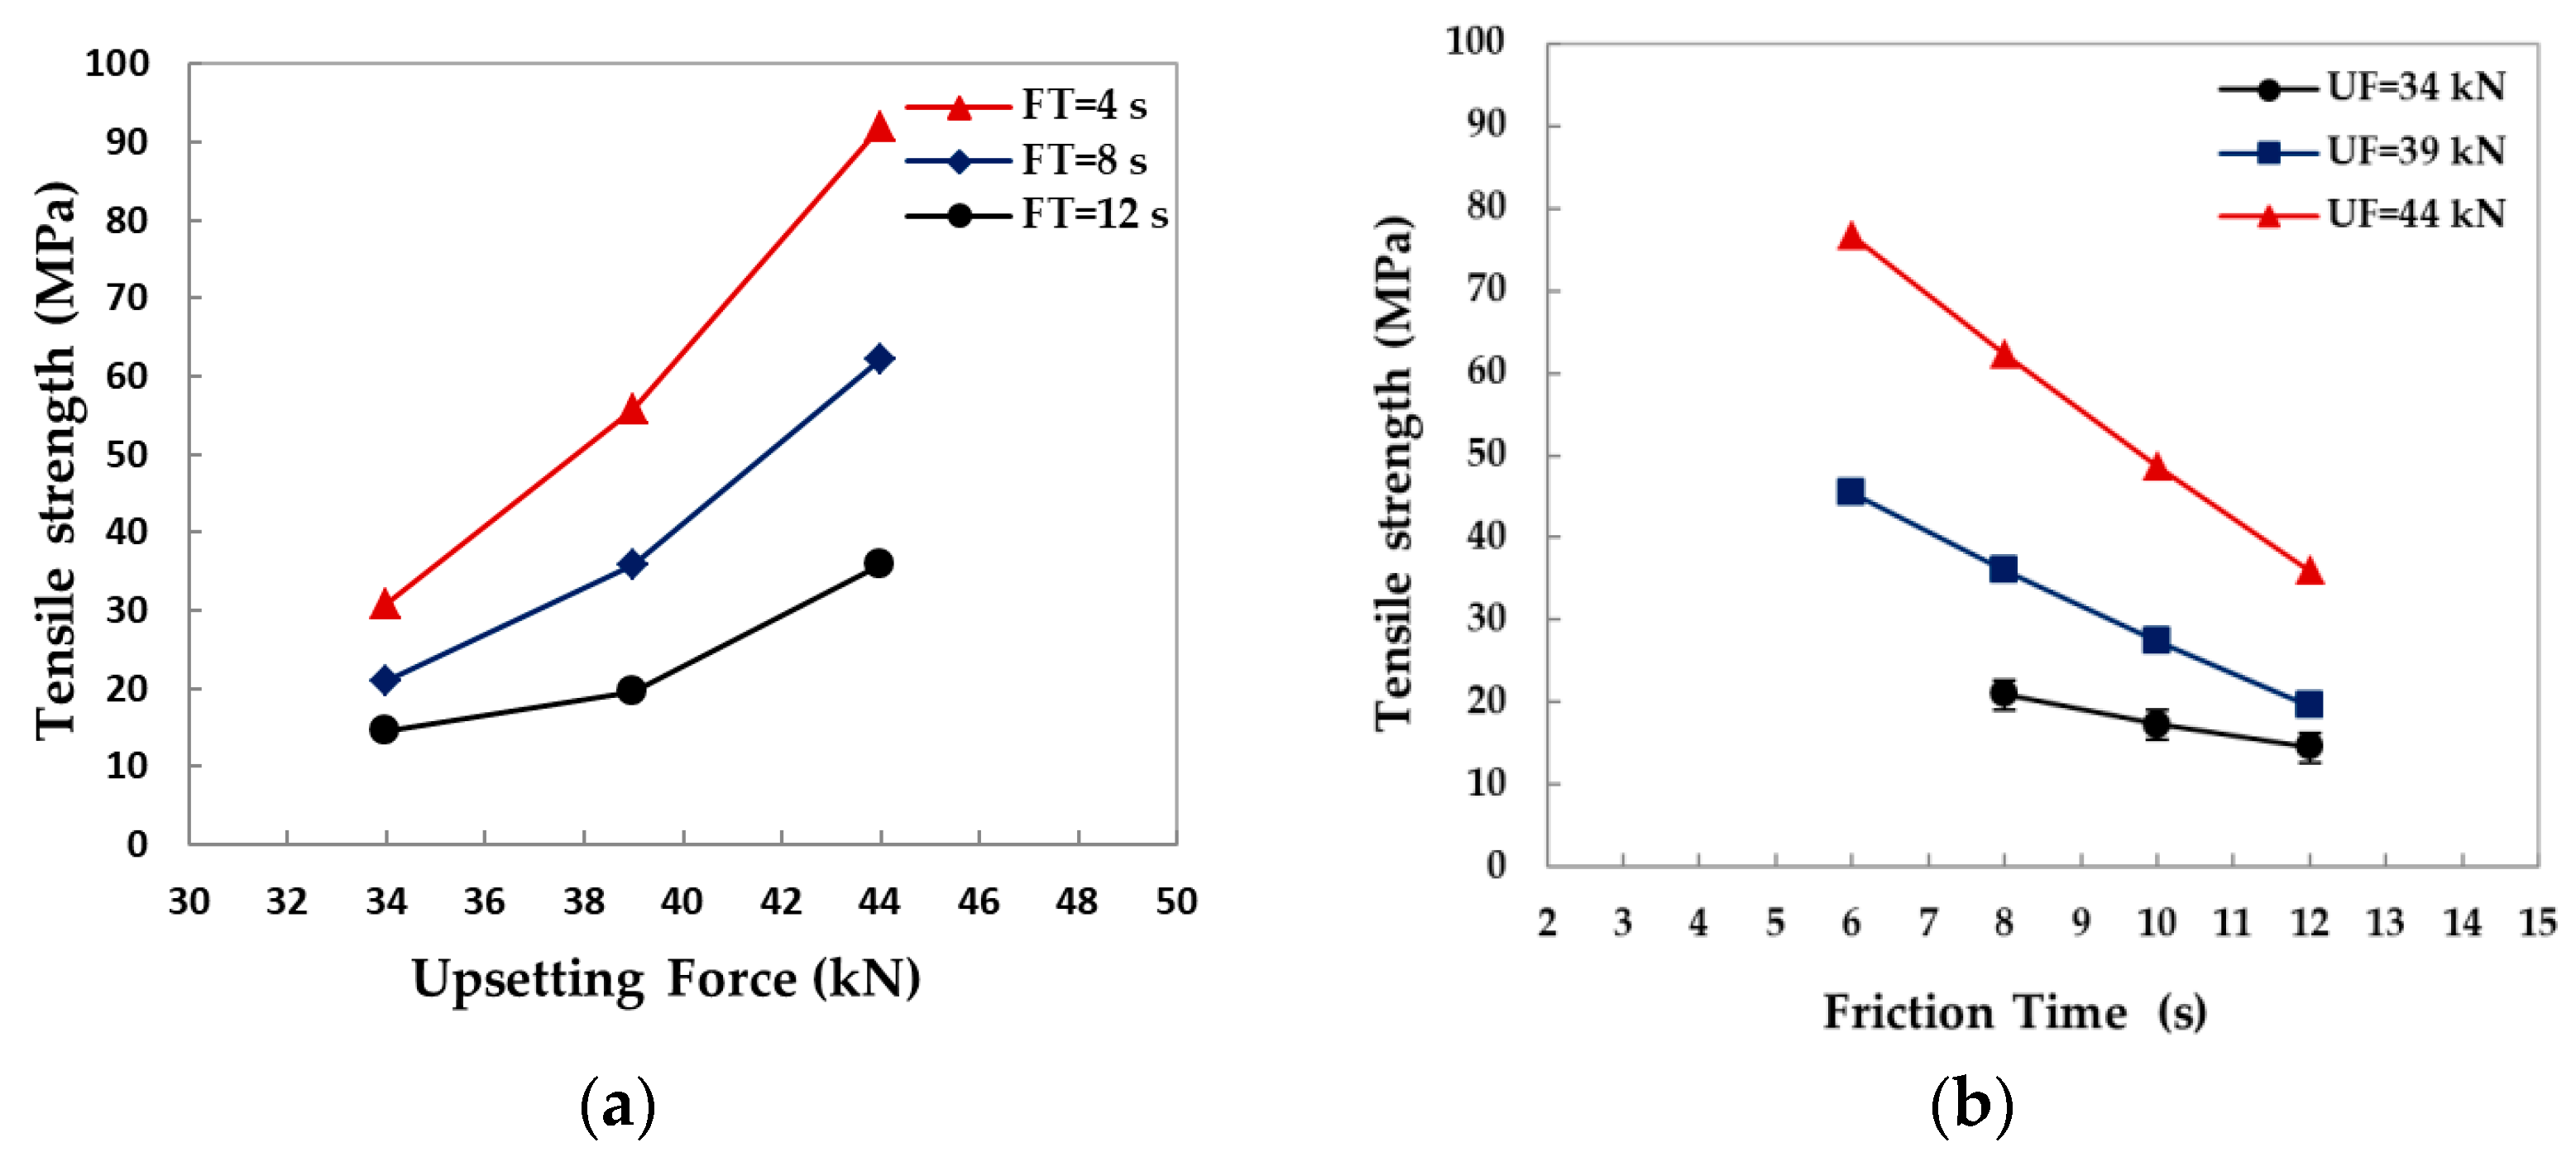
4.4. Effect of the Welding Parameters on the TS

The key parameters of the conventional friction welding method are friction time, friction force, upsetting force, and rotational speed [4,5]. The quality and tensile strength of the welds depend on the correct choice of these parameters [6]. The authors in paper [22] suggest that the reason for the formation of unbonded regions may be the use of short welding times. On the other hand, too long welding times and slow cooling rates may lead to deterioration of the joint strength. The influence of the welding parameters on TS of friction welding is presented in Figure 6.
It can be seen that the upsetting force has a positive effect on the tensile strength of welds. With increasing upsetting force from 34 kN to 44 kN, the tensile strength increased rapidly (see Figure 6a). According to the authors [9], the higher upsetting force removes a significant portion of the intermetallic layers beyond the weld interface. However, the higher force during the upsetting stage would lead to a higher axial shortening of material (material loss). A similar trend was observed during FRW of AZ31B magnesium metal matrix composite by Srinivasan et al. [27].
As can be seen from Figure 6a, the use of a short welding time FT = 4 s and the highest bonding force UF = 44 kN led to the best strength of the joint. According to the author [9], short welding times prevent the formation of brittle phases on welded surfaces. Application of high upsetting forces leads to high plastic deformation, resulting in which the oxide layers are removed beyond the bonding zone.
Figure 6b shows the effect of the friction time on the ultimatum tensile strength for the various upsetting forces. As the welding time increases in the range from 5 s to 10 s, the tensile strength of the joint decreases for all cases of the upsetting forces (see Figure 6b). The longer friction times could see the excess creation of an intermetallic layer. The brittle phases development in the reaction layer may be responsible for the deterioration of UTS, as suggested by the authors [9,10].

5. Conclusions

The ultimate tensile strength of the friction welding process was studied both numerically and experimentally. The main conclusions are found from this work.
(1). Mathematical models were developed to determine the best strength for joining AZ31B with AA7075 using genetic algorithms.
(2). The highest tensile strength of 180 MPa was obtained for the welding parameters of 16 kN friction force and 4 s of friction time, and 44 kN of upsetting force. The application of the genetic algorithm method allowed increasing the tensile strength joint from 88 to 180 MPa using the friction welder ZT–13 type.
(3). The upsetting force has a positive effect on the UTS of the friction joints. With increasing upsetting force, the tensile strength increased rapidly. As the welding time increases, the UTS decreases for all cases of the upsetting force.

Author Contributions

R.W. Proposal of the research topic. Formal analysis. Experiments. Optimization. Writing of the manuscript. Review and editing.; A.S. Formal analysis. Experiments.; P.S. formal analysis, experiments. All authors have read and agreed to the published version of the manuscript.

Funding

This research received no external funding.

Institutional Review Board Statement

Not applicable.

Informed Consent Statement

Not applicable.

Data Availability Statement

Not applicable.

Conflicts of Interest

The authors declare no conflict of interest.

References

  1. Liu, L. Welding and Joining of Magnesium Alloys; Woodhead Publishing Limited, Abington Hall, Granta Park: Cambridge, UK, 2010. [Google Scholar]
  2. Hong, K.M.; Shin, Y.C. Prospects of laser welding technology in the automotive industry: A review. J. Mater. Process. Technol. 2017, 245, 46–69. [Google Scholar] [CrossRef]
  3. Liu, L.; Ren, D.; Liu, F. A review of dissimilar welding techniques for magnesium alloys to aluminum alloys. Materials 2014, 7, 3735–3737. [Google Scholar] [CrossRef] [PubMed] [Green Version]
  4. Vill, V.I. Friction Welding of Metals; American Welding Society: New York, NY, USA, 1962. [Google Scholar]
  5. American Welding Society. Recommended Practice for Friction Welding; AWS: Miami, FL, USA, 1989. [Google Scholar]
  6. Crossland, B. Friction welding. Contemp. Phys. 1971, 12, 559–574. [Google Scholar] [CrossRef]
  7. Kato, K.; Tokisue, H. Dissimilar friction welding of aluminium alloys to other materials. Weld. Int. 2004, 18, 861–867. [Google Scholar] [CrossRef]
  8. Kimura, M.; Fuji, A.; Shibata, S. Joint properties of friction welded joint between pure magnesium and pure aluminium with post-weld heat treatment. Mater. Des. 2015, 85, 169–179. [Google Scholar] [CrossRef]
  9. Liang, Z.; Qin, G.; Wang, L.; Meng, X.; Li, F. Microstructural characterization and mechanical properties of dissimilar friction welding of 1060 aluminum to AZ31B magnesium alloy. Mater. Sci. Eng. A 2015, 645, 170–180. [Google Scholar] [CrossRef]
  10. Liang, Z.; Qin, G.; Geng, P.; Yang, F.; Meng, X. Continuous drive friction welding of 5A33 Al alloy to AZ31B Mg alloy. J. Manuf. Process. 2017, 25, 153–162. [Google Scholar] [CrossRef]
  11. Guo, W.; You, G.; Yuan, G.; Zhang, X. Microstructure and mechanical properties of dissimilar inertia friction welding of 7A04 aluminum alloy to AZ31 magnesium alloy. J. Alloys Compd. 2017, 695, 3267–3277. [Google Scholar] [CrossRef]
  12. Murti, K.G.K.; Sundaresan, S. Parameter optimization in friction welding dissimilar materials. Metal Constr. 1983, 15, 331–335. [Google Scholar]
  13. Paventhan, R.; Lakshminarayanan, P.R.; Balasubramanian, V. Prediction and optimization of friction welding parameters for joining aluminium alloy and stainless steel. Trans. Nonferrous Met. Soc. China 2011, 21, 1480–1485. [Google Scholar] [CrossRef]
  14. Sathiya, P. Optimization of friction welding parameters using evolutionary computational techniques. J. Mater. Process. Technol. 2009, 209, 2576–2584. [Google Scholar] [CrossRef]
  15. Kumaran, S.S.; Muthukumaran, S.; Vinodh, S. Optimization of friction welding of tube to tube plate using an external tool by hybrid approach. J. Alloys Compd. 2011, 509, 2758–2769. [Google Scholar] [CrossRef]
  16. Canyurt, O. Estimation of welded joint strength using genetic algorithm approach. Int. J. Mech. Sci. 2005, 47, 1249–1261. [Google Scholar] [CrossRef]
  17. Canyurt, O. Fatigue strength estimation of adhesively bonded tubular joint using genetic algorithm approach. Int. J. Mech. Sci. 2004, 46, 359–370. [Google Scholar] [CrossRef]
  18. Meran, C. Prediction of the optimized welding parameters for the joined brass plates using genetic algorithm. Mater. Des. 2006, 27, 356–363. [Google Scholar] [CrossRef]
  19. Padmanaban, G.; Balasubramanian, V. Prediction of tensile strength and optimization of process parameters for friction stir welded AZ31B magnesium. Proc. Inst. Mech. Eng. B J. Eng. Manuf. 2010, 224, 1519–1528. [Google Scholar] [CrossRef]
  20. Winiczenko, R.; Salat, R.; Awtoniuk, M. Estimation of tensile strength of ductile iron friction welded joints using hybrid intelligent methods. Trans. Nonferrous Met. Soc. China. 2013, 23, 385–391. [Google Scholar] [CrossRef]
  21. Winiczenko, R. Effect of friction welding parameters on the tensile strength and microstructural properties of dissimilar AISI 1020-ASTM A536 joints. Int. J. Adv. Manuf. Tech. 2016, 84, 941–955. [Google Scholar] [CrossRef] [Green Version]
  22. Srichok, T.; Pitakaso, R.; Sethanan, K.; Sirirak, W.; Kwangmuang, P. Combined Response Surface Method and Modified Differential Evolution for Parameter Optimization of Friction Stir Welding. Processes 2020, 8, 1080. [Google Scholar] [CrossRef]
  23. Rutkowski, L. Computational intelligence, Methods and Techniques; Springer: Berlin, Germany, 2008. [Google Scholar]
  24. Deb, K. Optimization for Engineering Design; Prentice-Hall: New Delhi, India, 1998. [Google Scholar]
  25. Gen, M.; Cheng, R. Genetic Algorithms and Engineering Design; Wiley: New York, NY, USA, 1997. [Google Scholar]
  26. MATLAB 7.6 R2008a. Documentation R.; MathWorks, Inc.: Natick, MA, USA, 2008. [Google Scholar]
  27. Srinivasan, M.; Loganathan, C.; Balasubramanian, V.; Nguyen, Q.B.; Gupta, M.; Narayanasamy, R. Feasibility of joining AZ31B magnesium metal matrix composite by friction welding. Mater. Des. 2011, 32, 1672–1676. [Google Scholar] [CrossRef]
Figure 1. FRW of magnesium alloy to aluminum alloy.
Processes 09 01550 g001
Figure 2. A tensile strength test of the prepared sample.
Processes 09 01550 g002
Figure 3. The main steps of the genetic algorithm.
Processes 09 01550 g003
Figure 4. The results of GA optimization: (a) convergence of fitness values, (b) converged values of welding parameters.
Processes 09 01550 g004
Figure 5. Comparison of the experimental with predicted values of tensile strength.
Processes 09 01550 g005
Figure 6. Effects of the upsetting force and friction time on the tensile strength of friction welds. (a) UF on TS, (b) FT on TS.
Processes 09 01550 g006
Table 1. The mechanical properties and alloying elements (wt.%) of materials.
MaterialChemical CompositionMechanical Properties
MgAlZnCuSiMnFeTensile strength Yield strengthElongationHardness
(MPa)(MPa)(%)HB
AZ 31BRest2.5–3.50.6–1.40.010.080.2–1.00.003248152849
AA 70752.25Rest5.671.620.170.140.295404807150
Table 2. The welding parameters used in the experiment and UTS results.
NoFriction Force (FF)Friction Time (FT)Upsetting Force (UF)Ultimate Tensile Strength (UTS)
#kNskNMPa
S12483424
S224124442
S324103910
S42484488
S53183911
S631123913
S738123431
Table 3. Ranges of process parameters.
#ParameterNotationUnitBounds
LowerUpper
1Friction ForceFFkN1238
2Friction TimeFTs212
3Upsetting ForceUFkN3444
Table 4. The genetic algorithm settings.
ParametersValue
Population size 80
Crossover friction0.8
Mutation friction0.2
Number generations500
Table 5. The results of errors for the two models.
No. SimulationsSelectionCrossoverMutationMAPEQUADMAPECUB
ABCDE
1UnScUm0.16790.1664
2RoScUm0.16730.1686
3UnSpUm0.16800.1662
4RoSpUm0.16870.1656
5UnTpUm0.16530.1669
6RoTpUm0.16620.1663
7UnInUm0.59920.9569
8RoInUm0.16600.1674
9UnHeUm0.000930.00212
10RoHeUm0.17830.1608
11UnHeGa0.09870.0914
12RoHeGa0.13620.1173
13UnScGa0.15580.1393
14RoScGa0.16180.1281
15UnSpGa0.13420.1297
16RoSpGa0.14870.1404
17UnTpGa0.13590.1618
18RoTpGa0.14630.1494
19UnInGa0.14820.1356
20RoInGa0.14890.1245
21UnHeAf0.09250.0928
22RoHeAf0.14510.1516
23UnScAf0.16750.8659
24RoScAf0.16620.1488
25UnSpAf0.17080.8821
26RoSpAf0.15440.1451
27UnTpAf0.23620.2025
28RoTpAf0.14900.1583
29UnInAf1.89282.599
30RoInAf0.15630.155
31ReHeUm0.14750.1653
32ReScUm0.16740.1662
33ReSpUm0.16560.1659
34ReTpUm0.16820.1650
35ReInUm0.16670.1654
36ReHeGa0.15830.1279
37ReScGa0.14810.1256
38ReSpGa0.13370.1320
39ReTpGa0.14140.1461
40ReInGa0.14150.1390
41ReHeAf0.13770.1591
42ReScAf0.15360.1583
43ReSpAf0.16070.1534
44ReTpAf0.15430.1412
45ReInAf0.16930.1717
46ToHeUm0.17220.1966
47ToScUm0.16860.1680
48ToSpUm0.16880.1656
49ToTpUm0.17200.1687
50ToInUm0.16410.1666
51ToHeGa0.14200.1426
52ToScGa0.14940.1343
53ToSpGa0.16770.1479
54ToTpGa0.14110.1325
55ToInGa0.15390.1424
56ToHeAf0.16920.1660
57ToScAf0.15090.1498
58ToSpAf0.16100.1772
59ToTpAf0.15190.1658
60ToInAf0.16240.1620
Table 6. Validation tensile test results.
#FF (kN)FT (s)UF (kN)UTS
Predicted
(MPa)
Observed
(MPa)
Errors
%
1164441781751.69
216444178180−1.12
3164441781761.12
Error = [( observed   value     predicted   value predicted   value ) ·100%].
Publisher’s Note: MDPI stays neutral with regard to jurisdictional claims in published maps and institutional affiliations.

