
Inverse Molecular Design Techniques for Green Chemical Design in Integrated Biorefineries
by
 , , and
Jamie W. Y. Lee
1, 
Lik Yin Ng
1,* ,
,
Viknesh Andiappan
1,
Nishanth G. Chemmangattuvalappil
2 and
and
Denny K. S. Ng
1
1
School of Engineering and Physical Sciences, Heriot-Watt University Malaysia, Putrajaya 62200, Malaysia
2
Department of Chemical and Environmental Engineering, University of Nottingham Malaysia, Jalan Broga, Semenyih 43500, Malaysia
*
Author to whom correspondence should be addressed.
Processes 2021, 9(9), 1569; https://doi.org/10.3390/pr9091569
Submission received: 31 July 2021
/
Revised: 27 August 2021
/
Accepted: 30 August 2021
/
Published: 1 September 2021
(This article belongs to the Special Issue Process Systems Engineering Tools for the Design of Ionic Liquids and Integrated Biorefineries)
Abstract
:Over the past decades, awareness of the increase in environmental impact due to industrial development and technological advancement has gradually increased. Green manufacturing is one of the key approaches that begin to address environmental issues. With the current global attention, methodologies to incorporate green manufacturing into the design of green products through the green process route are much needed. However, it is challenging for industries to achieve this, as there is no definite definition of green. This work presents a systematic approach that provides a clear and consistent green manufacturing definition with a measurement method in terms of both product and process. With the consistent green definitions, the developed approach designs a product that satisfies green property and other product performance properties. In addition, the developed approach synthesises the production process that fulfils green manufacturing definitions and financial considerations for the designed product. A case study on the design and production of green biofuel is solved to illustrate the efficacy of the approach. Green product design is obtained by identifying molecular building blocks that fulfil the targeted properties using an inverse molecular design technique. The goal is to design a chemical product that is environmentally friendly while fulfilling customer requirements. Moreover, a superstructural mathematical optimisation approach is used to determine optimal conversion pathways that have minimal environmental impact on the production of the identified green product. The utilisation of multi-objective optimisation allows the design of product and process to strike a good balance between operational and environmental performances.
1. Introduction
In recent decades, issues of increased environmental impact and excessive consumption of natural resources due to industrial development have become major concerns for the industrial and academic sectors [1]. These issues include chemical pollution caused by abuse or unintentional spread of hazardous pollutants to the atmosphere [2]. This can lead to a direct toxicological impact on mankind and the environment. Prolonged exposure to such pollutants can cause serious effects on humans such as shortness of breath, nausea, vomiting, and even death. Other than that, the issue of depletion of non-renewable natural resources will be devastating to mankind in the future [3]. According to EIA [4], the amount of oil remaining would last until 2050 due to the high oil exploitation rate. The adverse impacts of oil depletion include a fall in business, an increase in living costs, and uncertainties in the transportation sector. Therefore, awareness of the requirement for environmental protection has gradually increased. Actions from researchers and governments have been taken to address these issues by proposing a managing model as well as new law and regulation formulation [5]. For example, in Malaysia, Environmental Quality (Clean Air) Regulations have been implemented since 2014 with an emission standard of 150 mg/m3 in total discharged gas [6]. In order to encourage compliance with emissions limits, a heavy penalty of up to RM 1,000,000 or two years of imprisonment is imposed on parties who fail to comply. In European countries, the European Parliament has adopted the “Industrial Emission Directive” since 2010 to regulate pollutant emissions from industrial installations by reviewing the whole environmental performance of the plant. This is aimed to achieve a high level of protection of the environment and human health by restricting harmful industrial emissions [7].
Aside from the laws and regulations, green manufacturing is one of the key approaches that initiates the production of materials and processes that minimise the effect on the environment together with human health. Green manufacturing plays an important role as issues related to excessive waste generation and energy consumption need to be resolved in the near future due to growing living standards [8]. Green manufacturing is widely known as a sustainable manufacturing approach that aims for profitability through environmentally friendly operating processes [9]. Generally, green manufacturing refers to processes of manufactured products that utilise natural resources to reduce impacts on the environment and conserve energy utilisation [10]. Traditionally, green manufacturing is defined as activities that attempt to decrease waste [11]. Mohanty and Deshmukh [11] classified waste as the generation of non-value-adding products and activities in the work process. Thereupon, the assessment of wastivity is introduced as an approach to monitor the amount of waste produced in an organisation. The concept of wastivity is defined as the ratio of waste produced to the total resource inputs. Sources of waste are identified from wastage in raw materials, the labour force, maintenance works, and the operational process to the final packaged product. Consequently, action plans suggested to reduce waste include pipeline leakage sealing, strict monitoring of operation parameters, and the utilisation of empty bulkers during the return trip. However, these suggestions only stressed waste detection and correction without taking waste prevention into consideration.
A decrease in waste generation alone is insufficient to prove or provide a safer and green process as a decrease in waste does not represent the safe disposal of waste. In addition, the presence of hazardous waste with a high level of toxicity without going through treatment would cause a negative effect on public health and the environment. Aside from reducing waste, the manufacturing process should involve hazardous waste management to lessen the number of hazardous substances produced and treat hazardous waste to reduce the toxicity to an acceptable level [12]. The disposal and emissions of harmful waste play a major role in causing environmental pollution and eventually lead to catastrophic consequences for mankind in the future. Therefore, green manufacturing is further defined as actions that prevent pollution. The risk assessment method is one of the actions used in pollution prevention, which helps to quantify the degree of environmental impact for different chemicals. This enables the estimation of environmental impacts caused by specific chemicals and the minimisation of the associated risk in all directions [13]. By considering the environmental impacts of both product and process, sources of pollution and contamination can be identified from raw materials to end-of-life product disposal [14]. The source of pollution is then used as an indexing parameter in the Green Manufacturing Index (GMI). Nukman et al. [15] proposed the use of GMI that utilises information such as the source of pollution and impacts of the pollution as its’ indexing parameters to determine the effectiveness of pollution. Ultimately, the practice of pollution prevention practice is geared toward decreasing environmental damage arising from product- and process-related design.
In addition to pollution prevention, green manufacturing should be practised to reduce the damage caused by chemical products and processes on renewable and non-renewable natural resources. As reserves of certain resources will be exhausted at the current rate of consumption, activities that destroy natural resources such as uncontrolled consumption should be avoided to prevent overexploitation of non-renewable resources [16]. Likewise, a higher rate of harvesting than replenishment of renewable resources and pollution of biodiversity results in the deterioration of the environment. To reduce the environmental burden, the product life cycle is used as an important tool to promote design that leaves a smaller environmental footprint [17]. The entire product life cycle should involve environmental practises such as clean production, green design, and reuse with the aim to minimise the disposal of products. In this case, non-toxic and renewable feedstock should be used as raw material for manufacturing processes to promote healthy consumption patterns of resources.
From the abovementioned works, it can be seen that past research works on green manufacturing tend to focus more on reducing waste and environmental impact. Other than waste and environmental impact reduction, energy consumption plays an important role in the manufacturing process. According to Deif [18], green manufacturing is an approach to designing the product and process that requires less material and energy input. Maruthi and Rashmi [19] state that the goal of green manufacturing is to maximise resources and energy efficiency by conserving energy sources. Energy conservation is the application of devices that are able to reduce the consumption of energy by having low energy requirement functionalities. This results in a decrease in natural resources consumption used to provide energy generation. Li and Lin [20] adopted a range-adjusted measure-based data envelopment analysis (DEA) model developed by Wang et al. [21] as an approach to calculating energy efficiency and environmental performance using the directional distance function (DDF) model. However, most studies adopt the DDF model to assess only environmental performance. This is due to the model complexity and contradiction to the actual process, which may lead to the recommendation of the wrong strategies [20]. In view of the fourth industrial revolution, the internet of things (IoT) has become significant in industrial development by improving the machine’s energy efficiency and cutting down energy waste [22]. Although rich research results are available for IoT, works that integrate IoT and green manufacturing are limited. Hence, manufacturing processes that consume less energy and are able to recycle heat waste in the first place are prioritised during the product and process design stage. As the demand for manufacturing is expected to grow in the near future, the improvement of the energy-efficient manufacturing process has become increasingly crucial for any industry [15].
In addition, green manufacturing is also defined as processes to produce a reusable sustainable product. The verb reuse is recognised as an action to divert material from the waste stream. One of the approaches to reuse material is material exchange by means of passing the materials that are no longer useful to other organisations to be used for other applications [23]. The material exchange concept is similar to industrial symbiosis, which was discovered by van Berkel [24]. Industrial symbiosis involves the collection of waste material from symbiosis partners, which act as alternative feedstock or energy sources for the organisation. Furthermore, remanufacturing and refurbishing are other ways of reusing material by breaking down waste material to recover or rebuild them into useful components [25]. These methods turn useless material into value-added material, which directly reduces unnecessary waste disposal and emission. Additionally, approaches to reuse offer a better and environmentally preferred alternative compared to the waste management method by limiting the need for new natural resources. However, it is noted that factors such as ease of recyclable material employment and potential hazards of the material should be considered while selecting the materials to be reused. To avoid unnecessary impacts after the end of a product or process’s usable life, it is preferable for products to have shorter life cycles [26]. In this context, the life cycle refers to the usable life of a material. Material with longer usable life required more time and energy to allow the decomposition of the material. Additionally, the product life cycle relates to the biodegradability of the organic material. The material should be able to break down or be mineralised by microbial or fungal activity to avoid pollution and contamination to the environment [27].
From the abovementioned discussion on green manufacturing, it can be seen that specific action or measurement methods for green manufacturing cover a wide range of definitions and categories. In addition, the systematic approach to simultaneously measuring and assessing green products and processes is limited. Hence, an organised approach that is capable of identifying, quantifying, and assessing the performance of green is needed for long-term sustainability in the future.
2. Incorporation of Green Manufacturing into Product and Process Design
2.1. Integration of Process and Product Design
Green manufacturing encompasses a variety of aspects to be considered, from the design of the product to the synthesis of the production process. It is thus important to integrate process and product design aspects as an overall design problem. A hybrid design method that integrates mathematical modeling with heuristic approaches was proposed by Hostrup et al. [28] to simultaneously synthesise a separation process and select the suitable solvent. Eden et al. [29] presented a systematic approach that formulates the process and product design problem as two reverse formulations. The approach first identifies the process design targets by solving the product design problem, then synthesises the production process by solving the identified design targets. Papadopoulus and Linke 2006 [30] presented a systematic framework to solve an integrated solvent design and process synthesis problem. The molecular clustering approach was utilised in the framework to identify a Pareto optimal solvent that fulfils both the product and process performance targets. An approach that integrates computer-aided molecular design (CAMD) techniques and reaction network flux analysis was presented by Hechinger et al. [31]. The presented approach was utilised in identifying biofuels and the production pathways for the design of biofuels. Ng et al. [32] proposed a systematic methodology for the synthesis of biochemicals in integrated biorefineries. Biochemicals that satisfy customer requirements were designed using CAMD techniques, while biomass conversion pathways that produce the designed biochemicals were determined using a superstructural mathematical optimisation approach. This methodology was later extended by Ng et al. [33] for the design of a mixture in integrated biorefineries to address the product design challenge where the desired product properties cannot be fulfilled by a single-component chemical product. Meramo-Hurtado and González-Delgado [34] presented a hierarchical approach for the synthesis and design of a multi-product biorefinery. Through decision-making, multi-objective optimisation, and numerical methods, an optimal biorefinery was synthesised by considering different feedstock and final products. The concept of decision-making was also incorporated into the work presented by Lai et al. [35] to consider the cooperation among the corporate unit, business unit, research and development unit, and production unit in a chemical design and production enterprise. Restrepo-Flórez and Maravelias [36] developed a superstructural framework for the design of biorefineries that utilises ethanol to produce gasoline, jet fuel, and diesel. The framework considers aspects such as catalysis, process synthesis, and fuel property modeling in designing biorefineries that produce fuels with specified product properties. Recently, Tey et al. [37] proposed a comprehensive framework for the design of value-added pharmaceutical products from biomass. A chemical reaction pathway map (CRPM) was utilised to connect raw material, potential conversion pathways, and final products, while a mathematical optimisation approach was used to identify the compromised solution that considers the gross product and sustainability index. While these works discussed in detail the integration of process and product design, it is realised that the consideration of green manufacturing into the overall process and product design is limited.
2.2. Methodology
In order to incorporate green manufacturing into the overall product and process design, a systematic approach is developed to integrate product and process design with the measurement of green manufacturing. Definitions of green manufacturing in product and process design are first defined and categorised. This is followed by the design of an optimal green chemical product that fulfils the defined green and customer requirements by using the group-contribution method. Based on the designed product, an environmentally friendly conversion pathway is then determined by employing a superstructural mathematical optimisation approach. The step-by-step procedure to design a green chemical product and conversion pathway is presented as shown in Figure 1. The developed approach shown in Figure 1 can be separated into two stages, stage one that focuses on product design and stage two to identify the conversion pathway.
Step 1: Gather information for consistent green manufacturing definition.
The available green manufacturing definitions are reviewed and generalised into different categories. The purpose of generalisation is to group similar definitions that serve the same purpose and require the same green outcome on mankind and the environment. The generalised green definitions are further categorised in terms of product and process as shown in Table 1 and Table 2. This is imperative to allow easier identification of distinct differences between measurement methods required for the product and process. Additionally, categorisation provides comprehensive and clearer judgements on approaches to achieve green manufacturing needs. For instance, one of the green manufacturing product definitions is generalised as avoidance of unnecessary impact or use of energy after the end of usable life. This definition is needed and essential to be defined because the definition indicates the design of products that are able to break down into innocuous degradation products. Added to that, this definition restricts the design of high-complexity products that persist in the environment. By incorporating this definition into the initial product design strategy, end-of-life burdens of the designed chemical product can be significantly reduced. Table 1 below shows a summary of the generalised green definitions for products.
It should be noted that most of the green definitions of products are focusing on the chemical industry. For other manufacturing industries, the information in Table 1 should be updated to consider the important green performance indicators of the industry. Table 2 below shows the list of generalised green manufacturing definitions for processes. One of the green manufacturing definitions is minimisation of waste and material consumption. This definition emphasises the process pathway to restrict waste generation instead of treatment for created waste. Decisions about the process pathway should be able to reduce the need for raw materials and incorporation of all materials used into the final desired product. Hence, this definition is essential to employ in the process design as it is the key to initiating practice to minimise the impact of undesirable output from processes on the environment and human health.
Similar to green definitions of products, green definitions of process, as shown in Table 2, are developed for the chemical industry. While it is possible to utilise the definitions for other manufacturing industries, it is suggested to update Table 2 for a more correlated and straightforward assessment of green performance indicators.
Step 2: Define objective for manufacturing process.
With the generalised definitions, measurement methods are first identified according to the target properties of the product to solve the product design problem. This is performed by identifying the appropriate green definitions of green products. Green products cover the targeted chemical and physical properties to ensure the designed product fulfils green manufacturing needs with reference to Table 1. Apart from that, the properties of product requirement are identified to comply with customer needs. With these, the process pathway to produce the green product is determined with the definitions in Table 2 to ensure both product and process fulfil defined green manufacturing. Hence, the objective is to develop a measurement approach that can meet green manufacturing and customer needs.
Step 3: Gather information on product.
Once the objectives for green products and processes have been identified, the defined green manufacturing and customer needs are translated into measurable properties. Method of measurement is identified to quantify the green manufacturing definitions. For example, Oral Rat LD50 can be used to ensure the designed green product is safe to use and will not cause a negative impact on the environment, which fulfils the definition of being harmless to human health and the environment. On top of that, the method of measurement and targeted property constraints are determined to guarantee that the product design solution achieves green manufacturing and customer needs. The property constraints are written as a set of property ranges bounded by upper and lower limits. The limits can be extracted from current environmental regulations and industrial standard. For example, the designed fuel product viscosity should fall between 0.30 cp to 0.60 cp to allow consistent fuel flow and lower pumping power requirements that fulfil customer needs. The properties constraints for product design are generalised as shown in Equation (1).
In Equation (1), represents the index for the target property. is the target value, while the constraints are represented as , the lower limit, and , the upper limit for the desired product property.
Step 4: Design product using inverse molecular design technique.
With the product information, the mathematical model using the group-contribution method is formulated to design a green chemical product. Molecular building blocks that are suitable for the product design problem are first determined in this step. The designed product with the combination of selected molecular building blocks should be able to replace the currently available product with similar functionality. For instance, CH- can be set as one of the molecular building blocks to represent the alkane functional group when the product design problem is to design a fuel product. Other than setting properties constraints in the model, as shown in step 3, structural constraints are also employed to allow the generation of a feasible chemical structure without the formation of free bonds. Assuming that only a single bond is considered, the structural constraint is illustrated as shown in Equation (2), based on Chemmangattuvalappil et al. [52]. n1, n2, n3, n4 refers to the number of degrees one, two, three, and four of a molecular building block that are available to bond with other molecular blocks, while N represents the total number of molecular blocks in a molecule.
Moreover, the objective function is applied in the model to obtain an optimal solution of the product for a targeted property. For example, maximisation of a higher heating value can be set as the objective function when designing biofuel in order to fulfil engine efficiency according to customer needs. Subsequently, the solution for product design can be obtained. However, targeting on single objective is insufficient to provide a green chemical product solution. Other properties of the product will also be the key to designing a green chemical product. In order to consider multiple objectives simultaneously on several targeted properties, the chemical product design problem is solved as a multi-objective optimisation problem. The traditional weighted-sum method in solving the multi-objective optimisation problem requires decision-maker(s) to assign a weighing factor to each objective using expert judgement. In addition, the weighted-sum method might be biased as the weighing factors assigned to each objective are heavily dependent on expert knowledge or the personal preferences of the decision-maker. To address this, the fuzzy optimisation approach is incorporated into this mathematical model. The degree of satisfaction λp of targeted property p is introduced as shown in Equations (3) and (4). λp ranges between the values of 0 to 1, which implies the level of satisfaction on targeted property value Vp within the property constraints. A higher value of λp indicates higher satisfaction of the targeted property. When minimisation of the property is required, the value of λp approaches 1 when the obtained property value approaches the lower limit. Equation (3) is used when property needs to be minimised.
Equation (4) is utilised when the property need to be maximised. The λp value approaches 1 when the obtained property value approaches the upper limit of the target property range.
The degree of satisfaction is split into three regions of above satisfactory, satisfactory, and below satisfactory, as shown in Figure 2.
Next, the max–min aggregation approach is used to maximise the least-satisfied degree of satisfaction λ. This is to ensure every targeted property is optimised simultaneously without any bias. To achieve this, the objective of the proposed method is to optimise the weakest/worst property among all targeted properties to be optimised. Thus, the least-satisfied λ is maximised where the overall objective function is formulated as shown in Equations (5) and (6).
It can be seen from Equations (5) and (6) that the fuzzy optimisation approach identifies the relative importance of each targeted property to be optimised without the presence of a decision-maker, hence minimising the influence of bias on the chemical product design problem. To generate additional alternative feasible solutions, integer cuts are utilised. Integer cuts are applied as an additional constraint on the proposed mathematical model to avoid the same solution being generated again. The application of integer cuts can be continued until no feasible solution is obtained. Once the designed product achieved green and customer needs, Step 5 can be proceeded to determine the process that produces the designed product. If not, Step 3 needs to be repeated for further research to amend or improve product information.
Step 5: Gather information on process.
With the identified green definitions of process, the measurement method is determined to quantify green manufacturing needs on the process pathway. Information on all possible conversion pathways that convert specific feedstock to intermediates, then from intermediates into the final desired product is identified. With all the identified conversion pathways, the superstructure can be constructed. Next, parameters to measure the process performance can be identified. For example, the yield of the desired product is aimed to maximise the achievement of the green definition on minimisation of waste generation. To calculate the yield of the process, the conversion rate on each conversion pathway need to be obtained, which can be found through the literature. Other than that, the measurement of specific energy consumption can be formulated to acquire a process pathway that fulfils the minimisation of energy requirements and the green manufacturing needs. Specific energy consumption can be calculated from the heat of reaction through changes in heat of formation of each substance where the heat of formation of substances can be easily found. On top of that, all parameters are determined to guarantee that the process design solution achieves green manufacturing without neglecting customer needs. Customer needs can refer to the economic performance of the process, which is calculated as gross profit. The total capital and operating costs required for gross profit calculation can be obtained through references.
Step 6: Define objective function and formulate and solve the mathematical model.
Once the information on the process is gathered, a mathematical model can be created by formulating the design problem using a superstructural mathematical optimisation approach. In order to obtain the optimal solution to the conversion pathway, the objective function is applied to targeted parameters, which measure the performance of the process. For example, minimising environmental burden is set as the objective function when selecting conversion pathways. This is to fulfil green manufacturing needs where the prevention of pollution is considered when designing the process. Subsequently, the solution to conversion pathway selection to produce the desired product as found in the product design problem can be obtained. As multiple objectives are needed to be optimised, a fuzzy optimisation approach is utilised. With the developed model, an optimal process pathway that is green and economically feasible can be obtained based on the desired green product design.
Step 7: Configure the overall product/process design.
When green manufacturing needs on product and process are fulfilled, the developed mathematical model can successfully propose an optimal green product design with a green process pathway. If the solution to the product design does not achieve green manufacturing and customer needs, the steps cannot proceed to determine the optimal process pathway. This is because the desired product design is not identified. Hence, Step 5 has to be repeated to refine process information until the desired green product is achieved. After that, the refinement of process information is needed when the green process did not improve the feasibility of determining the optimal process pathway. The developed approach solves the process and product design problem as two design problems. Although an iterative feedback loop might be needed, this developed approach lowers the computational complexity of the problem. This reduces the computational efforts required to solve the problem compared with solving the integrated process and product design problem simultaneously. If it is required to solve an integrated process and product design problem simultaneously to obtain one optimum overall result, an algebraic approach presented by Bommareddy et al. [53] can be utilised. However, simultaneous solution is not considered in this approach.
This work employs CAMD techniques and the fuzzy optimisation approach. It is noted that suitable property prediction models for product property estimation are not always available. Though data-driven techniques can be used in these situations, the accuracy of the identified correlation might be a concern to the user. In addition, it can be seen from Equations (3) and (4) that upper and lower limits for an objective are required in utilising the fuzzy optimisation approach, which might be challenging to obtain. Hence, this presented approach needs to be utilised judiciously by replacing the property prediction models and solution strategies depending on the nature of the design problem.
A case study is presented to show the efficacy of the developed two-stage optimisation approach.
3. Case Study
The application of the developed two-stage optimisation approach is demonstrated by solving the biobased fuel design and production problem taken from Ng et al. [32]. This case study is suitable to illustrate the developed approach as it involves designing a chemical product from biomass and identifying the biomass conversion pathway to produce the designed chemical product. In the first stage, the green biofuel is designed via a CAMD approach using the group contribution method. In the second stage, the optimum green manufacturing conversion pathway that produced the designed biofuel product from biomass in terms of different objectives is determined by the superstructural mathematical optimisation approach.
3.1. Design of Optimal Green Product
3.1.1. Identification of Target Properties, Target Property Range, and Property Prediction Model
The biobased fuel product is designed to fulfil the defined green manufacturing needs while complying with customer needs. Based on the developed green manufacturing definitions as explained in methodology in Table 1, properties of octanol/water partition coefficient (LogKow), flash point (Tf), lethal dose (LD50), and latent heat of vaporisation (Hv) are considered in this case study. The properties are used to quantify green manufacturing definitions. Other than properties that define green, the bio-based fuel product should also comply with customer needs, which represent the product performance by satisfying the performance constraints. In this case study, properties that cover customer needs include viscosity (η), surface tension (σ), density (ρ), Hildebrand solubility parameter (δ), and higher heating value (HHV). The green biofuel product should not cause an unnecessary impact on the environment. This can be measured as LogKow, which is the tendency of a chemical product to bind with a living organism or soil. The value should remain low to prevent bioaccumulation. Furthermore, the flammability characteristic and toxicity of the biofuel are measured as Tf and LD50, respectively. This is to ensure that the product is safe to use as it is non-inflammable, non-hazardous, and non-toxic to human health and the environment. Additionally, the stability of biofuel is taken into consideration by Hv. As mentioned, the designed product should also comply with customer needs and the product design stage. Therefore, η is measured and preferred to be low to minimise the pumping power requirement as well as ensuring consistency of the fuel flow. Meanwhile, the energy requirement for combustion is measured as surface tension (σ) to assure the combustion quality of the biofuel. Other important properties are ρ and δ. A high density is expected to increase the fuel mass flowrate and hence reduce the production equipment size. As biofuel is also considered as biosolvent due to its properties; biofuel can be an effective diluent for liquid–liquid extraction other than an environmentally friendly fuel. Thus, δ of biofuel is part of fulfilling the customer needs to determine the behaviour of the fuel. In order to obtain high engine efficiency, HHV of the biofuel is measured and set to be high, which represents the high energy content of the fuel. Through using the assessment report by API [54] as the main reference, the target property range to be fulfilled for each of the abovementioned properties is shown in Table 3.
After identifying the target properties for the biofuel product, property prediction models based on group contribution (GC) methods are utilised to estimate the target properties in the design problem. The estimation of properties by employing the GC method is illustrated using Equation (7). In Equation (7), f(X) is the function of the targeted property; X. Ni, Mj, and Ok are the number of occurrences of the first-, second-, and third-order groups; Ci, Dj, and Ek represent the contributions of the first-, second-, and third-order groups; and w and z are binary coefficients.
It is clear that property prediction models are developed with certain accuracy and uncertainties, which might affect the effectiveness in estimating the product property. From the property prediction models identified in Table 3, the coefficient of determination (R2) of the models ranges from the reported value of 0.73 for LD50 to 0.9999 for HHV, with R2 for most of the models above 0.95; the average relative error (ARE) of the models ranges from the published value of 16.40 for LD50 to 0.4855 for HHV, with ARE for most of the models below 5.00. Ng et al. [60] presented a systematic methodology for chemical product design by considering product property and accuracy of property prediction models. From the presented work, it was found that although the model accuracy affects the identification of the optimum chemical product, the optimum chemical product identified without considering the model accuracy is still among the best few products identified by considering the model accuracy. Hence, the model accuracy will not invalidate the identified results. In this work, the selected property prediction models as shown in Table 3 are the available models for each property category with the highest accuracy. It is noted that the property prediction model with higher accuracy can always be utilised in this developed approach. The best five solutions will be generated, as discussed in the following paragraphs.
3.1.2. Selection of Molecular Building Blocks
With the identification of property prediction models, appropriate molecular building blocks are selected for the design problem. As the goal of the design problem is to design biobased fuel, alkanes and alcohol are set as the target homologous series. Thus, only carbon (C), hydrogen (H), and oxygen (O) atoms are considered for the product design problem. In this case study, only molecular groups with single bond are considered. The considered molecular groups can be classified into the alkane first-order group with one carbon atom and zero to three hydrogen atoms (C-) (CH-) (CH2-) (CH3-) and the alcohol first-order group (-OH).
3.1.3. Formulation of Mathematical Model for Molecular Design Problem
The molecular design problem is then written as a mixed-integer linear programming (MILP) model. Although the objective of this design problem is to design a green biofuel, a single-objective function that targets only one green property is unlikely to guarantee that the designed product is the optimal green product. Additionally, other properties are equally important and should be considered in achieving the overall design goal that fulfils both green and customer needs. Hence, this green chemical product design problem is solved as a multi-objective optimisation problem. This is performed by addressing multiple target properties simultaneously during the product design stage. In this case study, Hv, η, ρ, and HHV are optimised simultaneously together with structural constraints to obtain solutions in terms of molecular groups. The properties considered for simultaneous optimisation cover the categories of both green and performance properties. Under the category of green product properties, Hv is considered; under the category of performance product properties, η and ρ are considered for their importance in reducing production operating costs, while HHV is considered for its importance in ensuring the quality of the biofuel product in terms of energy content.
To optimise multiple properties without any preference, the focus on optimisation will be the weakest property among all properties to be optimised. Hence, a degree of satisfaction λ is introduced to trade off the multiple properties. The overall objective of the proposed model is determined by maximising the least-satisfied property. This is to optimise the least-satisfied property among targeted properties and hence minimise the difference between each individual property. This approach fits multi-objective chemical product design problems where expert knowledge in assigning the weighing factor is unavailable, and each targeted property to be optimised is given equal importance. It makes sure that no targeted property is over-improved while neglecting the importance of other targeted properties. The objective function for this proposed model is shown in Equation (8). Additionally, the aforementioned properties to be optimised are written as linear membership functions as shown by Equations (9)–(12). Hv, ρ, and HHV are to be maximised while η is to be minimised in this case study.
subject to,
3.1.4. Result and Discussion on Molecular Design Problem
Optimum solutions to the product design problem are obtained in terms of combination of molecular groups. Additional feasible product solutions are obtained by utilising integer cuts. The best five solutions to the number of molecular group occurrences are shown in Table 4.
From Table 4, it can be seen that the best five optimal biofuel products fall within the nonane, decane, and undecane alkanes groups. In the best five solutions, there is no alcohol (-OH) molecular group considered as part of the product. This indicates that the alcohol group product does not meet the requirement of defined green and customer needs, and hence products with the alcohol group are not suitable for this design problem. With the list of molecular groups obtained from solving the developed approach, the enumeration of the molecular structure of all five solutions as shown in Table 4 is performed. Molecular groups can be enumerated into feasible molecules that represent the designed product. The molecular structures and names of the biofuels identified from the solutions are shown in Table 5, while a list of product specifications for the best five solutions is summarised in Table 6.
From Table 6, all substituents’ properties of the solutions fall within the target product range that represents green manufacturing and customer needs based on Table 3. This indicates that the design problem achieves green definitions while fulfilling other needs. Most importantly, the developed approach is able to design a bio-based fuel with optimised green manufacturing needs in conjunction with customer needs.
As discussed previously, optimal solutions cannot be guaranteed with single property optimisation as there is a chance that other targeted properties can be further improved to produce a better solution. Therefore, the multi-optimisation approach is applied in this product design problem. The comparison of degrees of satisfaction between generated product solutions is shown in Table 7.
In Table 7, the solutions obtained are ranked according to decreasing least-satisfied property. Therefore, the solution generated will be capable of replacing the currently available fuel as long as other important properties to be optimised are not overlooked. The optimal product to be produced in this design problem is identified as 3,4,5-trimethyloctane, which has the highest least-satisfied degree of satisfaction. 3,4,5-trimethyloctane is an alkane group product with a carbon number of 11, as shown in Table 5.
From Table 7, it is clear that solution A is the best biofuel product as the λ in solution A is the highest among other generated solutions. λ then decreases from solution B to E. As λ shows how much the product satisfies the criteria of property, it can be seen that λHHV appears to be the lowest in three solutions among the five generated solutions. In order to comply with green manufacturing and customer needs in biofuel products, HHV, which represents the energy content in the fuel, acts as a bottleneck in this product design problem. However, the least-satisfied property is not always the same property for all five generated solutions. For example, the least-satisfied property for solution A is ρ with λρ of 0.5517, while the least-satisfied property for solution B is η with λη of 0.5375. This shows that the target properties were treated without any bias. The developed approach did not target only one property but identified the relative importance of each property to be optimised. Provided that the degree of satisfaction is maximised for the least-satisfied property, all five solutions can be replaced and produced as biofuel that fulfils green manufacturing and customer needs.
3.2. Selection of Optimal Conversion Pathway
After the identification of the optimal biofuel product in the first stage of the two-stage optimisation approach, the optimal green manufacturing conversion pathway to convert biomass into a designed biofuel product can be determined in the second stage of the methodology. In this case study, the empty fruit bunch (EFB), which is a palm-based biomass, is used as the feedstock in the integrated biorefinery process. The EFB composition is taken from Sukiran [61], as shown in Table 8. The use of EFB is part of the fulfilment of green manufacturing needs mentioned in Table 1 as non-fossil-fuel-based natural resources are utilised as feedstock and non-renewable resources are conserved.
3.2.1. Identification of Performance Parameters for Green Manufacturing
In the first stage, the optimal product is identified as 3,4,5-trimethyloctane, which represents alkane with carbon number of 11. Hence, undecane is set to be the end product of the integrated biorefinery process. As the goal of this case study is to design a green product with a green manufacturing process, the designed conversion pathway should fulfil green manufacturing definitions without neglecting the economic performance of the project. A process that fulfils green manufacturing definitions should have a minimal negative impact on the environment, waste production, and energy consumption. In this case study, the green manufacturing process is quantified in terms of total environmental burden (EBTotal), yield of designed product undecane (C11 Yield), and total energy consumption (HTotal) during the production. All the parameters considered are based on the developed green manufacturing definitions as explained in Table 2. EBTotal is considered for the green manufacturing definition of pollution prevention; C11 yield is calculated for the green manufacturing definition of minimisation of waste and material consumption while HTotal is assessed for the green manufacturing definition of minimisation of energy requirement. Additionally, the economic feasibility of the process is evaluated by assessing the gross profit (GPTotal) of the integrated biorefinery configuration.
The parameter considered in the green manufacturing process to minimise the negative impact on environment is by evaluation of the environmental burden. The change in environmental impact within a pathway can be determined using EBTotal as proposed by Andiappan et al. [62]. The change in environmental impact is measured between feedstock and product, assessing if the raw material is converted into a product that is less harmful or more harmful to the environment. EBTotal of an integrated biorefinery is determined using the environmental burden score Eijk. Eijk for a particular pathway j is calculated by the product of difference in potency factor (PF) and component to product ratio (α) within the reaction pathway, as shown in Equation (13). As every substance will contribute differently to the environmental burden, each substance has a different number of PF, which can be obtained through reference.
With the environmental burden score, EBTotal can be calculated via Equation (14). refers to the flowrate of feedstock i, i is then to be converted to intermediates k via pathway j at a given conversion rate . Intermediates k with flowrate is then converted further to final product k′ with a conversion rate of .
The next green manufacturing parameter considered for the conversion pathway selection is yield of undecane (C11 Yield). The conversion rate and selectivity of pathways to convert biomass into the designed biofuel product are obtained through references. With the conversion rate, the amount of C11 desired product to be produced can be measured. As the goal of the design problem is to fulfil the green manufacturing definition, the selected conversion pathway should give a higher amount of the desired product. With a fixed amount of input feedstock, this indirectly indicates a reduction in waste generated. Another two indicators are measured in this design problem to ensure that the selected pathways satisfy green manufacturing needs in reducing waste. The first indicator is the percent atom economy, which measures the ratio of the amount of raw material and the amount of useful products generated, as shown in Equation (15). A higher percentage of the atom economy implies a lower amount of undesired waste produced.
The second indicator is e-factor, which is used to estimate the resource intensity for the selected process and waste generated. E-factor can be calculated via Equation (16). In contrast to atom economy, a lower e-factor indicates a lower amount of waste produced. Both atom economy and e-factor are able to quantify a green manufacturing definition of minimisation of waste.
To satisfy a green manufacturing definition of the minimisation of the process energy requirement, heat of reaction (Hijk) is used to evaluate the energy consumption for the conversion pathway. Hijk for pathway j is determined by utilising the heat of formation Hf of each substance, as shown in Equation (17). n refers to the stoichiometry of the reaction pathway.
With the calculated heat of reaction, HTotal for selected pathways can be determined using the summation of reaction heat in each pathway, as presented in Equation (18).
In addition, it is important to reduce energy intensity when designing a green manufacturing process. Hence, specific energy consumption (SEC), as shown in Equation (19), is measured to determine the energy required per unit mass of products produced. Lower SEC indicates a lower energy requirement to produce the product.
3.2.2. Construction of Superstructure Formulation of Mathematical Model
A list of available conversion pathways to produce alkane from biomass are compiled, as shown in Table S1 under Supplementary Material. Further, the information needed to measure and assess the green manufacturing parameters for all pathways is collected, as shown in Tables S2–S4. Based on the available conversion pathway, a superstructure is then developed, as presented in Figure 3. It should be noted that the superstructure can be modified according to different product requirements.
In this case study, a total of four scenarios with different production objectives and one scenario with multi-objective are considered in synthesising the integrated biorefinery. This is to demonstrate the ability of the proposed two-stage optimisation approach in determining the optimum pathway while accommodating different production objectives.
- Design for maximum economic performance, Max GPTotal
- Design for maximum product yield, Max C11 Yield
- Design for minimum environmental burden, Min EBTotal
- Design for minimum energy consumption, Min HTotal
- Design for optimal conversion pathway with multi-objective optimisation approach
By utilising the superstructural mathematical optimisation approach, a different conversion pathway can be determined based on different design objectives. In this design problem, 50,000 tonnes per year of EFB are set as the basis of available feedstock.
3.2.3. Results and Discussion of Selection of Optimal Conversion Pathway
With the performance parameters for green manufacturing identified, each scenario is solved by considering different objective functions. The results for each scenario are discussed in the following subsections. This is followed by a detailed comparison, and discussion of all five scenarios is conducted.
Scenario 1: Design for Maximum Economic Performance
This scenario is solved by maximising the gross profit for an integrated biorefinery configuration. The objective function for this scenario is shown in Equation (20). Market prices of product, by-products, and biomass feedstock as well as capital and operating cost for each pathway are summarised in Tables S2 and S3, respectively.
Based on the optimisation result obtained, when economic performance is maximized, the gross profit is identified to be USD 23.40 million per annum with an annual production of 1181.82 tonnes/yr. As the main product for this design problem is alkane C11, the production of other alkane and alcohol is sold as by-products. The optimal conversion pathway determined by this objective function is presented as synthesised integrated biorefinery, as shown in Figure S1 under Supplementary Material. In this scenario, the designed product is produced through ammonia explosion, organosoly separation, dehydration of sugars, and then hydrogenation of furfural and THFA 1. The main product is further produced by dehydration of alcohol and then fractional distillation of the desired separation.
Scenario 2: Design for Maximum Product Yield
The product to be produced is alkane C11, which is represented by the optimum product determined in the first stage of the design problem, 3,4,5-trimethyloctane. The integrated biorefinery is synthesised by maximising the production of C11 in the optimisation model using Equation (21).
By maximising the desired product yield, the maximum possible mass of the product can be produced. Hence, the green manufacturing need to minimise the waste generated from the process can be achieved. Based on the obtained result, the maximum yield of alkane C11 that can be produced in the integrated biorefinery is 1839.81 tonnes/yr with a gross profit of USD 13.20 million per annum. The optimal conversion pathway in this scenario is identified and shown in Figure S2. Most of the conversion pathways selected in Scenario 2 are similar to Scenario 1, which are mostly biochemical pathways. However, instead of dehydration of sugar, sugar is converted to alcohol via the yeast fermentation process. Alkane C11 is then refined and separated from other by-products through the fractional distillation process. The separation process performance is considered with identifying product yield.
Scenario 3: Design for Minimum Environmental Burden
In this scenario, the environmental burden in terms of global warming potential is minimised. With this objective, as shown in Equation (22), conversion pathways that help in reducing global warming potential can be determined. The unnecessary impact of product manufacturing on the environment can be reduced through minimisation of the environmental burden. This can be illustrated by reaction pathways that convert chemical reactants with high environmental impact into products with lower environmental impact.
Based on the optimisation result generated, minimum EBTotal achieved is 47.5 thousand tonnes of CO2 equivalent per annum. This is insufficient to prove that the identified pathways are environmentally friendly. Ideally, it is preferred to have EBTotal of negative value. A positive value of EBTotal indicates that production pathways are contributing a negative impact on the environment while a negative value of EBTotal shows that the identified pathways are reducing the impact on the environment. In this case study, this situation cannot be avoided when the final product is fuel. However, the use of biofuel is more environmentally friendly than using fossil-based fuel. Although the identified pathways are not totally environmentally friendly, the synthesised integrated biorefinery from this scenario has the least impact caused to the environment. Aside from that, gross profit and product yield of C11 obtained are USD 1.26 million per annum and 805.58 tonnes/yr, respectively, when EBTotal is minimised. The optimal conversion pathway selected in this scenario is the same as Scenario 1, as shown in Figure S1.
Scenario 4: Design for Minimum Energy Consumption
The energy consumption of the pathways for integrated biorefinery is determined by using the summation of reaction heat, HTotal. In order to achieve green manufacturing needs, the energy requirement of the integrated biorefinery needs to be minimised to avoid the unnecessary use of energy. In this scenario, the integrated biorefinery is synthesised by minimising HTotal using the objective function, as shown in Equation (23).
As the feedstock EFB biomass consists of different compositions of cellulose, hemicellulose, and lignin, the heat of formation for the feedstock is not available. Thus, the heat of formation of the biomass feedstock is estimated by using the heat of combustion of each composition. Based on the optimisation result, minimum HTotal obtained from the optimal pathway is −7.10 × 10¹¹ million J/y. The negative value of reaction heat indicates that excess heat can be provided by the integrated biorefinery. Hence, the heating energy required when producing alkane C11 in this integrated biorefinery pathway can be reduced. For the minimisation of HTotal, gross profit and product yield of C11 acquired are USD 23.40 million per annum and 1242.00 tonnes/yr, respectively. The selected conversion pathway is the same as Scenarios 1 and 3, as shown in Figure S1.
Scenario 5: Design for Optimal Conversion Pathway with the Multi-Objective Optimisation Approach
As mentioned previously, the designed conversion pathway should accommodate green manufacturing needs without neglecting the economic performance. Thus, the multi-objective approach is applied to synthesise the integrated biorefinery with maximum economic performance, maximum production yield, minimum environmental burden, and minimum energy consumption simultaneously. Similar to the product design problem, the fuzzy optimisation approach with max–min aggregation approach is applied in this process design problem. Thus, the degree of satisfaction λ is also introduced to trade-off between multiple objectives.
The multi-objective approach is adapted in process design by introducing λ for economic performance, production yield, environmental burden, and energy consumption objectives. However, the upper and lower limits for each objective are required in order to formulate the equation in maximising λ, as shown in Equation (8). Therefore, the upper and lower limits are obtained from Scenarios 1 to 4 by applying both maximisation and minimisation to the objective function of each scenario. For example, GPTotal in Scenario 1 is maximised to obtain the upper limit of this objective, while the lower limit of GPTotal is identified through minimising GPTotal in the same scenario. However, the negative value of USD −1.62 × 10⁷ is found when GPTotal is minimised. This indicates that the process will not gain any profit even when the product is produced. To have a reasonable range for upper and lower limits, the lower limit of GPTotal is taken as USD 1.17 × 10⁷, which is 50% of the maximum GPTotal of USD 2.34 × 10⁷. In addition, maximum HTotal is found to be 1.16 × 10⁹ J/yr, which indicates that heat is required to be provide to the system. The optimal case for energy consumption is that a portion of heat can be provided in the system itself to reduce energy intensity. Thus, the upper limit of HTotal is taken as −3.55 × 10¹¹ J/yr, which is 50% of the minimum HTotal of −7.10 × 10¹¹ J/yr. Upper and lower limits required for the multi-objective optimisation approach are summarised as shown in Table 9.
With the identified upper and lower limits of each target objective to be optimised, multi-objective optimisation can be performed. The objective function for this approach is to maximise the least-satisfied property λ, as shown in Equation (24). The targeted objectives to be optimised are written as Equations (25)–(28). GPTotal and C11 yield are to be maximised while EBTotal and HTotal are to be minimised.
subject to,
Based on the obtained results in this scenario, GPTotal is identified to be USD 2.25 × 10⁷ million per annum with an annual production of 1242.00 tonnes/yr of undecane. EBTotal and HTotal obtained are 7.51 × 10⁴ tonnes of CO2 equivalent per annum and −5.05 × 10¹¹ J/y. It can be seen that all parameters obtained in this scenario fall within the targeted range, as shown in Table 9. This indicates that the process design problem achieved an optimal conversion pathway in terms of green manufacturing definitions and economic performance. The optimal conversion pathway in this scenario is identified and shown in Figure S3. The conversion pathways selected in Scenario 5 are mostly similar to Scenarios 1, 3, and 4, with an additional pathway of yeast fermentation to convert sugar into alcohol. The degree of satisfaction λ of each parameter is shown in Table 10.
From Table 10, it can be noticed that there are two least-satisfied parameters λYield and λH with an identical value of 0.422. This shows that both least-satisfied parameters are optimised. λGP and λEB show very high satisfaction with λ of 0.920 and 0.982, respectively. As λGP is the parameter to be maximised, 0.920 of λ indicates that GPTotal approaches its upper limit, while for λEB, 0.982 of λ implies that EBTotal approaches its lower limit as it is a parameter to be minimised. Table 11 below shows the summary of results obtained from Scenarios 1 to 5.
Comparison and Analysis of Different Scenarios
From Table 11, it can be observed that all scenarios have a positive value of EBTotal, which indicates the contribution of all selected conversion pathway toward generating a negative impact on the environment. In Scenario 1, the selected conversion pathways offer the most promising economic potential even though the process is not environmentally friendly. Moreover, it is observed that values from all parameters in Scenario 1 are the same as Scenario 4, which proves that when GPTotal is maximised, HTotal will be at its minimum. The energy required for conversion pathway for Scenarios 1 and 4 is the lowest where heat can be provided by the system itself. Hence, operating cost is lower, which indirectly brings a higher amount of GPTotal. Although the conversion pathway in Scenarios 1 and 4 is not the most environmentally friendly process, the selected pathway has achieved the green manufacturing definition of minimisation of the energy requirement.
The highest production of the desired product is determined in Scenario 2. When the yield of C11 is at a maximum, EBTotal is highest among all scenarios, which indicates that the conversion pathways bring the highest negative impact on the environment. When the production of the desired product is maximised, by-product production is increased as well. Although the desired product is at highest production, GPTotal is not the highest. This can be explained by the fact that, for this scenario, high operating costs and capital costs may be required for maximum C11 production. This can be further justified by the fact that, among all scenarios, Scenario 2 is the only scenario in which a positive value of HTotal is obtained. In addition, it can be observed that the atom economy for Scenario 2 is the highest among all scenarios. This signifies that the amount of material converted to the desired product is the highest for Scenario 2. Furthermore, the e-factor for Scenario 2 is the lowest among all scenarios, which shows that the mass of amount waste produced per unit mass of product is the lowest. Through the interpretation and analysis of these indicators, although the selected pathway is the least environmentally friendly among all scenarios, it is clear that the conversion pathway selected for Scenario 2 complies with the green manufacturing definition of minimisation of waste produced.
In Scenario 3, the chosen conversion pathway offers the lowest EBTotal. However, both C11 production and GPTotal are the lowest among all scenarios when the process is designed to have the lowest negative impact on the environment. This proves that to have a highly environmentally friendly process, the production of the designed product needs to be reduced, while additional expenditure is required. This explains the current dilemma faced by most of the manufacturing industries that the environmentally friendly process normally comes with a reduction in the gross profit gained. Although the designed product fulfils the green manufacturing needs of the minimisation of the negative impact on the environment, this might not be favoured by the stakeholders of the integrated biorefinery if their only interest is financial gain. Hence, a compromised solution is needed, which is shown in Scenario 5.
In Scenario 5, it is observed that the optimised solution, by considering all target objectives, has each individual objective fall within the upper and lower limits. This represents a trade-off between all individual objectives from Scenarios 1 to 4. While none of the individual objectives are the best if compared to other scenarios, the selected conversion pathway for Scenario 5 is the optimum if all objectives are seen as important. None of the objectives are over-improved while neglecting the other objectives. For integrated biorefinery stakeholders who are concerned with the negative impact that might be caused by the conversion pathways but at the same time not willing to sacrifice too much of their financial interest, Scenario 5 is the balanced solution that is suitable to them.
4. Conclusions
In this work, clear and consistent generalised definitions and quantification of green manufacturing are developed for product and process design. A two-stage optimisation approach is presented to design a green chemical product and integrated biorefinery process that meets both green manufacturing and customer needs. A case study in designing biobased fuel that incorporates green manufacturing with customer needs is solved to demonstrate the developed methodology. In the first stage, product properties are identified to quantify green products based on the developed green manufacturing definitions. By incorporating the multi-objective optimisation approach into the methodology, the optimal green chemical product design can be obtained where all properties of interest are optimised simultaneously without any bias. In the second stage, conversion pathways are evaluated based on the targeted parameters considered from developed green manufacturing definitions of process performance. Five different scenarios are solved to represent different design considerations and philosophies of the integrated biorefinery stakeholders. While it has proven challenging to target the highest gross profit while aiming for a minimum negative impact on the environment as these two objectives are contradicting given the technological advancement today, a compromised solution can be obtained by solving the problem as a multi-objective optimisation problem. In addition, there might be situations where the integrated biorefinery is located in an area with a limited supply of resources and utilities. In this case, it is preferable to design conversion pathways that are able to provide excess heat that can be used as heat/power generation for an auxiliary system. In short, the proposed methodology is able to determine green conversion pathways that accommodate different production objectives on green manufacturing and customer needs.
As society progresses and advances, the definition of green manufacturing will be different. For future work, in order to enhance the comprehensiveness and accuracy of green definitions, more properties and parameters that quantify both green products and process can be considered. In addition, conversion pathways that convert biomass into a final product considered in the superstructure can be updated by including newly developed biomass conversion technologies when determining the optimal pathways. Furthermore, the completeness of the methodology of designing green processes can be further improved by considering the utilities required for the conversion pathway based on the desired operating conditions. For instance, the process will be highly energy-intensive when a vacuum or very high pressure is required for the process. Lastly, to further reduce the gap between outcomes from a developed approach and the actual process, any additional feedstock and side reactions required can be taken into consideration.
Supplementary Materials
The following are available online at https://www.mdpi.com/article/10.3390/pr9091569/s1, Table S1: List of Conversion Pathway to produce Alkane from Biomass, Table S2: Price List for Product and Feedstock, Table S3: List of Capital and Operating Cost for Conversion Pathways, Table S4: List of Component with Heat of Formation and Potency Factor, Figure S1: Conversion Pathway for Maximum Economic Performance, Minimum Environmental Burden and Minimum Energy Consumption, Figure S2: Conversion Pathway for Maximum Product C11 Yield, Figure S3: Conversion Pathway for Multi-objective Optimisation.
Author Contributions
Conceptualization, J.W.Y.L. and L.Y.N.; Methodology, J.W.Y.L. and L.Y.N.; Software, L.Y.N.; Validation, J.W.Y.L. and L.Y.N.; Formal analysis, J.W.Y.L.; Investigation, J.W.Y.L., L.Y.N. and V.A.; Resources, L.Y.N.; Data curation, J.W.Y.L.; Writing—original draft, J.W.Y.L.; Writing—review & editing, J.W.Y.L., L.Y.N., V.A., N.G.C. and D.K.S.N. Visualization, J.W.Y.L.; Supervision, L.Y.N., V.A., N.G.C. and D.K.S.N.; Project administration, L.Y.N. All authors have read and agreed to the published version of the manuscript.
Funding
This research received no external funding.
Institutional Review Board Statement
Not applicable.
Informed Consent Statement
Not applicable.
Conflicts of Interest
The authors declare no conflict of interest.
References
- Paul, I.D.; Bhole, G.P.; Chaudhari, J.R. A Review on Green Manufacturing: It’s Important, Methodology and its Application. Procedia Mater. Sci. 2014, 6, 1644–1649. [Google Scholar] [CrossRef] [Green Version]
- Munthe, J.; Brorström-Lundén, E.; Rahmberg, M.; Posthuma, L.; Altenburger, R.; Brack, W.; Bunke, D.; Engelen, G.; Gawlik, B.M.; van Gils, J.; et al. An Expanded Conceptual Framework for Solution-Focused Management of Chemical Pollution in European Waters. Environ. Sci. Eur. 2017, 29, 1–16. [Google Scholar] [CrossRef] [PubMed] [Green Version]
- Balaman, Ş.Y. Decision-Making for Biomass-Based Production Chains; Academic Press: London, UK, 2019; pp. 25–54. [Google Scholar]
- United States Energy Information Administration (EIA). Annual Energy Outlook 2019; U.S. Energy Information Administration: Washington, DC, USA, 2019.
- Ivanković, A. Review of 12 Principles of Green Chemistry in Practice. Int. J. Sustain. Green Energy 2017, 6, 39–48. [Google Scholar] [CrossRef] [Green Version]
- Malaysia Department of Environment (DOE). Environmental Quality (Clean Air) Regulations 2014; Malaysia Department of Environment: Putrajaya, Malaysia, 2014. [Google Scholar]
- European Commission. Industrial Emissions Directive. Available online: https://ec.europa.eu/environment/industry/stationary/ied/legislation.htm (accessed on 29 July 2021).
- Morais, A.R.C.; Bogel-lukasik, R. Green Chemistry and the Biorefinery Concept. Sustain. Chem. Process 2013, 1, 1–3. [Google Scholar] [CrossRef] [Green Version]
- Abdul-Rashid, S.H. The Impact of Sustainable Manufacturing Practices on Sustainability Performance Empirical Evidence from Malaysia. Int. J. Oper. Prod. Man. 2017, 37, 182–204. [Google Scholar] [CrossRef]
- Moldavska, A.; Welo, T. The Concept of Sustainable Manufacturing and Its Definitions: A Content-analysis Based Literature Review. J. Clean. Prod. 2017, 166, 744–755. [Google Scholar] [CrossRef]
- Mohanty, R.P.; Deshmukh, S.G. Managing green productivity: A Case Study. Work. Study 1999, 48, 165–169. [Google Scholar] [CrossRef]
- Vallero, D.A. Hazardous Wastes. Hazardous Waste. In Waste: A Handbook for Management, 2nd ed.; Letcher, T.M., Vallero, D., Eds.; Academic Press: London, UK, 2011; pp. 585–630. [Google Scholar]
- Ramachandran, P.A.; Shonnard, D.; Hesketh, R.; Fichana, D.; Stewart Slater, C.; Lindner, A.; Nguyen, N.; Engler, R. Green Engineering: Integration of Green Chemistry, Pollution Prevention, and Risk-Based Considerations. In Handbook of Industrial Chemistry and Biotechnology; Kent, J., Bommaraju, T., Barnicki, S., Eds.; Springer: Cham, Switzerland, 2012; pp. 1921–1994. [Google Scholar]
- Snir, E.M. Liability as a Catalyst for Product Stewardship. Prod. Oper. Manag. 2009, 10, 190–206. [Google Scholar] [CrossRef]
- Nukman, Y.; Farooqi, A.; Al-Sultan, O.; Alnasser, A.R.A.; Bhuiyan, M.S.H. A Strategic Development of Green Manufacturing Index (GMI) Topology Concerning the Environmental Impacts. Procedia Eng. 2017, 184, 370–380. [Google Scholar] [CrossRef]
- Ferguson, M.E.; Toktay, L.B. The Effect of Competition on Recovery Strategies. Prod. Oper. Manag. 2006, 15, 3, 351–368. [Google Scholar] [CrossRef] [Green Version]
- Wong, C.W.Y.; Lai, K.; Shang, K.; Lu, C.; Leung, T.K.P. Green Operations and the Moderating Role of Environmental Management Capability of Suppliers on Manufacturing Firm performance. Int. J. Prod. Econ. 2012, 140, 283–294. [Google Scholar] [CrossRef]
- Deif, A.M. A System Model for Green Manufacturing. J. Clean. Prod. 2011, 19, 1553–1559. [Google Scholar] [CrossRef] [Green Version]
- Maruthi, G.D.; Rashmi, R. Green Manufacturing: It’s Tools and Techniques that can be Implemented in Manufacturing Sectors. Mater. Today Proc. 2015, 2, 3350–3355. [Google Scholar] [CrossRef]
- Li, K.; Lin, B. Impact of Energy Conservation Policies on the Green Productivity in China’s Manufacturing Sector: Evidence from a three-stage DEA model. Appl. Energy 2016, 168, 351–363. [Google Scholar] [CrossRef]
- Wang, K.; Lu, B.; Wei, Y. China’s regional energy and environmental efficiency: A Range-Adjusted Measure based analysis. Appl. Energy 2013, 112, 1403–1415. [Google Scholar] [CrossRef]
- Meng, Y.; Yang, Y.; Chung, H.; Lee, P.; Shao, C. Enhancing Sustainability and Energy Efficiency in Smart Factories: A Review. Sustainability 2018, 10, 4779. [Google Scholar] [CrossRef] [Green Version]
- Pakkanen, J.; Huhtala, P.; Juuti, T.; Lehtonen, T. Achieving Benefits with Design Reuse in Manufacturing Industry. Procedia CIRP 2016, 50, 8–13. [Google Scholar] [CrossRef] [Green Version]
- van Berkel, R. Quantifying Sustainability Benefits of Industrial Symbioses. J. Ind. Ecol. 2010, 14, 371–373. [Google Scholar] [CrossRef]
- Bauer, T.; Brissaud, D.; Zwolinski, P. Design for High Added-Value End-of-Life Strategies. In Sustainable Manufacturing. Sustainable Production, Life Cycle Engineering and Management; Stark, R., Seliger, G., Bonvoisin, J., Eds.; Springer: Cham, Switzerland, 2017; pp. 113–128. [Google Scholar]
- Zhang, X.; Ming, X.; Liu, Z.; Qu, Y.; Yin, D. General Reference Model and Overall Frameworks for Green Manufacturing. J. Clean. Prod. 2019, 237, 117757. [Google Scholar] [CrossRef]
- De Wilde, B.; Mortier, N.; Verstichel, S.; Briassoulis, D.; Babou, M.; Mistriotis, A.; Hiskakis, M. Report on Current Relevant Biodegradation and Ecotoxicity Standards. Knowl. Based Bio-Based Prod. Pre-Stand. 2013, 1, 14–20. [Google Scholar]
- Hostrup, M.; Harper, P.M.; Gani, R. Design of environmentally benign processes: Integration of solvent design and separation process synthesis. Comput. Chem. Eng. 1999, 23, 1395–1414. [Google Scholar] [CrossRef]
- Eden, M.R.; Jørgensen, S.B.; Gani, R.; El-Halwagi, M.M. A novel framework for simultaneous separation process and product design. Chem. Eng. Process Process Intensif. 2004, 43, 595–608. [Google Scholar] [CrossRef]
- Papadopoulos, A.I.; Linke, P. Efficient integration of optimal solvent and process design using molecular clustering. Chem. Eng. Sci. 2006, 61, 6316–6336. [Google Scholar] [CrossRef]
- Hechinger, M.; Voll, A.; Marquardt, W. Towards an integrated design of biofuels and their production pathways. Comput. Chem. Eng. 2010, 34, 12, 1909–1918. [Google Scholar] [CrossRef]
- Ng, L.Y.; Andiappan, V.; Chemmangattuvalappil, N.G.; Ng, D.K.S. Novel Methodology for the Synthesis of Optimal Biochemicals in Integrated Biorefineries via Inverse Design Techniques. Ind. Eng. Chem. Res. 2015, 54, 5722–5735. [Google Scholar] [CrossRef]
- Ng, L.Y.; Andiappan, V.; Chemmangattuvalappil, N.G.; Ng, D.K.S. A systematic methodology for optimal mixture design in an integrated biorefinery. Comput. Chem. Eng. 2015, 81, 288–309. [Google Scholar] [CrossRef]
- Meramo-Hurtado, S.-I.; González-Delgado, Á.-D. Biorefinery synthesis and design using sustainability parameters and hierarchical/3D multi-objective optimization. J. Clean Prod. 2019, 240, 118134. [Google Scholar] [CrossRef]
- Lai, Y.Y.; Yik, K.C.H.; Hau, H.P.; Chow, C.P.; Chemmangattuvalappil, N.G.; Ng, L.Y. Enterprise Decision-making Framework for Chemical Product Design in Integrated Biorefineries. Process Integr. Optim. Sustain. 2019, 3, 25–42. [Google Scholar] [CrossRef]
- Restrepo-Flórez, J.M.; Maravelias, C.T. Advanced fuels from ethanol—A superstructure optimization approach. Energy Environ. Sci. 2021, 14, 493–506. [Google Scholar] [CrossRef]
- Tey, T.O.; Chen, S.; Cheong, Z.X.; Choong, A.S.X.; Ng, L.Y.; Chemmangattuvalappil, N.G. Synthesis of a sustainable integrated biorefinery to product value-added chemicals from palm-based biomass via mathematical optimization. Sustain. Prod. Consum. 2021, 26, 288–315. [Google Scholar] [CrossRef]
- Sangster, J. Octanol-Water Partition Coefficients of Simple Organic Compounds. J. Phys. Chem. Ref. Data 1989, 18, 1111–1227. [Google Scholar] [CrossRef]
- Albahri, T.A. Flammability characteristics of pure hydrocarbons. Chem. Eng. Sci. 2003, 58, 3629–3641. [Google Scholar] [CrossRef]
- Yunus, N.A.B. Systematic Methodology for Design of Tailor-Made Blended Products: Fuels and Other Blended Products. Ph.D. Thesis, Technical University of Denmark, Department of Chemical and Biochemical Engineering, Lyngby, Denmark, 2014. [Google Scholar]
- Schulze, P. Measure of Environmental Performance and Ecosystem Condition; National Academy of Engineering: Washington, DC, USA, 1999. [Google Scholar]
- Hall, L.H.; Kier, L.B.; Phipps, G. Structure-activity relationship studies on the toxicities of benzene derivatives: I. An additivity model. Environ. Chem. 1984, 3, 355–365. [Google Scholar] [CrossRef]
- Singh, A.; Lou, H.H.; Yaws, C.L.; Hopper, J.R.; Pike, R.W. Environmental impact assessment of different design schemes of an industrial ecosystem. Resour. Conserv. Recy. 2007, 51, 294–313. [Google Scholar] [CrossRef]
- Anastas, P.T.; Warner, J.C. Green Chemistry: Theory and Practice; Oxford University Press: New York, NY, USA, 1998. [Google Scholar]
- Wang, W.; Lü, J.; Zhang, L.; Li, Z. Real atom economy and its application for evaluation the green degree of a process. Front. Chem. Sci. Eng. 2011, 5, 349–354. [Google Scholar] [CrossRef]
- Tieves, F.; Tonin, F.; Fernández-Fueyo, E.; Robbins, J.M.; Bommarius, B.; Bommarius, A.S.; Alcalde, M.; Hollmann, F. Energysing the E-factor: The E+-factor. Tetrahedron 2019, 75, 1311–1314. [Google Scholar] [CrossRef]
- Lawrence, A.; Thollander, P.; Andrei, M.; Karlsson, M. Specific Energy Consumption/Use (SEC) in Energy Management for Improving Energy Efficiency in Industry: Meaning, Usage and Differences. Energies 2019, 12, 247. [Google Scholar] [CrossRef] [Green Version]
- Siegel, R.; Antony, J.; Garza-Reyes, J.A.; Cherrafi, A.; Lameijer, B. Integrated green lean approach and sustainability for SMEs: From literature review to a conceptual framework. J. Clean Prod. 2019, 240, 118205. [Google Scholar] [CrossRef]
- Minnesota Pollution Control Agency (MPCA). General Processes or Units Emission Calculations. Available online: https://www.pca.state.mn.us/air/general-processes-or-units-emission-calculations (accessed on 18 January 2020).
- Safe Work Australia (SWA). Lost Time Injury Frequency Rates (LTIFR). Available online: https://www.safeworkaustralia.gov.au/statistics-and-research/lost-time-injury-frequency-rates-ltifr (accessed on 12 January 2020).
- Corporate Finance Institute (CFI) Education Inc. Depreciation Methods. Available online: https://corporatefinanceinstitute.com/resources/knowledge/accounting/types-depreciation-methods/ (accessed on 26 January 2020).
- Chemmangattuvalappil, N.G.; Solvason, C.C.; Bommareddy, S.; Eden, M.R. Reverse problem formulation approach to molecular design using property operators based on signature descriptors. Comput. Chem. Eng. 2010, 34, 2062–2071. [Google Scholar] [CrossRef]
- Bommareddy, S.; Chemmangattuvalappil, N.G.; Solvason, C.C.; Eden, M.R. Simultaneous solution of process and molecular design problems using an algebraic approach. Comput. Chem. Eng. 2010, 34, 1481–1486. [Google Scholar] [CrossRef]
- American Petroleum Institute (API). Alcohols and Ethers: A Technical Assessment of Their Application as Fuels and Fuel Components; American Petroleum Institute: Washington, DC, USA, 1988. [Google Scholar]
- Hukkerikar, A.S.; Sarup, B.; Ten Kate, A.; Abildskov, J.; Sin, G.; Gani, R. Group-contribution + (GC +) based Estimation of Properties of Pure Components: Improved Property Estimation and Uncertainty Analysis. Fluid Phase Equilib. 2012, 321, 25–43. [Google Scholar] [CrossRef]
- Hukkerikar, A.S.; Kalakul, S.; Sarup, B.; Young, D.M.; Sin, G.; Gani, R. Estimation of Environment-related Properties of Chemicals for Design of Sustainable Processes: Development of Group-contribution+ (GC +) Property Models and Uncertainty Analysis. J. Chem. Inf. Model. 2012, 52, 2823–2839. [Google Scholar] [CrossRef] [Green Version]
- Conte, E.; Martinho, A.; Matos, H.A.; Gani, R. Combined Group-contribution and Atom Connectivity Index-based Methods for Estimation of Surface Tension and Viscosity. Ind. Eng. Chem. Res. 2008, 47, 7940–7954. [Google Scholar] [CrossRef]
- Qiao, Y.; Ma, Y.; Huo, Y.; Ma, P.; Xia, S. A Group Contribution Method to Estimate the Densities of Ionic Liquids. J. Chem. Thermodyn. 2010, 42, 852–855. [Google Scholar] [CrossRef]
- Yunus, N.A.; Gernaey, K.V.; Woodley, J.M.; Gani, R. A Systematic Methodology for Design of Tailor-made Blended Products. Comput. Chem. Eng. 2014, 66, 201–213. [Google Scholar] [CrossRef]
- Ng, L.Y.; Chemmangattuvalappil, N.G.; Ng, D.K.S. Robust chemical product design via fuzzy optimization approach. Comput. Aided Chem. Eng. 2014, 34, 387–392. [Google Scholar]
- Sukiran, M.A. Pyrolysis of Empty oil Palm Fruit Bunches Using the Quartz Fluidized-Fixed Bed Reactor. Master’s Thesis, Universiti Malaya, Department of Chemistry, Kuala Lumpur, Malaysia, 2008. [Google Scholar]
- Andiappan, V.; Ko, A.S.Y.; Lau, V.W.S.; Ng, L.Y.; Ng, R.T.L.; Chemmangattuvalappil, N.G.; Ng, D.K.S. Synthesis of Sustainable Integrated Biorefinery via Reaction Pathway Synthesis: Economic, Incremental Enviromental Burden and Energy Assessment with Multiobjective Optimization. AIChE J. 2015, 61, 132–146. [Google Scholar] [CrossRef]
Figure 1.
Procedure to incorporate green manufacturing into product and process design.
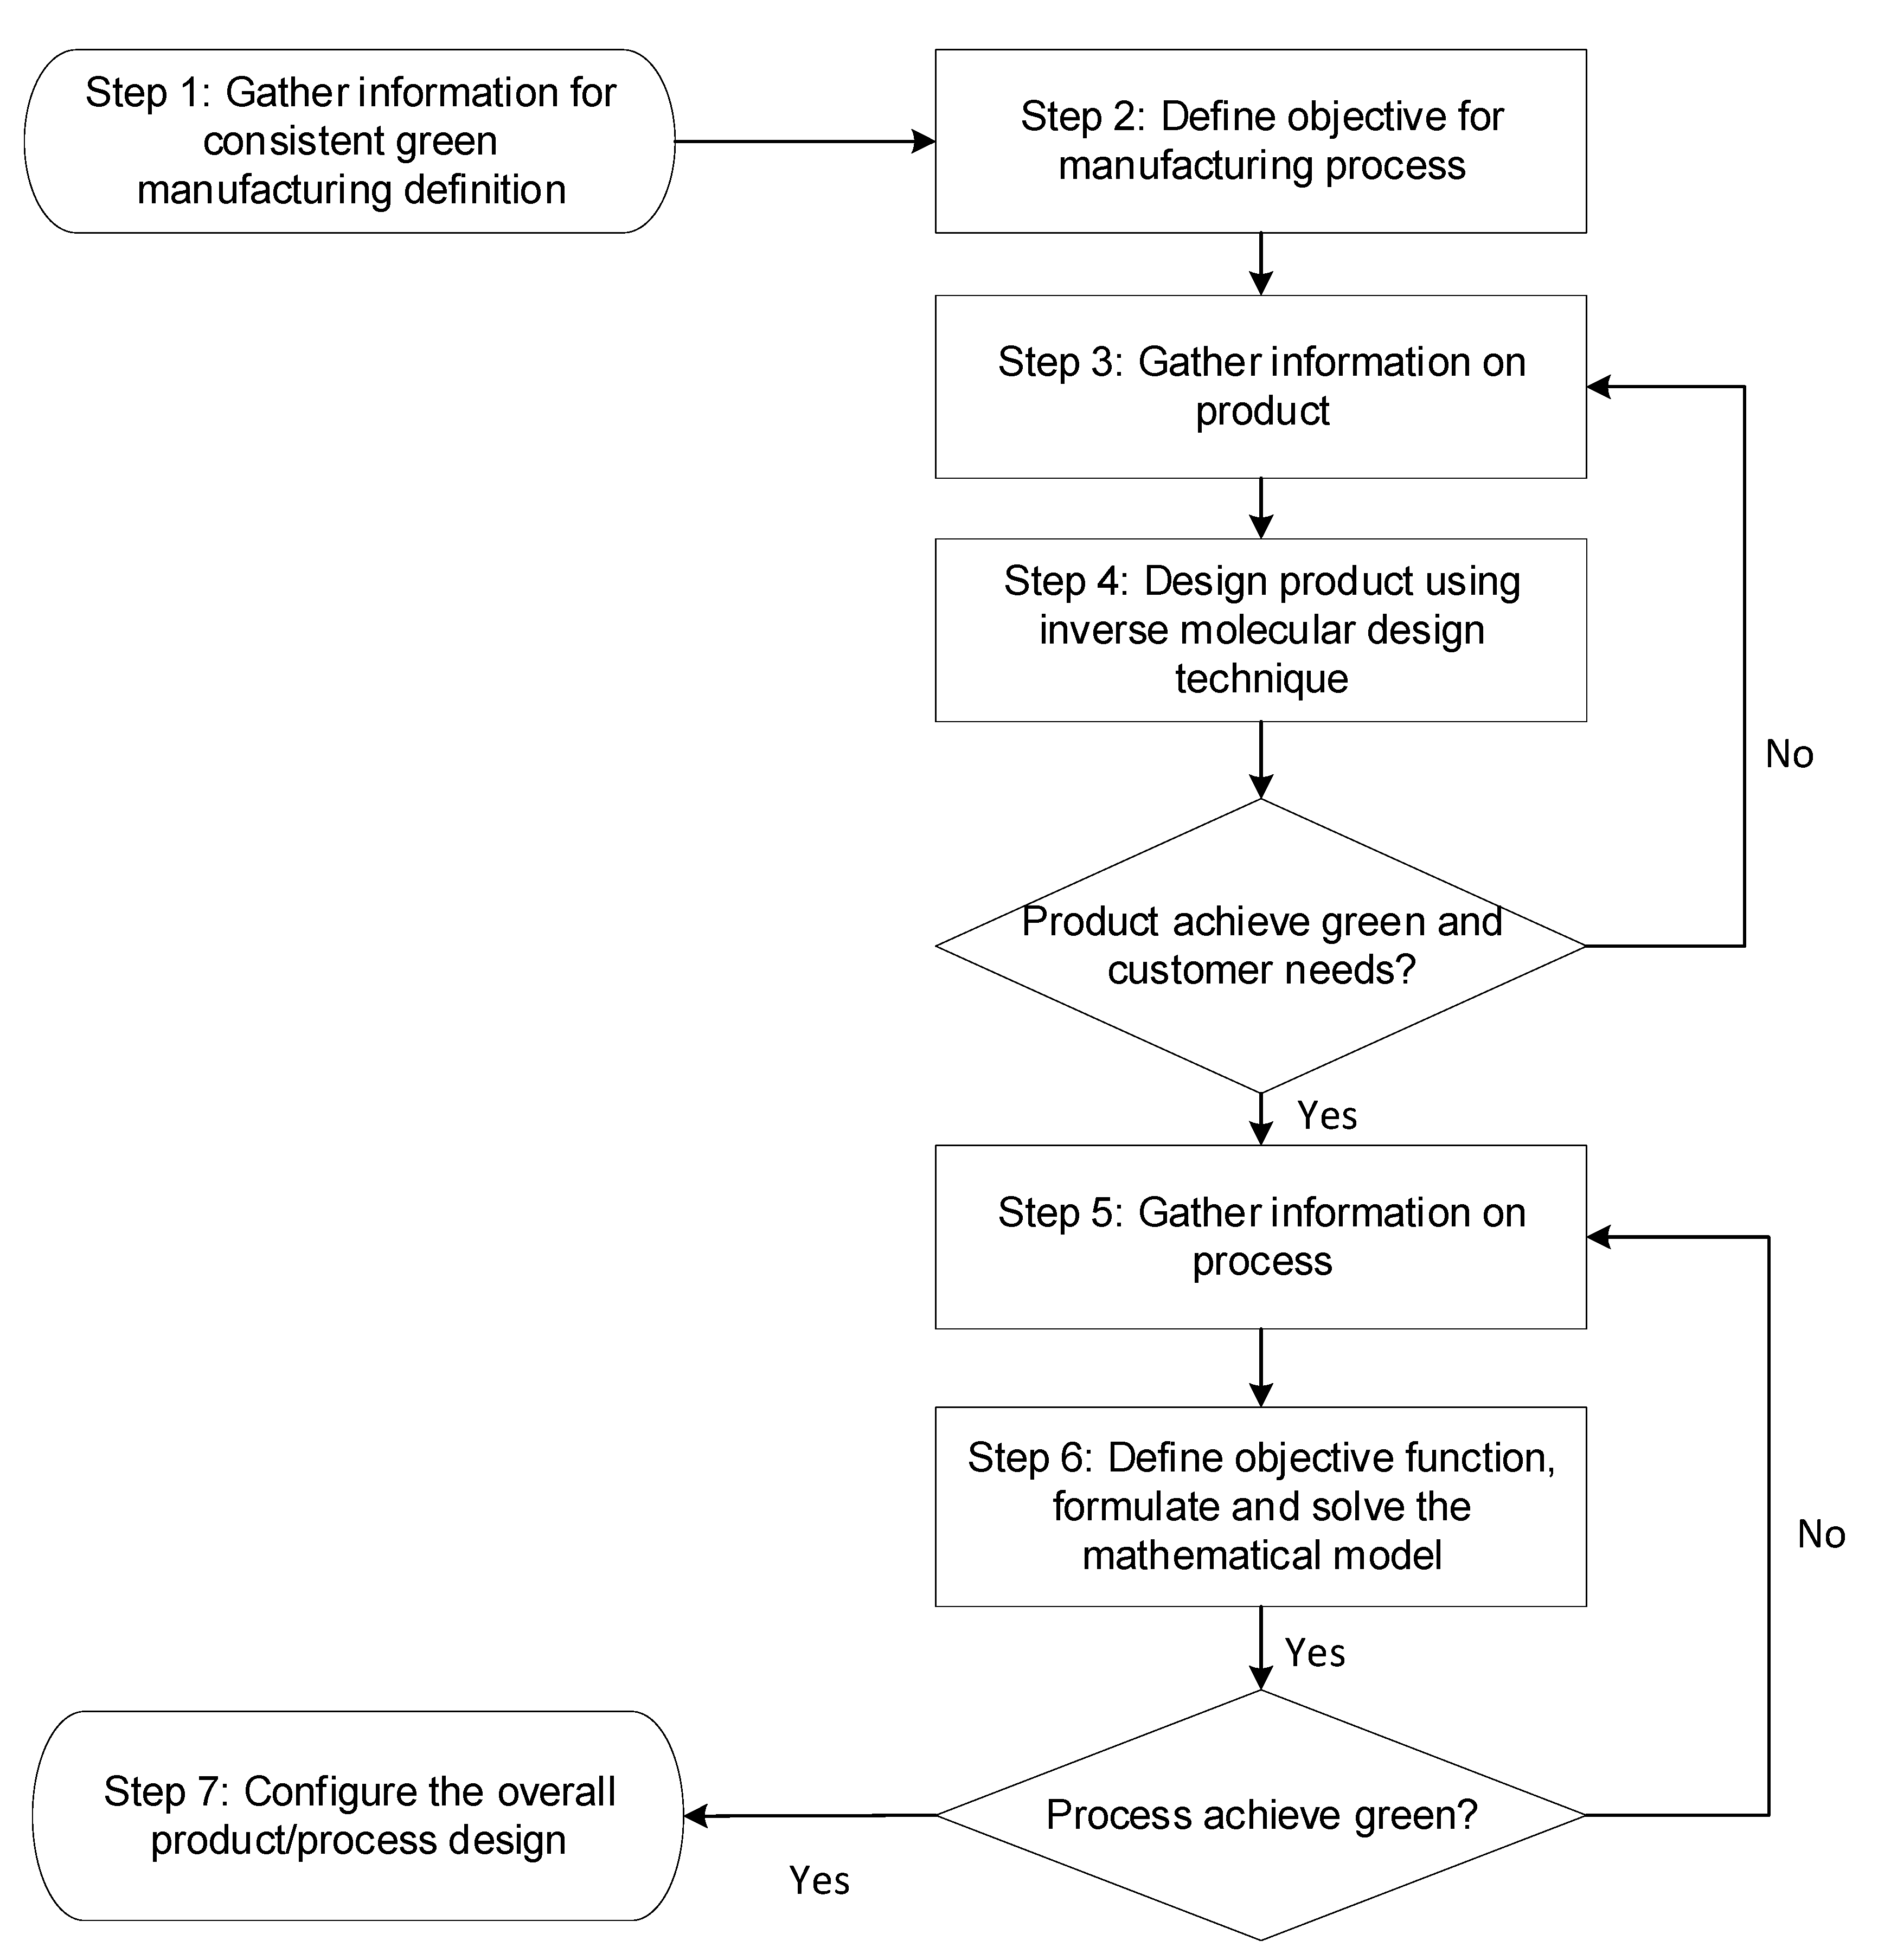
Figure 2.
Degree of satisfaction for (a) property to be minimised and (b) property to be maximised.

Figure 3.
Conversion pathway of integrated biorefinery.


Table 1.
Green definitions of products with measurement/assessment method.
| Generalised Definition | Measurement/Assessment | Purpose | Reference |
|---|---|---|---|
| Avoidance of unnecessary impact or use of energy after end of usable life | Biodegradability | Product can be broken down at the end of life without excessive energy. | De Wilde et al. [27] |
| Octanol/water partition coefficient | Product readily adsorbs in soil to avoid contamination of water source. | Sangster [38] | |
| Manufacturing of non-hazardous product | Flammability test | Avoid product that can spontaneously ignite and burn readily in air. | Albahri [39] |
| Auto-ignition temperature | Avoid product with self-ignite properties at atmospheric condition. | Albahri [39] | |
| Latent heat of vaporisation | Ensure stability of product. | Yunus [40] | |
| Harmless to human health and environment | Bioassays | Measure toxicity of the product by organisms’ responses. | Schulze [41] |
| Oral Rat LD50 | Measure the level of acute toxicity of product. | Hall et al. [42] | |
| Ozone depletion potential (ODP) | Avoid producing ozone-depleting product. | Singh et al. [43] | |
| Global warming potential (GWP) | Minimised greenhouse effect caused by product. | Singh et al. [43] | |
| Utilisation of natural resources | Use of non-fossil-fuel-based natural resources as the feedstock for the manufacturing of product to conserve non-renewable resources. | Anastas and Warner [44] | |
Table 2.
Green definitions of process with the measurement/assessment method.
| Generalised Definition | Measurement/Assessment | Purpose | Reference |
|---|---|---|---|
| Minimisation of waste and material consumption | Percent atom economy | Limit produces of undesired product. | Wang et al. [45] |
| E-factor | Minimise resource intensity and waste generated. | Tieves et al. [46] | |
| Percent yield | Maximise possible mass of a product produce. | Anastas and Warner [44] | |
| Minimisation of energy requirement | Specific energy consumption | Minimise ratio of energy used for producing a product. | Lawrence et al. [47] |
| Equipment efficiency | Avoid unnecessary use of energy. | Siegel et al. [48] | |
| Pollution prevention | Emission rate | Minimise pollutant produce. | MPCA [49] |
| Minimisation of accident risk | Lost time injury frequency rate (LTIFR) | Minimise number of lost time injuries. | SWA [50] |
| Avoidance of unnecessary impact or use of energy after end of usable life | Equipment usable life value | Avoiding long usable life may cause negative impact on the environment. | CFI Education Inc. [51] |
Table 3.
Upper and lower limits for biofuel product design.
| Category | Property | Target Property Range | Reference (GC Model) | |
|---|---|---|---|---|
| Green | - | 4.50 | Hukkerikar et al. [55] | |
| (K) | 294.00 | - | Hukkerikar et al. [55] | |
| Oral Rat LD50 (mg/kg) | 500.00 | 15,000.00 | Hukkerikar et al. [56] | |
| (kJ/mol) | 25.00 | 70.00 | Hukkerikar et al. [55] | |
| Performance | (cP) | 0.10 | 1.50 | Conte et al. [57] |
| (mN/m) | 15.00 | 40.00 | Conte et al. [57] | |
| (g/cm3) | 0.55 | 0.90 | Qiao et al. [58] | |
| (MPa1/2) | 10.00 | 30.00 | Hukkerikar et al. [55] | |
| (kJ/kg) | 4000.00 | 10,000.00 | Yunus et al. [59] | |
Table 4.
List of solutions in terms of molecular groups.
| Solution | Number of Occurrences of Molecular Groups | ||||
|---|---|---|---|---|---|
| CH3- | CH2- | CH- | C- | -OH | |
| A | 5 | 3 | 3 | 0 | 0 |
| B | 6 | 2 | 2 | 1 | 0 |
| C | 4 | 5 | 0 | 1 | 0 |
| D | 3 | 6 | 1 | 0 | 0 |
| E | 2 | 7 | 0 | 0 | 0 |
Table 5.
Molecular structures of designed product.
| Solution | Name | Molecular Structure |
|---|---|---|
| A | 3,4,5-trimethyloctane |  |
| B | 2,2,3,4-tetramethylheptane |  |
| C | 2,2-dimethyloctane |  |
| D | 2-methylnonane |  |
| E | Nonane |  |
Table 6.
Product specifications of designed product.
| Sol. | Green Product Needs | Performance Needs | |||||||
|---|---|---|---|---|---|---|---|---|---|
| LD50 (mg/kg) | (cP) | (mN/m) | (g/cm3) | (MPa1/2) | (kJ/kg) | ||||
| A | 4.45 | 298.63 | 51.43 | 812.70 | 0.58 | 18.68 | 0.74 | 14.03 | 7401.02 |
| B | 4.46 | 294.23 | 49.51 | 751.32 | 0.75 | 17.48 | 0.74 | 12.92 | 7403.22 |
| C | 4.50 | 295.53 | 47.88 | 811.13 | 0.79 | 18.85 | 0.73 | 14.44 | 6778.69 |
| D | 4.38 | 299.93 | 49.81 | 877.38 | 0.61 | 20.04 | 0.73 | 15.54 | 6776.49 |
| E | 4.14 | 294.83 | 46.54 | 906.80 | 0.57 | 20.41 | 0.72 | 16.38 | 6137.80 |
Table 7.
Comparison of λp between different product solutions.
| Sol. | Multi-Optimisation | |||
|---|---|---|---|---|
| A | 0.5874 | 0.6583 | 0.5517 | 0.5668 |
| B | 0.5446 | 0.5375 | 0.5522 | 0.5672 |
| C | 0.5085 | 0.5062 | 0.5151 | 0.4631 |
| D | 0.5512 | 0.6340 | 0.5146 | 0.4627 |
| E | 0.4786 | 0.6667 | 0.4759 | 0.3563 |
Table 8.
Composition of empty fruit bunch (EFP).
| Component | Composition (Dry Matter %) |
|---|---|
| Cellulose | 22.00 |
| Hemicellulose | 29.00 |
| Lignin | 39.00 |
Table 9.
Upper and lower limits.
| Target Objective | Targeted Range | |
|---|---|---|
| Lower Limit | Upper Limit | |
| (USD/yr) | 1.17 × 10⁷ | 2.34 × 10⁷ |
| Alkane C11 Product Yield (t/yr) | 805.58 | 1839.81 |
| (tonne of CO2 equivalent/yr) | 4.03 × 10⁴ | 1.96 × 10⁶ |
| (J/yr) | −7.10 × 10¹¹ | −3.55 × 10¹¹ |
Table 10.
Degree of satisfaction λ for Scenario 5.
| Deg. of Satisfaction | ||||
|---|---|---|---|---|
| Scenario 5 | 0.422 | 0.920 | 0.422 | 0.982 |
Table 11.
Comparison between different scenarios.
| Scenario | 1 | 2 | 3 | 4 | 5 |
|---|---|---|---|---|---|
| Max C11 Yield | Multi-Objective | ||||
| (USD/y) | 2.34 × 10⁷ | 1.32 × 10⁷ | 1.26 × 10⁶ | 2.34 × 10⁷ | 2.25 × 10⁷ |
| (tonne of CO2 equivalent/y) | 6.85 × 10⁴ | 1.41 × 10⁵ | 4.75 × 10⁴ | 6.85 × 10⁴ | 7.51 × 10⁴ |
| Alkane C11 Production Rate (t/y) | 1181.82 | 1839.81 | 805.58 | 1181.82 | 1242.00 |
| Alkane and Alcohol By-product Production Rate (t/y) | 1.47 × 10⁴ | 2.30 × 10⁴ | 1.00 × 10⁴ | 1.47 × 10⁴ | 1.55 × 10⁴ |
| Waste Produced (t/y) | 2.83 × 10⁴ | 2.47 × 10⁴ | 3.3 × 10⁴ | 2.83 × 10⁴ | 2.79 × 10⁴ |
| Atom Economy (%) | 31.96 | 49.75 | 21.78 | 31.96 | 33.59 |
| E-factor | 1.78 | 0.99 | 2.80 | 1.78 | 1.67 |
| (J/y) | −7.10 × 10¹¹ | 1.53 × 10¹² | −2.42 × 10¹¹ | −7.10 × 10¹¹ | −5.05 × 10¹¹ |
| SEC (kJ/t) | −4.47 × 10⁷ | 6.15 × 10⁷ | −2.23 × 10⁷ | −4.47 × 10⁷ | −3.02 × 10⁷ |
Publisher’s Note: MDPI stays neutral with regard to jurisdictional claims in published maps and institutional affiliations. |
© 2021 by the authors. Licensee MDPI, Basel, Switzerland. This article is an open access article distributed under the terms and conditions of the Creative Commons Attribution (CC BY) license (https://creativecommons.org/licenses/by/4.0/).
Share and Cite
MDPI and ACS Style
Lee, J.W.Y.; Ng, L.Y.; Andiappan, V.; Chemmangattuvalappil, N.G.; Ng, D.K.S. Inverse Molecular Design Techniques for Green Chemical Design in Integrated Biorefineries. Processes 2021, 9, 1569. https://doi.org/10.3390/pr9091569
AMA Style
Lee JWY, Ng LY, Andiappan V, Chemmangattuvalappil NG, Ng DKS. Inverse Molecular Design Techniques for Green Chemical Design in Integrated Biorefineries. Processes. 2021; 9(9):1569. https://doi.org/10.3390/pr9091569
Chicago/Turabian StyleLee, Jamie W. Y., Lik Yin Ng, Viknesh Andiappan, Nishanth G. Chemmangattuvalappil, and Denny K. S. Ng. 2021. "Inverse Molecular Design Techniques for Green Chemical Design in Integrated Biorefineries" Processes 9, no. 9: 1569. https://doi.org/10.3390/pr9091569
Note that from the first issue of 2016, this journal uses article numbers instead of page numbers. See further details here.