Article

Effect of Combined Hydrophilic Activation on Interface Characteristics of Si/Si Wafer Direct Bonding

1
Key Laboratory of Optoelectronic Technology and System of the Education Ministry of China, Chongqing University, Chongqing 400030, China
2
National Key Laboratory of Fundamental Science of Novel Micro/Nano Device and System Technology, Chongqing University, Chongqing 400030, China
3
College of Optoelectronic Engineering, Chongqing University, Chongqing 400030, China
4
Chongqing Chuanyi Automation Co., Ltd., Chongqing 401121, China
*
Author to whom correspondence should be addressed.
Processes 2021, 9(9), 1599; https://doi.org/10.3390/pr9091599
Submission received: 2 August 2021 / Revised: 3 September 2021 / Accepted: 3 September 2021 / Published: 6 September 2021

Abstract

:
Wafer direct bonding is an attractive approach to manufacture future micro-electro-mechanical system (MEMS) and microelectronic and optoelectronic devices. In this paper, a combined hydrophilic activated Si/Si wafer direct bonding process based on wet chemical activation and O2 plasma activation is explored. Additionally, the effect on bonding interface characteristics is comprehensively investigated. The mechanism is proposed to better understand the nature of hydrophilic bonding. The water molecule management is controlled by O2 plasma activation process. According to the contact angle measurement and FTIR spectrum analysis, it can be concluded that water molecules play an important role in the type and density of chemical bonds at the bonding interface, which influence both bonding strength and voids’ characteristics. When annealed at 350 °C, a high bonding strength of more than 18.58 MPa is obtained by tensile pulling test. Cross sectional SEM and TEM images show a defect-free and tightly bonded interface with an amorphous SiOx layer of 3.58 nm. This amorphous SiOx layer will induce an additional energy state, resulting in a lager resistance. These results can facilitate a better understanding of low-temperature hydrophilicity wafer direct bonding and provide possible guidance for achieving good performance of homogenous and heterogenous wafer direct bonding.

1. Introduction

Wafer direct bonding can combine two mirror-polished wafers together by van der Waals forces, and then form strong chemical bonds without any intermediate material between surfaces. It has gained remarkable attention in the fields of three-dimensional (3D) integration [1], micro-electro-mechanical systems (MEMS) [2], optoelectronic and photonic devices [3,4,5], fabrication of silicon-on-insulator (SOI) and III-V compounds-on- insulator (such as GeOI and InGaSbOI) substrates [6,7,8].
One of the main targets of wafer direct bonding is to obtain high bonding strength and void free bonding interface after low temperature post annealing. Surface activation is considered to be an effective way for low temperature direct bonding [9]. Different surface treatment methods have been developed to realize high bonding strength and good interface characteristics, such as wet chemical activation [10,11], reactive ion etching (RIE) plasma activation [12,13], N2 microwave (MW) radicals [14], Ar fast atom bombardment (FAB) [15], and so on. Furthermore, intermediate nano-layers (such as Al2O3, Si, Fe) are also used as an assisted layer in wafer direct bonding [16,17,18]. Although MW radicals and FAB activation can realize excellent bonding even at room temperature, they are usually achieved in special activation equipment, resulting in high experiment cost and lack of flexibility. Bonding with intermediate nano-layer increases complexity of bonding process, and reduces electrical and optical properties of bonded pairs. Plasma activated bonding (PAB) is one of the promising candidates for low temperature wafer direct bonding, it can be achieved in any equipment producing plasma. Much progress in terms of plasma type, plasma treatment parameters and annealing conditions have been studied. Nitrogen (N2), oxygen (O2) and argon (Ar) are the most commonly used activated gases [19]. A mixed gas of O2/CF4 also has been proposed to enhance bonding strength and restrain the formation of interfacial voids [20,21]. However, to develop compatible activation processes for different wafers and different activation systems, there is still a challenge of plasma activated wafer direct bonding. Another important factor in plasma activation wafer bonding is the hydrophily of the wafer surface. The bonding process is the result of the combined influence of micro defects and adsorbed water (H2O) molecules on the substrate surface [22,23]. The effect of plasma activation parameters on the hydrophily of wafer surface has been widely investigated. Its influence on the formation of SiOx layer and electrical properties of bonding interface are also analyzed [24]. Although the better hydrophily, the higher surface energy, the excess H2O will prevent Si-OH bonds converting into Si-O bonds [21], resulting in the decrease of bonding strength. Therefore, there is a balance between Si-OH bond and Si-O-Si bond during bonding, an optimal amount of H2O molecules on wafer surface is needed for excellent bonding. Furthermore, it is of great significance to study on the comprehensive effect of activation parameters on bonding interface characteristics, and establish the relationship among surface hydrophily, bonding strength, interface composition and electrical characteristics.
In this study, we performed Si/Si wafer direct bonding using wet chemical activation combined with O2 plasma activation. The bonding mechanism was proposed to better understand the nature of the hydrophilic bonding. The hydrophilicity of the wafer surface was evaluated by contact angle measurement and Fourier transform infrared spectroscopy (FTIR), and its influence on bonding strength and formation of voids were discussed. The effect of O2 plasma activation parameters on bonding strength was investigated by tensile pulling test. The microstructure of bonding interface was observed by scanning electron microscopy (SEM) and transmission electron microscopy (TEM). Finally, the effect of amorphous SiOx layer and bonding voids on electrical properties of bonding interface was also discussed.

2. Materials and Methods

Commercially available Czochralski (CZ) grown 4-inch (100 mm diameter) double-polished n-type (100) Si wafers were used in the experiments. The thickness of the Si wafer was 500 ± 20 μm, the surface roughness was less than 0.4 nm and the resistivity was between 2 and 4 Ω·cm.
A combined hydrophilic activation method by wet chemical activation and O2 plasma activation was applied. The bonding process was described in Figure 1. Firstly, the Si wafer A and Si wafer B were cleaned in SC1 (NH4OH:H2O2:H2O = 1:1:5 in volume) and SC2 (HCl:H2O2:H2O = 1:1:5 in volume) solutions at 80 °C for 10 min by turns, and then immersed in SC1 solutions once again for a hydrophilic surface. The O2 plasma treatments were accomplished using the dry etching machine PVA TePla M4L at the frequency of 13.56 MHz. Next, the wafers were immediately immersed in deionized (DI) water, and cleaned by the ultrasonic cleaner W-357HP with frequency of 1 MHz and power of 450 W for 15 min, which was used to remove particles less than 0.2 μm and provide adequate H2O molecules on the wafer surface. Then, the wafers were dried by N2 in a rotary cleaning and drying machine CXS-1150A with high rotation speed of 2000 rpm. After all the surface treatment above, the two wafers were brought into contact, and loaded into a bonding machine SB6e. Subsequently, the bonding chamber was evacuated to below 5 × 10⁻⁴ mbar to eliminate trapped gas at the initial contact interface. Pre-bonding was accomplished at room temperature and under a 7 kN applied force for 3–5 min, which could overcome the contact problems causing by surface microscopic fluctuations. Finally, the pre-bonded wafers were annealed in N2 atmosphere at 350 °C for 2 h in an annealing furnace with nitrogen flow of 6 L/min.
The hydrophilicity of wafer surface was studied by contact angle testing instrument JCY-4 with a deionized (DI) water droplet of 2 μL. The surface roughness was measured by white light interferometer Zygo NewView 7100 with a scanning range of 10 × 10 μm2. The type and density of chemical bonds at the bonding interface were characterized by FTIR IRPRESTIGE-21 with wave number range of 400–4000 cm−1 and resolution power of 0.5 cm−1. The bonding voids were detected by the infrared imaging (IR) system conducted with an IR camera and the image detection software [25]. Then, the bonded wafers were diced into 1 × 1 cm2 small pieces and glued on the testing bar with ergo 5800. Bonding strength was measured by tensile machine UTM4104X with a tensile rate of 0.05 mm/min. The tensile pulling test was carried out in an atmospheric environment with humidity of 50–60%, ignoring the influence of stress corrosion of water on the testing results [26]. The cross section of the bonded wafer was polished on a CMP rotating disk, and observed by SEM (FEI Nova 400) and TEM (FEI Talos F200S G2). The 500 nm thick aluminum electrodes were evaporated on both sides of the bonded pieces, and the I-V characterization were tested by the semiconductor parameter analyzer HP-4145B.

3. Mechanism for Combined Hydrophilic Bonding

Based on the theory of hydrophilic bonding, the bonding mechanisms of the combined hydrophilic activation in our experiments are analyzed. The schematic diagram is shown in Figure 2. After wet chemical cleaning and activation of SC1 → SC2 → SC1, a thin chemical oxide layer forms on the Si wafer surface. This oxide can instantaneously react with H2O molecules when exposed in humid air, forming silanol groups (Si-OH) on the Si wafer surface [27]. Therefore, the wafer surface is covered by Si-OH and absorbs a few monolayers of water by hydrogen bridges (Figure 2a).
Si - Si + x H 2 O Si - OH + Si - OH + ( x 1 ) H 2 O
O2 plasma activation has functions of both ion sputtering and implantation [15]. During activation process, the hydrocarbon contaminants can be removed by ion sputtering effect. In addition, the Si-O or Si-Si structures on the Si wafer surface are destroyed by reactive oxygen atoms and high-energy electrons, which makes a large number of bridged bonds become non-bridged bonds. As a result, there are a lot of dangling bonds on the Si wafer surface, which can adsorb water molecules (Figure 2b). When the Si wafer is immersed in DI water for megasonic cleaning, the dangling bonds and Si-OH bonds will connect with a large number of H2O molecules by covalent bond and hydrogen bond, and the thickness of the hydration film on the Si wafer surface increases (Figure 2c).
Bonding is occurred as two Si wafers come into contact at room temperature, called pre-bonding. The Si wafers are pressed tightly together with an applied force of 7 kN, and then bonded together by hydrogen bonds and Si-OH bonds (Figure 2d). However, the bonding strength is weak because of the low bond energy of Si-OH bond.
2 Si - OH + H 2 O Si - OH H 2 O Si - OH
With the increase of annealing temperature, the mobility of OH group increases due to heat energy, and the silicon wafers produce elastic deformation. As a result, the bonding area increases, and the bonding strength also increases. When the temperature reaches 200 °C, Si-OH bonds begin to convert into Si-O-Si bonds (as shown in Equation (3)), resulting in an increase of bonding strength. However, the number of Si-O-Si is small due to the low mobility of H2O molecules. Further increase of annealing temperature makes the dehydration condensation reaction at the bonding interface accelerate, so a large number of Si-OH bonds convert into Si-O-Si bonds and the bonding strength can be greatly increased. At the same time, the fluidity of H2O molecules is greatly enhanced, so the H2O molecules is easier to get out of the interface, promoting the forward reaction of Equation (3). Annealing at 350 °C for a longer time can ensure the reaction completely reacted, and form sufficient Si-O-Si bond.
Si - OH + Si - OH Si - O - Si + H 2 O
The excess H2O molecules at the bonding interface will diffuse into the bottom Si substrate and react with Si to generate hydrogen (H2) (Figure 2e). However, when H2O molecules on the bonding interface are surplus, Equation (3) goes in the reverse direction, resulting in the transformation of Si-O-Si bond into Si-OH. Meanwhile, the corrosion of H2O molecules can also prevent the closure of the bonding, resulting in the decrease of bonding strength [28].
Si + H 2 O SiO 2 + H 2
Finally, an amorphous oxide layer at the bonding interface is formed, and strong bonding is achieved (Figure 2f). Some of the H2 produced by Equation (4) is absorbed by Si substrate or the amorphous oxide layer until it exceeds the solubility limit. Others accumulate at the bonding interface, forming interfacial voids.
The bonding strength is closely related to the adsorption energy of the bonding interface, which can be reflected by surface energy. During pre-bonding at room temperature, the surface energy of the two wafers decreases while the interface energy increases. The net change in surface energy forms adsorption energy T. which can be expressed by the surface energy W1, W2 and interface energy W1,2.
T = W 1 + W 2 W 1 , 2
The adsorption energy T represents the energy per unit area that promote wafers to bond, that is, the energy required to separate the bonded wafers. The adsorption energy can overcome the elastic energy accumulated in the wafer due to wafer deformation, and prevent the wafer from de-bonding. It can be seen that the higher adsorption energy, the higher bonding strength. In order to improve the adsorption energy, it can be achieved by increasing surface energy of the wafer surface.
Surface treatment can destroy the lattice structure on the wafer surface, and then dangling bonds are formed due to the residual binding force of surface atoms pointing towards space in the asymmetric force field. The more surface dangling bonds, the greater surface energy. Hydrophilic surface treatment can increase the number of dangling bonds through chemical and physical methods, so that more H2O molecules can be absorbed on the wafer surface and improve surface energy.

4. Results and Discussion

4.1. Surface Hydrophilicity

H2O molecules play an important role in hydrophilic wafer direct bonding. A straightforward way to study surface hydrophilicity is to measure the contact angle of a drop of water on the wafer surface. The lower contact angle, the higher surface hydrophilicity, and the higher surface energy. The samples for contact angle test are cut into 2 cm × 4 cm pieces, and then activated with different O2 plasma activation parameters. Since the contact angle of Si wafer is very small after hydrophilic treatment, the droplets will spread rapidly on the surface of the wafer. Therefore, the DI water droplets is 2 μL, and the test needs to be completed as soon as possible.
Figure 3 displays the contact angles of Si samples in bare, wet activation, O2 plasma activation and combined activation. In general, there is a natural oxide layer of several nanometers on the Si wafer surface, which makes the wafer surface easily adsorb hydrocarbon contaminants. Thus, the contact angle of the bare Si wafer is 60.24° (Figure 3a). After wet cleaning by SC1 solution, the hydrocarbon contaminants on the Si wafer surface are removed and a new chemical oxide layer forms, so the contact angle decreases to 5.64° (Figure 3b). O2 plasma activation can further improve the hydrophilicity of the Si wafer surface because of the increase of the number of dangling bonds created by ion bombardment, and the contact angle is 4.73° (Figure 3c). The combined activation method renders the Si wafer surface more hydrophilic and the contact angle is 4.35° (Figure 3d). It shows that both wet chemical activation and O2 plasma activation can clean and activate the Si wafer surface, resulting in a high surface energy.
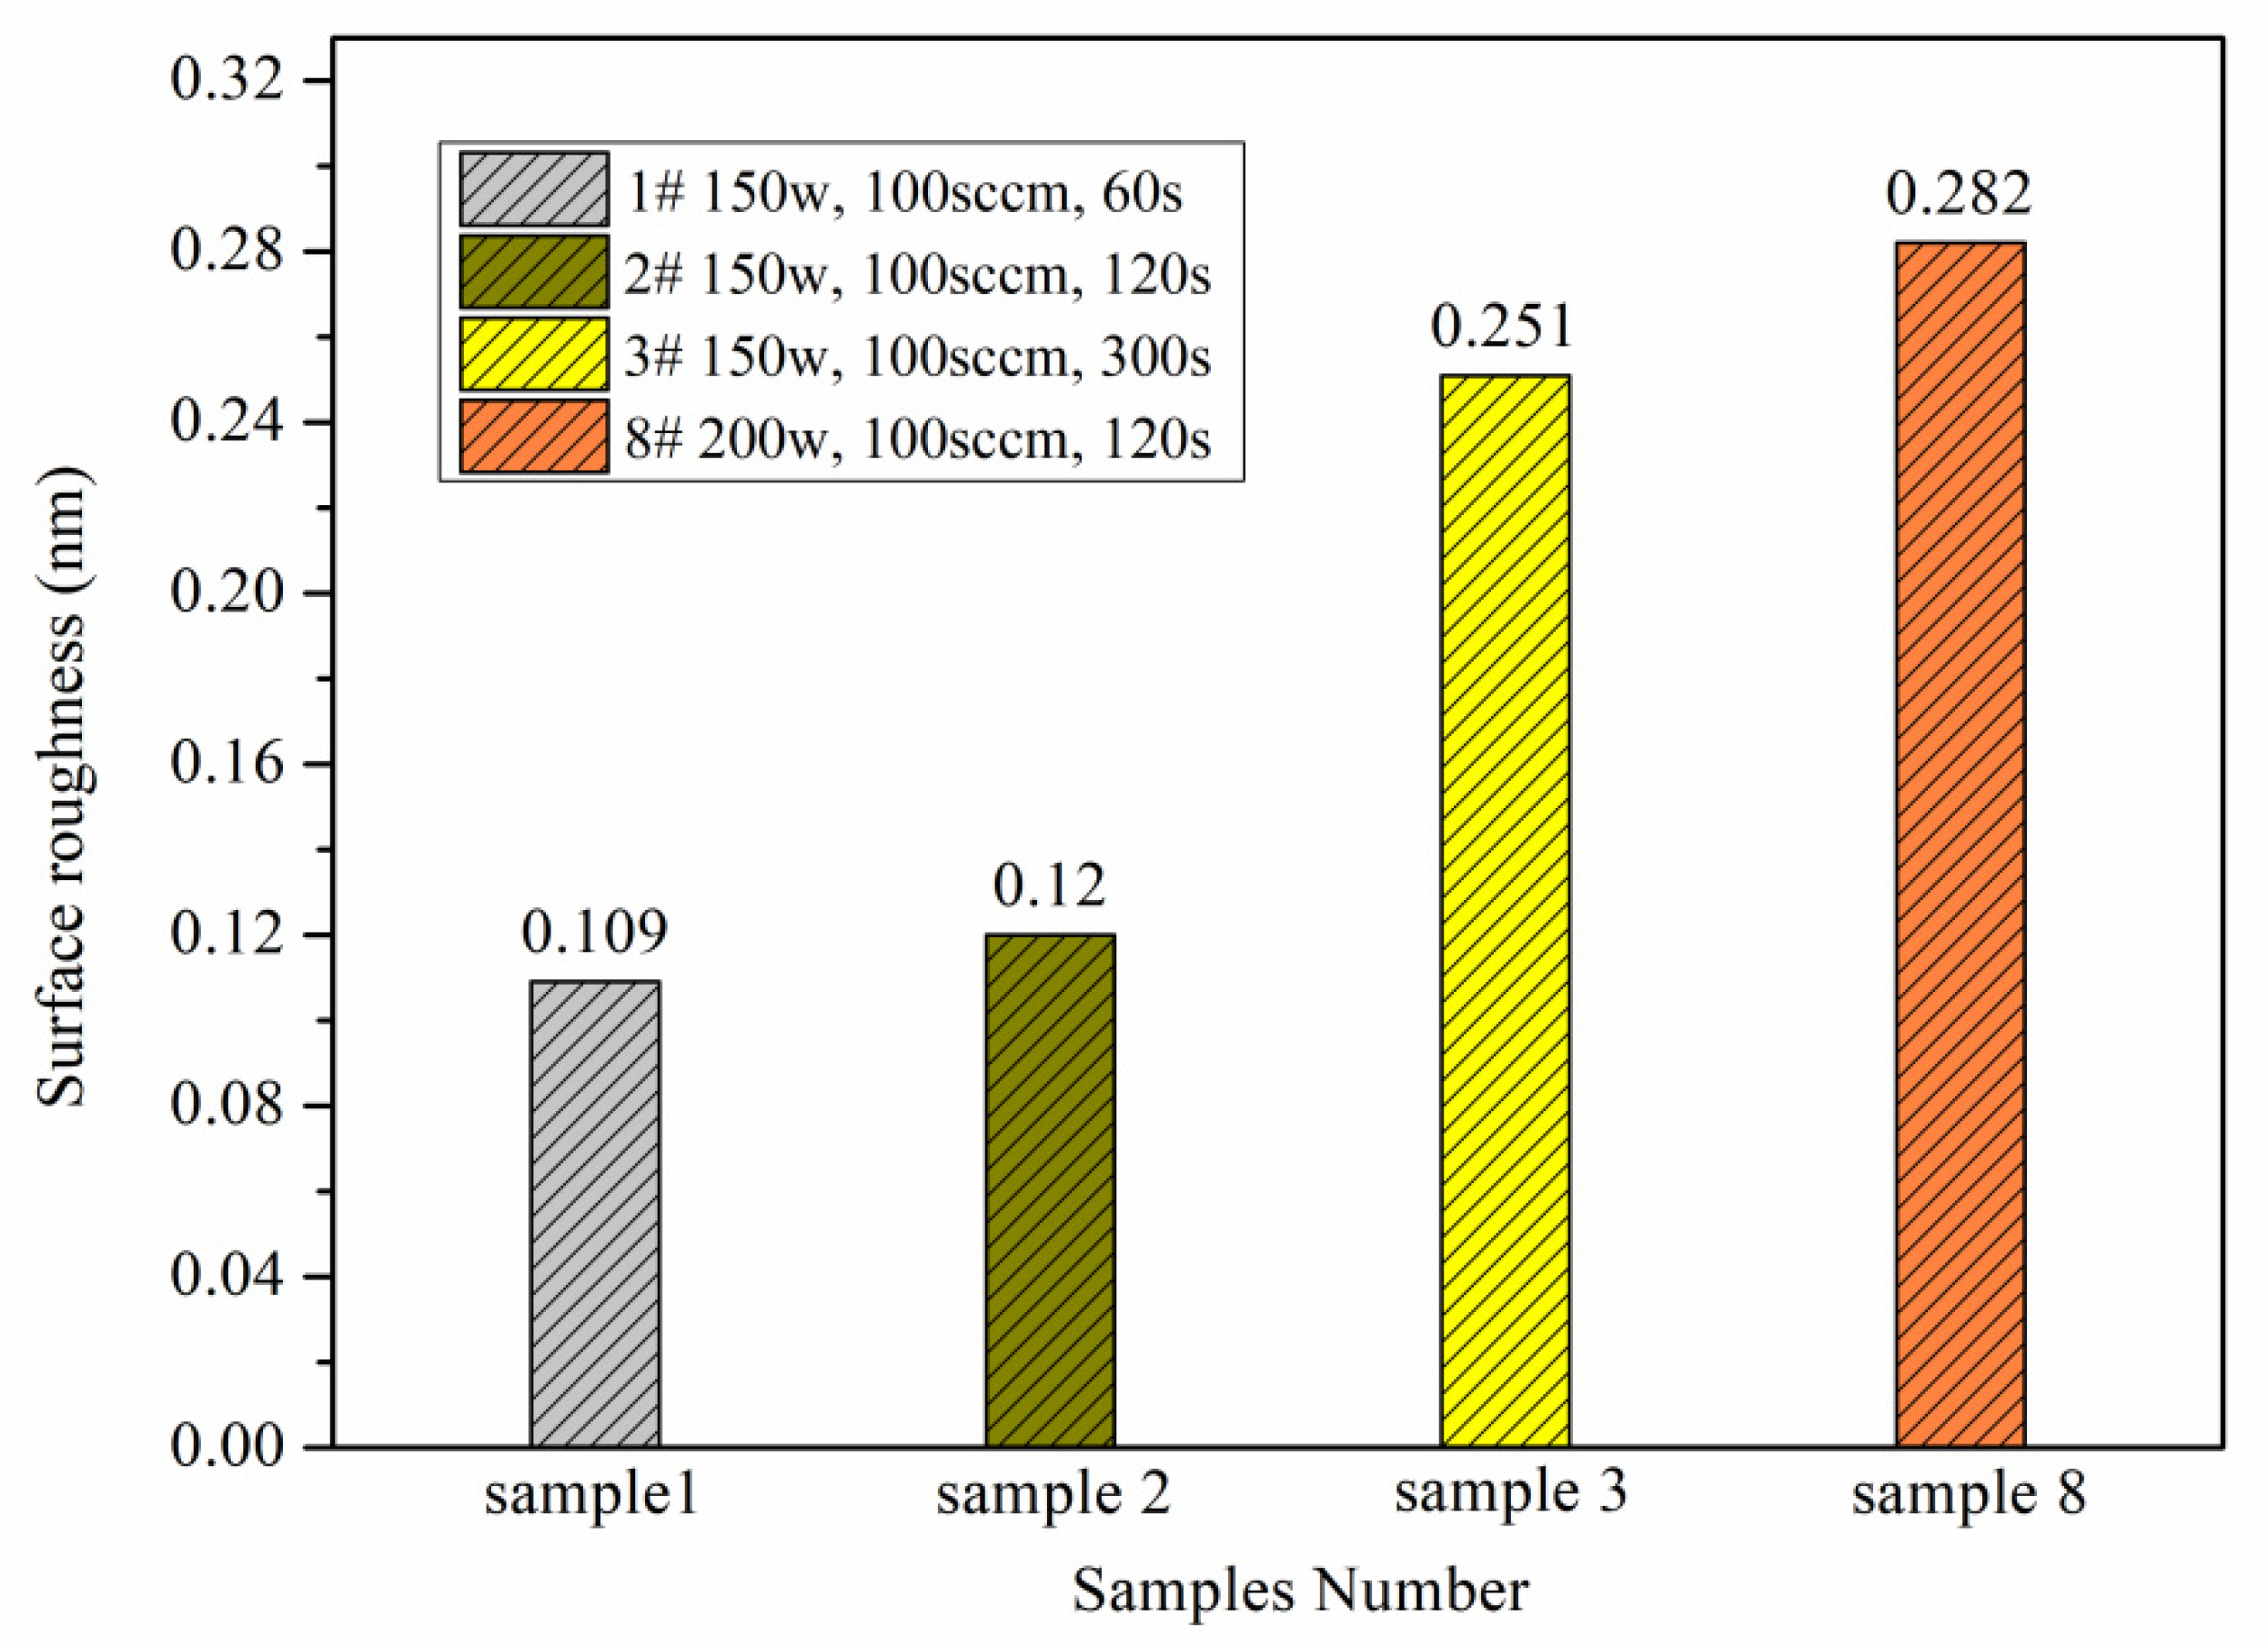
In order to study the influence of surface hydrophilicity on voids’ formation and bonding strength, the contact angle measurements with different O2 plasma parameters are carried out, and the results are listed in Table 1. The contact angle measurements are completed within 60 min after activation, and all the samples are only treated by O2 plasma activation. Both the contact angle and bonding strength are the average value of three times’ tests. The contact angle of O2 plasma activated Si wafer is less than 5° for most samples, indicating a high hydrophilic surface. It can be seen that the contact angles of activated surface show a decreasing trend as the O2 plasma activation time and power increase. Due to longer activation time and a higher activation power create a large number of dangling bonds on the Si wafer surface, which can absorb more H2O molecules. Thus, the hydrophilicity of the Si wafer surface increases, and the contact angle decreases. In addition, this result can be correlated with the surface roughness, which increase with O2 plasma activation time and power, as shown in Figure 4. Rough surfaces are known to have a lower contact angle according to the Wenzel equation [29].
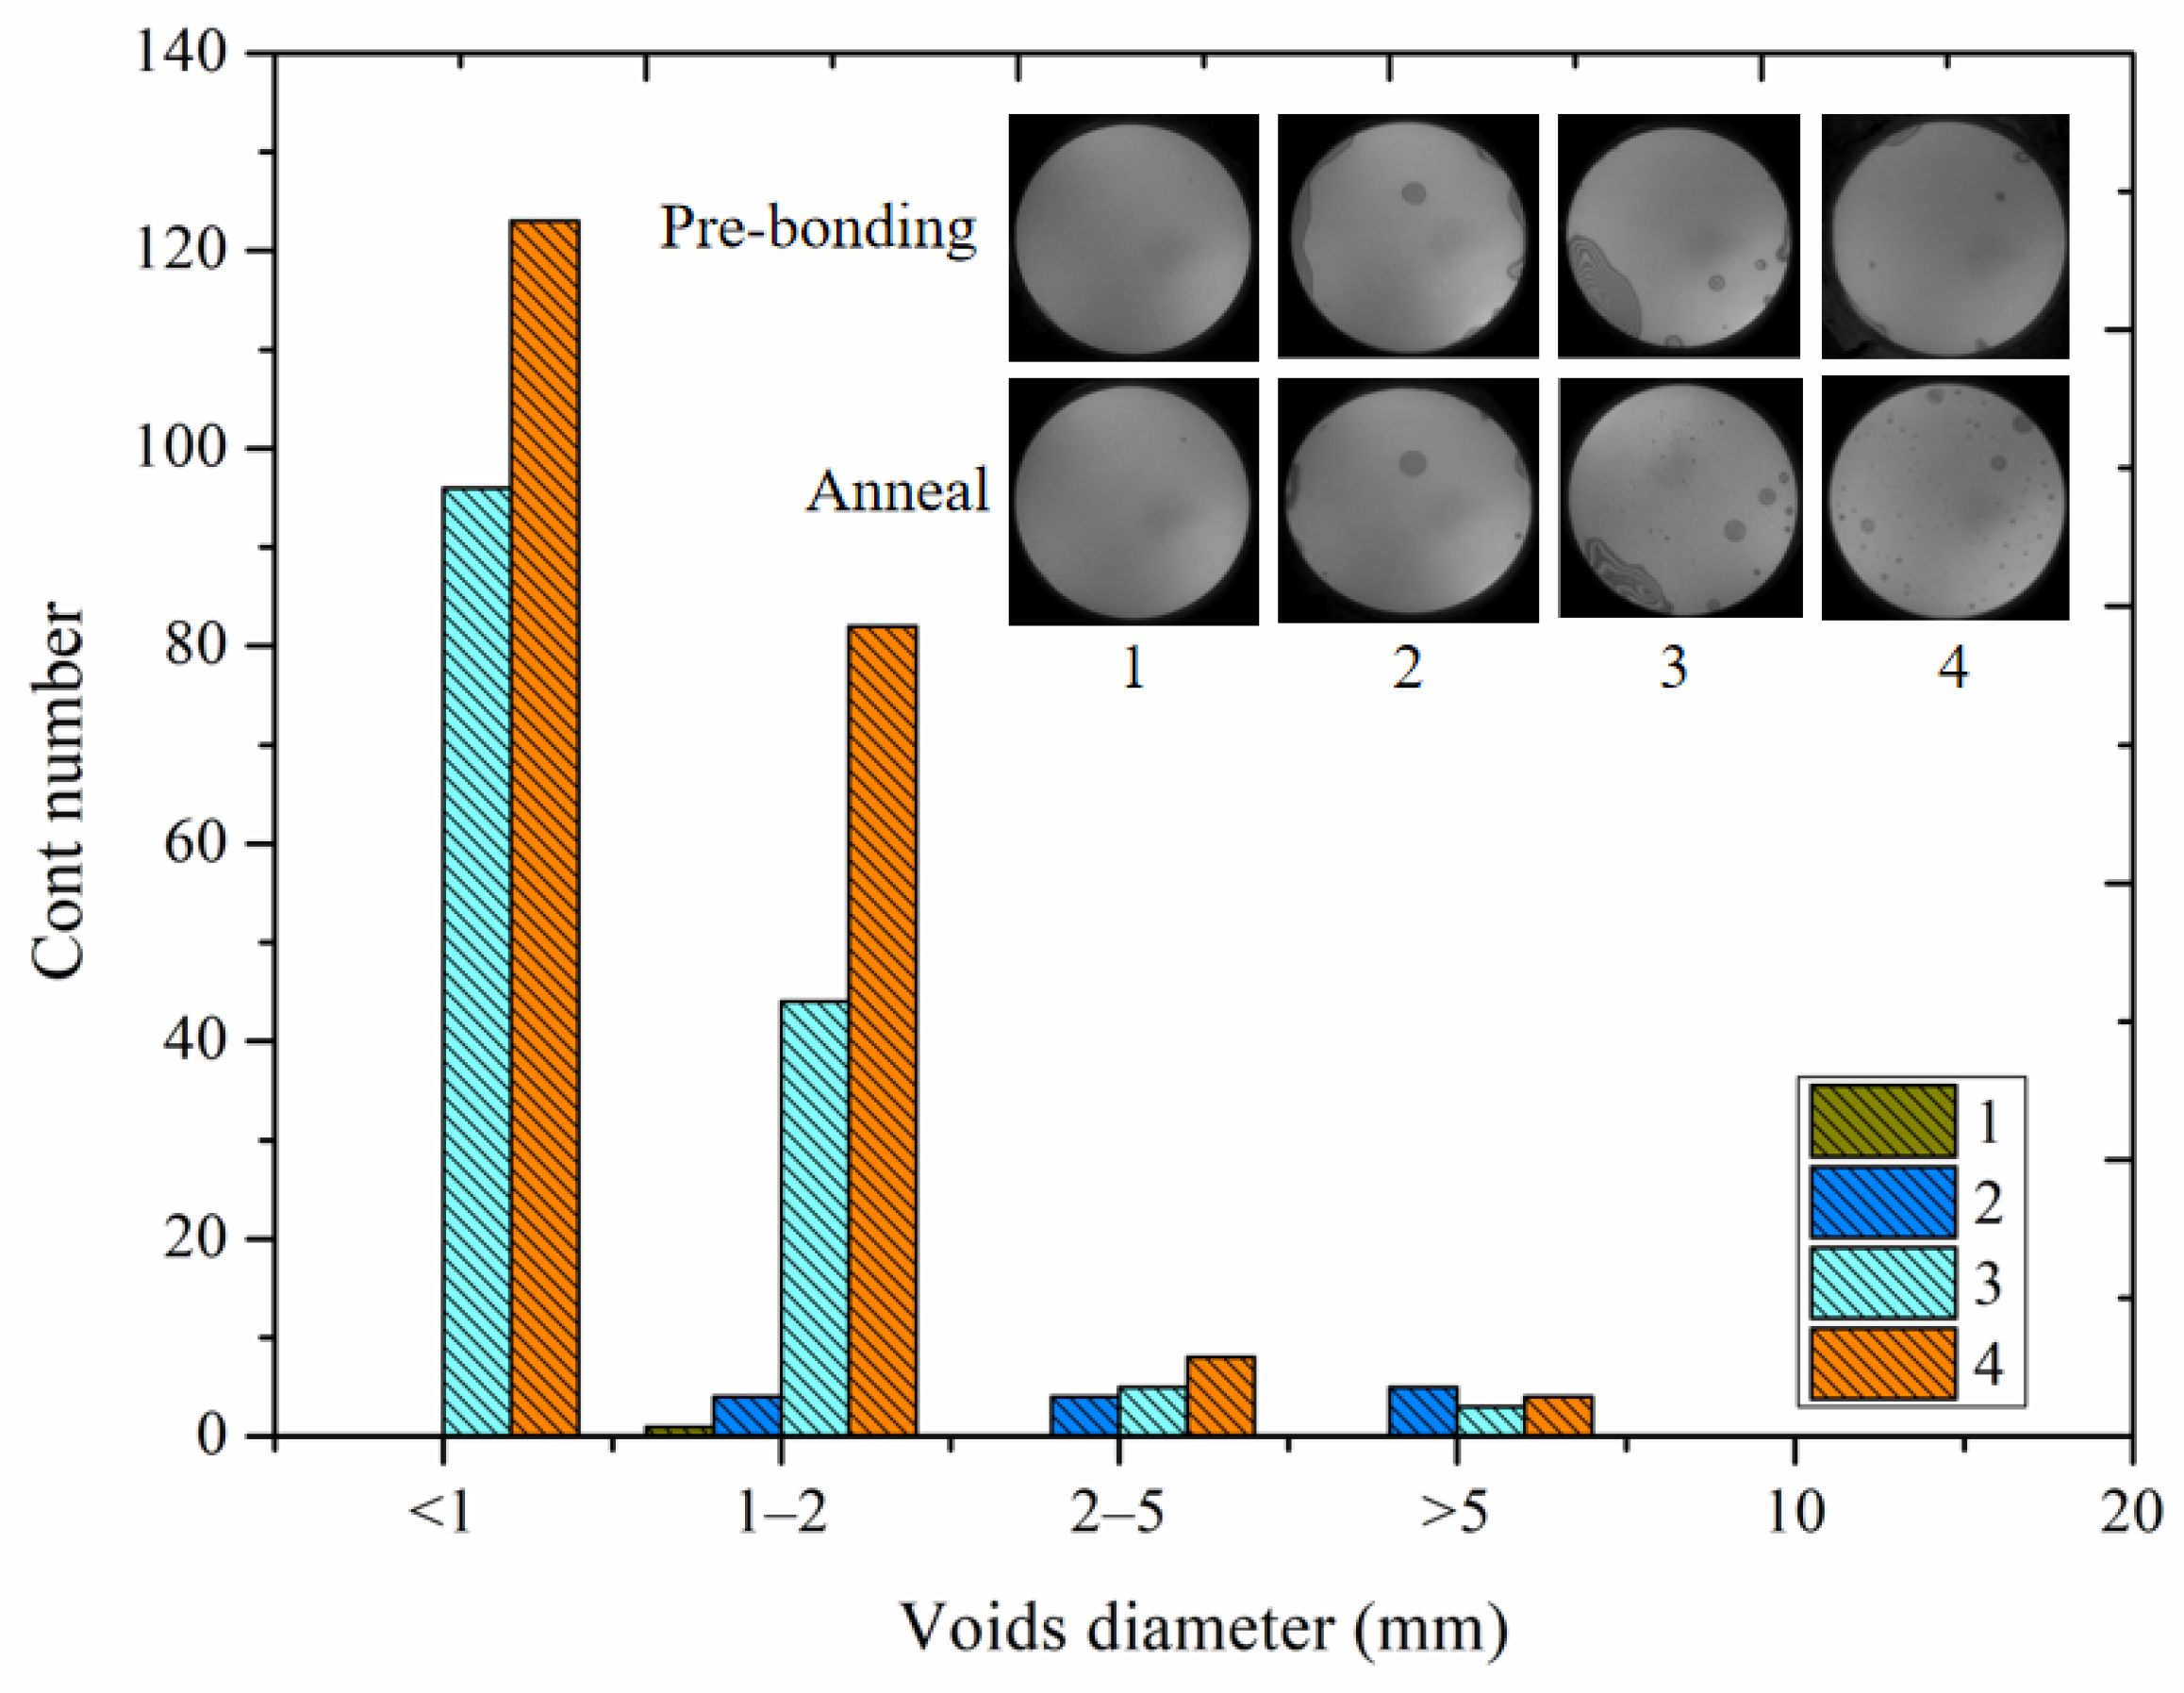
Four samples (sample 1–4) with different voids’ morphology are further studied. The size of the interfacial voids and the IR images are shown in Figure 5. Although the IR image system can only detect voids whose diameters are larger than 0.2 mm, we can make a preliminary judgment of the cause of voids formation by the visible voids’ morphology. It can be seen that sample 1 has a perfect bonding interface, and only one void with diameter of less than 2 mm is observed by IR image. Thus, it shows a high bonding strength of 16.95 MPa. There is a big void (diameter > 5 mm) in sample 2, which is caused by particles, because the void’s size does not change after annealing. The bonding defects on the edge of sample 2 are mainly caused by micro defects on the wafer edge, which are reduced after annealing due to the increasing of intermolecular force. These defects have little effect on the formation of chemical bonds across the bonding interface. Thus, the bonding strength is 11.23 MPa for the area without visible voids. Unfortunately, the interfacial voids of sample 3 and sample 4 are clearly visible. Some big voids (diameter > 5 mm) appear after pre-bonding, and then begin to expand and grow bigger when annealing at higher temperatures, indicating the presence of C contamination at the bonding interface. The C contamination may come from environment or wafer container, and it is more likely to accumulate on the high surface energy wafers. Subsequently, a large number of voids appear after annealing, and the bonding strength for sample 3 and sample 4 is only 4.18 MPa and 4.46 MPa, respectively. The sharply decrease of bonding strength is mainly due to the large number of voids in the bonding interface. Moreover, the C contamination will also prevent the conversion of Si-OH to Si-O-Si bond. According to the mechanism of hydrophilic bonding in Section 3, the small and dense voids (Diameter < 1 mm) are caused by H2 molecules produced during bonding process, as shown in Equation (4). The bigger and sparse voids (1 mm < diameter < 2 mm) are mainly due to the gathering of H2O molecules produced by Equation (3). It can be concluded that excessive H2O molecules are adsorbed on the Si wafer surfaces of sample 3 and sample 4. In addition, the morphology of interfacial voids can be used to qualitatively analyze the hydrophilicity of the wafer surface.
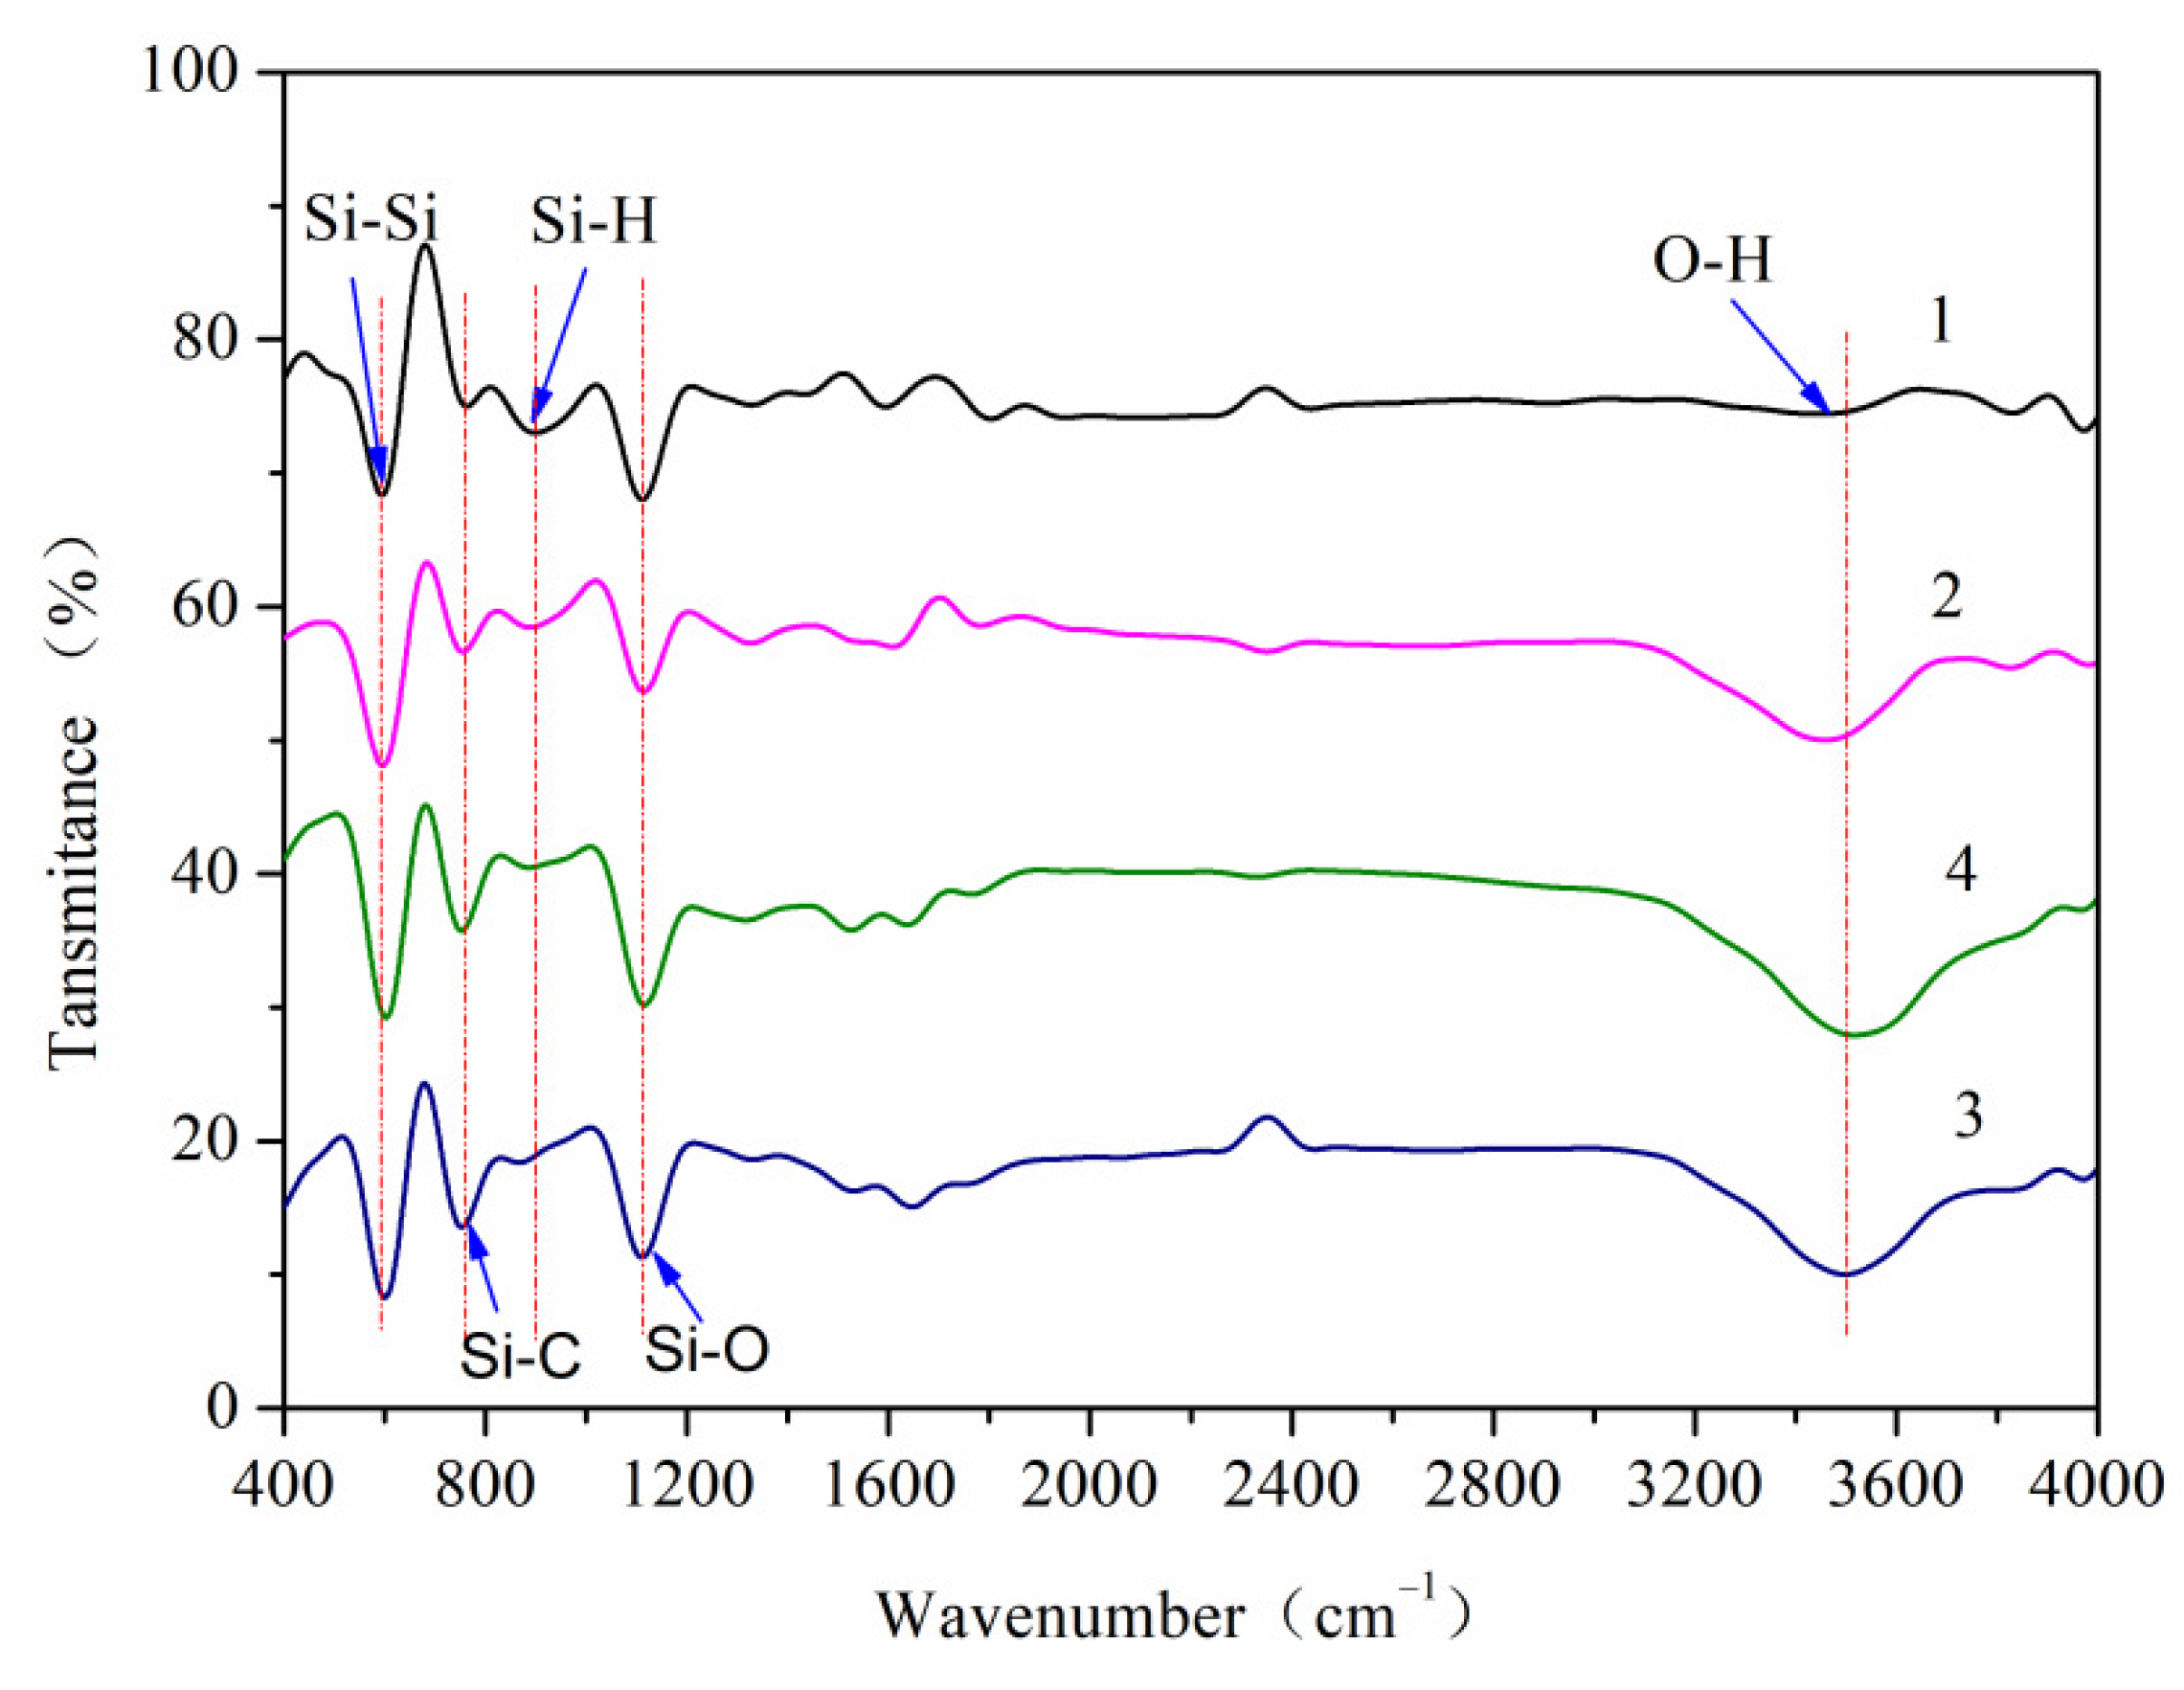
FTIR is employed to characterize the type and density of the chemical bonds on the bonding interface for further understanding of the void’s formation and bonding strength variation. The FTIR spectra of samples 1–4 are illustrated in Figure 6. All of the samples are annealed at 350 °C for 2 h, and the FTIR spectra subtract the environmental background. It is seen that, all of the FTIR spectra contain peaks at 611, 739, 889, 1108 and 3486 cm−1, indicating that the chemical reaction during bonding process is basically the same. Among them, the peak at 611 cm−1 corresponds to Si-Si substrate absorption. The peak at 739 cm−1 corresponds to Si-C stretching vibration, introduced by C contamination. The peak at 889 cm−1 corresponds to Si-H deformation vibration, indicating the formation of hydrogen bond. The peak at 1108 cm−1 corresponds to the antisymmetric stretching vibration of Si-O-Si, revealing the formation of SiOx layer at the bonding interface. The peak at 3486 cm−1 corresponds to the stretching vibration of Si-OH, reflecting the amount of adsorbed H2O molecules at the bonding interface. Only weak Si-OH peaks are observed in sample 1, which indicates that the reaction between Si wafers reaches the saturation state under this condition, and nearly all of the Si-OH bonds convert into Si-O-Si bonds. Samples 2, sample 3 and sample 4 all have obvious Si-OH peaks, indicating that the wafers are more hydrophilic before bonding. This result is consistent with the test result of contact angle in Table 1. During annealing, the Si-OH dehydrate to form Si-O-Si, and H2O molecules and H2 molecules gather in the bonding interface, so the voids appear. However, sample 2 has no obvious defects after annealing, but the bonding strength is lower than sample 1. This may be because excess H2O at the bonding interface participates in the reaction and generates a small amount of H2. The H2 accumulates at the bonding interface, and then form small interfacial voids, which cannot be detected by the IR image system. Otherwise, the excess H2O and H2 molecules of sample 2 can be absorbed by the amorphous layer at the bonding interface and the Si substrate. The Si-OH peak intensity of sample 4 is higher than that of sample 2, but the contact angle is lower. This may be due to the presence of a higher Si-C peak of sample 4. Compared with sample 4, sample 3 exhibits higher hydrophilicity due to long time plasma bombardment and high plasma energy, but the bonding strength is lower than that of sample 4. This is due to that surplus H2O molecules on sample 3 cause the transformation of Si-O-Si bond into Si-OH. The bond energy of Si-OH bond is lower than Si-O-Si bond, so the bonding strength is low. It can be concluded that, the hydrophilicity of wafer surface affects both the interfacial voids and bonding strength. An optimal activation process needs to control the H2O molecules on the Si wafer surface at an appropriate level.

4.2. Bonding Strength

Bonding strength is a key parameter factor to evaluate the mechanical properties of bonding interface, and it is also very important for further applications of bonding technology in MEMS devices and packaging. The bonding strength of Si/Si bonded wafers are tested by tensile pulling test. The bonding strength with different process parameters are analyzed in Figure 7, which is the average value of three pieces taken from the same bonded wafer. The variations between measurements maybe caused by sample fixing problems or the shear force during preloading. All of the wafers are annealed at 350 °C for 2 h in N2 atmosphere.
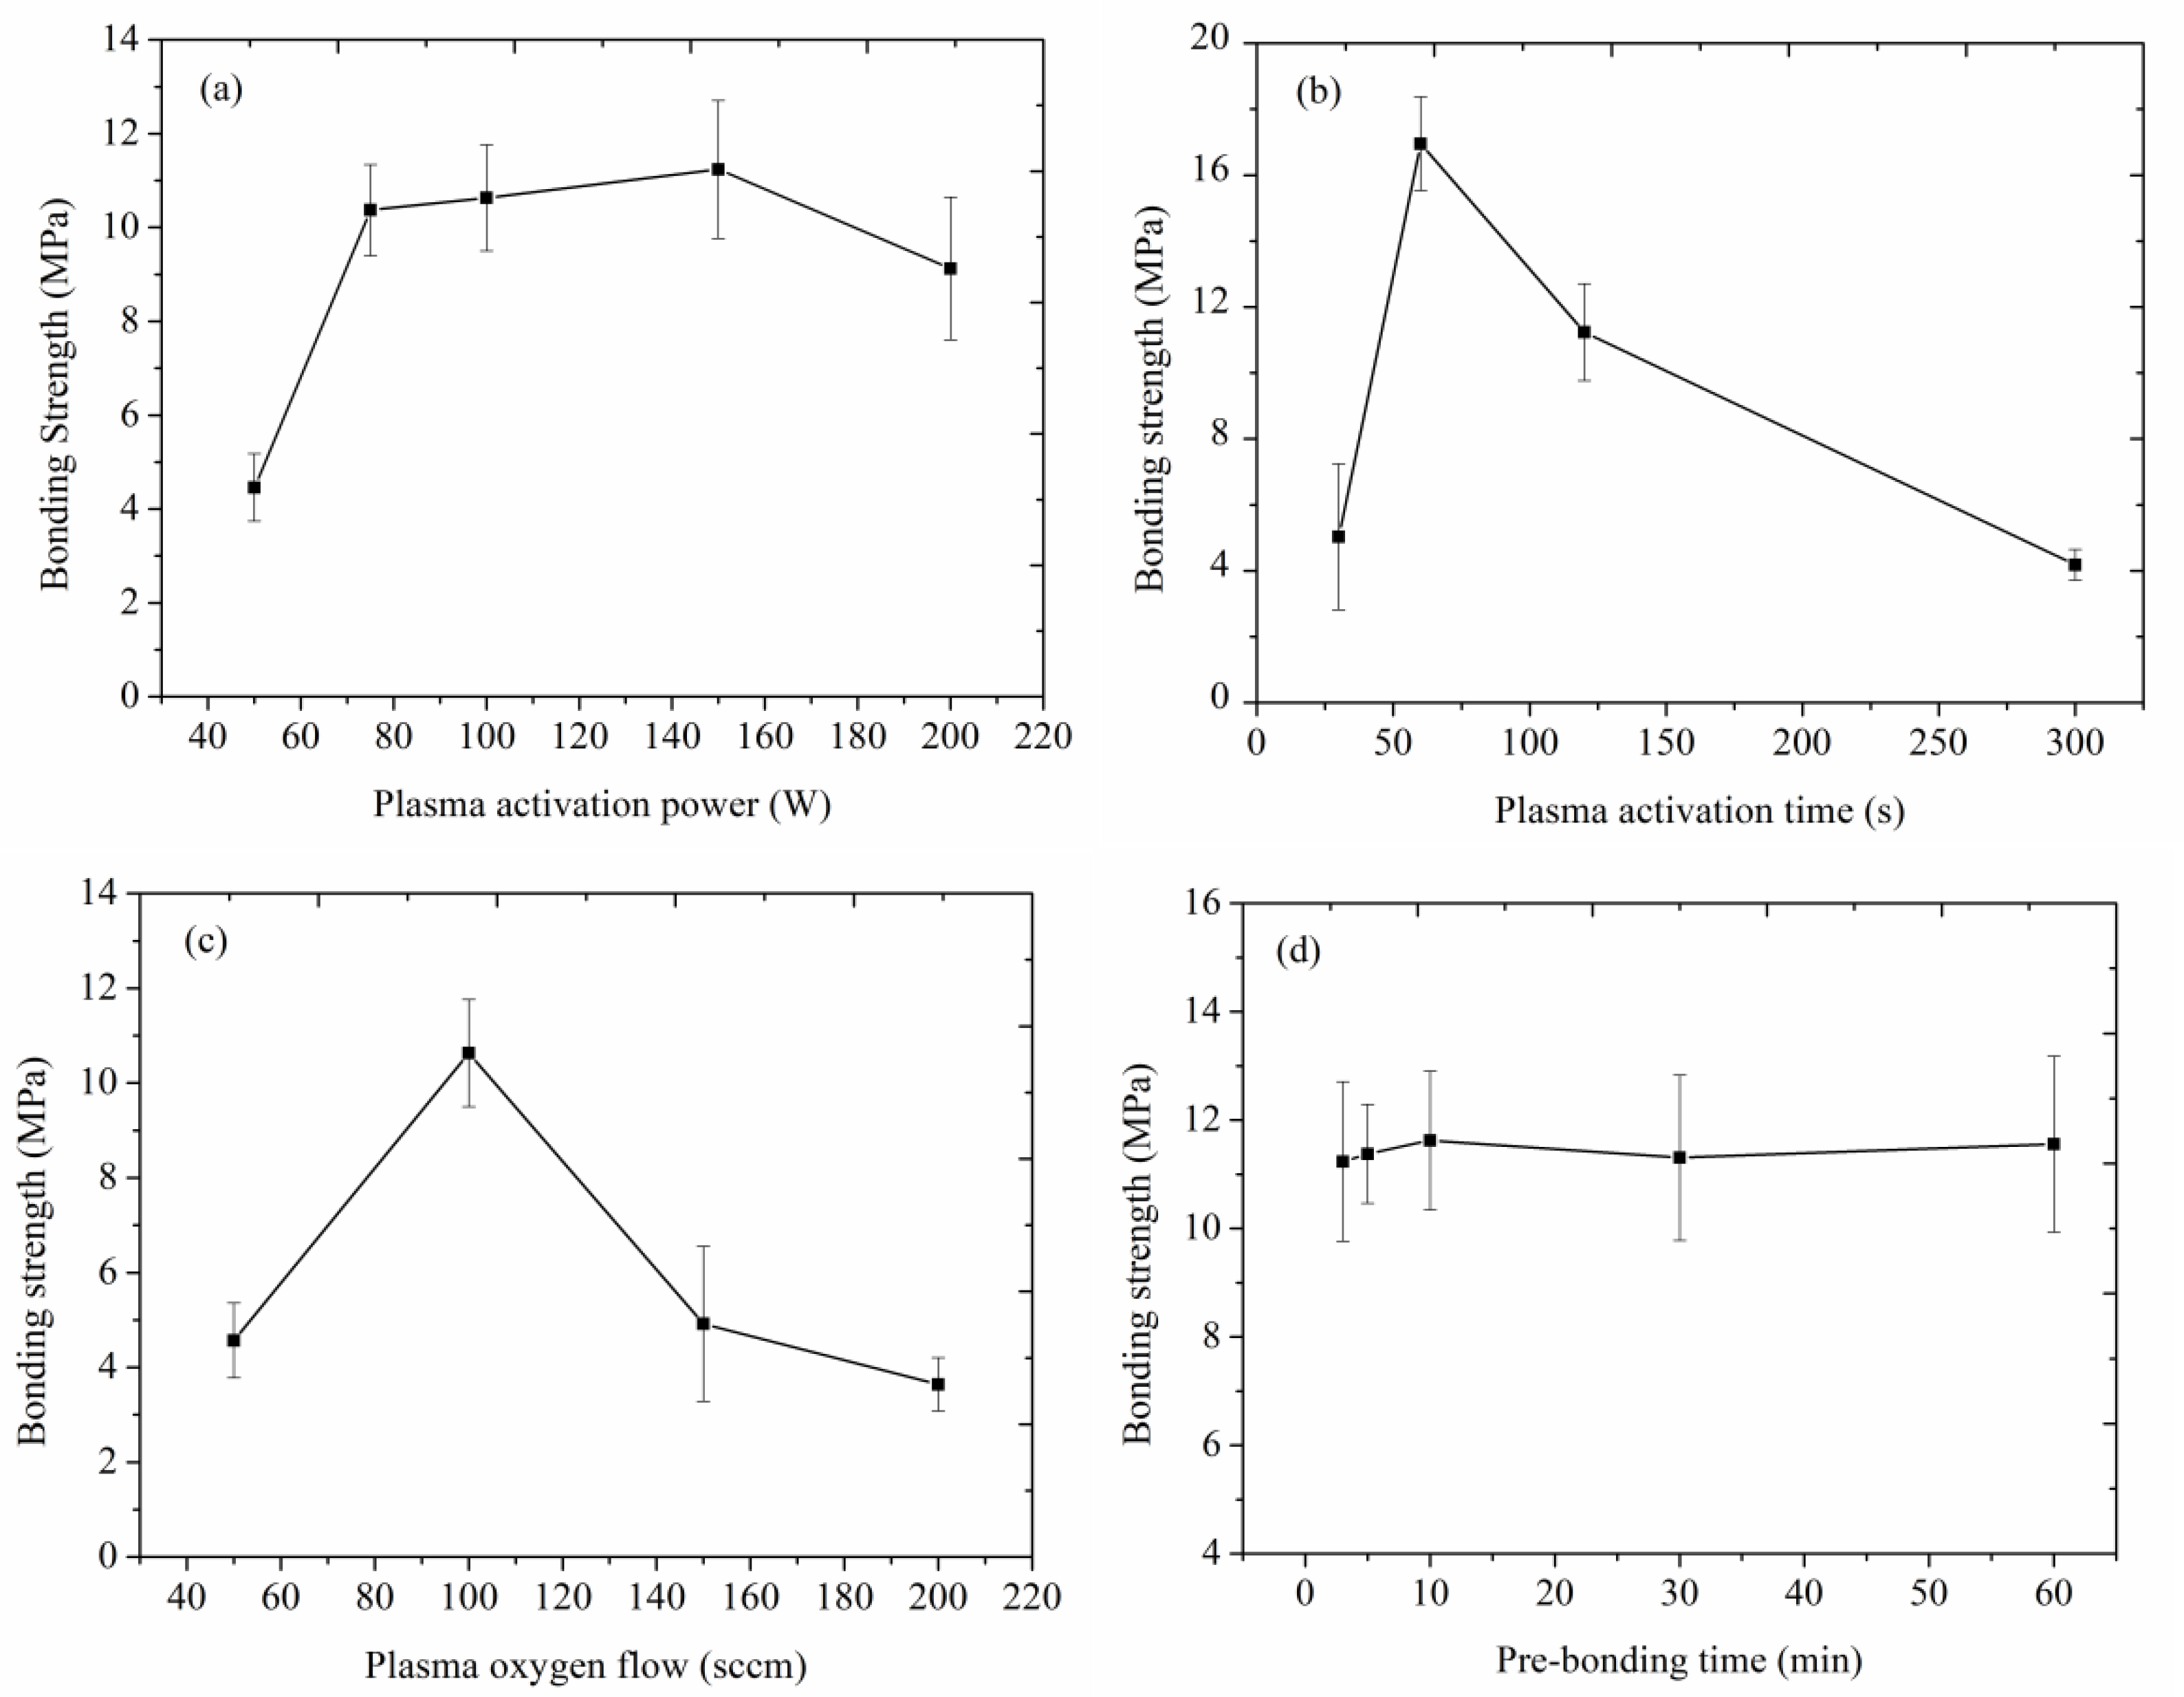
Figure 7a illustrates the effect of O2 plasma activation power on bonding strength. It can be seen that, with the increase of activation power, the average bonding strength initially increases and then decreases. That is because a higher O2 plasma activation power results in greater ions’ energy, and then the bombardment on the Si surface is more obvious. Therefore, more dangling bonds form on the Si wafer surface, and more H2O is adsorbed. Thus, the surface energy is higher, resulting in a higher bonding strength, as analyzed in Section 3. However, when the activation power increases from 150 W to 200 W, the average bonding strength decreases from 11.23 MPa to 9.12 MPa. On the one hand, the increase of activation power results in the increase of hydrophilicity. Excessive H2O is adsorbed on the wafer surface, causing “overreaction” between wafers. Therefore, a lot of H2O and H2 are produced during annealing. Some of them are adsorbed by bonding interface or Si substrate, and others gather to form interfacial voids, resulting in the decrease of bonding strength. On the other hand, the ions’ physical bombardment is so serious that some damages on Si surface emerge. With the activation power increasing from 150 W to 200 W, the surface roughness increases from 0.120 nm to 0.281 nm (as shown in Figure 4). The increase of surface roughness prevents the closure of bonding interface, as a result the bonding strength decreases. Similarly, the average bonding strength reaches a maximum value of 16.59 MPa when the plasma activation time is 60 s. Whether the activation time decreases or increases, it will lead to a rapid decrease of bonding strength, as shown in Figure 7b. This is also the composite effect of surface morphology and chemical state on Si wafer surface. Shorter O2 plasma activation time results in a lower surface energy, whose contact angle is higher, as shown in Table 1. Thus, the Si wafer surface cannot absorb enough H2O molecules to form Si-OH bond for dehydration and condensation reaction in the subsequent bonding and annealing process, and the bonding strength is low. Although long-time O2 plasma activation can make the Si wafer surface more active, excessive O2 bombardment not only cause excessive H2O on the Si surface, but also increase surface roughness (as shown in Figure 4), both are not beneficial to Si/Si wafer direct bonding.
The effect of O2 flow on bonding strength is also studied, as shown in Figure 7c. The optimal O2 flow for the maximum average bonding strength is 100 sccm in our experiment. With the increase of O2 flow, the ion density increases and the activity of the Si wafer surface enhances. Then, the Si surface can adsorb more H2O to form Si-OH bond. The high Si-OH density results in a large number of Si-O-Si bond, and the bonding strength increases. However, as the O2 flow increases to 150 sccm, excessive ion bombardment on the Si wafer surface occurred. A strong hydrophilic Si surface is formed, whose contact angle is 3.69°. As a result, the surplus Si-OH bonds produce a lot of H2O and H2 molecules at the bonding interface when annealing, and many interfacial voids appear and the bonding strength decreases [25]. Otherwise, the pre-bonding time has little effect on average bonding strength, as shown in Figure 7d. Close contact and chemical reaction between Si wafers are completed within 3 min, and the average bonding strength is higher than 10.63 MPa. There is a slightly increase of bonding strength as the pre-bonding time increase to 10 min, but the small difference can be ignored because of it is insignificant in comparison to the measurement error. Thus, the optimized pre-bonding time is 3 min. These results are consistent with our previous work [30], indicating that this activation method has good applicability for different activation equipment.
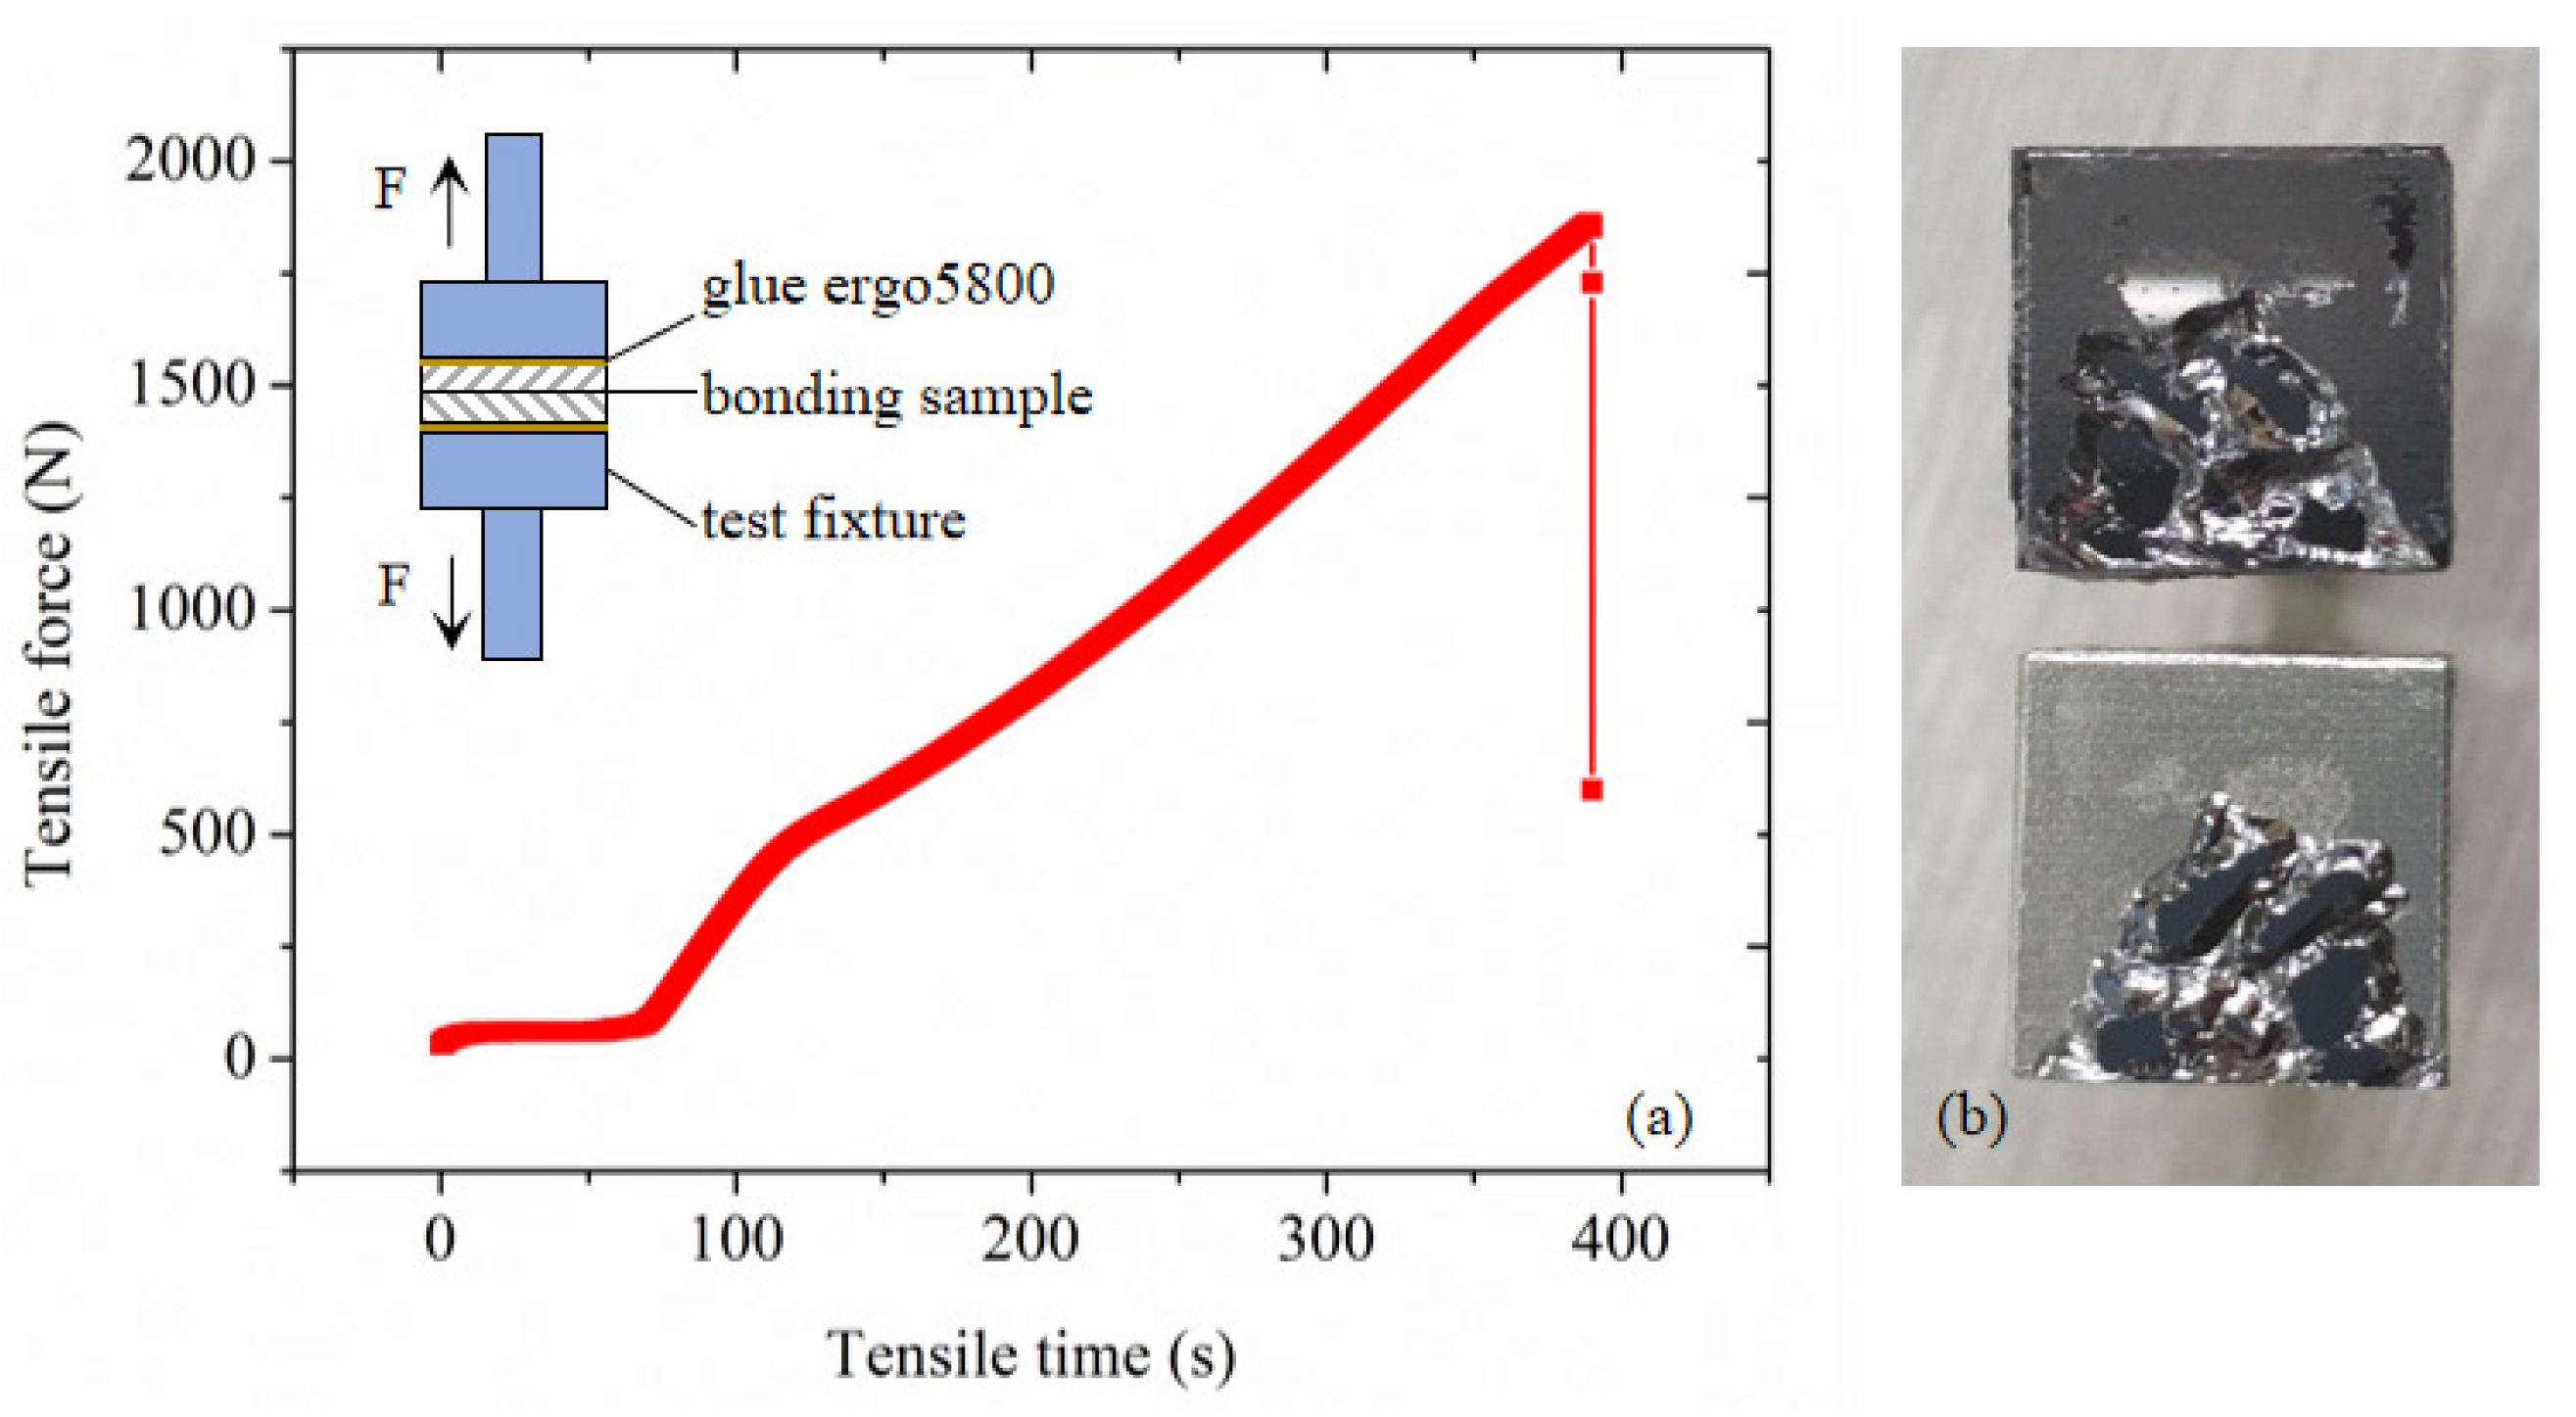
According to the above experiments, the optimized bonding parameters are obtained. The plasma activation power is 150 W, O2 flow is 100 sccm, activation time is 60 s and pre-bonding time is 3 min. Figure 8 illustrates the testing results of the tensile testing for an optimized sample. It is seen that the sample fractures when the tensile force is 1858 N, so the maximum bonding strength is 18.58 MPa (with the bonding area is 1 cm2). The interfacial fracture photograph shows that, the bonding sample breaks partly from adhesive surface of glue and silicon, and others from bulk silicon and bonding interface. The fracture area from glue and silicon interface accounts for 70.4% of the total area, which is because of the low adhesion strength of ergo 5800 and silicon. The results show that, the actual bonding strength is higher than the testing results, indicating the bonding strength is higher than the breaking strength of bulk Si 16 MPa.

4.3. Microstructure of Bonding Interface

The microstructure of Si/Si bonding interface obtained by combined hydrophilic activation with O2 flow of 100 sccm, activation power of 150 W, activation time of 60 s, pre-bonding time of 3 min and annealing temperature of 350 °C is studied by SEM and TEM. Figure 9a is the SEM image of Si/Si bonding interface. It is evident that the bonding interface is smooth and void free, a tightly bond at microscale has been successfully achieved. In order to further analyzing the microstructure and chemical composition of the bonding interface, the TEM samples are prepared by focused ion beam (FIB), as shown in Figure 9b. The cross-sectional HRTEM images in Figure 9c show that direct bonding at atomic scale has been realized. A 3.58 nm thick amorphous transition is clearly observed across the bonding interface. Additionally, the STEM image of the bonding interface at HAADF mode is shown in Figure 9d, the line scanning is conducted along the arrow direction. To test the element distribution and content of the interface, the elemental mapping is also identified by energy-dispersive X-ray spectroscopy (EDX), as presented in Figure 9e,f. It shows that the components of the amorphous transition layer are O and Si element, and the two elements diffused into each other. It indicates that stable SiOx layer has been formed and intermolecular bonding has been realized. Figure 9g presents the atomic ratio of O and Si at the bonding interface. The O and Si atoms distributed uniformly at the bonding interface, and the atomic fraction is almost the same, indicating that the bonding interface are mainly Si-O structures.

4.4. Electrical Characteristics

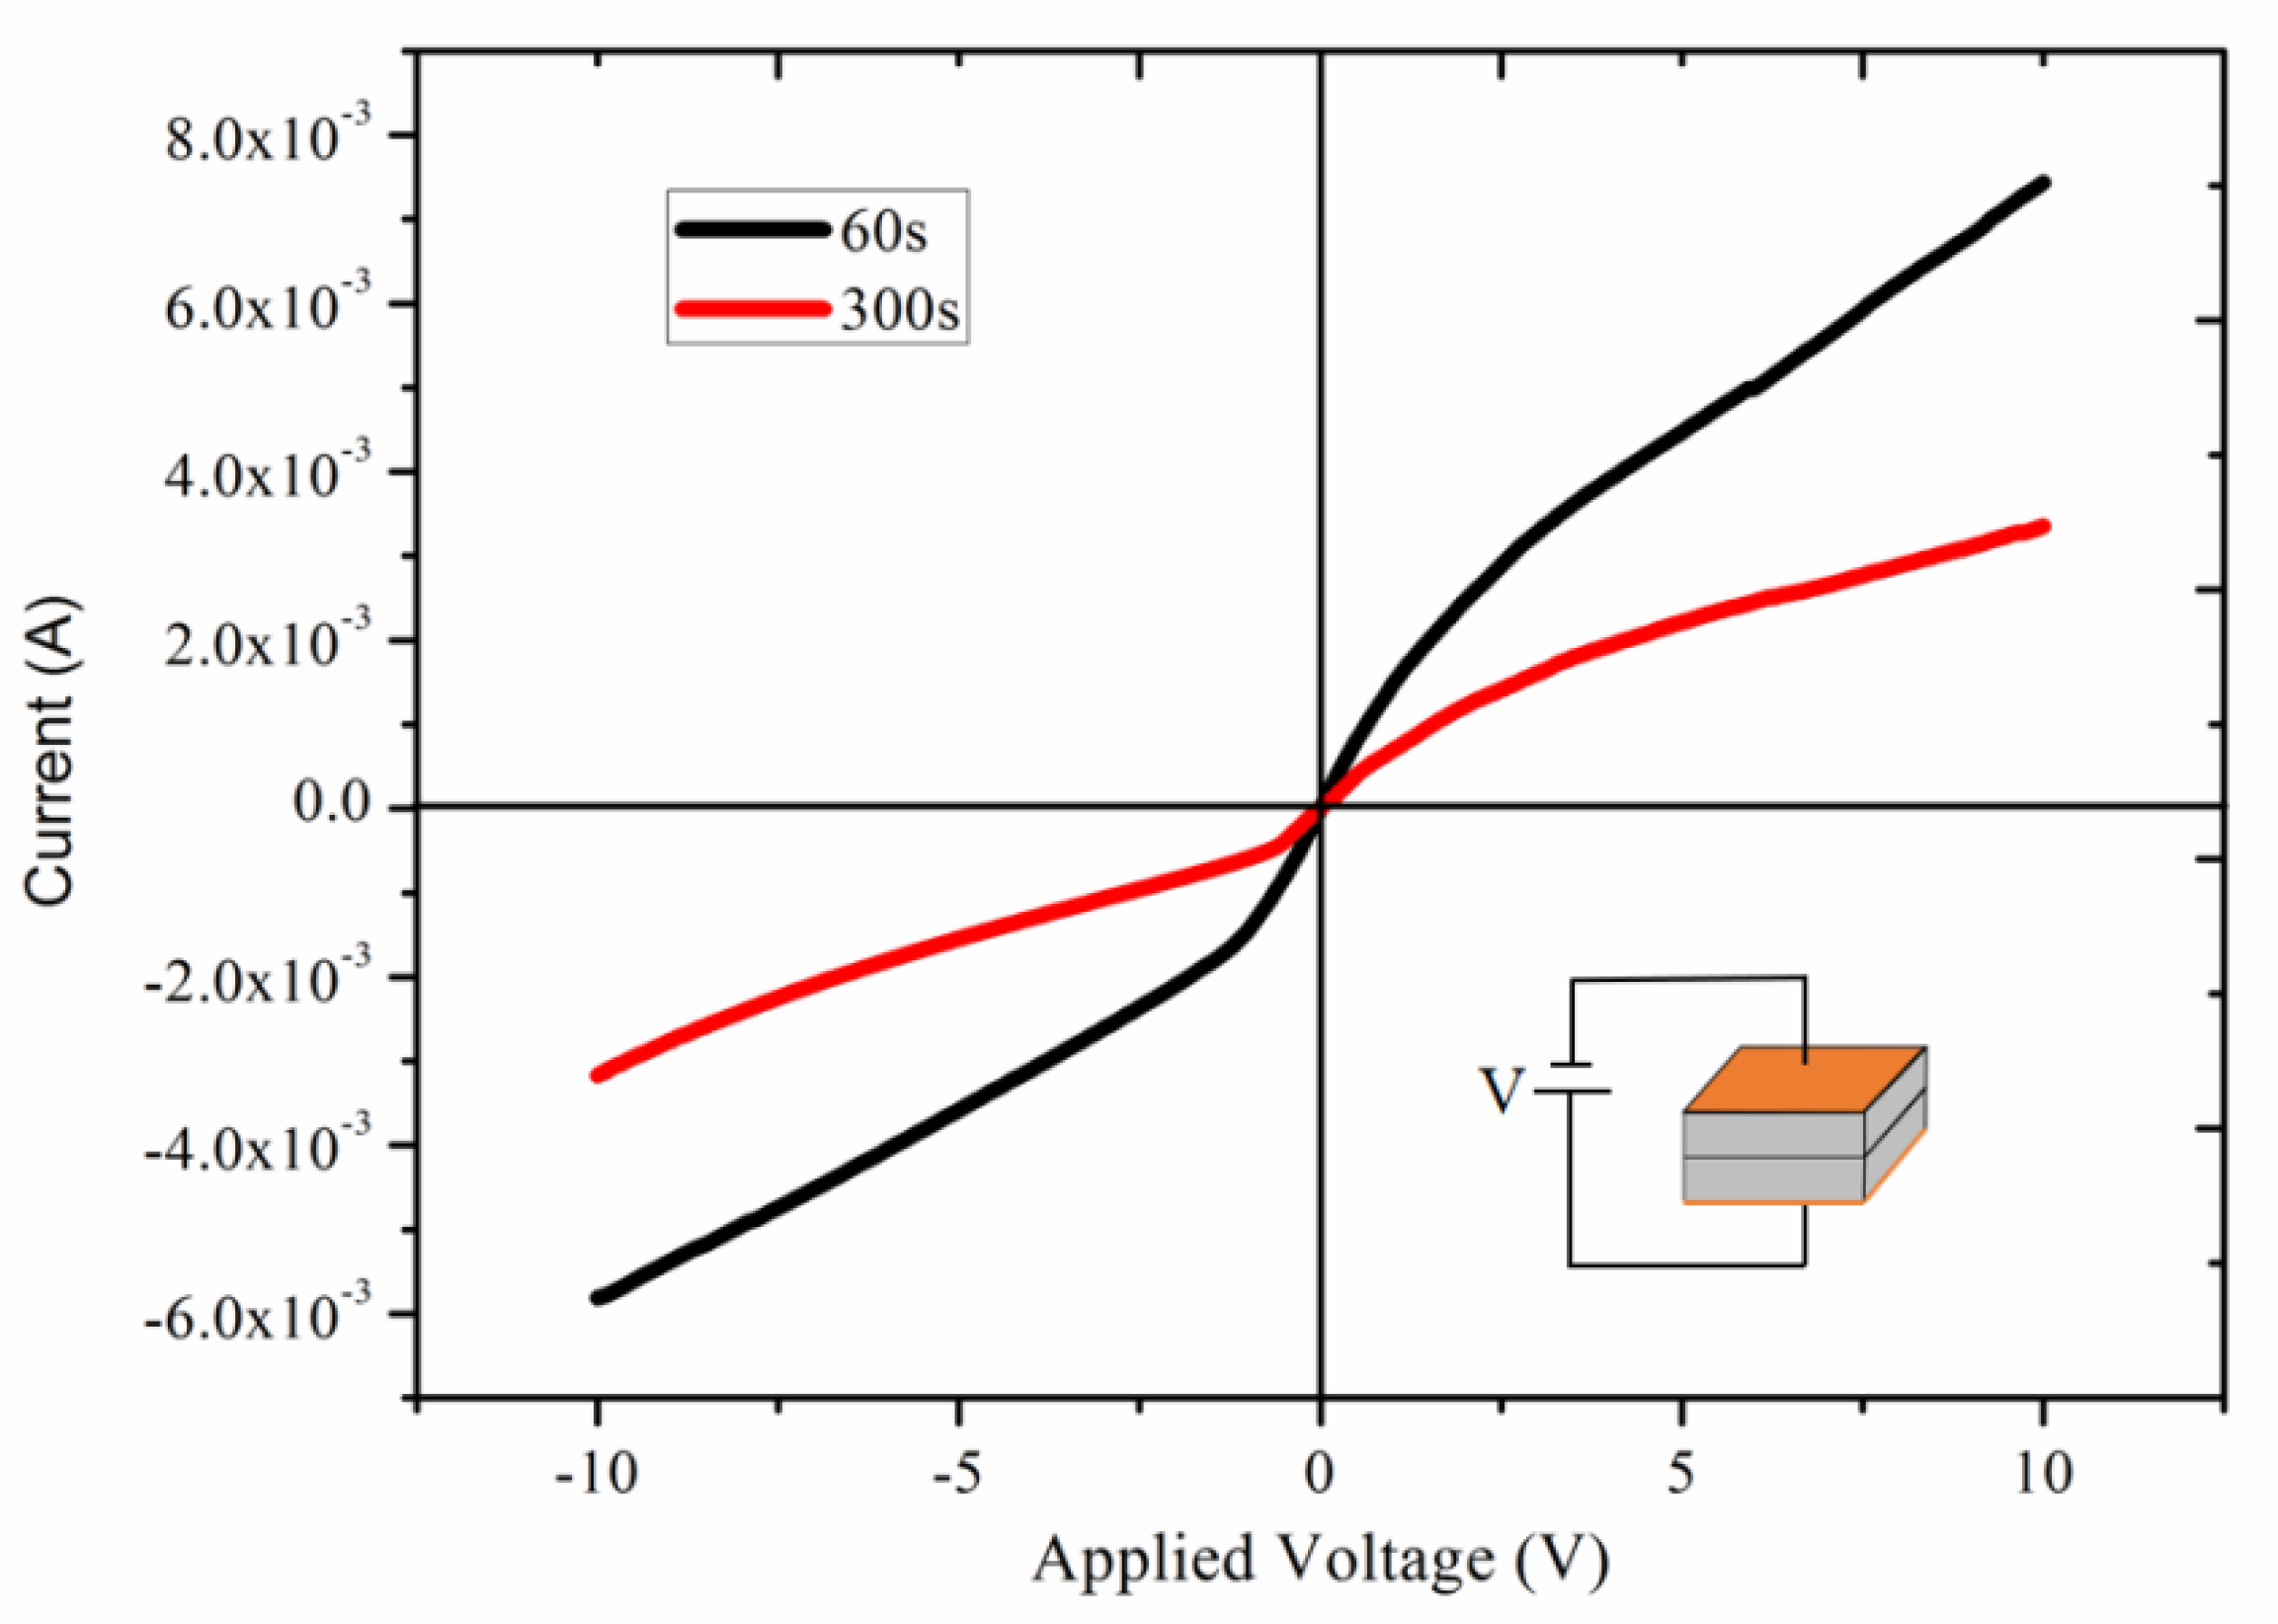
Electrical property of the bonding interface is crucial for microelectronic and optoelectronic devices. I-V characteristics of Si/Si bonding interface are tested by the semiconductor parameter analyzer, and the I-V curves with different O2 plasma activation time are shown in Figure 10. Both samples are activated by O2 plasma activation with O2 flow rate of 100 sccm, activation power of 150 W and annealed at 350 °C for 2 h. It can be seen that the bulk resistances of the bonded samples at 5 V bias voltage is 1.2 kΩ and 2.3 kΩ, respectively, when the O2 plasma activation time is 60 s and 300 s. Both of these values are much higher than the bulk Si resistance 0.2–0.4 Ω used in the experiments, whose resistivity is 2–4 Ω·cm, length is 0.1 cm and area is 1 cm2. On the one hand, the high resistance is caused by the existence of an amorphous SiOx layer, which induces an additional energy state at the bonding interface. On the other hand, O2 plasma activation will generate induced charges at the bonding interface; thus, the fixed oxide charges and the interface trap density increase. These oxide charges form a depletion region and generate additional energy states at the bonding interface, resulting in the increase of the barrier height [31] and further raise the resistance. Otherwise, the resistance increases with the increase of O2 plasma activation time. A longer plasma activation time causes a thicker SiOx layer, and the potential barrier at the bonding interface increases [24]. The dense bubbles at the bonding interface (as shown in Figure 5, sample 3) can also degrade the electrical properties.
Furthermore, the positive and negative voltage bidirectional scanning is carried out to analyze the influence of interfacial state on electrical performance across the bonding interface, as shown in Figure 11. It can be seen that the I/V curves do not coincide with each other as the applied voltage changing from negative to positive and then from positive to negative. This is attributed to the loose amorphous SiOx layer at the bonding interface, which causes the capacitance effect during testing. At this time, the charge storage and release of the interfacial state cannot keep up with the change of voltage, so the current shifts. Compared with Figure 10, it is evident that a longer O2 plasma activation makes the current shift greatly during positive and negative voltage bidirectional scan. This is due to the thicker SiOx layer at the bonding interface. The bonding voids caused by surplus H2 and H2O are also crucial for current shift. The existence of voids and SiOx layer at the bonding interface make the interfacial state more serious, so the charge filling and releasing speed cannot keep up with the voltage changing speed. To further improve the electrical properties of the bonding interface, much efforts must to be done to reduce interfacial effect.

5. Conclusions

In summary, we have investigated and optimized a low temperature Si/Si wafer direct bonding process using wet chemical activation and O2 plasma activation. Based on the mechanism of combined hydrophilic bonding, surface hydrophilicity, bonding strength, microstructure and electrical characteristics of bonding interface are analyzed. The H2O molecules management is controlled by O2 plasma activation power, activation time and O2 flow. The contact angle measurement shows that O2 plasma activation can render the wafer surface highly hydrophilic. The contact angle shows a decreasing trend as the O2 plasma activation time, activation power and O2 flow increasing. FTIR spectrum analysis shows that H2O molecules play an important role in Si/Si hydrophilic wafer direct bonding, which affects not only the formation of interfacial voids, but also bonding strength. An optimal amount of H2O molecules on Si wafer surface is needed for excellent bonding. In our experiment, the optimized contact angle controlled by O2 plasma activation process is 4.56°. The bonding strength is more than 18.58 MPa with O2 flow rate of 100 sccm, activation power of 150 W, activation time of 60 s, pre-bonding time of 3 min and annealing temperature of 350 °C. The SEM and TEM images show that the bonding interface is smooth and void free. An amorphous SiOx layer of 3.58 nm has been clearly observed across the bonding interface, indicating the intermolecular bonding has been realized between wafers. The I/V measurements show that the current transportation across the bonding interface is related to O2 plasma activation time and voids density. Longer activation time results in bigger resistance. The amorphous SiOx layer will induce an additional energy state, resulting in the increase of the barrier height. Thus, the resistance of the bonded pairs is much higher than the Si samples used in the experiment. Furthermore, dense interfacial voids will make the interfacial state more serious and degrade the electrical properties. These studies give a comprehensive understanding of hydrophilic wafer direct bonding, and can be of great aid to realize high quality bonding for MEMS and optoelectronic devices.

Author Contributions

Initiating project, D.L.; experiments and data analysis X.C. and M.D.; draft preparation, D.L. and F.L.; review and editing, Y.Z. All authors have read and agreed to the published version of the manuscript.

Funding

This research was funded by the National Natural Science Foundation of China, grant number 61804016.

Institutional Review Board Statement

Not applicable.

Informed Consent Statement

Not applicable.

Data Availability Statement

Not applicable.

Conflicts of Interest

The authors declare no conflict of interest.

References

  1. Jeon, Y.R.; Han, H.; Choi, C. Thin Si wafer substrate bonding and de-bonding below 250 °C for the monolithic 3D integration. Sens. Actuators A 2018, 281, 222–228. [Google Scholar] [CrossRef]
  2. Zhenga, Z.; Yao, Y.; Liu, J.A.; Sun, Y.H.; Yeow, J.T.W. Highly sensitive CMUT-based humidity sensors built with nitride-to-oxide wafer bonding technology. Sens. Actuators B Chem. 2019, 294, 123–131. [Google Scholar] [CrossRef]
  3. Kikuchi, T.; Bai, L.; Mitarai, T.; Yagi, H.; Furukawa, M.; Amemiya, T.; Nishiyama, N.; Arai, H. Enhanced bonding strength of InP/Si chip-on-wafer by plasma-activated bonding using stress-controlled interlayer. Jpn. J. Appl. Phys. 2020, 59, SBBD02. [Google Scholar] [CrossRef]
  4. Takigawa, R.; Higurashi, E.; Asano, T. Room-temperature wafer bonding of LiNbO3 and SiO2 using a modified surface activated bonding method. Jpn. J. Appl. Phys. 2018, 57, 06HJ12. [Google Scholar] [CrossRef]
  5. Ke, S.Y.; Ye, Y.J.; Wu, J.Y.; Ruan, Y.J.; Zhang, X.Y.; Huang, H.; Wang, J.Y.; Xu, J.F.; Li, C.; Chen, S.Y. Interface characteristics of different bonded structures fabricated by low-temperature a-Ge wafer bonding and the application of wafer-bonded Ge/Si photoelectric device. J. Mater. Sci. 2019, 54, 2406–2416. [Google Scholar] [CrossRef]
  6. Koga, Y.; Kurita, K. Fabrication of silicon on insulator wafer with silicon carbide insulator layer by surface-activated bonding at room temperature. Jpn. J. Appl. Phys. 2020, 59, 051002. [Google Scholar] [CrossRef]
  7. Veerappan, M.; Mukannan, A.; Salleh, F.; Shimura, Y.; Hayakawa, Y.; Ikeda, H. Fabrication of high quality, thin Ge-on-insulator layers by direct wafer-bonding for nanostructured thermoelectric devices. Semicond. Sci. Technol. 2017, 32, 035021. [Google Scholar] [CrossRef]
  8. Yokoyama, M.; Yokoyama, H.; Takenaka, M.; Takagi, S. InGaSb-on-insulator p-channel metal-oxide semiconductor field-effect transistors on Si fabricated by direct wafer bonding. J. Appl. Phys. 2019, 125, 114501. [Google Scholar] [CrossRef]
  9. Christiansen, S.H.; Singh, R.; Gosele, U. Wafer direct bonding: From advanced substrate engineering to future applications in micro/nano electronics. Proc. IEEE 2006, 94, 2060–2106. [Google Scholar] [CrossRef]
  10. Wang, C.X.; Xu, J.K.; Zeng, X.R.; Tian, Y.H.; Wang, C.Q.; Suga, T. Low-temperature wafer direct bonding of silicon and quartz glass by a two-step wet chemical surface cleaning. Jpn. J. Appl. Phys. 2018, 57, 02BD02. [Google Scholar] [CrossRef] [Green Version]
  11. Gong, K.W.; Sun, C.Z.; Xiong, B.; Han, Y.J.; Hao, Z.B.; Wang, J.; Wang, L.; Li, H.T. Effect of NH4OH treatment on plasma-assisted InP/Al2O3/SOI direct wafer bonding. Phys. Status Solidi A 2018, 215, 1700739. [Google Scholar] [CrossRef]
  12. Howlader, M.M.R.; Zhang, F.; Kim, M.J. Annealing temperature-dependent interfacial behavior of sequentially plasma-activated silicon bonded wafers. J. Microelectromech. Syst. 2011, 20, 17–20. [Google Scholar] [CrossRef]
  13. Fukushima, T.; Hashiguchi, H.; Yonekura, H.; Kino, H.; Murugesan, M.; Bea, J.-C.; Lee, K.-W.; Tanaka, T.; Koyanagi, M. Oxide-Oxide thermocompression direct bonding technologies with capillary self-assembly for multichip-to-wafer heterogeneous 3d system integration. Micromachines 2016, 7, 10. [Google Scholar] [CrossRef] [PubMed] [Green Version]
  14. He, R.; Yamauchi, A.; Suga, T. Sequential plasma activation methods for hydrophilic direct bonding at sub-200 degrees C. Jpn. J. Appl. Phys. 2018, 57, 6. [Google Scholar] [CrossRef]
  15. Wang, C.X.; Higurashi, E.J.; Suga, T. Silicon wafer bonding by modified surface activated bonding methods. In Proceedings of the 6th International IEEE Conference on Polymers and Adhesives in Microelectronics and Photonics, Polytronic 2007, Tokyo, Japan, 16–18 January 2007; pp. 36–40. [Google Scholar]
  16. Gong, K.W.; Sun, C.Z.; Xiong, B.; Han, Y.J.; Hao, Z.B.; Wang, J.; Wang, L.; Li, H.T. Oxides formation on hydrophilic bonding interface in plasma-assisted InP/Al2O3/SOI direct wafer bonding. AIP Adv. 2017, 7, 015039. [Google Scholar] [CrossRef] [Green Version]
  17. Mu, F.; Iguchi, K.; Nakazawa, H.; Takahashi, Y.; He, R.; Fujino, M.; Suga, T. Room temperature SiC-SiO2 wafer bonding enhanced by using an intermediate si nano layer. ECS J. Solid State Sci. Technol. 2017, 6, 227–230. [Google Scholar] [CrossRef]
  18. Takigawa, R.; Matsumae, T.; Yamamoto, M.; Higurashi, E.; Asano, T.; Kanaya, H. Demonstration of GaN/LiNbO3 hybrid wafer using room temperature surface activated bonding. ECS J. Solid State Sci. Technol. 2020, 9, 045005. [Google Scholar] [CrossRef]
  19. Eichler, M.; Hennecke, P.; Nagel, K.; Gabriel, M.; Klages, C.P. Plasma activation as a pretreatment tool for low temperature direct wafer bonding in microsystems technology. ECS Trans. 2012, 50, 265–276. [Google Scholar] [CrossRef]
  20. Wang, C.X.; Wang, Y.; Tian, Y.H.; Wang, C.Q.; Suga, T. Room-temperature direct bonding of silicon and quartz glass wafers. Appl. Phys. Lett. 2017, 110, 221602. [Google Scholar] [CrossRef]
  21. Wang, C.X.; Liu, Y.N.; Suga, T. A comparative study: Void formation in silicon wafer direct bonding by oxygen plasma activation with and without fluorine. ECS J. Solid State Sci. Technol. 2017, 6, 7–13. [Google Scholar] [CrossRef]
  22. Cocheteau, N.; Maurel-Pantel, A.; Lebon, F.; Mazerolle, F.; Rosu, I.; Ait-Zaid, S.; De Larclause, I.S. Influence of roughness on mechanical strength of direct bonded silica and Zerodur® glasses. Int. J. Adhes. Adhes. 2016, 68, 87–94. [Google Scholar] [CrossRef]
  23. Rieutord, F.; Tardif, S.; Nikitskiy, I.; Fournel, F.; Tedjini, M.; Larrey, V.; Bridoux, C.; Morales, C.; Landruc, D.; Kononchuk, O. Water transport within silicon direct bonding gap. ECS Trans. 2018, 86, 39–47. [Google Scholar] [CrossRef]
  24. Kibria, M.G.; Zhang, F.; Lee, T.H.; Kim, M.J.; Howlader, M.M.R. Comprehensive investigation of sequential plasma activated Si/Si bonded interfaces for nanointegration on the wafer scale. Nanotechnology 2010, 21, 134011. [Google Scholar] [CrossRef] [PubMed] [Green Version]
  25. Du, M.; Li, D.L.; Liu, Y.F. Investigation of plasma activated Si-Si bonded interface by infrared image based on combination of spatial domain and morphology. Micromachines 2019, 10, 445. [Google Scholar] [CrossRef] [Green Version]
  26. Fournela, F.; Continnia, L.; Moralesa, C.; Da Fonseca, J.; Moriceau, H.; Martin-Cocher, C.; Rieutord, F.; Barthelemy, A.; Radu, I. Direct bonding energy in anhydrous atmosphere. ECS Trans. 2012, 50, 3–16. [Google Scholar] [CrossRef]
  27. He, R.; Fujino, M.; Yamauchi, A.; Suga, T. Combined surface-activated bonding technique for low-temperature hydrophilic direct wafer bonding. Jpn. J. Appl. Phys. 2016, 55, 04EC02. [Google Scholar] [CrossRef]
  28. Tedjini, M.; Fournel, F.; Moriceau, H.; Larrey, V.; Landru, D.; Kononchuk, O.; Tardif, S.; Rieutord, F. Interface water diffusion in silicon direct bonding. Appl. Phys. Lett. 2016, 109, 111603. [Google Scholar] [CrossRef]
  29. Egorov, S.A.; Binder, K. When does Wenzel’s extension of Young’s equation for the contact angle of droplets apply A density functional study. J. Chem. Phys. 2020, 152, 194707. [Google Scholar] [CrossRef]
  30. Li, D.L.; Shang, Z.G.; Wang, S.Q.; Wen, Z.Y. Low temperature Si/Si wafer direct bonding using a plasma activated method. J. Zhejiang Univ.-Sci. C 2013, 14, 244–251. [Google Scholar] [CrossRef]
  31. Jung, A.; Zhang, Y.; Dasilva, Y.A.R.; Isa, F.; von Känel, H. Electrical properties of Si-Si interfaces obtained by room temperature covalent wafer bonding. J. Appl. Phys. 2018, 123, 085701. [Google Scholar] [CrossRef]
Figure 1. Schematic illustration of Si/Si wafer direct bonding by combined hydrophilic activation method.
Processes 09 01599 g001
Figure 2. Schematic diagram of combined hydrophilic activation. (a) The Si wafers were cleaned by SC1 → SC2 → SC1 solution, and the wafer surface is covered by Si-OH; (b) More dangling bonds and water molecules are on the Si wafer surface after O2 plasma activation; (c) An increase of thickness of hydration film on the Si wafer surface due to the megasonic cleaning; (d) The two wafers pre-bond at room temperature by hydrogen bonds and Si-OH bonds; (e) The Si-OH bonds convert into Si-O-Si bonds as thermal annealing occurs. (f) An amorphous oxide layer at the bonding interface is formed and strong bonding is achieved.
Processes 09 01599 g002
Figure 3. Contact angle of Si wafer surfaces at different conditions. (a) Bare Si wafer without activation; (b) After wet cleaning by SC1 solution; (c) After O2 plasma activation with power of 150 W, O2 flow of 100 sccm and time of 60 s; (d) SC1 cleaning followed by O2 activation.
Processes 09 01599 g003
Figure 4. Effect of O2 plasma activation process on surface roughness.
Processes 09 01599 g004
Figure 5. The size of the interfacial voids and the IR images for samples 1–4 obtained by different O2 plasma activation parameters.
Processes 09 01599 g005
Figure 6. FTIR spectra of samples obtained by different O2 plasma activation parameters.
Processes 09 01599 g006
Figure 7. Bonding strength with (a) plasma activation power (with O2 flow of 100 sccm, activation time of 120 s), (b) plasma activation time (with activation power of 150 W, O2 flow of 100 sccm), (c) plasma O2 flow (with activation power of 100 W, activation time of 120 s), (d) pre-bonding time (with activation power of 100 W, O2 flow of 100 sccm, activation time of 120 s).
Processes 09 01599 g007
Figure 8. Tensile pulling testing. (a) The fracture force of the bonded sample. (b) The interfacial fracture samples after testing.
Processes 09 01599 g008
Figure 9. Microstructure and composition of Si/Si bonding interface. (a) SEM image. (b) TEM sample fabricated by FIB. (c) HRTEM image. (d) STEM image at HADDF mode and the line scan direction. (e) and (f) are the EDX mappings of O and Si elements, respectively. (g) Atomic ratio of silicon and oxygen at the bonding interface.
Processes 09 01599 g009
Figure 10. I-V characteristics of Si/Si bonding interface prepared by O2 plasma activation with activation time of 60 s and 300 s.
Processes 09 01599 g010
Figure 11. Forward and backward scanning I-V curves for Si/Si bonding samples prepared by O2 plasma activation time of 60 s (a) and 300 s (b).
Processes 09 01599 g011
Table 1. Bonding samples with different O2 plasma activation parameters.
No.Power
/W
O2 Flow
/Sccm
Time
/S
Contact Angle/°Bonding Strength/Mpa
Mean and SD
Testing ResultsMean and SD 1
1150100604.734.594.354.56 ± 0.1916.95 ± 1.42
21501001203.713.354.213.76 ± 0.4311.23 ± 1.47
31501003002.773.883.733.46 ± 0.604.18 ± 0.47
4100501203.984.394.044.14 ± 0.224.46 ± 0.72
51001001203.764.044.264.02 ± 0.2510.63 ± 1.63
61001501203.273.933.863.69 ± 0.363.64 ± 0.56
7501001205.505.284.975.25 ± 0.276.80 ± 0.26
82001001203.493.353.713.52 ± 0.189.12 ± 1.52
1 SD is the standard deviation.
Publisher’s Note: MDPI stays neutral with regard to jurisdictional claims in published maps and institutional affiliations.