Abstract
This study aimed to analyze solute carrier family 27 (SLC27) in glioblastoma tumors. The investigation of these proteins will provide insight into how and to what extent fatty acids are taken up from the blood in glioblastoma tumors, as well as the subsequent fate of the up-taken fatty acids. Tumor samples were collected from a total of 28 patients and analyzed using quantitative real-time polymerase chain reaction (qRT–PCR). The study also sought to explore the relationship between SLC27 expression and patient characteristics (age, height, weight, body mass index (BMI), and smoking history), as well as the expression levels of enzymes responsible for fatty acid synthesis. The expression of SLC27A4 and SLC27A6 was lower in glioblastoma tumors compared to the peritumoral area. Men had a lower expression of SLC27A5. Notably, a positive correlation was observed between the expression of SLC27A4, SLC27A5, and SLC27A6 and smoking history in women, whereas men exhibited a negative correlation between these SLC27s and BMI. The expression of SLC27A1 and SLC27A3 was positively correlated with the expression of ELOVL6. In comparison to healthy brain tissue, glioblastoma tumors take up fewer fatty acids. The metabolism of fatty acids in glioblastoma is dependent on factors such as obesity and smoking.
1. Introduction
Glioblastoma is the most aggressive form of glioma, categorized as grade 4 [1]. Its annual incidence is approximately four cases per 100,000 people [2,3]. Despite current treatment modalities, which include surgical resection, radiation therapy, and chemotherapy with temozolomide (TMZ) [4,5], this brain tumor has an exceedingly dismal prognosis. The median survival rate of patients with this malignancy does not surpass 1.5 years [2], and only a small fraction of patients, roughly 7%, survive beyond five years following diagnosis [2]. Given the extremely unfavorable prognosis for patients with glioblastoma, extensive research is underway to better understand the tumor mechanisms of this disease and develop novel therapeutic approaches. One of the areas of investigation in glioblastoma research pertains to fatty acid metabolism within the tumor.
Fatty acids represent a fundamental component of both cell and intracellular membranes, as well as a crucial source of energy and a precursor to the production of lipid mediators. The synthesis of fatty acids can occur de novo or, in the case of essential polyunsaturated fatty acids (PUFA), through the elongation and desaturation of other PUFAs [6]. The uptake of fatty acids by cells is facilitated by a variety of transporters, including the cluster of differentiation 36 (CD36) [7] and solute carrier family 27 (SLC27) [8]. For fatty acids to be utilized in cellular metabolism, they must first be activated by conversion to a fatty acyl coenzyme A (CoA) through the catalytic activity of acyl-CoA synthetases [8]. The SLC27A family comprises six members, denoted as SLC27A1 to SLC27A6 [8]. Previously, these proteins were referred to as very-long-chain acyl-CoA synthetases (ACSVL) or fatty acid transport proteins (FATP). The primary function of these enzymes is to catalyze the conversion of unesterified fatty acids to fatty acyl-CoA, while also facilitating the transport of fatty acids across the cell membrane. It is important to note that these enzymes must be localized in the cell membrane to carry out their transport function directly. Another important feature of acyl-CoA synthetases is the channeling of fatty acids [8], whereby a specific fatty acid is directed towards a particular metabolic pathway by a corresponding acyl-CoA synthetase, dependent on protein–protein interactions and subcellular localization of the synthetase [9].
SLC27A1/ACSVL5/FATP1 exhibits activity towards saturated fatty acids (SFA), particularly palmitic acid C16:0, as well as a much higher activity towards lignoceric acid C24:0 [10,11,12]. It can also activate arachidonic acid C20:4n-6 [13]. SLC27A1 is responsible for fatty acid transport [14]. SLC27A1 is located in the endoplasmic reticulum [15] and plays a role in triglyceride and ceramide synthesis [9,16,17,18]. It also directs fatty acids towards β-oxidation [18,19]. There is high expression of SLC27A1 in the brain [20,21] where it participates in the transport of fatty acids across the blood–brain barrier (BBB) in conjunction with SLC27A4 [22], with a particular role in the transport of docosahexaenoic acid (DHA) C22:6n-3 [23,24].
SLC27A2/ACSVL1/FATP2 is an enzyme that activates SFAs, including palmitic acid C16:0 and lignoceric acid C24:0 [25], as well as arachidonic acid C20:4n-6 [13]. SLC27A2 in peroxisomes plays a role in the β-oxidation of very-long-chain fatty acids [26] and contributes to the synthesis of glycerophospholipids, specifically in the incorporation of arachidonic acid C20:4n-6 and DHA C22:6n-3 [27]. Additionally, SLC27A2 is involved in ceramide synthesis [9] and is responsible for fatty acid uptake [13,28]. In the brain, SLC27A2 is expressed at very low levels [21,29,30].
SLC27A3/ACSVL3/FATP3 is an enzyme that activates SFA, namely stearic acid C18:0, behenic acid C22:0, and lignoceric acid C24:0 [31,32]. SLC27A3 participates in the synthesis of ceramides, as demonstrated by experiments on U87 MG cells [32]. Notably, SLC27A3 does not play a role in fatty acid uptake [13]. Furthermore, SLC27A3 is involved in the tumorigenesis of glioblastomas, particularly in the functioning of glioblastoma stem cells [33]. However, expression of SLC27A3 in the brain is very low [21,31].
SLC27A4/ACSVL4/FATP4 demonstrates activity towards palmitic acid C16:0 and significantly greater activity towards lignoceric acid C24:0 [12,34]. It also activates arachidonic acid C20:4n-6 [13]. SLC27A4 is responsible for fatty acid uptake [13,28,35]. This protein participates in the production of triglycerides [17,36], cholesterol esters [36], and ceramide [9]. SLC27A4 is highly expressed in the brain [21,34]. In the brain, SLC27A1 and SLC27A4 work together in the transport of fatty acids through the BBB [22].
SLC27A5/ACSVL6/FATP5 shows activity towards very-long-chain SFA, particularly stearic acid C18:0, and cerotic acid C26:0 [37]. Additionally, this enzyme displays bile acid-CoA ligase activity [38]. SLC27A5 is localized in the cell membrane and is responsible for fatty acid uptake, resulting in the production of triglycerides, glycerophospholipids, and cholesteryl esters [39]. The expression of SLC27A5 is very low in the brain [21,39].
SLC27A6/ACSVL2/FATP6 is a cardiac-specific isoform [40]. SLC27A6 activates arachidonic acid C20:4n-6 and exhibits weak very-long-chain acyl-CoA synthetase activity towards lignoceric acid C24:0 [13]. This protein preferentially transports palmitic acid C16:0 [40]. The expression of SLC27A6 is very low in the brain [21].
Recent research has shown that long-chain and very-long-chain fatty acids can initiate signal transduction by interacting with receptors or transporters. One example is CD36, which can activate a number of signaling pathways, including cAMP, Ca2+, Src (which activates phospholipase C (PLC), liver kinase B1 (LKB1), and insulin receptor β (IRβ)), ERK MAPK, vascular endothelial growth factor receptor 2 (VEGFR2), and peroxisome proliferator-activated receptor δ (PPARδ) [41]. Furthermore, long-chain and very-long-chain fatty acids can function as ligands for G protein-coupled receptors, including free fatty acid receptor (FFAR)1/G protein-coupled receptor (GPR)40 and FFAR4/GPR120 [41,42]. FFAR1/GPR40 is associated with Gq, Gi, and Gs, while FFAR4/GPR120 only with Gq. However, according to data from the GEPIA portal, these receptors do not appear to play significant roles in glioblastoma cancer processes. Specifically, the expression levels of FFAR1/GPR40 and FFAR4/GPR120 do not differ significantly between GBM tumors and healthy brain tissue, nor are they significantly associated with patient prognosis [43].
Acyl-CoA synthetases can trigger signal transduction upon activation by fatty acids, utilizing unesterified fatty acids, free coenzyme A (CoASH), and ATP as substrates, and producing fatty acyl-CoA and AMP as products [44,45]. AMP functions as a second messenger and is capable of activating AMP-activated protein kinase (AMPK), thereby participating in signal transduction [45].
In our previous investigations, we examined the expression and function of desaturases [46] and elongases [47] in glioblastoma. The findings of our research provided novel insights into the fatty acid biosynthesis within glioblastoma tumors. Nevertheless, the lipid metabolism in this malignancy remains insufficiently elucidated. The objective of this study is to examine the expression of SLC27 in glioblastoma tumors and to investigate whether patient characteristics are linked to the expression of these genes. Furthermore, the study aims to explore the correlation between the expression of SLC27 and the essential enzymes responsible for fatty acid synthesis in glioblastoma tumors.
2. Materials and Methods
2.1. Patient Samples
In 2014, the Department of Biochemistry and the Department of Neurosurgery and Pediatric Neurosurgery at Pomeranian Medical University in Szczecin initiated a research project that aimed to investigate purinergic receptors in glioblastoma tumors. Samples of glioblastoma tumors were obtained from consenting patients, and the project received ethical approval from the local bioethical commission (KB-0012/96/14) and was conducted in accordance with the Declaration of Helsinki. The research project was subsequently expanded to include the analysis of enzymes involved in lipid metabolism, which was also approved by the local bioethical commission (KB-0012/96/14-A-3).
The study analyzed SLC27 genes in 28 glioblastoma tumors obtained from 16 male and 12 female patients at the Department of Neurosurgery and Pediatric Neurosurgery of the Pomeranian Medical University in Szczecin, Poland (Table 1). Patients were diagnosed with brain tumors using magnetic resonance imaging (MRI) or computed tomography (CT) scans. Upon detection of a brain tumor, patients were eligible for surgical tumor removal. Surgery was performed under standard general anesthesia with endotracheal intubation. Craniotomy and tumor resection were performed according to the classical method, which involved bone removal and dura incision, tumor visualization, resection, biopsy for histopathological examination, closure of the dura, bone restoration in some patients, and the closure of subcutaneous tissue and skin in others. A computer station of a neuronavigation device was used during the surgical procedure to estimate the position of surgical instruments in relation to the glioblastoma tumor with a precision of 2–3 mm. After surgical tumor removal, a histopathological examination was performed to confirm the glioblastoma diagnosis. Patients included in the study were over 18 years old and had been diagnosed with glioblastoma.

Table 1.
Characteristics of the patients.
Tumor samples were collected from two regions of the glioblastoma tumor (Figure 1) [48,49]: the non-enhancing tumor core located in the central part of the glioblastoma tumor and the enhancing tumor region, which usually surrounds the tumor core. A sample was also taken from the peritumoral area, which is a commonly used control in glioblastoma research that is compared to the glioblastoma tumor [50].
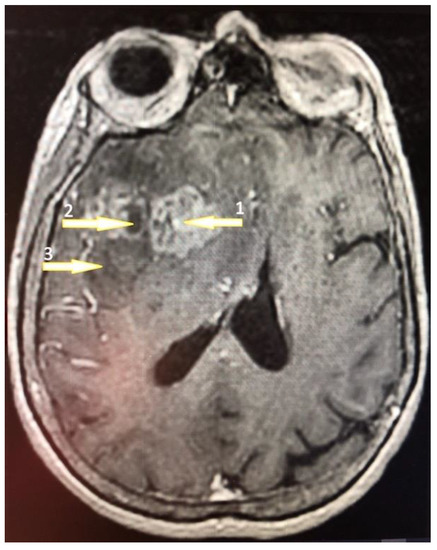
Figure 1.
A 61-year-old high school teacher was admitted to the department of neurosurgery on a day of a seizure episode. She was confused and developed a palmomental reflex on her right side with no other symptoms. Brain nuclear magnetic resonance (NMR) with contrast enhancement revealed a multiform expansive mass in the left frontal lobe with an irregularly shaped growth zone (1) and necrotic core (2) surrounded by the peripheral edematic area (3). The tumor was removed totally by craniotomy and the patient was discharged on the 8th day postoperatively. The pathology revealed a GBM diagnosis and the patient was treated subsequently by an irradation dose of 60 Gy.
2.2. Quantitative Real-Time Polymerase Chain Reaction (qRT–PCR)
Two-step qRT–PCR was used to analyze the expression of SLC27 genes in the U-87 MG glioblastoma cell line and patient samples. RNA was extracted from clinical specimens using the RNeasy Lipid Tissue Mini Kit (Qiagen, Hilden, Germany) and from U-87 MG cells using the RNeasy Mini Kit (Qiagen). The First Strand cDNA synthesis kit and oligo-dT primers (Fermentas, Waltham, MA, USA) were used for cDNA synthesis. Quantitative analysis of selected mRNAs was performed using an ABI 7500 Fast instrument with Power SYBR Green PCR Master Mix reagent (Applied Biosystems, Waltham, MA, USA) with the following PCR protocol: 95 °C for 15 s, 40 cycles at 95 °C for 15 s, and 60 °C for 1 min. Ct values were used for subsequent analysis, and glyceraldehyde-3-phosphate dehydrogenase (GAPDH) was used as the endogenous control [51]. The results were calculated as the fold difference (2^dCt) and subjected to statistical analysis. The data were presented as the absolute expression of the tumor tissue. The following primer pairs were used:
| hSLC27A1F | GGGGCAGTGTCTCATCTATGG; |
| hSLC27A1R | CCGATGTACTGAACCACCGT; |
| hSLC27A2F | TTTCCGCCATCTACACAGTCC; |
| hSLC27A2R | CGTAGGTGAGAGTCTCGTCG; |
| hSLC27A3F | CCCTGCTGGAATTAGCGATTT; |
| hSLC27A3R | GGGCGAGGTAGATCACATCTT; |
| hSLC27A4F | GGACCCAGGTGGGATTCTC; |
| hSLC27A4R | CGCGCCTGATGGTCTTGAT; |
| hSLC27A5F | TGGAGGAGATCCTTCCCAAGC; |
| hSLC27A5R | TGGTCCCCGAGGTATAGATGAA; |
| hSLC27A6F | CTTCTGTCATGGCTAACAGTTCT; |
| hSLC27A6R | AGGTTTCCGAGGTTGTCTTTTG. |
In this study, we did not obtain results for SLC27A2, characterized by very low expression in the brain [21,29,30]. GEPIA analyses also show that the level of SLC27A2 expression is about 200 times lower in glioblastoma than in other SLC27 genes [43].
2.3. Statistical Methods
The expression levels of SLC27 members were normalized to the reference gene GAPDH. Statistical significance was analyzed using Statistica v.13 software. Results with p ≤ 0.05 were considered statistically significant. The Shapiro–Wilk test indicated that the results did not follow a normal distribution. Therefore, non-parametric tests were used. Wilcoxon’s signed-rank tests were used to analyze differences in SLC27 expression between different regions and under different culture conditions. Spearman rank correlation coefficients were used to analyze correlations between SLC27 genes, patient characteristics, and expression levels of enzymes involved in the fatty acid synthesis.
3. Results
3.1. SLC27A4 and SLC27A6 Expression in the Glioblastoma Tumor Was Lower Than in the Peritumoral Area
Changes in the expression of individual SLC27 genes may contribute to alterations in the metabolism of fatty acids in glioblastoma tumors. Therefore, in the first stage of the study, the expression of SLC27A genes was examined in two regions of the glioblastoma: the enhancing tumor region and the tumor core. The expression of selected genes was also analyzed in the peritumoral area, which is commonly considered as a control to which the results of the glioblastoma tumor analysis can be compared [50].
The expression levels of SLC27A1, SLC27A3, and SLC27A5 did not differ between the two analyzed regions of the glioblastoma tumor and the peritumoral area in all patients (Figure 2). However, in the enhancing tumor region and the tumor core, the expression of SLC27A4 was significantly lower compared to the peritumoral area (p = 0.0007 and p = 0.004, respectively). Similarly, the expression of SLC27A6 was also significantly lower in the enhancing tumor region and the tumor core compared to the peritumoral area (p = 0.014 and p = 0.0019, respectively).
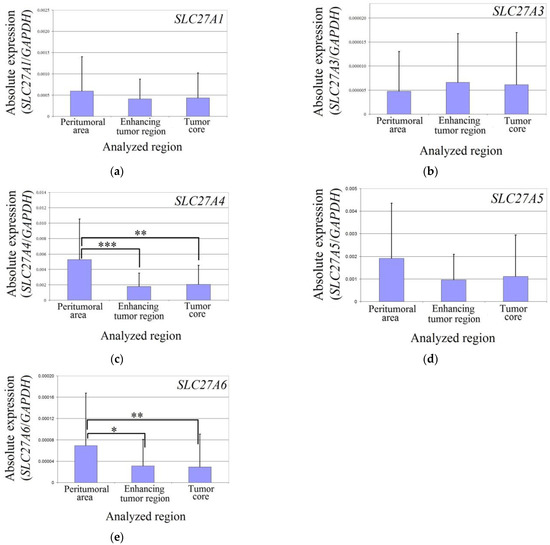
Figure 2.
Expression of SLC27As in glioblastoma tumor and peritumoral area. The expression level of SLC27A1 (a), SLC27A3 (b), SLC27A4 (c), SLC27A5 (d), and SLC27A6 (e) in the peritumoral area, enhancing tumor region, and tumor core. *—denotes statistically significant differences in the expression of the gene between different regions of a glioblastoma tumor as determined by the Wilcoxon signed-rank test (p < 0.05); **—p < 0.01; ***—p < 0.001.
3.2. When Comparing Tumors between Sexes, the Expression of Different SLC27As Differed in Glioblastoma Tumors
Lipid metabolism is dependent on sex, particularly on sex hormones. Studies on breast cancer have shown that estrogen receptor-β (ER-β) increases the expression of SLC27A1 [52]. Estrogen receptors also influence the expression of long-chain acyl-CoA synthetases, other enzymes responsible for the activation of fatty acids. Specifically, estrogen receptor-α (ER-α) decreases the expression of acyl-CoA synthetase long-chain family member 4 (ACSL4) [53]. Due to the possibility of differences in the expression of the investigated SLC27 genes based on the sex of the patients, the expression results of SLC27A representatives were analyzed by sex and compared to each other.
The expression of SLC27A1 was reduced in the tumor core of female glioblastoma patients compared to the enhancing tumor region (p = 0.03) and peritumoral area (p = 0.0002). Additionally, the expression of SLC27A1 in the tumor core of female glioblastoma patients was lower than in male patients (p = 0.000003).
In the studied regions of glioblastoma tumors, the expression of SLC27A3 did not differ from the peritumoral area in males and females. However, in the enhancing tumor region (p = 0.04) and tumor core (p = 0.017), the expression of SLC27A3 was lower in female patients than in male patients.
The expression of SLC27A4 was lower in both males and females in the enhancing tumor region (in females p = 0.019; in males p = 0.004) and tumor core (in males p = 0.004) compared to the peritumoral area.
In males, the expression of SLC27A5 was lower in the glioblastoma tumor (in the enhancing tumor region p = 0.05 and in the tumor core p = 0.01) compared to the peritumoral area. However, the expression of SLC27A5 in the tumor core was lower than in the enhancing tumor region (p = 0.04). In females, the expression of SLC27A5 was higher in the tumor core compared to the enhancing tumor region (p = 0.019). Additionally, the expression of SLC27A5 in the tumor core was higher in females than in males (p = 0.00003).
The expression of SLC27A6 was reduced in both sexes (Figure 3). In female patients, the expression of SLC27A6 in the enhancing tumor region was lower than in the peritumoral area (p = 0.04). However, there was no difference in the expression of SLC27A6 between the tumor core and peritumoral area in female patients (p > 0.05). In male patients, the expression of SLC27A6 in the tumor core was lower than in the peritumoral area (p = 0.0009). Additionally, the expression of SLC27A6 in the tumor core was lower than in the enhancing tumor region (p = 0.006).
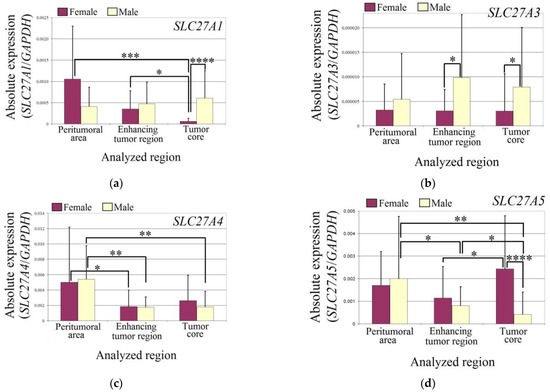

Figure 3.
The expression levels of SLC27A genes (a) SLC27A1 (b) SLC27A3 (c) SLC27A4 (d) SLC27A5 (e) SLC27A6 in the glioblastoma tumor and peritumoral area in male and female patients. Wilcoxon signed-rank tests were used to estimate statistically significant differences in gene expression (p < 0.05 for *, p < 0.01 for **, p < 0.001 for ***, and p < 0.0001 for ****).
3.3. The Expression of SLC27A1 and SLC27A3 Negatively Correlated with the Expression of SLC27A4, SLC27A5, and SLC27A6
SLC27 representatives may have similar functions [13]. They may be responsible for the channeling of fatty acids for the production of specific lipids [8]. Additionally, the action of individual SLC27 representatives may exclude each other if they induce the channeling of fatty acids to different metabolic pathways. Therefore, to demonstrate the correlations between individual SLC27 representatives, the correlation between the expression levels of the investigated genes was analyzed.
The expression of SLC27A1 and SLC27A3 negatively correlated with the expression of SLC27A4, SLC27A5, and SLC27A6. The expression correlation between different regions of the tumor was rare. Only two SLC27 genes, SLC27A3 and SLC27A4, showed a correlation between their expression in the enhancing tumor region and the tumor core of the glioblastoma. Specifically, a negative correlation was found between the peritumoral area and the tumor core for SLC27A1, suggesting differences in fatty acid metabolism between these two regions.
In general, the expression levels of SLC27 genes were highly correlated within the same group. There was a negative correlation between each SLC27 gene in the first group and the second group. SLC27A1 and SLC27A3 belong to the first group, while SLC27A4, SLC27A5, and SLC27A6 belong to the second.
Positive correlations were observed between SLC27A4 and SLC27A5, SLC27A4 and SLC27A6, and SLC27A5 and SLC27A6 in all three tumor regions. In addition, a positive correlation was found between the expression of SLC27A1 and SLC27A3 in the glioblastoma tumor and between the expression of SLC27A1 and SLC27A4 in the tumor core. Negative correlations were observed between SLC27A3 and SLC27A4 in the enhancing tumor region and between SLC27A1 and SLC27A5 in the tumor core.
In rare cases, there was a correlation between the expression of different SLC27 genes in different tumor locations (Table 2). For example, a positive correlation was found between SLC27A3 in the enhancing tumor region and SLC27A1 in the tumor core, and between SLC27A4 in the peritumoral area and SLC27A6 in the tumor core. A negative correlation was found between SLC27A1 in the peritumoral area and SLC27A6 in the tumor core, between SLC27A3 in the enhancing tumor region and SLC27A5 and SLC27A6 in the tumor core, and between SLC27A3 in the tumor core and SLC27A5 in the peritumoral area.
Table 2.
The correlation between the expression of different SLC27 genes in different tumor regions in all patients.
In women, as in all patients, there was a correlation between the expression of SLC27A4 with SLC27A5, SLC27A4 with SLC27A6, and SLC27A5 with SLC27A6 (Table 3). However, no significant correlation was found between the expression of individual SLC27 genes across different regions of the glioblastoma tumor. Women also showed a negative correlation in the expression of SLC27A3 in the peritumoral area with the expression of SLC27A4, SLC27A5, and SLC27A6 in the enhancing tumor region. Women also showed a negative correlation between the expression of SLC27A1 in the peritumoral area and the expression of SLC27A3 in the tumor core.
Table 3.
The correlations between the expression of different SLC27 genes in different tumor regions in all female patients.
In men, SLC27 expression showed correlations similar to the analysis of all patients. There was a correlation of SLC27A3 expression between the enhancing tumor region and tumor core. Additionally, there was a correlation of SLC27A6 between the peritumoral area and the tumor core.
Similarly to the analysis of all patients, male samples showed a positive correlation of SLC27A1 expression with SLC27A3, SLC27A4 with SLC27A5, SLC27A4 with SLC27A6, and SLC27A5 with SLC27A6 in the studied regions of the glioblastoma tumor (Table 4). Additionally, there was a positive correlation between SLC27A5 expression in the tumor core and SLC27A6 expression in the peritumoral area and between SLC27A5 expression in the peritumoral area and SLC27A6 expression in the tumor core. There was also a negative correlation between SLC27A3 expression in the enhancing tumor region and SLC27A5 in the peritumoral area.
Table 4.
The correlation between the expression of different SLC27 genes in different tumor regions in all male patients.
3.4. The Expression of SLC27 in the Peritumoral Area Correlated with BMI
The process of carcinogenesis is extremely complex, with some models describing it as a Darwinian process in which the microenvironment plays a significant role [54]. There are various factors that contribute to carcinogenesis, which can be divided into environmental (such as pollution) and patient-related factors. Examples of the latter group include age [55], patient height [56,57], obesity [58], and smoking [59]. These characteristics influence the development of tumors. To investigate the possible correlations between SLC27 and carcinogenesis related to these characteristics, we analyzed the correlation between the expression of the investigated SLC27 genes and patient characteristics such as age, height, weight, BMI, and the number of cigarette packs smoked during their lifetime.
A correlation analysis was conducted on the expression of the investigated SLC27 representatives with patient characteristics such as age, height, weight, BMI, and the number of cigarette packs smoked in their lifetime. Across all patients, a correlation was found between the expression levels of the investigated SLC27 and BMI in the peritumoral area. For SLC27A1, a positive correlation was observed, while for SLC27A4, SLC27A5, and SLC27A6, a negative correlation was found. Additionally, a negative correlation was found between SLC27A5 expression in the tumor core and BMI. Furthermore, a negative correlation was found between the expression of SLC27A1 in the peritumoral area and patient age. Additionally, a positive correlation was observed between the expression of SLC27A1 in the tumor core and patient weight.
In female patients with glioblastoma, a positive correlation was found between the expression of SLC27A4, SLC27A5, and SLC27A6 and the number of cigarette packs smoked in their lifetime. SLC27A4 and SLC27A6 also showed a positive correlation in the peritumoral area. Similarly to the analysis of all patients, a negative correlation was observed between the expression of SLC27A4, SLC27A5, and SLC27A6 and BMI in the peritumoral area. Furthermore, a negative correlation was found between the expression of SLC27A1 in the enhancing tumor region and a positive correlation between SLC27A1 in the enhancing tumor region and patient weight. A negative correlation was also found between the expression of SLC27A5 and patient weight in the tumor core. Additionally, a negative correlation was observed between the expression of SLC27A1, SLC27A3, SLC27A5, and SLC27A6 in the peritumoral area and patient age. A correlation was also found between the expression of SLC27A and patient age in glioblastoma. Specifically, a positive correlation was found between SLC27A1 and SLC27A4 with age in the tumor core, while a negative correlation was found with SLC27A5. In the enhancing tumor region, a positive correlation was found between age and the expression of SLC27A6 in female patients.
In male patients, a correlation was found between the expression of SLC27 in glioblastoma and BMI (Table 5). A positive correlation was observed between the expression of SLC27A1 and SLC27A3 in the enhancing tumor region, while a negative correlation was found with the expression of SLC27A4, SLC27A5, and SLC27A6. In the tumor core, a negative correlation was found between the expression of SLC27A5 and BMI. Similar to the analyses of all patients, a negative correlation was observed between the expression of SLC27A5 and BMI in the peritumoral area. Furthermore, a correlation was found between the expression of the investigated SLC27 and patient age. Specifically, a positive correlation was observed between SLC27A3 and age in the enhancing tumor region, and a negative correlation was observed with SLC27A5.
Table 5.
Correlation between expression of analyzed SLC27 genes and expression of key enzymes involved in the fatty acid synthesis.
3.5. SLC27 Expression Correlated with Major Fatty Acid Synthesis Enzymes
We conducted an analysis to investigate the correlation between the expression of SLC27 members and the expression of key fatty acid synthesis enzymes, including ELOVL1, ELOVL3, ELOVL6, SCD, and FADS2. Expression data for ELOVL1, ELOVL3, ELOVL6, SCD, and FADS2 were obtained from raw data published in our previous papers, where we examined the expression of elongases [47] and desaturases [46] in glioblastomas. ELOVL6 is involved in the synthesis of stearic acid C18:0 from palmitic acid C16:0 [6], which is responsible for the de novo synthesis of the majority of SFA and monounsaturated fatty acid (MUFA). ELOVL1 and ELOVL3 are responsible for the further elongation of stearic acid C18:0 up to 26 carbons in length [6]. According to GEPIA, these two elongases play a significant role in the tumorigenesis of glioblastomas. Elevated expression of ELOVL1 and ELOVL3 in this tumor type is associated with a poorer prognosis [43]. SCD is a desaturase responsible for the production of MUFA from SFA, while FADS2 is the first enzyme in the biosynthesis pathway of PUFA, regulating the entire pathway [6].
For all patients, we found a positive correlation between the expression of SLC27A4, SLC27A5, and SLC27A6, and the expression of SCD and FADS2 in the peritumoral area. In all studied regions, SLC27A1 expression was positively correlated with ELOVL6 expression. Furthermore, SLC27A3 expression was positively correlated with ELOVL6 expression in the enhancing tumor region and tumor core. With regard to ELOVL1 and ELOVL3, no significant correlation with the analyzed SLC27 was found in all patients.
In women, there was a positive correlation between ELOVL1 expression and SLC27A, SLC27A5, and SLC27A6 expression in the tumor core. We observed a positive correlation between the expression of SLC27A4, SLC27A5, and SLC27A6 and the expression of SCD and FADS2 in the peritumoral area. Additionally, a positive correlation between the expression of SLC27A1 and SCD, and FADS2 was observed in the peritumoral area. Finally, a positive correlation between the expression of SLC27A1 and ELOVL6 was found in the tumor core, but no correlation was observed in the enhancing tumor region.
In men, a positive correlation was observed between the expression of ELOVL1 and SLC27A1, and SLC27A3 in the tumor core (Table 6). Furthermore, a negative correlation was found between the expression of ELOVL1, and SLC27A5 and SLC27A6, which is opposite to the correlation observed in women. In men, we found a positive correlation between the expression of SLC27A4 and SLC27A6 and the expression of SCD in the peritumoral area. Additionally, a positive correlation between the expression of SLC27A1 and ELOVL6 was observed in all three studied regions.
Table 6.
Correlation between the studied SLC27 genes and the expression of key enzymes involved in fatty acid synthesis.
4. Discussion
4.1. SLC27 Expression in Glioblastoma
In this study, we showed that SLC27A4 and SLC27A6 expression was lower in the glioblastoma compared to the peritumoral area, while the expression of the other examined SLC27 genes did not differ between the glioblastoma and peritumoral area. However, it is difficult to compare our results with other scientific articles because analyses of SLC27 expression are not available in the PubMed database (https://pubmed.ncbi.nlm.nih.gov, accessed 25 February 2023). There are only two available studies that examine SLC27A3 [32,60]. Therefore, to compare our findings with other research groups, we used the Gene Expression Profiling Interactive Analysis (GEPIA) database (http://gepia.cancer-pku.cn, accessed 25 February 2022) [43] and the transcriptomic analysis of different grades of glioma conducted by Seifert et al. [61]. GEPIA contains analyses of gene expression in over 30 types of cancer, including glioblastoma [43]. These are expression analyses taken from The Cancer Genome Atlas (TCGA) [62] and data obtained from healthy tissues from the Genotype-Tissue Expression (GTEx) database [63,64]. Transcriptomic analysis of different grades of glioma conducted by Seifert et al. was analyzed using the REpository of Molecular BRAin Neoplasia DaTa (Rembrandt) [65].
In this study, we found that SLC27A1 and SLC27A5 expression did not differ between the glioblastoma and peritumoral area. These results are consistent with GEPIA [43] and Seifert et al. [61]. We also found that there was a lower expression of SLC27A4 in the glioblastoma compared to the peritumoral area, and these results were consistent with Seifert et al. [61]. However, GEPIA reports that SLC27A4 expression does not differ between glioblastomas and healthy brain tissue [43]. We also found lower expression of SLC27A6 in the glioblastoma compared to the peritumoral area. This is in contrast to GEPIA [43] and Seifert et al. [61], where SLC27A6 expression did not differ between the glioblastoma and healthy brain tissue.
In this study, we did not obtain results for SLC27A2, an enzyme characterized by very low expression in the brain [21,29,30]. GEPIA analyses also show that the level of SLC27A2 expression is about 200 times lower in glioblastoma than among other SLC27 genes [43]. As a result, it can be inferred that the level of SLC27A2 expression is below the detection threshold of the method used in this study. Furthermore, the low expression of SLC27A2 in glioblastoma tumors suggests that it does not play a significant role in the tumorigenesis processes in glioblastoma. This is supported by the lack of association between the level of SLC27A2 expression in glioblastoma tumors and patient prognosis [43].
4.2. Differences in SLC27 Expression in Glioblastoma Tumors between Sexes
In glioblastoma tumors, specifically in the tumor core, women exhibit lower expression of SLC27A1 and SLC27A3, but higher expression of SLC27A5 than men. This suggests differences in fatty acid metabolism between sexes. However, there is a lack of research on sex differences in SLC27 expression in the brain or even in other organs, and therefore, we cannot refer to the existing literature.
SLC27 shows similar activity to specific fatty acids [13]. However, SLC27A3 and SLC27A5 demonstrate weaker fatty acid activation properties compared to other SLC27 [13]. Moreover, SLC27A3, SLC27A5, and SLC27A6 show weak or no uptake properties of fatty acids [13]. SLC27A1 participates in the transport of fatty acids across the BBB [22], indicating that in women, the uptake of fatty acids from the bloodstream by tumor core cells in glioblastoma may be less intense than in men.
SLC27A3 participates in ceramide synthesis, as demonstrated in experiments on U-87 MG cells [32]. This suggests that the production of ceramides in glioblastoma tumors may be less intense in women. Ceramides play a critical role in the tumorigenesis processes in glioblastoma [32,66,67] and the higher expression of SLC27A3 is associated with a worse prognosis [32]. Therefore, this may explain the better prognosis for women with glioblastoma [68].
4.3. Correlations between the Expression of Various SLC27
Analyses of the correlation between different SLC27 in various studied regions indicate certain dependencies in fatty acid metabolism. A positive correlation of SCL27A4 expression was found between the tumor core and enhancing tumor region but not with the peritumoral area. A negative correlation of SLC27A1 expression was observed between the tumor core and the peritumoral area. SCL27A1 and SCL27A4 are important in fatty acid uptake through BBB [22]. This suggests that fatty acid uptake through BBB is similar in the two studied regions of the glioblastoma tumor, but differs significantly from the peritumoral area. Among the other SLC27, a positive correlation of SLC27A3 expression was found between all studied regions of glioblastoma. SLC27A3 is responsible for the production of ceramides, as demonstrated in experiments on U-87 MG cells [32]. This correlation indicates that ceramide synthesis may be similar between tumors and the rest of the brain. However, the lack of correlation of other SLC27 suggests that lipid metabolism significantly differs between the tumor and peritumoral area.
In our study, we found a negative correlation between the expression of SLC27A3 and the expression of SLC27A4 and SLC27A5, and a positive correlation between the expression of SLC27A3 and SLC27A1. SLC27A3 is a protein that does not participate in fatty acid uptake [13]. It is responsible for channeling fatty acids to produce ceramides, as demonstrated in experiments on U-87 MG cells [32]. SLC27A1 is responsible for the synthesis of triglycerides [16,17,18], ceramides [9], and β-oxidation [18,19], as demonstrated in other models. Meanwhile, SLC27A4 is responsible for the production of triglycerides [17,36], cholesterol esters [36], and ceramide [9]. SCL27A1 and SCL27A4 are important in fatty acid uptake through BBB [22]. SLC27A5 may be responsible for the production of triglycerides, glycerophospholipids, and cholesteryl esters [39]. The observed correlations suggest that ceramide biosynthesis may occur in glioblastoma, which precludes the use of fatty acids for the production of other lipids. Ceramide production is also positively correlated with the expression and uptake of fatty acids by SLC27A1. Moreover, a positive correlation for expression was found between SLC27A4, SLC27A5, and SLC27A6, while a negative correlation was observed between SLC27A1 and SLC27A5 expression. This suggests that the production of triglycerides, glycerophospholipids, and cholesteryl esters may depend on the uptake of fatty acids through BBB, depending on SLC27A4 but not SLC27A1.
In the tumor core, but not in the enhancing tumor region, there was a positive correlation between the expression of SLC27A1 and SLC27A4, both of which are involved in fatty acid uptake through the BBB [22]. This suggests that fatty acid uptake in the tumor core is mediated by these two proteins, whose expression levels are positively correlated. In contrast, there was no correlation between the expression of SLC27A1 and SLC27A4 in the enhancing tumor region, suggesting that fatty acid uptake in this region may depend on one of these proteins.
4.4. Correlation of SLC27 Expression with Patient Characteristics
The correlation of SLC27 gene expression with patient characteristics was analyzed, including age, BMI, height, and smoking history. Negative correlations were observed between the expression of SLC27A4, SLC27A5, and SLC27A6 and BMI in the peritumoral area of the patients, with SLC27A5 and SLC27A6 showing this correlation in both genders. Additionally, the expression of SLC27A1 was positively correlated with BMI in all patients. SLC27A1 and SLC27A4 are involved in the uptake of fatty acids by the BBB [22], with SLC27A1 specifically participating in the transport of DHA C22:6n-3 [23,24]. This suggests that in obese patients, there may be a lower expression of SLC27A4 and higher expression of SLC27A1 in the brain, indicating greater uptake of DHA C22:6n-3 by the brain. The results also indicate that lipid metabolism in the brain may be altered in obese individuals, but further research is needed to fully understand the significance of SLC27 in obesity. Currently, no experimental studies are available on this topic.
In women, there was a negative correlation between the expression of SLC27A1 and weight and BMI in the enhancing tumor region and a positive correlation with weight in the tumor core. This suggests differences in the uptake and metabolism of fatty acids between these two regions of glioblastoma tumors in lean and obese women. In the peritumoral area, there was also a negative correlation of SLC27 with weight in women. According to one available study [69], obese women have lower expression of SLC27A1 in muscle tissue compared to lean women, which may explain the negative correlation between SLC27A1 expression and BMI and weight in the enhancing tumor region of glioblastoma tumors and the peritumoral area in women. However, the cited study [69] shows no difference in SLC27A1 expression between obese and lean men. In this study, a positive correlation was found between BMI and SLC27A1 expression in the enhancing tumor region of glioblastoma tumors in men, which is inconsistent with the cited study that examined expression in muscle tissue. In men with glioblastoma tumors, there was also a negative correlation between the expression of SLC27A4, SLC27A5, SLC27A6, and a positive correlation between SLC27A1 and SLC27A3 expression with BMI. This indicates significant differences in fatty acid metabolism between obese and lean men, with greater uptake of fatty acids by the BBB involving SLC27A1 and less involving SLC27A4 in obese men [22]. This may result in increased uptake of DHA C22:6n-3 by glioblastoma tumors in obese men [23,24]. Obese men may also have higher production of ceramides [32] and less intensive metabolism of other types of lipids [39] compared to lean men.
In women, there was a negative correlation between the expression of the tested SLC27 genes and age in the peritumoral area, whereas no such relationship was observed in men. These results may indicate changes in fatty acid metabolism in the healthy brain that occur with age, especially in women. However, there is a lack of experimental studies in this direction. In the tumor core of women, there was a negative correlation between the expression of SLC27A5 and a positive correlation between the expression of SLC27A4 and SLC27A1 with age. Additionally, in the enhancing tumor region, there was a positive correlation between the expression of SLC27A6 and age. In men, there was a negative correlation between the expression of SLC27A5 and a positive correlation between the expression of SLC27A3 with age in the enhancing tumor region. These findings also indicate that the patient’s age and sex significantly affect fatty acid metabolism in glioblastoma tumors.
In women, there was a positive correlation between the expression of SLC27A4, SLC27A5, and SLC27A6 with cigarette smoking in all investigated regions of the glioblastoma tumor and in the peritumoral area, whereas no such relationship was observed in men. These data suggest that cigarette smoking in women with glioblastoma may affect carcinogenesis and, consequently, may influence fatty acid metabolism in the tumor. However, there is a lack of available studies on the influence of cigarette smoking on the expression of SLC27 enzymes in tumors, including lung cancer. Therefore, further research is needed to investigate the association between cigarette smoking and fatty acid metabolism in tumors in women.
4.5. Correlation with Enzymes Involved in Fatty Acid Synthesis
We have demonstrated a positive correlation between the expression of SLC27A1 and SLC27A3 and the expression of ELOVL6 in both the glioblastoma tumor and the peritumoral area. Furthermore, we have identified a positive correlation between the expression of SLC27A4, SLC27A5, and SLC27A6 and the expression of SCD and FADS2 in the peritumoral area. These findings shed some light on the metabolic pathways of fatty acids in glioblastoma tumors.
ELOVL6 participates in the synthesis of stearic acid C18:0 from palmitic acid C16:0 [6], while SCD and FADS2 are involved in the production of MUFAs and PUFAs, respectively. SLC27 proteins transport fatty acids across the cell membrane and activate the transported fatty acids [13,28,35]. These proteins exhibit activity towards various fatty acids from different groups [13]. Specifically, they activate SFAs (palmitic acid C16:0, stearic acid C18:0, lignoceric acid C24:0, and cerotic acid C26:0 [12,13,37]), MUFAs (oleic acid C18:1n-9) [13], and PUFAs (arachidonic acid C20:4n-6) [13]. However, the possibility of transporting and activating other fatty acids (such as linoleic acid C18:2n-6) has not been studied. The high activity of SLC27 towards various fatty acids suggests that other fatty acids may also be transported and activated by these proteins.
SLC27A1 and SLC27A4 are the most important SLC27 proteins involved in the transport of fatty acids across the BBB [22]. Our data suggest a correlation between the transport of palmitic acid C16:0 by SLC27A1 across the BBB and the elongation of this fatty acid. This provides insights into the potential effects of drugs targeting SLC27A1. SLC27A3 exhibits similar properties, although it does not account for fatty acid uptake [13]. It may be crucial for intracellular fatty acid metabolism, particularly in the synthesis of ceramides, as evidenced by experiments on U-87 MG cells [32]. Moreover, fatty acids transported by SLC27A4 across the BBB undergo different modifications in the peritumoral area. SFAs (palmitic acid C16:0 and stearic acid C18:0) are desaturated, i.e., transformed into MUFAs. In contrast, 18-carbon PUFAs are activated and transformed into longer PUFAs, such as arachidonic acid C20:4n-6, eicosapentaenoic acid C20:5n-3, and docosahexaenoic acid C22:6n-3. Interestingly, the observed correlations indicate that SLC27A5 and SLC27A6 exhibit similar activities to SLC27A4, although a correlation with FADS2 was only observed in the peritumoral area. This suggests that such a correlation does not occur in the glioblastoma tumor itself.
In women, a positive correlation was observed between the expression of ELOVL1 and SLC27A4, SLC27A5, and SLC27A6 in the tumor core. This finding suggests that very-long-chain SFAs may be taken up from the blood by SLC27A4 and subsequently elongated by ELOVL1 to be incorporated into triglycerides, glycerophospholipids, and cholesteryl esters in the tumor core. In contrast, in men, a positive correlation was found between the expression of ELOVL1 and SLC27A1 and SLC27A3, and a negative correlation with SLC27A5 and SLC27A6, which is opposite to the correlation observed in women. This indicates that the metabolism of very-long-chain SFAs differs between sexes. In men, very-long-chain SFAs may be elongated and incorporated into ceramides after uptake by SLC27A1.
4.6. Clinical Significance of the Obtained Results
Analyses on the GEPIA portal show that the expression level of any SLC27 gene is not significantly associated with prognosis for patients with glioblastoma [43]. However, comparing the highest and lowest quartiles of SLC27 expression, a trend towards worse outcomes with higher expression of SLC27A4 (p = 0.062) and SLC27A3 (p = 0.083) was observed for glioblastoma patients [43]. This suggests that these two SLC27 representatives may have important clinical significance as a therapeutic target.
According to Kolar et al., analyzing The Chinese Glioma Genome Atlas, higher expression of SLC27A3 in glioblastoma tumors is associated with worse outcomes [32]. This suggests that this protein plays a significant role in the tumorigenic processes in this cancer type. This enzyme activates fatty acids and channels them towards ceramide production [32]. SLC27A3 is essential in the stemness and self-renewal of glioblastoma stem cells [33], as well as in the proliferation and anchorage-independent growth of glioma cells [60]. Currently, no published studies on the significance of SLC27A4 in glioblastoma tumorigenesis are available on the PubMed browser (https://pubmed.ncbi.nlm.nih.gov/, accessed 25 February 2022). However, SLC27A4 is known to play a crucial role in brain physiology by participating in the transport of fatty acids across the BBB, together with SLC27A1 [22]. This suggests that SLC27A4 may also be important in the uptake of fatty acids from the bloodstream by glioblastoma cells. Nonetheless, SLC27A4 may also be significant in the tumorigenesis of other cancers. Higher expression of SLC27A4 in breast tumors is associated with worse prognosis, particularly with distant metastasis-free survival [70]. In breast cancer cells, SLC27A4 plays a role in proliferation and epithelial-to-mesenchymal transition (EMT) [70]. Similarly, studies on hepatocellular carcinoma (HCC) cells have demonstrated that SLC27A4 is crucial for the proliferation and invasion of these cells [71]. In lung cancer cells, SLC27A4 is responsible for chemoresistance [72].
The results of this study have shown that the expression of SLC27A3 was higher in the glioblastoma tumors of men than of women. Additionally, the expression of SLC27A3 in the enhancing tumor region of men was positively correlated with the age and BMI of the patient. Furthermore, the expression of SLC27A3 in men was positively correlated with the expression of ELOVL1 in this region of the glioblastoma tumor. ELOVL1 is an enzyme responsible for the elongation of SFA [6], and the expression of this enzyme is also associated with poor patient outcomes in glioblastoma [43]. These observations may be useful for the development of personalized therapies, especially for obese men who are much older than the average glioblastoma patient. Such therapies should target the enzymes responsible for the synthesis of ceramides containing very-long-chain SFAs (either the studied SLC27A3 or ELOVL1) or enzymes directly responsible for ceramide synthesis.
Another enzyme described in this study that may affect outcomes in glioblastoma patients is SLC27A4. We have shown that the expression of SLC27A4 was the same in both sexes. It was negatively correlated with BMI and height in men, and positively correlated with age and the intensity of cigarette smoking in women. In women, but not in men, the expression of SLC27A4 was positively correlated with the expression of ELOVL1, indicating a different function of this enzyme between sexes. Drugs targeting SLC27A4 could be helpful in treating glioblastoma in low-weight men who are lean or thin. In female glioblastoma patients, such drugs could have a therapeutic effect in old age, and in cases when the glioblastoma developed as a result of intense cigarette smoking.
4.7. Limitations
The objective of this study was to investigate the expression of SLC27 in glioblastoma tumors and to explore the correlation between the expression of the investigated proteins and the key enzymes involved in fatty acid biosynthesis, as well as patient characteristics such as sex, age, BMI, and smoking. However, there are several limitations to the study. The expression levels of the investigated genes in glioblastoma tumors were compared to those in the peritumoral area rather than healthy brain tissue due to ethical issues with obtaining samples of healthy brain tissue. While epilepsy surgery brain samples are sometimes used as a control, they may be more similar to brain tumors than healthy brain tissue [50]. Therefore, using the peritumoral area as a control seems to be the most reasonable option. Another limitation is the small sample size of patients, all of whom come from a single population. Nevertheless, the obtained results are consistent with the available literature data, suggesting that the conclusions drawn from the study may provide valuable data for scientific research. Additionally, the study did not investigate the correlation between the investigated genes and the expression of lipid biosynthesis enzymes such as sphingolipids, glycerophospholipids, and triacylglycerols. As a result, the significance of SLC27 in the entire lipid metabolism of glioblastoma tumors was not fully demonstrated, indicating a potential direction for further research into lipid metabolism in glioblastomas.
5. Conclusions
Several conclusions can be drawn from the results of this study. The expression of SLC27, responsible for transporting fatty acids through the BBB, is reduced in glioblastoma tumors. This suggests a lower uptake of fatty acids by the tumor compared to non-tumor brain tissue. Therefore, it can be inferred that glioblastoma tumors exhibit a more intense biosynthesis of fatty acids than their uptake from the bloodstream. This metabolic difference might set them apart from healthy brain tissue. Thus, a therapeutic approach aimed at de novo synthesis of fatty acids may be more effective than targeting the transport of fatty acids.
Furthermore, SLC27 is associated with the de novo synthesis of fatty acids. Specifically, SLC27A1 and SLC27A3 are associated with stearic acid synthesis, and SLC27A4, SLC27A5, and SLCA6 with very-long-chain-fatty-acid synthesis. There are differences in the expression of these genes between genders, which showed a positive correlation in women and negative correlation in men.
Lastly, the transport and activation of fatty acids in glioblastoma tumors may depend on the intensity of cigarette smoking in women and BMI in men. This factor may influence the development of a personalized therapy approach for each patient.
Author Contributions
J.K., study design, data collection and interpretation, literature review and manuscript draft preparation; D.S., data collection; D.J., investigation; K.K., investigation; P.T., data collection; M.T. data collection; D.C., founds collection, supervision; I.B.-B., writing—original draft preparation, writing—review and editing. All authors have read and agreed to the published version of the manuscript.
Funding
This study was supported by the statutory budget of the Department of Biochemistry and Medical Chemistry at Pomeranian Medical University in Szczecin, Poland.
Institutional Review Board Statement
The study was conducted in accordance with the Declaration of Helsinki, and approved by the local bioethical commission (KB-0012/96/14-A-3).
Informed Consent Statement
Informed consent was obtained from all subjects involved in the study.
Data Availability Statement
The data presented in this study are available on request from the corresponding author.
Conflicts of Interest
The authors declare no conflict of interest.
References
- Louis, D.N.; Perry, A.; Wesseling, P.; Brat, D.J.; Cree, I.A.; Figarella-Branger, D.; Hawkins, C.; Ng, H.K.; Pfister, S.M.; Reifenberger, G.; et al. The 2021 WHO Classification of Tumors of the Central Nervous System: A summary. Neuro Oncol. 2021, 23, 1231–1251. [Google Scholar] [CrossRef] [PubMed]
- Brodbelt, A.; Greenberg, D.; Winters, T.; Williams, M.; Vernon, S.; Collins, V.P.; (UK) National Cancer Information Network Brain Tumour Group. Glioblastoma in England: 2007–2011. Eur. J. Cancer 2015, 51, 533–542. [Google Scholar] [CrossRef] [PubMed]
- Ostrom, Q.T.; Cioffi, G.; Waite, K.; Kruchko, C.; Barnholtz-Sloan, J.S. CBTRUS Statistical Report: Primary Brain and Other Central Nervous System Tumors Diagnosed in the United States in 2014–2018. Neuro Oncol. 2021, 23, iii1–iii105. [Google Scholar] [CrossRef] [PubMed]
- Okada, M.; Miyake, K.; Tamiya, T. Glioblastoma Treatment in the Elderly. Neurol. Med. Chir. 2017, 57, 667–676. [Google Scholar] [CrossRef] [PubMed]
- Fisher, J.P.; Adamson, D.C. Current FDA-Approved Therapies for High-Grade Malignant Gliomas. Biomedicines 2021, 9, 324. [Google Scholar] [CrossRef]
- Guillou, H.; Zadravec, D.; Martin, P.G.; Jacobsson, A. The key roles of elongases and desaturases in mammalian fatty acid metabolism: Insights from transgenic mice. Prog. Lipid Res. 2010, 49, 186–199. [Google Scholar] [CrossRef]
- Hao, J.W.; Wang, J.; Guo, H.; Zhao, Y.Y.; Sun, H.H.; Li, Y.F.; Lai, X.Y.; Zhao, N.; Wang, X.; Xie, C.; et al. CD36 facilitates fatty acid uptake by dynamic palmitoylation-regulated endocytosis. Nat. Commun. 2020, 11, 4765. [Google Scholar] [CrossRef]
- Grevengoed, T.J.; Klett, E.L.; Coleman, R.A. Acyl-CoA metabolism and partitioning. Annu. Rev. Nutr. 2014, 34, 1–30. [Google Scholar] [CrossRef]
- Kim, J.L.; Mestre, B.; Malitsky, S.; Itkin, M.; Kupervaser, M.; Futerman, A.H. Fatty acid transport protein 2 interacts with ceramide synthase 2 to promote ceramide synthesis. J. Biol. Chem. 2022, 298, 101735. [Google Scholar] [CrossRef]
- Coe, N.R.; Smith, A.J.; Frohnert, B.I.; Watkins, P.A.; Bernlohr, D.A. The fatty acid transport protein (FATP1) is a very long chain acyl-CoA synthetase. J. Biol. Chem. 1999, 274, 36300–36304. [Google Scholar] [CrossRef]
- Hall, A.M.; Smith, A.J.; Bernlohr, D.A. Characterization of the Acyl-CoA synthetase activity of purified murine fatty acid transport protein 1. J. Biol. Chem. 2003, 278, 43008–43013. [Google Scholar] [CrossRef] [PubMed]
- Hall, A.M.; Wiczer, B.M.; Herrmann, T.; Stremmel, W.; Bernlohr, D.A. Enzymatic properties of purified murine fatty acid transport protein 4 and analysis of acyl-CoA synthetase activities in tissues from FATP4 null mice. J. Biol. Chem. 2005, 280, 11948–11954. [Google Scholar] [CrossRef] [PubMed]
- DiRusso, C.C.; Li, H.; Darwis, D.; Watkins, P.A.; Berger, J.; Black, P.N. Comparative biochemical studies of the murine fatty acid transport proteins (FATP) expressed in yeast. J. Biol. Chem. 2005, 280, 16829–16837. [Google Scholar] [CrossRef] [PubMed]
- Richards, M.R.; Harp, J.D.; Ory, D.S.; Schaffer, J.E. Fatty acid transport protein 1 and long-chain acyl coenzyme A synthetase 1 interact in adipocytes. J. Lipid Res. 2006, 47, 665–672. [Google Scholar] [CrossRef] [PubMed]
- Zhan, T.; Poppelreuther, M.; Ehehalt, R.; Füllekrug, J. Overexpressed FATP1, ACSVL4/FATP4 and ACSL1 increase the cellular fatty acid uptake of 3T3-L1 adipocytes but are localized on intracellular membranes. PLoS ONE 2012, 7, e45087. [Google Scholar] [CrossRef]
- Hatch, G.M.; Smith, A.J.; Xu, F.Y.; Hall, A.M.; Bernlohr, D.A. FATP1 channels exogenous FA into 1,2,3-triacyl-sn-glycerol and down-regulates sphingomyelin and cholesterol metabolism in growing 293 cells. J. Lipid Res. 2002, 43, 1380–1389. [Google Scholar] [CrossRef]
- Lobo, S.; Wiczer, B.M.; Smith, A.J.; Hall, A.M.; Bernlohr, D.A. Fatty acid metabolism in adipocytes: Functional analysis of fatty acid transport proteins 1 and 4. J. Lipid Res. 2007, 48, 609–620. [Google Scholar] [CrossRef]
- Sebastián, D.; Guitart, M.; García-Martínez, C.; Mauvezin, C.; Orellana-Gavaldà, J.M.; Serra, D.; Gómez-Foix, A.M.; Hegardt, F.G.; Asins, G. Novel role of FATP1 in mitochondrial fatty acid oxidation in skeletal muscle cells. J. Lipid Res. 2009, 50, 1789–1799. [Google Scholar] [CrossRef]
- Holloway, G.P.; Chou, C.J.; Lally, J.; Stellingwerff, T.; Maher, A.C.; Gavrilova, O.; Haluzik, M.; Alkhateeb, H.; Reitman, M.L.; Bonen, A. Increasing skeletal muscle fatty acid transport protein 1 (FATP1) targets fatty acids to oxidation and does not predispose mice to diet-induced insulin resistance. Diabetologia 2011, 54, 1457–1467. [Google Scholar] [CrossRef][Green Version]
- Martin, G.; Nemoto, M.; Gelman, L.; Geffroy, S.; Najib, J.; Fruchart, J.C.; Roevens, P.; de Martinville, B.; Deeb, S.; Auwerx, J. The human fatty acid transport protein-1 (SLC27A1; FATP-1) cDNA and gene: Organization, chromosomal localization, and expression. Genomics 2000, 66, 296–304. [Google Scholar] [CrossRef]
- Fagerberg, L.; Hallström, B.M.; Oksvold, P.; Kampf, C.; Djureinovic, D.; Odeberg, J.; Habuka, M.; Tahmasebpoor, S.; Danielsson, A.; Edlund, K.; et al. Analysis of the human tissue-specific expression by genome-wide integration of transcriptomics and antibody-based proteomics. Mol. Cell. Proteom. 2014, 13, 397–406. [Google Scholar] [CrossRef] [PubMed]
- Mitchell, R.W.; On, N.H.; Del Bigio, M.R.; Miller, D.W.; Hatch, G.M. Fatty acid transport protein expression in human brain and potential role in fatty acid transport across human brain microvessel endothelial cells. J. Neurochem. 2011, 117, 735–746. [Google Scholar] [CrossRef] [PubMed]
- Ochiai, Y.; Uchida, Y.; Ohtsuki, S.; Tachikawa, M.; Aizawa, S.; Terasaki, T. The blood-brain barrier fatty acid transport protein 1 (FATP1/SLC27A1) supplies docosahexaenoic acid to the brain, and insulin facilitates transport. J. Neurochem. 2017, 141, 400–412. [Google Scholar] [CrossRef] [PubMed]
- Ochiai, Y.; Uchida, Y.; Tachikawa, M.; Couraud, P.O.; Terasaki, T. Amyloid beta25-35 impairs docosahexaenoic acid efflux by down-regulating fatty acid transport protein 1 (FATP1/SLC27A1) protein expression in human brain capillary endothelial cells. J. Neurochem. 2019, 150, 385–401. [Google Scholar] [CrossRef]
- Steinberg, S.J.; Wang, S.J.; Kim, D.G.; Mihalik, S.J.; Watkins, P.A. Human very-long-chain acyl-CoA synthetase: Cloning, topography, and relevance to branched-chain fatty acid metabolism. Biochem. Biophys. Res. Commun. 1999, 257, 615–621. [Google Scholar] [CrossRef]
- Smith, B.T.; Sengupta, T.K.; Singh, I. Intraperoxisomal localization of very-long-chain fatty acyl-CoA synthetase: Implication in X-adrenoleukodystrophy. Exp. Cell. Res. 2000, 254, 309–320. [Google Scholar] [CrossRef]
- Melton, E.M.; Cerny, R.L.; DiRusso, C.C.; Black, P.N. Overexpression of human fatty acid transport protein 2/very long chain acyl-CoA synthetase 1 (FATP2/Acsvl1) reveals distinct patterns of trafficking of exogenous fatty acids. Biochem. Biophys. Res. Commun. 2013, 440, 743–748. [Google Scholar] [CrossRef]
- Gimeno, R.E. Fatty acid transport proteins. Curr. Opin. Lipidol. 2007, 18, 271–276. [Google Scholar] [CrossRef]
- Falcon, A.; Doege, H.; Fluitt, A.; Tsang, B.; Watson, N.; Kay, M.A.; Stahl, A. FATP2 is a hepatic fatty acid transporter and peroxisomal very long-chain acyl-CoA synthetase. Am. J. Physiol. Endocrinol. Metab. 2010, 299, E384–E393. [Google Scholar] [CrossRef]
- Heinzer, A.K.; Kemp, S.; Lu, J.F.; Watkins, P.A.; Smith, K.D. Mouse very long-chain acyl-CoA synthetase in X-linked adrenoleukodystrophy. J. Biol. Chem. 2002, 277, 28765–28773. [Google Scholar] [CrossRef]
- Pei, Z.; Fraisl, P.; Berger, J.; Jia, Z.; Forss-Petter, S.; Watkins, P.A. Mouse very long-chain Acyl-CoA synthetase 3/fatty acid transport protein 3 catalyzes fatty acid activation but not fatty acid transport in MA-10 cells. J. Biol. Chem. 2004, 279, 54454–54462. [Google Scholar] [CrossRef] [PubMed]
- Kolar, E.A.; Shi, X.; Clay, E.M.; Moser, A.B.; Lal, B.; Nirujogi, R.S.; Pandey, A.; Bandaru, V.V.R.; Laterra, J.; Pei, Z.; et al. Very long-chain acyl-CoA synthetase 3 mediates onco-sphingolipid metabolism in malignant glioma. Med. Res. Arch. 2021, 9, 2433. [Google Scholar] [CrossRef] [PubMed]
- Sun, P.; Xia, S.; Lal, B.; Shi, X.; Yang, K.S.; Watkins, P.A.; Laterra, J. Lipid metabolism enzyme ACSVL3 supports glioblastoma stem cell maintenance and tumorigenicity. BMC Cancer 2014, 14, 401. [Google Scholar] [CrossRef]
- Herrmann, T.; Buchkremer, F.; Gosch, I.; Hall, A.M.; Bernlohr, D.A.; Stremmel, W. Mouse fatty acid transport protein 4 (FATP4): Characterization of the gene and functional assessment as a very long chain acyl-CoA synthetase. Gene 2001, 270, 31–40. [Google Scholar] [CrossRef]
- Stahl, A.; Evans, J.G.; Pattel, S.; Hirsch, D.; Lodish, H.F. Insulin causes fatty acid transport protein translocation and enhanced fatty acid uptake in adipocytes. Dev. Cell 2002, 2, 477–488. [Google Scholar] [CrossRef] [PubMed]
- Jia, Z.; Moulson, C.L.; Pei, Z.; Miner, J.H.; Watkins, P.A. Fatty acid transport protein 4 is the principal very long chain fatty acyl-CoA synthetase in skin fibroblasts. J. Biol. Chem. 2007, 282, 20573–20583. [Google Scholar] [CrossRef]
- Steinberg, S.J.; Wang, S.J.; McGuinness, M.C.; Watkins, P.A. Human liver-specific very-long-chain acyl-coenzyme A synthetase: cDNA cloning and characterization of a second enzymatically active protein. Mol. Genet. Metab. 1999, 68, 32–42. [Google Scholar] [CrossRef]
- Hubbard, B.; Doege, H.; Punreddy, S.; Wu, H.; Huang, X.; Kaushik, V.K.; Mozell, R.L.; Byrnes, J.J.; Stricker-Krongrad, A.; Chou, C.J.; et al. Mice deleted for fatty acid transport protein 5 have defective bile acid conjugation and are protected from obesity. Gastroenterology 2006, 130, 1259–1269. [Google Scholar] [CrossRef]
- Doege, H.; Baillie, R.A.; Ortegon, A.M.; Tsang, B.; Wu, Q.; Punreddy, S.; Hirsch, D.; Watson, N.; Gimeno, R.E.; Stahl, A. Targeted deletion of FATP5 reveals multiple functions in liver metabolism: Alterations in hepatic lipid homeostasis. Gastroenterology 2006, 130, 1245–1258. [Google Scholar] [CrossRef]
- Gimeno, R.E.; Ortegon, A.M.; Patel, S.; Punreddy, S.; Ge, P.; Sun, Y.; Lodish, H.F.; Stahl, A. Characterization of a heart-specific fatty acid transport protein. J. Biol. Chem. 2003, 278, 16039–16044. [Google Scholar] [CrossRef]
- Samovski, D.; Jacome-Sosa, M.; Abumrad, N.A. Fatty Acid Transport and Signaling: Mechanisms and Physiological Implications. Annu. Rev. Physiol. 2023, 85, 317–337. [Google Scholar] [CrossRef]
- Kimura, I.; Ichimura, A.; Ohue-Kitano, R.; Igarashi, M. Free Fatty Acid Receptors in Health and Disease. Physiol. Rev. 2020, 100, 171–210. [Google Scholar] [CrossRef] [PubMed]
- Tang, Z.; Li, C.; Kang, B.; Gao, G.; Li, C.; Zhang, Z. GEPIA: A web server for cancer and normal gene expression profiling and interactive analyses. Nucleic Acids Res. 2017, 45, W98–W102. [Google Scholar] [CrossRef] [PubMed]
- Duronio, R.J.; Knoll, L.J.; Gordon, J.I. Isolation of a Saccharomyces cerevisiae long chain fatty acyl: CoA synthetase gene (FAA1) and assessment of its role in protein N-myristoylation. J. Cell. Biol. 1992, 117, 515–529. [Google Scholar] [CrossRef]
- Liu, Q.; Gauthier, M.S.; Sun, L.; Ruderman, N.; Lodish, H. Activation of AMP-activated protein kinase signaling pathway by adiponectin and insulin in mouse adipocytes: Requirement of acyl-CoA synthetases FATP1 and Acsl1 and association with an elevation in AMP/ATP ratio. FASEB J. 2010, 24, 4229–4239. [Google Scholar] [CrossRef]
- Korbecki, J.; Kojder, K.; Jeżewski, D.; Simińska, D.; Tarnowski, M.; Kopytko, P.; Safranow, K.; Gutowska, I.; Goschorska, M.; Kolasa-Wołosiuk, A.; et al. Expression of SCD and FADS2 Is Lower in the Necrotic Core and Growing Tumor Area than in the Peritumoral Area of Glioblastoma Multiforme. Biomolecules 2020, 10, 727. [Google Scholar] [CrossRef] [PubMed]
- Korbecki, J.; Simińska, D.; Jeżewski, D.; Kojder, K.; Tomasiak, P.; Tarnowski, M.; Chlubek, D.; Baranowska-Bosiacka, I. Glioblastoma Multiforme Tumors in Women Have a Lower Expression of Fatty Acid Elongases ELOVL2, ELOVL5, ELOVL6, and ELOVL7 than in Men. Brain Sci. 2022, 12, 1356. [Google Scholar] [CrossRef]
- Baid, U.; Talbar, S.; Rane, S.; Gupta, S.; Thakur, M.H.; Moiyadi, A.; Sable, N.; Akolkar, M.; Mahajan, A. A Novel Approach for Fully Automatic Intra-Tumor Segmentation with 3D U-Net Architecture for Gliomas. Front. Comput. Neurosci. 2020, 14, 10. [Google Scholar] [CrossRef]
- Feng, X.; Tustison, N.J.; Patel, S.H.; Meyer, C.H. Brain Tumor Segmentation Using an Ensemble of 3D U-Nets and Overall Survival Prediction Using Radiomic Features. Front. Comput. Neurosci. 2020, 14, 25. [Google Scholar] [CrossRef]
- Lemée, J.M.; Com, E.; Clavreul, A.; Avril, T.; Quillien, V.; de Tayrac, M.; Pineau, C.; Menei, P. Proteomic analysis of glioblastomas: What is the best brain control sample? J. Proteomics 2013, 85, 165–173. [Google Scholar] [CrossRef][Green Version]
- Said, H.M.; Hagemann, C.; Stojic, J.; Schoemig, B.; Vince, G.H.; Flentje, M.; Roosen, K.; Vordermark, D. GAPDH is not regulated in human glioblastoma under hypoxic conditions. BMC Mol. Biol. 2007, 8, 55. [Google Scholar] [CrossRef] [PubMed]
- Mendes, C.; Lopes-Coelho, F.; Ramos, C.; Martins, F.; Santos, I.; Rodrigues, A.; Silva, F.; André, S.; Serpa, J. Unraveling FATP1, regulated by ER-β, as a targeted breast cancer innovative therapy. Sci. Rep. 2019, 9, 14107. [Google Scholar] [CrossRef] [PubMed]
- Dattilo, M.A.; Benzo, Y.; Herrera, L.M.; Prada, J.G.; Castillo, A.F.; Orlando, U.D.; Podesta, E.J.; Maloberti, P.M. Regulatory mechanisms leading to differential Acyl-CoA synthetase 4 expression in breast cancer cells. Sci. Rep. 2019, 9, 10324. [Google Scholar] [CrossRef] [PubMed]
- Lloyd, M.C.; Cunningham, J.J.; Bui, M.M.; Gillies, R.J.; Brown, J.S.; Gatenby, R.A. Darwinian Dynamics of Intratumoral Heterogeneity: Not Solely Random Mutations but Also Variable Environmental Selection Forces. Cancer Res. 2016, 76, 3136–3144. [Google Scholar] [CrossRef] [PubMed]
- Fane, M.; Weeraratna, A.T. How the ageing microenvironment influences tumour progression. Nat. Rev. Cancer 2020, 20, 89–106. [Google Scholar] [CrossRef]
- Green, J.; Cairns, B.J.; Casabonne, D.; Wright, F.L.; Reeves, G.; Beral, V.; Million Women Study collaborators. Height and cancer incidence in the Million Women Study: Prospective cohort, and meta-analysis of prospective studies of height and total cancer risk. Lancet Oncol. 2011, 12, 785–794. [Google Scholar] [CrossRef]
- Tripaldi, R.; Stuppia, L.; Alberti, S. Human height genes and cancer. Biochim. Biophys. Acta 2013, 1836, 27–41. [Google Scholar] [CrossRef]
- Park, J.; Morley, T.S.; Kim, M.; Clegg, D.J.; Scherer, P.E. Obesity and cancer--mechanisms underlying tumour progression and recurrence. Nat. Rev. Endocrinol. 2014, 10, 455–465. [Google Scholar] [CrossRef]
- Jacobs, E.J.; Newton, C.C.; Carter, B.D.; Feskanich, D.; Freedman, N.D.; Prentice, R.L.; Flanders, W.D. What proportion of cancer deaths in the contemporary United States is attributable to cigarette smoking? Ann. Epidemiol. 2015, 25, 179–182.e1. [Google Scholar] [CrossRef]
- Pei, Z.; Sun, P.; Huang, P.; Lal, B.; Laterra, J.; Watkins, P.A. Acyl-CoA synthetase VL3 knockdown inhibits human glioma cell proliferation and tumorigenicity. Cancer Res. 2009, 69, 9175–9182. [Google Scholar] [CrossRef]
- Seifert, M.; Garbe, M.; Friedrich, B.; Mittelbronn, M.; Klink, B. Comparative transcriptomics reveals similarities and differences between astrocytoma grades. BMC Cancer 2015, 15, 952. [Google Scholar] [CrossRef] [PubMed]
- Cancer Genome Atlas Research Network; Weinstein, J.N.; Collisson, E.A.; Mills, G.B.; Shaw, K.R.; Ozenberger, B.A.; Ellrott, K.; Shmulevich, I.; Sander, C.; Stuart, J.M. The Cancer Genome Atlas Pan-Cancer analysis project. Nat. Genet. 2013, 45, 1113–1120. [Google Scholar] [CrossRef] [PubMed]
- GTEx Consortium. The Genotype-Tissue Expression (GTEx) project. Nat. Genet. 2013, 45, 580–585. [Google Scholar] [CrossRef]
- GTEx Consortium. Human genomics. The Genotype-Tissue Expression (GTEx) pilot analysis: Multitissue gene regulation in humans. Science 2015, 348, 648–660. [Google Scholar] [CrossRef]
- Madhavan, S.; Zenklusen, J.C.; Kotliarov, Y.; Sahni, H.; Fine, H.A.; Buetow, K. Rembrandt: Helping personalized medicine become a reality through integrative translational research. Mol. Cancer Res. 2009, 7, 157–167. [Google Scholar] [CrossRef] [PubMed]
- Irwin, M.E.; Mueller, K.L.; Bohin, N.; Ge, Y.; Boerner, J.L. Lipid raft localization of EGFR alters the response of cancer cells to the EGFR tyrosine kinase inhibitor gefitinib. J. Cell. Physiol. 2011, 226, 2316–2328. [Google Scholar] [CrossRef]
- Cattaneo, M.G.; Vanetti, C.; Samarani, M.; Aureli, M.; Bassi, R.; Sonnino, S.; Giussani, P. Cross-talk between sphingosine-1-phosphate and EGFR signaling pathways enhances human glioblastoma cell invasiveness. FEBS Lett. 2018, 592, 949–961. [Google Scholar] [CrossRef]
- Tian, M.; Ma, W.; Chen, Y.; Yu, Y.; Zhu, D.; Shi, J.; Zhang, Y. Impact of gender on the survival of patients with glioblastoma. Biosci. Rep. 2018, 38, BSR20180752. [Google Scholar] [CrossRef]
- Binnert, C.; Koistinen, H.A.; Martin, G.; Andreelli, F.; Ebeling, P.; Koivisto, V.A.; Laville, M.; Auwerx, J.; Vidal, H. Fatty acid transport protein-1 mRNA expression in skeletal muscle and in adipose tissue in humans. Am. J. Physiol. Endocrinol. Metab. 2000, 279, E1072–E1079. [Google Scholar] [CrossRef]
- Yen, M.C.; Chou, S.K.; Kan, J.Y.; Kuo, P.L.; Hou, M.F.; Hsu, Y.L. Solute Carrier Family 27 Member 4 (SLC27A4) Enhances Cell Growth, Migration, and Invasion in Breast Cancer Cells. Int. J. Mol. Sci. 2018, 19, 3434. [Google Scholar] [CrossRef]
- Ji, W.; Wang, Q.; Yang, J. LncRNA HOXD-AS1 promotes the metastasis of human hepatocellular carcinoma via modulating miR-326/SLC27A4. Cancer Cell. Int. 2020, 20, 161. [Google Scholar] [CrossRef] [PubMed]
- Wu, S.; Su, J.; Qian, H.; Guo, T. SLC27A4 regulate ATG4B activity and control reactions to chemotherapeutics-induced autophagy in human lung cancer cells. Tumour Biol. 2016, 37, 6943–6952. [Google Scholar] [CrossRef] [PubMed]


Disclaimer/Publisher’s Note: The statements, opinions and data contained in all publications are solely those of the individual author(s) and contributor(s) and not of MDPI and/or the editor(s). MDPI and/or the editor(s) disclaim responsibility for any injury to people or property resulting from any ideas, methods, instructions or products referred to in the content. |
© 2023 by the authors. Licensee MDPI, Basel, Switzerland. This article is an open access article distributed under the terms and conditions of the Creative Commons Attribution (CC BY) license (https://creativecommons.org/licenses/by/4.0/).