1. Introduction
Morphine is a powerful opioid analgesic that has traditionally been used to treat both short-term surgical pain and long-term moderate-to-severe cancer pain [
1,
2]. Morphine is mainly metabolized in humans by conjugation with glucuronic acid to produce morphine-3-glucuronide (MOR-3-G) and morphine-6-glucuronide (MOR-6-G). The significant analgesic potency of MOR-6-G suggests that it contributes to the analgesic effect of morphine [
3]. Despite the medicinal properties of MOR and MOR-6-G, MOR has significant adverse effects including the potential of dependence and addiction. As a result of the widespread usage of MOR, newly developed analytical techniques for determining the drug and its metabolites in bio-fluids at very low concentration levels is crucial in order to assess the pharmacodynamics and pharmacokinetics studies of these analgesic compounds.
Several capillary electrophoresis (CE) techniques have been used to analyze various opioid drugs through the advantageous capabilities of the desired selectivity and simplicity, with the characteristic similarity to those of high-performance liquid chromatography [
4,
5,
6,
7,
8,
9,
10,
11,
12,
13,
14,
15,
16,
17]. Moreover, CE will provide faster and higher separation efficiency and relatively cheaper with long-lasting capillary columns. However, compared to modern chromatographic procedures, CE-based techniques still have some shortcomings.
Although, the incorporation of small internal diameter capillary improves the separation efficiency, it will limit the amount of the injected analyte into this capillary. The detection system used, as with the majority of analytical methodologies, is one of the problems that prevent CE from having high sensitivity and selectivity [
4]. Due to its simplicity of use, UV absorption is employed for the majority of CE separations; nevertheless, its sensitivity is low due to the short optical path length [
5,
6,
7,
8,
9]. Owing to the small loaded volume of the analyte in CE, it requires the employment of highly sensitive detection system in order to utilize the full advantages of CE performance. Accordingly, fluorescence [
15,
16,
17] and chemiluminescence [
18] are the best available sensitive detection systems. On the other hand, mass spectrometry has increasingly been used in combination with CE, however, it is not exemplary for routine analysis and the detector is often unavailable in routine laboratories [
10,
11,
12,
13,
14].
Increased detection capabilities and selectivity of capillary zone electrophoresis (CZE) can be successfully acquired with the aid of chemical derivatization [
19,
20,
21]. However, pre-capillary derivatization can be time consuming, unreliable and difficult to be implemented with small sample volumes. On the other hand, it would be advantageous to carry out derivatization in a close physical proximity to the capillary condition to minimize sample handling. A short capillary column with a very small inner diameter can combine the sample and reagent in one step and thus reduce sample and reagent solutions resulting in faster analyses and minimizing unused amounts of reagents [
22]. On-line capillary derivatization is therefore easier, faster, and may be carried out without modifying the configuration of the conventional available CE devices. Because of its remarkable advantages over the conventional pre-capillary derivatization techniques, the in-capillary derivatization was conducted in the present study. In this approach, the capillary is not only used as a separation chamber, but also as a microreactor in which derivatization is achieved during electrophoresis of sample through the running electrolyte containing the derivatization reagent. Although, native fluorescence intensity of MOR and MOR-6-G can be used for their analysis, it is necessary to derivatized these compounds into highly fluorescent derivatives prior to CE analysis for sensitivity enhancement. Thus, an additional step that has the potential to significantly improve sensitivity and selectivity is the derivatization of analytes with certain reagents in conjunction with fluorescence detector. It has long been recognized that the use of ferricyanide in which MOR can be chemically transformed into highly fluorescent pseudo derivatives (
Scheme 1), is an effective modification approach for a variety of separation techniques including CE and HPLC [
23,
24,
25], and that it enhances the overall selectivity and sensitivity. Highly florescence pseudo-derivatives of MOR and MOR-6-G could be achieved by in-capillary derivatization using an oxidative-coupling reaction of the analytes with potassium ferricyanide in alkaline medium [
23]. Because of the extended conjugation of the pseudo-derivatives, their fluorescence characteristics are greater than those of native molecules.
The on-column pre-concentration approach is required to increase the mass of loaded analytesand, and as a result, overcome CE’s fundamentally low sensitivity for measuring MOR and MOR-6-G in human serum. Sample stacking is considered to be an efficient pre-concentration technique that has been extensively used and explained in the literature [
24,
25,
26,
27,
28,
29,
30,
31]. This pre-concentration mode can be accomplished by varying the composition of the loaded samples and the running electrolyte solutions, as well as the injection techniques. Field amplified sample stacking (FASS) is the simplest and most commonly used technique for on-line sample pre-concentration, since the only condition is that the sample medium has to be of lower conductivity than that of the running electrolyte [
30,
31,
32,
33]. As a result, the greater the applied electric field, the faster the analytes migrate, which leads to stacking and sharpening of the migrated zones at the boundary with the running electrolyte.
Prior to electrokinetic injection in FASS mode, serum samples containing MOR and MOR-6-G must be processed to eliminate proteins. Due to emulsion formation, particularly at the liquid-liquid interface, conventional liquid/liquid extraction (LLE) [
5,
28,
32,
33] is tedious, whereas solid-phase extraction (SPE) [
6,
9,
14,
15,
30] is time consuming. Although protein precipitation is the simplest technique, it is not always quantifiable. This can be avoided by using an internal standard (IS) method.
To the best of our knowledge, a fluorescence-CZE using FASS and an in-capillary derivatization (in-CAP-D) (in-Cap-D-FASS-CZE) was effectively used for the first time to measure MOR and MOR-6-G in the presence of codeine (COD) as an IS in human serum. Serum samples were pre-treated by a simple precipitation technique utilizing acetonitrile as a precipitating agent in the presence of IS. The in-Cap-D-FASS-CZE allows determination of MOR and MOR-6-G at concentration levels lower than that of conventional CE applications which will allow for wider applications in several medical and pharmaceutical fields.
2. Materials and Methods
2.1. Chemicals and Reagents
All chemicals used in this study were available from the manufacturers at the highest purity grade. Fisher Scientific (Spring field, NJ, USA) supplied potassium ferricyanide, disodium tetraboratedecahydrate, sodium hydroxide, and hydrochloric acid. MOR sulphate, a certified pharmaceutics sample of >99.63% purity, and controlled-release oral MOR sulphate tablets (MST Continus, Napp Laboratories, Cambridge, UK, 60 mg/tablet) as well as MOR-6-G (Cerilliant, Round Rock, TX, USA) were obtained and used as received from the Faculty of Medicine, Department of Anesthesia, Assiut University (Assiut, Egypt). Misr Company for Pharmaceutical Industries (Cairo, Egypt) kindly provided the COD phosphate (99.96%).
All reagents and solutions were prepared using distilled deionized water purified with an ultra-pure water system Milli-Q system (Millipore, Bedford, MA, USA). The electrolyte solutions were filtered through a 0.45 μm Millipore membrane filter prior to use.
2.2. Instrumentation and General Procedure
Separation was conducted in fused silica capillaries coated with polyamide layers (Polymer Technologies, Phoenix, AZ, USA). The total length of the capillary was 100 cm, and the effective length to the detection point was 90 cm with 75 and 360 µm of internal and external diameters, respectively. Around 0.5 cm length of the polyimide layer on the capillary was removed by burning to setup a detection point and this part was aligned on the detection block. A FP-920 fluorescence detector (Jasco), equipped with flow cell unit for CE (Jasco, Tokyo, Japan) was used to monitor the fluorescence signals at an excitation maximum around 340 nm while emission maximum was observed at 450 nm. The anodic and cathodic ends were each dipped separately in reservoirs containing the same electrolyte composition, and their surfaces were adjusted to the same level. All investigations were performed at ambient temperature (22 ± 1 °C).
The CZE system is equipped with a power supply model HCZE-30 PNO 25-LDS that can deliver voltages of up to 30 kV (Matsusada Precision Devices, Shiga, Japan). The high-voltage ends of the capillary were enclosed in an acrylic box for safety measures.
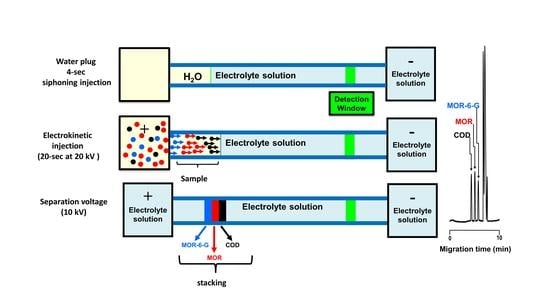
The CZE system was based on normal separation mode (the cathode was positioned on the detector side). The pre-treated serum sample was electrokinetically injected for 20 s at 20 kV into the capillary that was pre-injected with water plug for 4 s. After sample injection, a potential of 10 kV was applied to move the stacked MOR, MOR-6-G and COD zones for derivatization and to transport the resulting pseudo-derivatives to the transparent section of the capillary for fluorescence detection. Electropherograms were recorded on a chromatopack integrator C-R6A (Shimadzu, Kyoto, Japan).
Conditioning of new capillaries was accomplished by flushing for 10 min with sodium hydroxide 1.00 M, followed by 5 and 20 min withMilli-Q deionized water and electrolyte solution, respectively. Solutions in capillaries and both reservoirs should be replaced with Milli-Q deionized water when the CE system is not running.
2.3. Water Plug
Water plugs provide clean boundaries between sample solutions and operating electrolytes, increasing sample loading without causing significant band broadening. Water plugs were hydrodynamically loaded by inserting the capillaries inputs into water vials and lifting the vials 5 cm higher than the capillaries outputs for 4 s. In this injection mode, short water plugs can be siphoned into the capillaries inlets prior to sample introduction into the operating electrolyte.
2.4. Sample Pre-Treatment and Volumetric Sample Pre-Concentration
An aliquot of 800 µL of acetonitrile was added to 400 µL of drug-free human serum that had been spiked with MOR and MOR-6-G (400 ng/mL) in a glass centrifuge tube. The mixture was vortexed (30 s) after being combined with 50 ng/mL COD as an IS. Centrifugation was employed to separate the precipitated proteins (5 min, 5000 rpm). An aliquot of 600 µL of the acetonitrile layer was transferred to another tube and evaporated under nitrogen vacuum until dry. The residue was reconstituted in a volume of 100 µL of 80 % v/v acetonitrile-Milli-Q deionized water. The resulting solution underwent filtering and the general CE procedure was conducted.
2.5. Calibration Standards
An adequate quantity of MOR sulphate and MOR-6-6-G was dissolved in Milli-Q deionized water to yield a stock standard solution with a concentration of 10 mg/mL for each analyte. By properly diluting the stock standard solutions with the same solvent to achieve concentration ranges of 0.01–20 and 0.012–20 µg/mL for MOR and MOR-6-G, respectively, standard solutions of the tested analytes were made. To inhibit photo-degradation, aluminum foil was used to cover the containers of standard solutions. To establish calibration standards covering the concentration ranges of 1–2000 ng/mL (MOR) and 1.2–2000 ng/mL (MOR-6-G), each standard solution was spiked into drug-free serum samples in a ratio of 1 to 9 with a final dilution containing 50 ng/mL COD as an IS. Each calibration standard is subjected to the precipitation and reconstitution steps and injected in replicates (n = 5) into the developed CZE system. By plotting the peak area ratio of MOR or MOR-6-G to that of IS against the corresponding concentrations, standard calibration curve was constructed for each analyte.
Quality control (QC) serum samples of 2, 40, 400, and 1600 ng/mL were made by diluting working standard solutions of MOR and MOR-6-G, at 0.02, 0.4, 4 and 16 µg/mL, by a factor of 10 into drug-free human serum.
2.6. Recovery, Precision and Accuracy
Recoveries were assessed in QC samples at concentrations of 2, 40, 400, and 1600 ng/mL of MOR or MOR-6-G. Five duplicates were injected for each concentration, and peak area ratio between the measured analyte and IS was employed as the quantitative measuring signals. The recoveries of MOR and MOR-6-G from spiked serum samples were calculated using the following equation:
Both precision and accuracy of the in-Cap-D-FASS-CZE method were evaluated by analyzing MOR and MOR-6-G CQ samples at 2, 40, 400 and 1600 ng/mL. Precision was expressed as the percentage of the relative standard deviation (RSD%) compiled from repeated injections (n = 5). Intra-assay precisions were calculated as the RSD % of the mean measured concentrations resulted from a single day. Inter-assay precision was evaluated by the RSD % of the mean measured concentrations on five consecutive days. The intra- and inter-day accuracies were determined at the same concentration levels by the percent of relative errors (RE %) of the mean measured concentrations using the following equation:
3. Results
When the reaction was conducted in alkaline solution, potassium ferricyanide had the greatest impact on increasing the rise-rate of fluorescence intensity of MOR, MOR-6-G, and COD. As a result, disodium tetraboratedecahydrate-based running electrolytes were chosen as being the best for derivatizing MOR, MOR-6-G, and COD as well as for system performance. The effects of various parameters on the ability of the system to measure MOR, MOR-6-G, and COD at very low concentration levels were investigated.
3.1. pH and Concentration of Borate Electrolyte
Because it influences both the charges of MOR, MOR-6-G, and COD as well as the surface properties of the fused-silica capillary, pH is one of the most critical parameters for enhancing the efficiency of the present CE method. Furthermore, the reaction of the tested analytes with ferricyanide was always conducted in an alkaline medium. The possibility of disodium tetraboratedecahydrate as a running alkaline electrolyte for in-capillary derivatization and separation of MOR, MOR-6-G, and COD from endogenous serum matrix components was investigated in this study. The effect of pH on the rise-rates of fluorescence intensity of MOR, MOR-6-G, and COD was studied over the range 7.5–12. The fluorescence signals of MOR, MOR-6-G, and COD increased as the pH increased from 7.5 to 10.5 above which they gradually decreased (
Figure 1). The unfavorable effect of increasing pH on MOR, MOR-6-G, and COD fluorescence signals could be attributed to the short duration stability of the pseudo-derivatives as well as an increase in baseline noise.
The variations in the electrophoretic mobility of MOR and MOR-6-G, and COD and the closed serum matrix endogenous peak as a function of pH were further investigated over the range 7.5–12 (corresponding borate concentration was 70 mM). At pH values ranging from 10 to 11, good separation and peak sharpness were achieved; however, pH values above 11 resulted in increased baseline noise and poor resolution between the tested analytes from each other as well as matrix endogenous components. It was also observed that the rear peak of serum matrix had lower electrophoretic mobility than MOR, MOR-6-G, and COD, and thus, at pH values greater than 10, the migration time of this peak was lengthened, and the resolution of MOR, MOR-6-G, and COD from each other as well as from matrix components was improved. As a compromise between the favorable effect of high pH on the in-capillary derivatization of MOR, MOR-6-G, and COD on the one hand and adequate separation and less baseline noise on the other, a pH of 10.5 was chosen for all other experiments.
The range of 10 to 100 mM borate electrolyte was examined to determine the impact of its concentration on the fluorescence signals of MOR, MOR-6-G, and COD (corresponding pH was 10.5). The fluorescence intensity gradually increased as the concentration of borate increased, and the maximum signal intensity was attained at the range from 50 to 60 mM. On the other hand, a gradual decline of the fluorescence intensity was observed above a borate concentration of 70 mM (
Figure 2). These results explained how increasing borate concentration increases current flow, which in turn causes increasing Joule heating, which might increase baseline noise and lower system efficiency. The electrophoretic mobility of MOR, MOR-6-G, and COD, as well as the peaks of serum matrix, were found also to be affected by borate concentration. The mobility difference between the tested analytes and matrix components peaks of serum sample could be increased by increasing the concentration of borate up 80 mM. However, we observed that 70 mM of borate was the best concentration for in-capillary derivatization and resolution of MOR, MOR-6-G and COD from matrix components as well as FASS step.
3.2. In-Capillary Derivatization Mode and Ferricyanide Concentration
In the presence of disodium tetraboratedecahydrate solution (70 mM, pH 10.5), the relationship between the fluorescence signals of MOR, MOR-6-G, and COD and the ferricyanide concentrations were examined (
Figure 3). As ferricyanide concentration was gradually increased up to 0.30 mM, the results revealed a rational pattern of fluorescence enhancement (
Figure 3). With concentrations higher than 0.30 mM, it was found that the yield of fluorescence intensity gradually decreased, and at the same time, baseline noise increased. Due to the quenching effect of the higher ferricyanide concentration (>0.30 mm), the fluorescence intensity was reduced. As a result, an optimal concentration of 0.30 mM ferricyanide was chosen to reach the balance between baseline noise and repeatability on the one hand, and appropriate sensitivity on the other.
3.3. Separation Voltage
The effect of applied separation potential on the derivatization of MOR, MOR-6-G, and COD by the in-Cap-D-FASS-CZE method was studied at voltages ranging from 7 to 15 kV using a running electrolyte of 70 mM borate (pH 10.5) and 0.30 mM ferricyanide. The results revealed a reasonable pattern of fluorescence drop as the applied voltage was increased from 7 to 12 kV. Because of the rapid migration of MOR, MOR-6-G, and COD via the ferricyanide reagent brought on by the increased voltage, the fluorescence intensity was decreased as a result of the short residence time between the migratory zones and reagent regions. Additionally, increasing the applied voltage above 12 kV led to high current, which increased Joule heat and substantially deteriorated the baseline. For the analysis of MOR, MOR-6-G, and COD in human serum, our goal was to combine the innovations of high throughput analysis with simpler CZE techniques. Reducing the applied voltage prolonged the contact time between the tested analytes and derivatization reagent and thus increased the fluorescence intensity of MOR, MOR-6-G, and COD. The increased sensitivity came at the expense of peak broadening with the resulting poor separation of MOR, MOR-6-G, and COD from each other as well as from serum matrix components. The migration order of COD, MOR, and MOR-6-G was likewise observed to be consistent across all applied voltages. To this end, we needed to identify the best voltage that could provide the necessary sensitivity with little baseline noise and good separation with quick migration times. It was found that the optimal compromise between sensitivity and analytical run time was achieved at a voltage of 10 kV.
3.4. Sample Stacking
The combination of an in-capillary derivatization and FASS in CE could further increase the detection sensitivity of MOR and MOR-6-G and COD. Setting up the system so that the conductivity of the sample solution is lower than that of the running electrolyte is one of the most crucial factors of FASS. By diluting the sample with 80% v/v acetonitrile-Milli-Q deionized water, the difference in conductivity is often accomplished. According to this concept, the conductivity differential between the sample zone and the running electrolyte determines how effective stacking is. The greater the difference in conductivity, the narrower the peak and the greater the amount of stacking achieved. The electrokinetic injection voltage and injection time were important parameters that could be optimized to enhance the stacking efficiency. Different voltages between 8 and 22 kV were applied for the electrokinetic injection of the sample containing MOR and MOR-6-G and COD in the FASS mode (pre-injected with water plug for 4 s). The highest detector response was reached at 20 kV. When the injecting voltage was greater than 20 kV, the detector response did not improve linearly. In addition, high electric field can produce partial heat, which will generate the bubble and deteriorate baseline. In order to achieve a compromise between the baseline noise and the detector response, the injection voltage was set at 18 kV. Additionally, 4 to 24 s of the injection period were examined. The results demonstrated that MOR and MOR-6-G and COD peak signals increased linearly from 4 to 20 s during electrokinetic injection. However, the fluorescence signals did not grow linearly when the injection time was more than 20 s. Therefore, a 20 s electrokinetic injection period was chosen.
3.5. Method Validation
3.5.1. Linearity
Various MOR and MOR-6-G spiked concentrations in drug-free human serum samples were tested to estimate the linearity of the in-Cap-D-FASS-CZE technique. Plotting the measured peak areas ratios between the tested analytes and COD (IS) against the corresponding concentrations of MOR and MOR-6-G over the ranges of 1–1000 and 1.2–1000 ng/mL, respectively, allowed for the construction of calibration curves. The calibration curves were linear, with correlation coefficients of 0.9992 (MOR) and 0.9991 (MOR-6-G) (
Table 1). Sample concentration was determined by the least-squares linear regression equation, using the formula Y = a + bC, where Y = peak area, C = concentration in ng/mL, b = the slopes (0.3708, MOR) and (0.3034, MOR-6-G) of the curves, and a = the intercepts (0.3019, MOR) and (0.9132, MOR-6-G) with Y axis. The LODs were estimated at S/N of 3 and were found to be 0.20 and 0.26 ng/mL for MOR and MOR-6-G, respectively. Additionally, at a S/N of 10, the LOQs for MOR and MOR-6-G were found to be 0.72 and 0.88 ng/mL, respectively.
3.5.2. Recovery, Precision and Accuracy
For the pre-treatment step and in-Cap-D-FASS-CZE technique, intra- and inter-day accuracy and precision were investigated. The average recoveries of MOR and MOR-6-G varied from 86.35 to 97.17% and 85.22 to 96.64%, respectively. The RE % between the concentrations of samples that were experimentally determined and those that were prepared was used to measure accuracy. The RSD % for the experimentally determined concentrations was used to calculate the precision. On the same day, five replicates of QC samples with four different concentrations of MOR and MOR-6-G (2, 40, 400, and 1600 ng/mL) were run to determine the intra-day validation. On five different days, the inter-day validation was assessed using the same QC samples. QC samples of MOR and MOR-6-G for the intra- and inter-day assay had RES % that were less than 14% and 15%, respectively. Furthermore, the RSD % for each analyte was less than 10% for intra- and inter-day validation studies. The validation results showed that the in-Cap-D-FASS-CZE method had good precision and accuracy (
Table 2).
3.5.3. Selectivity
The influence of endogenous human serum matrix components that could interfere with MOR, MOR 6-G, and COD during in-Cap-D-FASS-CZE technique was important. As a result, drug-free human serum samples from many healthy males in addition to drug-free serum samples spiked with MOR, MOR-6-G and COD at low and high concentration levels were tested to ensure the absence of interference from the co-migrated matrix components. The absence of interference with the co-migrated peaks from serum matrix with MOR, MOR 6-G and COD demonstrated good selectivity for the in-Cap-D-FASS-CZE technique (
Figure 4A,B).
3.5.4. Robustness
The potential of the proposed CZE approach for drug analysis, as well as its robustness and reliability were investigated. The effectiveness of small (2%) alterations of the essential procedure parameters, such as pH, borate and ferricyanide concentrations, injection and separation voltage, injection time, and water plug, was used to determine how robust the method was. The results demonstrated that none of these experimental parameters had an appreciable impact on MOR and MOR-6-G recoveries.
3.5.5. Enhancement Factor
In the present investigation, electrokinetic injection of acetonitrile-treated serum samples was used to perform a simple signal enhancement mode. Prior to injection, a small water plug was inserted, for 4 s, by hydrodynamic injection to ensure good FASS. Due to the peak narrowing effect of the FASS mode, baseline separation of MOR, MOR-6-G and COD from the co-migrated serum matrix components was precisely achieved with good sensitivity by electrokinetic injection under high voltage. This mode of injection showed that the LOQs of MOR and MOR-6-G were improved significantly and the in-Cap-D-FASS-CZE approach led to a thirty-fold enhancement over the normal CE injection method. In normal CE injection, acetonitrile-treated serum samples were hydrodynamically injected without the use of a water plug.
3.6. Application
MOR and MOR-6-G concentrations, from clinical serum samples following a single dosage of oral controlled-release MOR sulphate tablets (MST Continus, Napp Laboratories, Cambridge, UK, 30 mg/tablet) were determined by the validated in-Cap-FASS-CZE method.
Figure 5 depicts an electropherogram of a drug-free human serum sample collected from the volunteer before to drug administration (
Figure 5A), as well as an electropherogram of a clinical serum sample collected 2 h from the same volunteer after orally administering 30 mg morphine (
Figure 5B). Because there were no concomitant potential interferences arising from the co-migrated matrix components, there was a high degree of confidence expressed in the validity of the proposed in-Cap-FASS-CZE method for determining MOR, MOR-6-G and COD in human serum after therapeutic doses.
3.7. Standard Addition Method
Analytical recovery was also examined using the standard addition method in order to maintain the evaluation of the in-Cap-FASS-CZE method’s accuracy and to confirm the absence of any matrix influence. Two hours after a single oral dose of 30 mg MOR was provided, a clinical sample was collected. For standard addition, it was divided into a number of equal aliquots. The first aliquot was mixed with borate solution (70 mM, pH 10.5), and the remaining portions were mixed with standards MOR and MOR-6-G at three different concentrations of 10, 50, and 100 ng/mL. The variation in MOR and MOR-6-G concentrations is thought to be the only issue causing the difference in detector responses between the pre-analyzed sample and the spiked pre-analyzed samples. The added standards MOR and MOR-6-G recoveries were determined for all spiked samples, and they ranged from 87.11 to 94.65%. (
Figures S1–S3). These results confirm the reliability of the in-Cap-FASS-CZE technology to accurately analyze MOR and MOR-6-G in human serum.
3.8. Sensitivity Enhancement as Well as Economic and Technical Merits of the in-Cap-D-FASS-CZE Approach
Despite the well-established feasibility of CE-based separation systems for a variety of bio-analytical applications, this technology remains largely untapped for systematic analysis at very low concentration levels. By establishing the in-Cap-FASS-CZE method for a specific analytical purpose, such as measuring MOR and MOR-6-G in human serum using the conventional CZE platform, it was possible to bridge the gap between the early-adopted wonderful resolution performance by CE and the higher achievable sensitivity to make it accessible to any average user with reasonably little technical and financial input. It is not necessary to have any specialized tools or skills to use with the setup of the developed procedure. Sample enrichment is conducted online using FASS together with a low-cost and practicable PPE approach. As a result, the sample preparation may simply be scaled up or down on demand to accommodate varying sample sizes (with the possibility of simultaneous volume-based sample pre-concentration). In-capillary derivatization coupled with micellar electrokinetic chromatography has been previously reported for analysis of MOR from serum samples [
25]. Due to the broadness of the MOR peak and the decline in signal-to-noise ratio, it was necessary to regularly reactivate the inside surface of the capillary wall. Thus, it was crucial to improve method repeatability for direct injection of serum samples by performing a one-minute wash cycle with ultrapure water, 0.10 M NaOH, and ultrapure water, respectively, after each set of experiments. In addition, the FASS technique could not be implemented in the same study as electrokinetic injection was not appropriate in the presence of high concentration of serum proteins that would disturb the performance of the CE system. In the present study, deproteinization by acetonitrile reduces the requirement for capillary washing between runs, which speeds up the analysis. Moreover, the performance parameters were not significantly affected by minor variations in the sample loading parameters, which can readily occur when used by an inexperienced user. Due to the fact that in-Cap-FASS-CZE approach was developed with the aid of IS, it had good accuracy when using serum as the sample matrix. In comparison to other CE approaches that used fluorescence or MS detection systems [
5,
6,
8,
9,
10,
14,
15,
16,
17,
23,
26,
28,
29,
30], the LOD by the in-Cap-D-FASS-CZE was much better. Thus, the current method could be employed for measuring low concentration levels of MOR and its metabolite, MOR-6-G, by integrating in-capillary derivatization and FASS in a conventional CZE system set-up. The results supported the application of the in-Cap-D-FASS-CZE-based analytical methodology to real clinical samples and showed that this approach can be used for the fast analysis of MOR, MOR 6-G and COD with good within-run precision and accuracy. The ability to simultaneously measure the blood levels of MOR, MOR 6-G and COD can allow for the analysis of various opioid compounds for pharmacokinetic studies.
4. Conclusions
By integrating a pre-concentration step with an in-capillary derivatization through the application of a conventional CZE set-up system, the in-Cap-D-FASS-CZE approach demonstrated a significant improvement in the fluorescence detection ability of MOR, MOR 6-G and COD. The developed method was fast, simple and reliable in terms of linearity, sensitivity, selectivity, precision, accuracy, and robustness. Because data quality was ensured, the developed in-Cap-D-FASS-CZE technique may be regarded as suitable analytical tool to measure MOR, MOR-6-G and COD in human serum for clinical and pharmacological research. When compared to hyphenated analytical techniques, e.g., LC-MS and GC-MS, the in-Cap-D-FASS-CZE method provides the fast measurement of therapeutically relevant MOR, MOR 6-G and COD concentrations at a fraction of the cost. Therefore, the new method’s key benefits—minimal sample processing and low cost—may be especially beneficial when a lot of serum samples are measured.


 ,
, 


