Abstract
Background: Analytical techniques are a crucial method used in quality control procedures. Fusidic acid (FU), an antibacterial drug, is available on the market in a semisolid dosage form. This work aimed to develop a simple, sensitive, and robust UPLC assay for FU. Method: The effect of the formic acid concentration (X1 (1%, 0.55%, and 0.1%)), and column temperature (X2 (40, 32.5, and 25 °C)) on the retention time, peak area, and peak height were determined. Results: The results show that a long retention time of 1.18 min can be achieved with a low column temperature and a low to medium concentration of formic acid. A good peak height resolution was obtained with a low concentration of formic acid at different temperature settings. The optimized condition was suggested by the software program to analyze the drug in a mobile phase, consisting of 72% acetonitrile and 28% water containing 0.1% formic acid with a column temperature adjusted to 40 °C. Conclusion: The method was validated in terms of linearity, accuracy, precision, and robustness. In addition, the stability degradation study determined that the method can separate the drug from other degradation production. The method was applicable to determine the drug content in the marketed product.
1. Introduction
Quality control is a crucial procedure for the pharmaceutical industry. Drugs must be marketed as safe and in therapeutically active formulations in which performance is reliable and anticipated. To guarantee the batch-to-batch quality, reproducibility, dependability, and performance, drug products are subjected to two categories of tests: product quality tests and product performance tests. Product quality tests are carried out to evaluate the characteristics including assay, identification, content uniformity, pH, microbiological limits, minimum fill, and part of the compendial monograph. Product performance tests are carried out to evaluate medication release from the completed dosage form and should be capable of detecting any change in the drug release [1]. As there is a relationship between biopharmaceutics and PK/PD, any change in the release characteristics may reflect a change in the absorption and, therefore, the pharmacological effect [2].
In order to meet medical needs, the pharmaceutical and biopharmaceutical industries continue to develop and market pharmaceutical products. Guaranteeing the quality and safety of active pharmaceutical ingredients (API) and drug products is challenging. Effective analytical techniques are important to sufficiently achieve product quality attributes through the release, stability, and post-marketing stages. Improving the analytical method may act as a dual action. First, from an industrial point of view, it is important to develop an economically viable method, that uses less amounts of chemicals, produces less waste, and is safe and reproducible. On the other hand, improving the analytical method plays a crucial role and ensures higher product quality and, therefore, increases consumer safety [3]. Nevertheless, acceptable quality can solely be achieved when the analytical technique undergoes a reasonable validation process [3]. Analytical validation involves a formal, systematic, and documented tool that calculates the capacity of an analytical technique to provide reliable, accurate, and reproducible outcomes [3].
The validation of methods is an ongoing process. The objective is to ensure the reliability of the analytical data throughout product development. The term “method validation” refers to the procedure of showing (via scientific studies) that an analytical method is suitable for its intended purpose [4]. The U.S. Food and Drugs Administration’s (FDA) recent draft document “Analytical Procedures and Methods Validation: Chemistry, Manufacturing, and Controls Documentation” provides guidelines on method development and validation for new non-compendial test methods. This new document covers the method development and validation process for products included in investigational new drug (IND), new drug application (NDA), and abbreviated new drug application (ANDA) submissions. As a result, regulatory agencies’ expectations for method development and validation are clear. A great deal of effort has been devoted in recent years to the harmonization of pharmaceutical regulatory requirements in the United States, Europe, and Japan. The International Conference on Harmonization (ICH) has issued guidelines for analytical method validation, as part of this initiative. U.S. Pharmacopeia (USP) and the latest FDA draft guidance document on methods validation both make reference to the ICH guidelines [5].
Over the past decades, FU has been used for treating Staphylococcus aureus infections. It is a tetracyclic triterpenoid derived from Fusidium coccineum [6]. In vitro, it has good efficacy against Staphylococcal spp., counting methicillin-resistant strains. Moreover, it has good activity against enterococci, streptococci, and Gram-negative anaerobes [7]. However, it is not active against Enterobacteriaceae [8]. FU acts by inhibiting the protein synthesis via interference with the function of elongation factor G (EF-G), which causes the inhibition of peptide translocation and ribosome disassembly [9]. Bacteriostatic action is the main effect of FU, but it can be bactericidal at high concentrations [10]. In recent years, topical FU has been used more frequently for skin infections, suggesting resistance selection [11]. For resistance control, combination therapy with different antimicrobials may be useful and effective.
Several studies were conducted for the analysis of FU alone or in combination with other drugs in bulk pharmaceutical dosage form or human plasma using the conventional HPLC technique. Shewale et al., developed a validate HPLC method for a topical dosage form containing FU and beclomethasone dipropionate. The developed assay separated the two drugs, with a flow rate of 2.5 mL/min. Unless the flow rate is in the normal range for liquid chromatography (1–3.5 mL/min), increasing the flow rate will increase the pressure and this could adversely affect the system’s pump [12]. In another work, a developed HPLC assay was established to analyze FU in tablet dosage form. The system flow rate was 1 mL/min and the drug separated after 7 min [13]. Generally, these HPLC analytical methodologies used flow rates higher than 1 mL and the drug chromatogram was separated after a period longer than 8 min [14,15,16,17]. It is time consuming and uses a complex mobile phase that requires pH control. These systems should be developed using a more economical and ecofriendly method.
UPLC shows several advantages over other types of chromatography techniques. Liquid–liquid chromatography (LLC) consumes large volumes of water-immiscible organic solvents, which makes the process labor intensive, time consuming, and non-ecofriendly. In contrast, UPLC, which refers to ultra-performance liquid chromatography, enhances mainly three areas: “speed, resolution, and sensitivity”. In other words, it is a sensitive form of analysis that reduces the consumption of solvents and has a high speed of analysis.
Shifting from the HPLC to the UPLC method with a column composed of sub-2 µm particles results in several advantages. It provides rapid analytical techniques with improved resolution within a shorter time. The UPLC analytical method could be considered as a routine laboratory and industrial analysis for API and drug products, with the full benefits of lower cost and faster time with higher throughput [18].
The selection of the mobile phase plays an important role in the separation, as well as its effects on the system’s sustainability. Based on the previous works applied to FU, most of the mobile systems used phosphoric acid, which is metal corrosive and irritant and is incompatible with LC/MS. Formic acid is less harmful and compatible with the LC/MS system [19].
The regular analytical methods are generally implemented by evaluating one parameter for the predictable response, one factor at a time (OFAT), while others remain constant, however this demonstrates a limitation in estimating the interaction between the factors. Furthermore, it is impossible to predict the analytical response, the number of experiments, and the time needed in the presence of many conditions, which were not evaluated. Moreover, elevated risk in method failure and protocol revalidation after method transfer or alternative method development is required. Therefore, ICH10 introduces the analytical quality by design (AQbD) approach. AQbD is a trend in the pharmaceutical industry involving the implementation of analytical quality by design (AQbD) in the method development process as a part of risk management, pharmaceutical development, and the pharmaceutical quality system [20]. Sharma et al. (2019), studied the effect of the mobile phase constituents on critical analytical attributes (CAA), such as the tailing factor, assay, and the number of theoretical plates (N). It was found that increasing the water concentration from 30 to 40% had no effect on the tailing factor, but it significantly affected the N value [20].
Therefore, the present study aimed to analyze FU by using UPLC analytical procedures to minimize the consumption of the mobile phase and energy by applying a low flow rate and separating the drug within a very short retention time. An optimized and validated UPLC method was developed for the analysis of FU, and the experiment tools designed were utilized to investigate the effect of different concentrations of formic acid and different column temperatures on the analytical responses, including retention time (X1), peak area (X2), and peak height (X3).
2. Experimental
2.1. Material
Fusidic acid (FU) was purchased from Xi’an Sheerherb Biological Technology Co., Ltd. (Singapore). Formic acid ≥ 98% was obtained from Sigma-Aldrich (Steinheim, Germany). HPLC grade methanol was also obtained (Riedel-de Haën Laboratory Chemicals, Selzer, Germany). Deionized water was obtained from a Milli-Q water purification system (Millipore, Waltham, MA, USA).
2.2. Methods
2.2.1. Design of Experiment (DoE)
A 32 full factorial experimental design was used to illustrate the outcome of two independent factors, which were the formic acid concentration and column temperature, on the FU chromatogram properties, namely the retention time, peak area, and peak height. The Design Expert® software (Stat-Ease, Minneapolis, MN, USA) was used. Three concentrations of formic acid (1%, 0.55%, and 0.1%) and three different column temperatures (40, 32.5, and 25 °C) were selected to illustrate the influence of these two independent factors on the chromatogram responses, as shown in Table 1.

Table 1.
The variables for fusidic acid analytical procedures.
2.2.2. System and Conditions
The study operated with a highly sensitive UHPLC system (Ultimate 3000® binary solvent manager (Thermo Fisher scientific, Waltham, MA, United States), prepared with an automatic sampler and a photodiode array (PDA) detector. The separation was carried out by reverse-phase isocratic elution using a mobile phase consisting of 72% acetonitrile and 28% water containing different percentages of formic acid, delivered at a 0.3 mL/min flow rate through an Acquity® UPLC column HSS C18 (2.1 × 50 mm, 1.7 μm). The total run time was 2.0 min, and recognition was performed at 250 nm and applied at different temperatures. A working media of 50 ppm of FU in methanol was utilized in the analytical procedures.
2.2.3. Preparation of Standard Stock Solution, Calibration, and Quality Control Samples
A stock solution containing 100 ppm was prepared by dissolving 0.01 g of FU in 100 mL of methanol. Serial dilutions (1–100 ppm) from this stock were made in methanol. Triplicate injections for each percentage were conducted. The peak area was schemed against each concentration to acquire the calibration curve, and the corresponding regression equation was derived.
2.2.4. UPLC Analytical Validation
The strategy was validated according to the guidelines from the USFDA for bioanalytical methods (USFDA, 2001), and the European Medicines Agency (EMA, 2012) procedure was assessed in terms of several factors such as linearity, selectivity, sensitivity, precision, accuracy, the limit of detection, and the limit of quantitation.
Linearity and Range
Suitable dilutions of the FU stock solution (100 ppm) were used to prepare the concentrations within the calibration range of 1–100 ppm (1, 5, 25, 50, 75, 100 ppm). Triplicate injections for each percentage were conducted. Calibration solutions were injected in ascending order at each verification. The mathematical linear regression equation and correlation coefficient (R2) were used to statistically assess the linearity of the outcomes.
Accuracy and Precision
The intra-day accuracy and precision were evaluated by utilizing triplicate determinations of six FU standards within 24 h. However, the inter-day accuracy and precision were assessed in triplicate on three consecutive days. The general preciseness of the technique was explicit as relative standard deviation (%RSD), and the accuracy of the technique was explicit in terms of the % of the drug recovered.
Robustness
Robustness is described as the capacity of an analytical technique to stay robust, which means unchanged by slight modifications in the technique such as the flow rate, column age, column temperature, and detection wavelength, etc., and other environmental aspects (room temperature, humidity, etc.). This was investigated by modifying three parameters in the developed procedure, which were flow rate, wavelength, and temperature, by utilizing three different flow rates (0.28, 0.30, and 0.32 mL/min), three different wavelengths (248, 250, and 252 nm), and three different temperatures (38, 40, and 42 °C).
System Suitability
The tailing factor (T), asymmetry factor (AS), and reproducibility (%RSD) were determined from the replicant injection.
where b is the peak width after the peak center at 20% peak height and a is the peak width before the peak center.
where b is the peak width after the peak center at 10% peak height and a is the peak width before the peak center.
Forced Degradation Studies
A concentration of FU was exposed to hydrolysis under four different conditions. One part (v:v) of FU was mixed with four parts of 0.1 N HCl for acidic stress, 0.1 N NaOH for basic stress, or 30% H2O2. For thermal stress, 5 mL of the FU was placed in a hot air oven for 2 days at 50 °C.
2.2.5. Application of the Developed Method on Content Uniformity
The developed method was used to determine the content uniformity of FU in marketed cream (Leo, SN: 0036073975008585, LOT: C62270, EXP: 09/24). A vertical cut was performed from the upper rim to the bottom seal of the tube. A sample of 0.25 g of the cream was taken from the top, middle, and bottom of the tube. The samples were dissolved in 100 mL of phosphate buffer at a pH of 6.8. For complete extraction, the flasks were placed in a mechanical shaker water bath adjusted to 37 °C for 2 h. This solution was then filtered, and the content was measured using the developed UPLC assay.
3. Results and Discussion
3.1. Design of Experiment (DoE)
3.1.1. Effect on Retention Time (RT)
The effects of formic acid and column temperature (the independent factors) on the FU chromatogram retention time, peak area, and, peak height analyzed by ANOVA are listed in Table 2 and the Pareto standardized chart in Figure 1.
Table 2.
Analysis of variance for the effect of formic acid, and column temperature with their interactive and quadratic effects on the retention time, peak area, and peak height of FU chromatogram attributes.
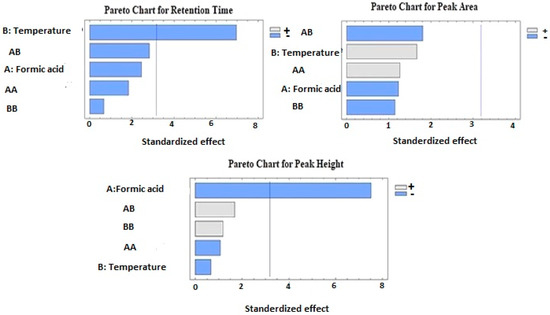
Figure 1.
Pareto charts for the effect of formic acid concentration and column temperature on the retention time, peak area, and peak height of fusidic acid.
As shown in the ANOVA table (Table 2), the column temperature exerted a significant antagonistic effect on the FU chromatogram retention time (p value = 0.0120). In contrast, the concentration of the formic acid, quadratic effects (X1X1 and X2X2), and the interactive factors (X1X2) did not show any significant effect on the retention time (p value > 0.05).
Figure 2 shows the individual effects of formic acid and column temperature on the chromatogram retention time. The results indicated that increasing the column temperature resulted in shortening the chromatogram retention time, while formic acid at lower concentrations resulted in increasing the retention time, followed by increasing retention at higher formic acid levels, but both effects were insignificant.
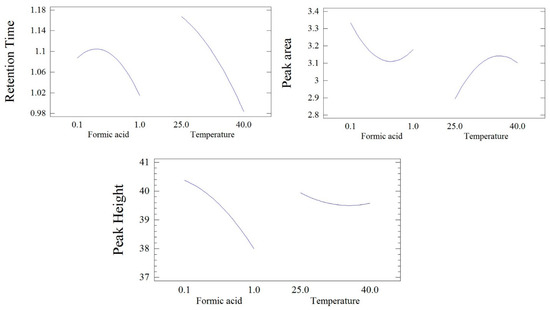
Figure 2.
The individual effect of formic acid concentration and column temperature on the retention time, peak area, and peak height of fusidic acid.
The contour plot (Figure 3) shows that high retention time values were obtained in the region for the low temperature with medium and higher formic acid concentrations. Similarly, Table 3 reveals that the shortest retention value (0.862 ± 0.042 min) was obtained in the case when the highest formic acid concentration (1%) was used along with the highest column temperature (40 °C).
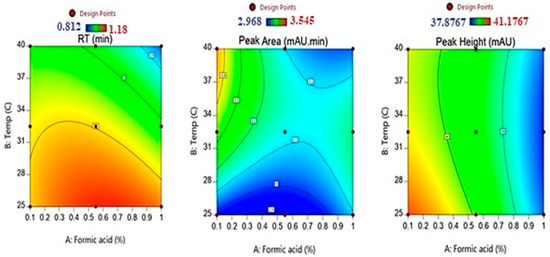
Figure 3.
The contour plots for the effect of formic acid concentration and temperature on the retention time, peak area, and peak height of fusidic acid.
Table 3.
The observed responses for the analytical procedure of FU using UPLC (mean ± SD).
The effect of column temperature on the retention time of the UPLC chromatogram was studied by several investigators, who concluded that UPLC chromatogram is highly affected by the column temperature. Raising the column temperature may result in lowering the viscosity of the mobile phase solvent and, hence, lowering the backpressure [21,22].
Yang et al. [23], indicated that both retention time and peak area of analytes’ chromatograms were reduced by raising the column temperature, but the analyst should make sure that the column efficiency is either improved or kept almost unaffected when increasing the temperature in the low temperature range [23].
3.1.2. Effect on Peak Area
The ANOVA for the effect of formic acid and column temperature on the FU chromatogram peak area is shown in Table 2 and the standardized Pareto chart in Figure 1. The obtained data results indicated that the individual effects (X1 and X2), the interactive effect of formic acid temperature (X1X2), and the quadratic effects did not exert a significant impact on the drug chromatogram peak area. The Pareto chart indicated an agonistic effect by the formic acid quadratic value and its temperature interaction on the chromatogram peak area, in addition to antagonistic effects by the temperature and its quadratic value on the response. However, these effects were insignificant (p value > 0.05).
The individual effects of formic acid and column temperature on the chromatogram retention time are depicted in Figure 2. The results showed that increasing the formic acid concentration in the mobile phase resulted in a slight reduction in the peak area, followed by slight increases at higher formic acid values. In contrast, the rise in column temperature resulted in a slight increase in the chromatogram peak area, while formic acid at lower concentrations resulted in increasing the retention time, followed by increasing the retention at higher formic acid levels, but both effects were insignificant.
Lower and medium values for the FU chromatogram peak area were depicted at all formic acid levels with medium temperatures, while higher values in the response were observed for low formic acid concentrations and higher temperatures, as illustrated by the contour plot in Figure 3.
3.1.3. Effect on Peak Height
The effect of formic acid concentration and column temperature on the peak height of the FU chromatogram is displayed in the standardized Pareto chart in Figure 1 and Table 2. There was a highly significant antagonistic effect (p = 0.0041) by formic acid on the chromatogram peak height. However, the individual effect of the temperature, the interactive effect of the formic acid temperature (X1X2), and quadratic effects on the peak height of the drug chromatogram were insignificant (p value > 0.05).
The individual effects of formic acid and column temperature on the peak height of the FU UPLC chromatogram are illustrated in Figure 2. Increasing the formic acid concentration in the mobile phase caused a noticeable reduction in the chromatogram peak height, while elevating the column temperature led to a slight and insignificant decrease in the chromatogram peak height.
The contour plots, as shown in Figure 3, on the effects of formic acid and column temperature on the peak height of the drug chromatogram denote that the highest values in the chromatogram peak height were obtained at lower values of formic acid and temperature. Moreover, higher values in the response were noticed for low formic acid concentrations with medium and higher temperatures.
The antagonistic effects of formic acid on the FU chromatogram peak area and peak height might be explained based on the analyte nature. The elution is dependent on the ionization of analyte molecules and, as FU is an acidic drug, since increasing the formic acid concentration kept the drug molecules in a unionized form, this resulted in decreasing the chromatogram peak area and peak height by reducing the elution efficiency [23,24]. Ibrahim et al. [25] used the QbD approach in the analysis of glibenclamide, an acidic antidiabetic drug. They showed that by increasing the concentration of formic acid in the mobile phase up to 0.5%, the mobile phase was more acidic and the drug appeared in the unionized form, resulting in lower resolution, which was reflected in the peak height.
3.2. Optimization of UPLC Conditions for FU Analysis
Based on statistical analysis of the effect of the dependent factors (formic acid, X1, and column temperature, X2) on the FU UPLC chromatogram attributes, the optimization conditions were suggested based on the following desirability: minimum chromatogram retention time, maximum peak area, and maximum peak height.
Based on the modeling made by the statistic software, the following factors were suggested by the software for the optimal UPLC conditions for FU analysis: formic acid = 0.1% and temperature = 40 °C, as shown in Table 4. The predicted and observed values for the responses of the FU UPLC chromatogram optimized analytical conditions are listed in Table 4, which were found to be close to each other. The observed retention time for the FU chromatogram was 1.02 ± 0.019 min (the predicted retention time was 1.02 min). The observed chromatogram peak area was 3.70 ± 0.0.043 mAU/min compared to the predicted value (3.45 mAU/min) with a peak height value of 40.64 ± 0.77 mAU (the predicted value was 40.23 mAU).
Table 4.
The optimum condition of FU analysis using UPLC with the predicted and observed analytical values.
The UPLC chromatogram for FU obtained by the optimized analytical conditions is depicted in Figure 4, in which the drug peak appeared at a retention time of 1.023 min. The chromatogram also showed the mobile phase peak at 0.5 min.
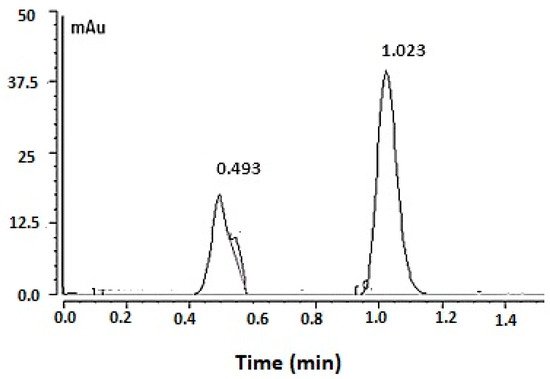
Figure 4.
The fusidic acid chromatogram obtained by applying the optimized UPLC condition. Optimized chromatogram for 50 µg/mL of fusidic acid obtained by applying the optimized UPLC condition.
3.3. Method Validation
3.3.1. Linearity
The UPLC assay method for FU was linear in the concentration range from 1 to 100 ppm, as shown in Figure 5. The correlation coefficient was 0.999, with a linear regression equation of Y = 0.0541X − 0.0076.
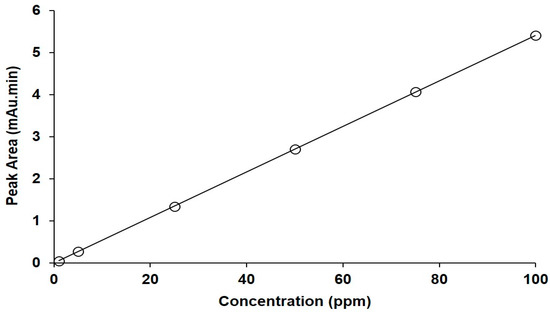
Figure 5.
The calibration curve for FU obtained using the developed UPLC assay.
3.3.2. Limit of Detection and Limit of Quantitation
According to the LOD and LOQ equations, they were calculated based on the SD of the intercept and the slope for the constructed calibration curve. The LOD was 0.123 ppm and the LOQ was 0.373 ppm. These smallest values indicate the sensitivity of the used method.
3.3.3. Accuracy and Precision
The accuracy of the assay used was determined by calculating the % recovery of three nominal concentrations (1, 50, 75 ppm) and their RSD% (Table 5). The % recovery ranged from 89.353 ± 1.564 to 100.922 ± 1.463, with an RSD% of less than 2. Regarding the precision, a measured concentration, as well as an RSD%, were calculated intra and intra-day (Table 5). The RSD% for all aspects was less than 2%, indicating a precise assay method even with varied parameters.
Table 5.
Inter and intra-day statistical results.
3.3.4. Robustness
The study’s robustness was performed by changing the wavelength, temperature, and flow rate. The values obtained on the statistical parameters for the chromatographic responses (retention time, peak area, and peak height) for all the variations of the detection wavelength, temperature, and the flow rate at the target concentration of 52 ppm are shown in Table 6. The calculated RSD% was significantly low and less than 0.5%, indicating the method’s robustness and ability to separate the drug with any minor change that occurred.
Table 6.
Robustness RSD statistics.
3.3.5. System Suitability
Table 7 summarizes the system suitability in term of the tailing factor (T), asymmetry factor (AS), and reproducibility represented as (%RSD). The data were analyzed for six replicate injections of the FU standard with a concentration of 50 ppm.
Table 7.
System suitability for fusidic acid UPLC analysis.
According to the ICH, a chromatogram with a tailing factor < 2 and %RSD < 2 is recommended.
3.4. Forced Degradation Study
The degradation chromatograms for FU subject to various stress conditions are seen in Figure 6. The stability samples were stored at 50 °C for 2 days and then analyzed. The study showed significant degradation of FU in an alkaline and acidic medium by 95% and 98%, respectively. Moreover, 88% of the drug degraded with 30% H2O2. In contrast, the stability chromatogram shows no sign of degradation of FU with thermal stress, and no change in the peak area was observed compared with the freshly prepared samples. The obtained data agree with the data obtained in a previous study by Sharma et al. [20], who carried out an FU degradation kinetics assessment using the Arrhenius equation. They found that a high value of first order degradation rate constant was obtained in the acidic environment, followed by the alkaline environment, while the lowest degradation rate was observed in the oxidative stress condition (30% H2O2). The results prove the efficiency of the method used in determining a trace amount of FU. A good resolution between the two peaks was obtained, indicating the ability of the method to separate the drug from other degradation products.
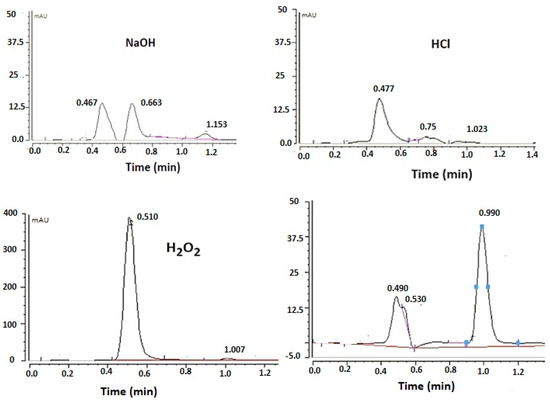
Figure 6.
Forced degradation chromatograms obtained for fusidic acid.
3.5. Analysis of Drug Content Uniformity in Marketed Cream
The content uniformity of FU in marketed cream was analyzed using the developed UPLC. The average content of the FU was 109.49 ± 6.31% with an RSD of 5.76%. The results comply with the pharmacopeia limit, which states that the content uniformity for drugs of less than 5 gm should be within 90 to 110% with an RSD of less than 6%.
4. Conclusions
Analytical method development helps to understand the critical process parameters and to minimize their influence on accuracy and precision. The optimized UPLC analysis procedure effectively separates the FU in a short time with good resolution, which in turn reduces solvent consumption. The developed method was simple and fast. Moreover, the proposed method is considered valid according to the ICH and FDA acceptance criteria. In future work, a degradation kinetic study for FU will be carried out, because it is very important to draw a full picture of the degradation pathways of the API.
Author Contributions
M.I.: Methodology, Resources, Data curation, Writing-original draft, Writing—review; N.A.A.: Methodology, Formal Analysis; D.A.: Data curation, Writing-original draft, Writing—review & editing; M.M.S.B.: Methodology, Writing—review; E.T.: Resources, Data curation; W.A.M.: Data curation, Writing—review; A.M.H.: Resources, Software. All authors have read and agreed to the published version of the manuscript.
Funding
The Research Supporting Project number (RSP2023R171), King Saud University, Riyadh, Saudi Arabia.
Data Availability Statement
All data is contained within the article.
Conflicts of Interest
The authors declare no conflict of interest.
References
- Ueda, C.T.; Shah, V.P.; Derdzinski, K.; Ewing, G.; Flynn, G.; Maibach, H.; Marques, M.; Rytting, H.; Shaw, S.; Thakker, K.; et al. Topical and Transdermal Drug Products. Dissolut. Technol. 2010, 17, 12–25. [Google Scholar] [CrossRef]
- The United States Pharmacopeial Convention. Topical and Transdermal Drug Products. In Proceedings of the Pharmacopeial Forum, Brussels, Belgium, 25 March 2009; Volume 35, pp. 750–764. [Google Scholar]
- Marsona, B.M.; Concentino, V.; Junkert, A.M.; Fachi, M.M.; Vilhena, R.O.; Pontarolo, R. Validation of analytical methods in a pharmaceutical quality system: An overview focused on HPLC methods. Química Nova 2020, 43, 1190–1203. [Google Scholar] [CrossRef]
- Rina, R.; Baile, M.; Jain, A. A Review: Analytical Method Development and Validation. Syst. Rev. Pharm. 2021, 12, 450–454. [Google Scholar]
- FDA. Analytical Procedures and Methods Validation: Chemistry, Manufacturing, and Controls; Federal Register: Washington, DC, USA, 2000; Volume 65, pp. 52776–52777. Available online: https://www.fda.gov/regulatory-information/search-fda-guidance-documents/analytical-procedures-and-methods-validation-drugs-and-biologics (accessed on 1 May 2023).
- Long, J.; Ji, W.; Zhang, D.; Zhu, Y.; Bi, Y. Bioactivities and Structure–Activity Relationships of Fusidic Acid Derivatives: A Review. Front. Pharmacol. 2021, 12, 759220. [Google Scholar] [CrossRef] [PubMed]
- Collignon, P.; Turnidge, J. Fusidic acid in vitro activity. Int. J. Antimicrob. Agents 1999, 12, S45–S58. [Google Scholar] [CrossRef] [PubMed]
- Tansirichaiya, S.; Goodman, R.N.; Guo, X.; Bulgasim, I.; Samuelsen, Ǿ.; Al-Haroni, M.; Roberts, A.P. Intracellular Transposition and Capture of Mobile Genetic Elements following Intercellular Conjugation of Multidrug Resistance Conjugative Plasmids from Clinical Enterobacteriaceae Isolates. Microbiol. Spectr. 2022, 10, e02140-21. [Google Scholar] [CrossRef] [PubMed]
- Wieland, M.; Holm, M.; Rundlet, E.J.; Morici, M.; Koller, T.O.; Maviza, T.P.; Pogorevc, D.; Osterman, I.A.; Müller, R.; Blanchard, S.C.; et al. The cyclic octapeptide antibiotic argyrin B inhibits translation by trapping EF-G on the ribosome during translocation. Proc. Natl. Acad. Sci. USA 2022, 119, e2114214119. [Google Scholar] [CrossRef] [PubMed]
- Cé, R.; Pacheco, B.Z.; Ciocheta, T.M.; Barbosa, F.S.; Alves, A.; Dallemole, D.R.; Lavayen, V.; Guterres, S.S.; Steppe, M.; Pohlmann, A.R. Antibacterial activity against Gram-positive bacteria using fusidic acid-loaded lipid-core nanocapsules. React. Funct. Polym. 2021, 162, 104876. [Google Scholar] [CrossRef]
- Bourles, A.; Tristan, A.; Vandenesch, F.; Bes, M.; Laurent, F.; Ranc, A.G.; Kainiu, M.; Gourinat, A.C.; Biron, A.; Cazarola, C.; et al. A fusidic acid-resistant (PVL+) clone is associated with the increase in methicillin-resistant Staphylococcus aureus in New Caledonia. J. Glob. Antimicrob. Resist. 2020, 30, 363–369. [Google Scholar] [CrossRef]
- Shewale, S.; Undale, V.; Deshmukh, A.; Wawale, V.; Gundecha, S.; Bhalchim, V. Assessment of Fusidic acid (FA) and Beclomethasone Dipropionate (BD) In Semi-solid Dosage Form Using Validated High-Performance Liquid Chromatography Method. J. Pharm. Negat. 2022, 13, 1272–1285. [Google Scholar]
- Lee, G.; Choi, M.; Truong, Q.-K.; Mai, X.-L.; Kang, J.-S.; Woo, M.-H.; Na, D.-H.; Chun, I.-K.; Kim, K.H. Development of HPLC assay method of fusidate sodium tablets. Anal. Sci. Technol. 2017, 30, 154–158. [Google Scholar]
- Jakasaniya, M.A.; Shah, J.S.; Maheswari, D.G. Simultaneous estimation of clobetasol propionate and fusidic acid in cream dosage form by reversed phase high performance liquid chromatographic method. Pharmacophore 2014, 5, 231–238. [Google Scholar]
- Nawaz, M.; Arayne, M.; Sultana, N.; Haider, A.; Hisaindee, S. Simultaneous determination of fusidic acid and steroids from bulk drugs and human plasma by reversed phase HPLC. Acta Chromatogr. 2014, 6, 57–66. [Google Scholar] [CrossRef]
- Peter, J.D.; Jehl, F.; Pottecher, T.; Dupeyron, J.P.; Monteil, H. Pharmacokinetics of Intravenous Fusidic Acid in Patients with Cholestasis. Antimicrob. Agents Chemother. 1993, 37, 501–506. [Google Scholar] [CrossRef] [PubMed]
- Panagopoulos, P.; Tsaganos, T.; Plachouras, D.; Carrer, D.P.; Papadopoulos, A.; Giamarellou, H.; Kanellakopoulou, K. In vitro elution of moxifloxacin and fusidic acid by a synthetic crystallic semihydrate form of calcium sulphate (Stimulan). Int. J. Antimicrob. Agents 2008, 32, 485–487. [Google Scholar] [CrossRef] [PubMed]
- Padmavathi, Y. Quality control analytical methods—Switch from HPLC to UPLC. In Proceedings of the 4th International Summit on GMP, GCP & Quality Control, Hyderabad, India, 26–28 October 2015. [Google Scholar]
- Dolan, J. A Guide to HPLC and LC-MS Buffer Selection. Available online: http://www.ace-hplc.com/ (accessed on 24 April 2023).
- Sharmaa, G.; Thakura, K.; Razab, K.; Katarea, O.P. Stability kinetics of fusidic acid: Development and validation of stability indicating analytical method by employing Analytical Quality by Design approach in medicinal product(s). J. Chromatogr. B 2019, 1120, 113–124. [Google Scholar] [CrossRef] [PubMed]
- Li, J.B.; Waters Corporation; Milford, M.A. Effect of Temperature on Column Pressure, Peak Retention Time and Peak Shape. Available online: Chromeextension://efaidnbmnnnibpcajpcglclefindmkaj/https://www.waters.com/webassets/cms/library/docs/watersamd30.pdf (accessed on 22 June 2022).
- Waterlot, C.; Goulas, A. Temperature Effects on Retention and Separation of PAHs in Reversed-Phase Liquid Chromatography Using Columns Packed with Fully Porous and Core-Shell Particles. J. Chem. 2016, 2016, 7294105. [Google Scholar] [CrossRef]
- Yang, Y.; Lamm, L.J.; He, P.; Kondo, T. Temperature effect on peak width and column efficiency in subcritical water chromatography. J. Chromatogr. Sci. 2002, 40, 107–112. [Google Scholar] [CrossRef] [PubMed]
- Malenović, A.; Ivanović, D.; Medenica, M.; Jančić, B. Application of the response surface methodology for RP-HPLC analysis of lidocaine and cetrimonium bromide. Acta Chim. Slov. 2004, 51, 559–566. [Google Scholar]
- Ibrahim, M.A.; Alshora, D.H.; Alowayid, M.A.; Alanazi, N.A.; Almutairi, R.A. Development and Validation of a Green UPLC Analytical Procedure for Glibenclamide Determination in Pharmaceutical Product Using Response Surface Methodology. Orient. J. Chem. 2022, 38, 865–874. [Google Scholar] [CrossRef]


Disclaimer/Publisher’s Note: The statements, opinions and data contained in all publications are solely those of the individual author(s) and contributor(s) and not of MDPI and/or the editor(s). MDPI and/or the editor(s) disclaim responsibility for any injury to people or property resulting from any ideas, methods, instructions or products referred to in the content. |
© 2023 by the authors. Licensee MDPI, Basel, Switzerland. This article is an open access article distributed under the terms and conditions of the Creative Commons Attribution (CC BY) license (https://creativecommons.org/licenses/by/4.0/).