Article

The Effect of Paraburkholderia on the Nutrients in Eutrophic Lakes

State Environmental Protection Engineering Center for Pollution Treatment and Control in Textile Industry, College of Environmental Science and Engineering, Donghua University, Shanghai 201620, China
*
Author to whom correspondence should be addressed.
Separations 2023, 10(12), 595; https://doi.org/10.3390/separations10120595
Submission received: 11 November 2023 / Revised: 28 November 2023 / Accepted: 4 December 2023 / Published: 6 December 2023

Abstract

:
Cyanobacterial blooms in freshwater bodies are mainly attributed to the excess loading of nutrients. The microbes in sediments may affect nutrient migration and transformation during the growth of cyanobacteria. This study focused on the role of Paraburkholderia disturbance in affecting the sediment nutrient conditions and further contributing to cyanobacterial community succession in Meiliang Bay, Lake Taihu. The dissolving phosphorus and fixing nitrogen of Paraburkholderia with different concentration and characteristic capabilities, as well as the impact on nutrients (nitrogen (N), phosphorus (P), iron (Fe), etc.) in eutrophic lakes were determined. The results indicated that the various forms of phosphorus in the sediments showed total phosphorus (TP) > inorganic phosphorus (IP) > iron/aluminum-bound phosphate (NaOH-P) > algal-available phosphorus (AAP) > organic phosphorus (OP) > calcium-bound phosphate (HCl-P). Additionally, it was observed that with higher values of Paraburkholderia (OD600), the higher the corresponding risk of endogenous nutrient release from the sediments into the overlying water (but more is not always better), especially for the solubilization of HCl-P. The diffusion fluxes of TP, total nitrogen (TN) and Fe at the sediment–water interface (SWI) were all positive in the bacteria only experiment, with maximum values of 0.64, 15.0 and 5.02 mg/(m2d), respectively. Additionally, it was interesting that Paraburkholderia were able to produce organic acids, causing a decrease in pH. Furthermore, glucose levels can seriously affect water quality, especially the reduction in dissolved oxygen (DO) (down to 0.01 mg/L), leading to a series of side effects that have a huge impact on cyanobacterial community succession. These results provide a theoretical basis for the microbial ecological factors in eutrophic lakes.

1. Introduction

Cyanobacteria, also known as blue-green algae, have the potential to cause global environmental problems such as eutrophication with their blooms [1,2]. Cyanobacteria absorb nutrient salts inside cells and release into the surrounding water during cell death and lysis [3,4]. During cyanobacterial blooms, high densities of algae cause significant differences in dissolved oxygen (DO) and pH [5]. Cyanobacterial decay generates organic matter (OM) for microbial growth and metabolism, which manifests as a significant increase in microbial community abundance, activity and diversity. It has been found that during cyanobacterial growth, more bacteria with phosphorus-solubilizing functions appear [6].
Cyanobacterial resuscitation is closely related to endogenous phosphorus in sediments, and cyanobacterial blooms benefit more from the effects of endogenous phosphorus [7,8,9]. Phosphorus concentration is one of the main drivers of cyanobacterial succession, which impacts the intensity, diversity and toxicity of cyanobacterial blooms [10]. A study on Lake Taihu showed that the storage of algal-available phosphorus in the sediment amounted to 5168 tons, and if all of it was released, the phosphorus level in the overlying water would increase by 0.84 mg/L [11]. Generally, the cyanobacterial biovolume was positively correlated not only with the concentration of total phosphorus (TP), but also with the concentration of total nitrogen (TN) [12]. Some cyanobacterial blooms are associated with water nutrients [13], with TP levels above 0.01 mg/L, ammonia nitrogen (NH4+-N) or nitrate nitrogen (NO3-N) levels above 0.1 mg/L, and total nitrogen (TN) above 0.15 mg/L [14,15]. When cyanobacteria decay, intracellular nutrients are degraded and accumulated in the sediment, which serves as a temporary reservoir for a new round of algal growth under the action of microorganisms and extracellular enzymes, and the algal–algal cycle sustains the cyanobacterial blooms [16,17]. There is variability in the redox conditions at the sediment–water interface (SWI) and microbial decomposition and mineralization, which can lead to complex biochemical processes between the sediment and the aquatic environment [18].
Sediment, a unique part of the aquatic ecosystem, has significantly higher microbial diversity than the overlying water [19]. Here, Paraburkholderia belong to Burkholderia from the sediments on Lake Taihu. Burkholderia are named after the plant pathologist Walter Burkholder [20]. Burkholderia are in the class of Gram-negative bacteria, which are mostly isolated from the Pseudomonad genera [21]. Burkholderia, widely distributed and multifunctional bacteria, occupy a variety of ecological niches including soil, water, plants, and animals [22]. Moreover, Burkholderia have an important role in phosphorus solubilization and nitrogen fixation [23,24,25,26].
This study is mainly focused on how different concentrations Paraburkholderia affect nutrients (i.e., N and P), with an emphasis on linking the nutrient cycling to cyanobacterial community structure and succession in eutrophic lakes. Research perspectives on Paraburkholderia concerning nutrient salts and cyanobacterial growth are discussed and presented with respect to the following: (1) bacterial properties and their role in the release of P and N nutrients (within sediments); (2) nutrient-based effects on cyanobacterial growth; and (3) nutrient investigations and prediction of cyanobacterial production.

2. Material and Methods

2.1. Bacteria and Cyanobacteria

Paraburkholderia were obtained from sediments in Meiliang Bay (120°8′22″ E, 31°30′3″ N) during the overwinter period of cyanobacteria (December 2020). Here, Paraburkholderia possessed inorganic and organic phosphorus-dissolving abilities. Microcystis aeruginosa (FACHB-1322), purchased from the Freshwater Culture Collection at the Institute of Hydrobiology (Wuhan, China), were employed in this study.

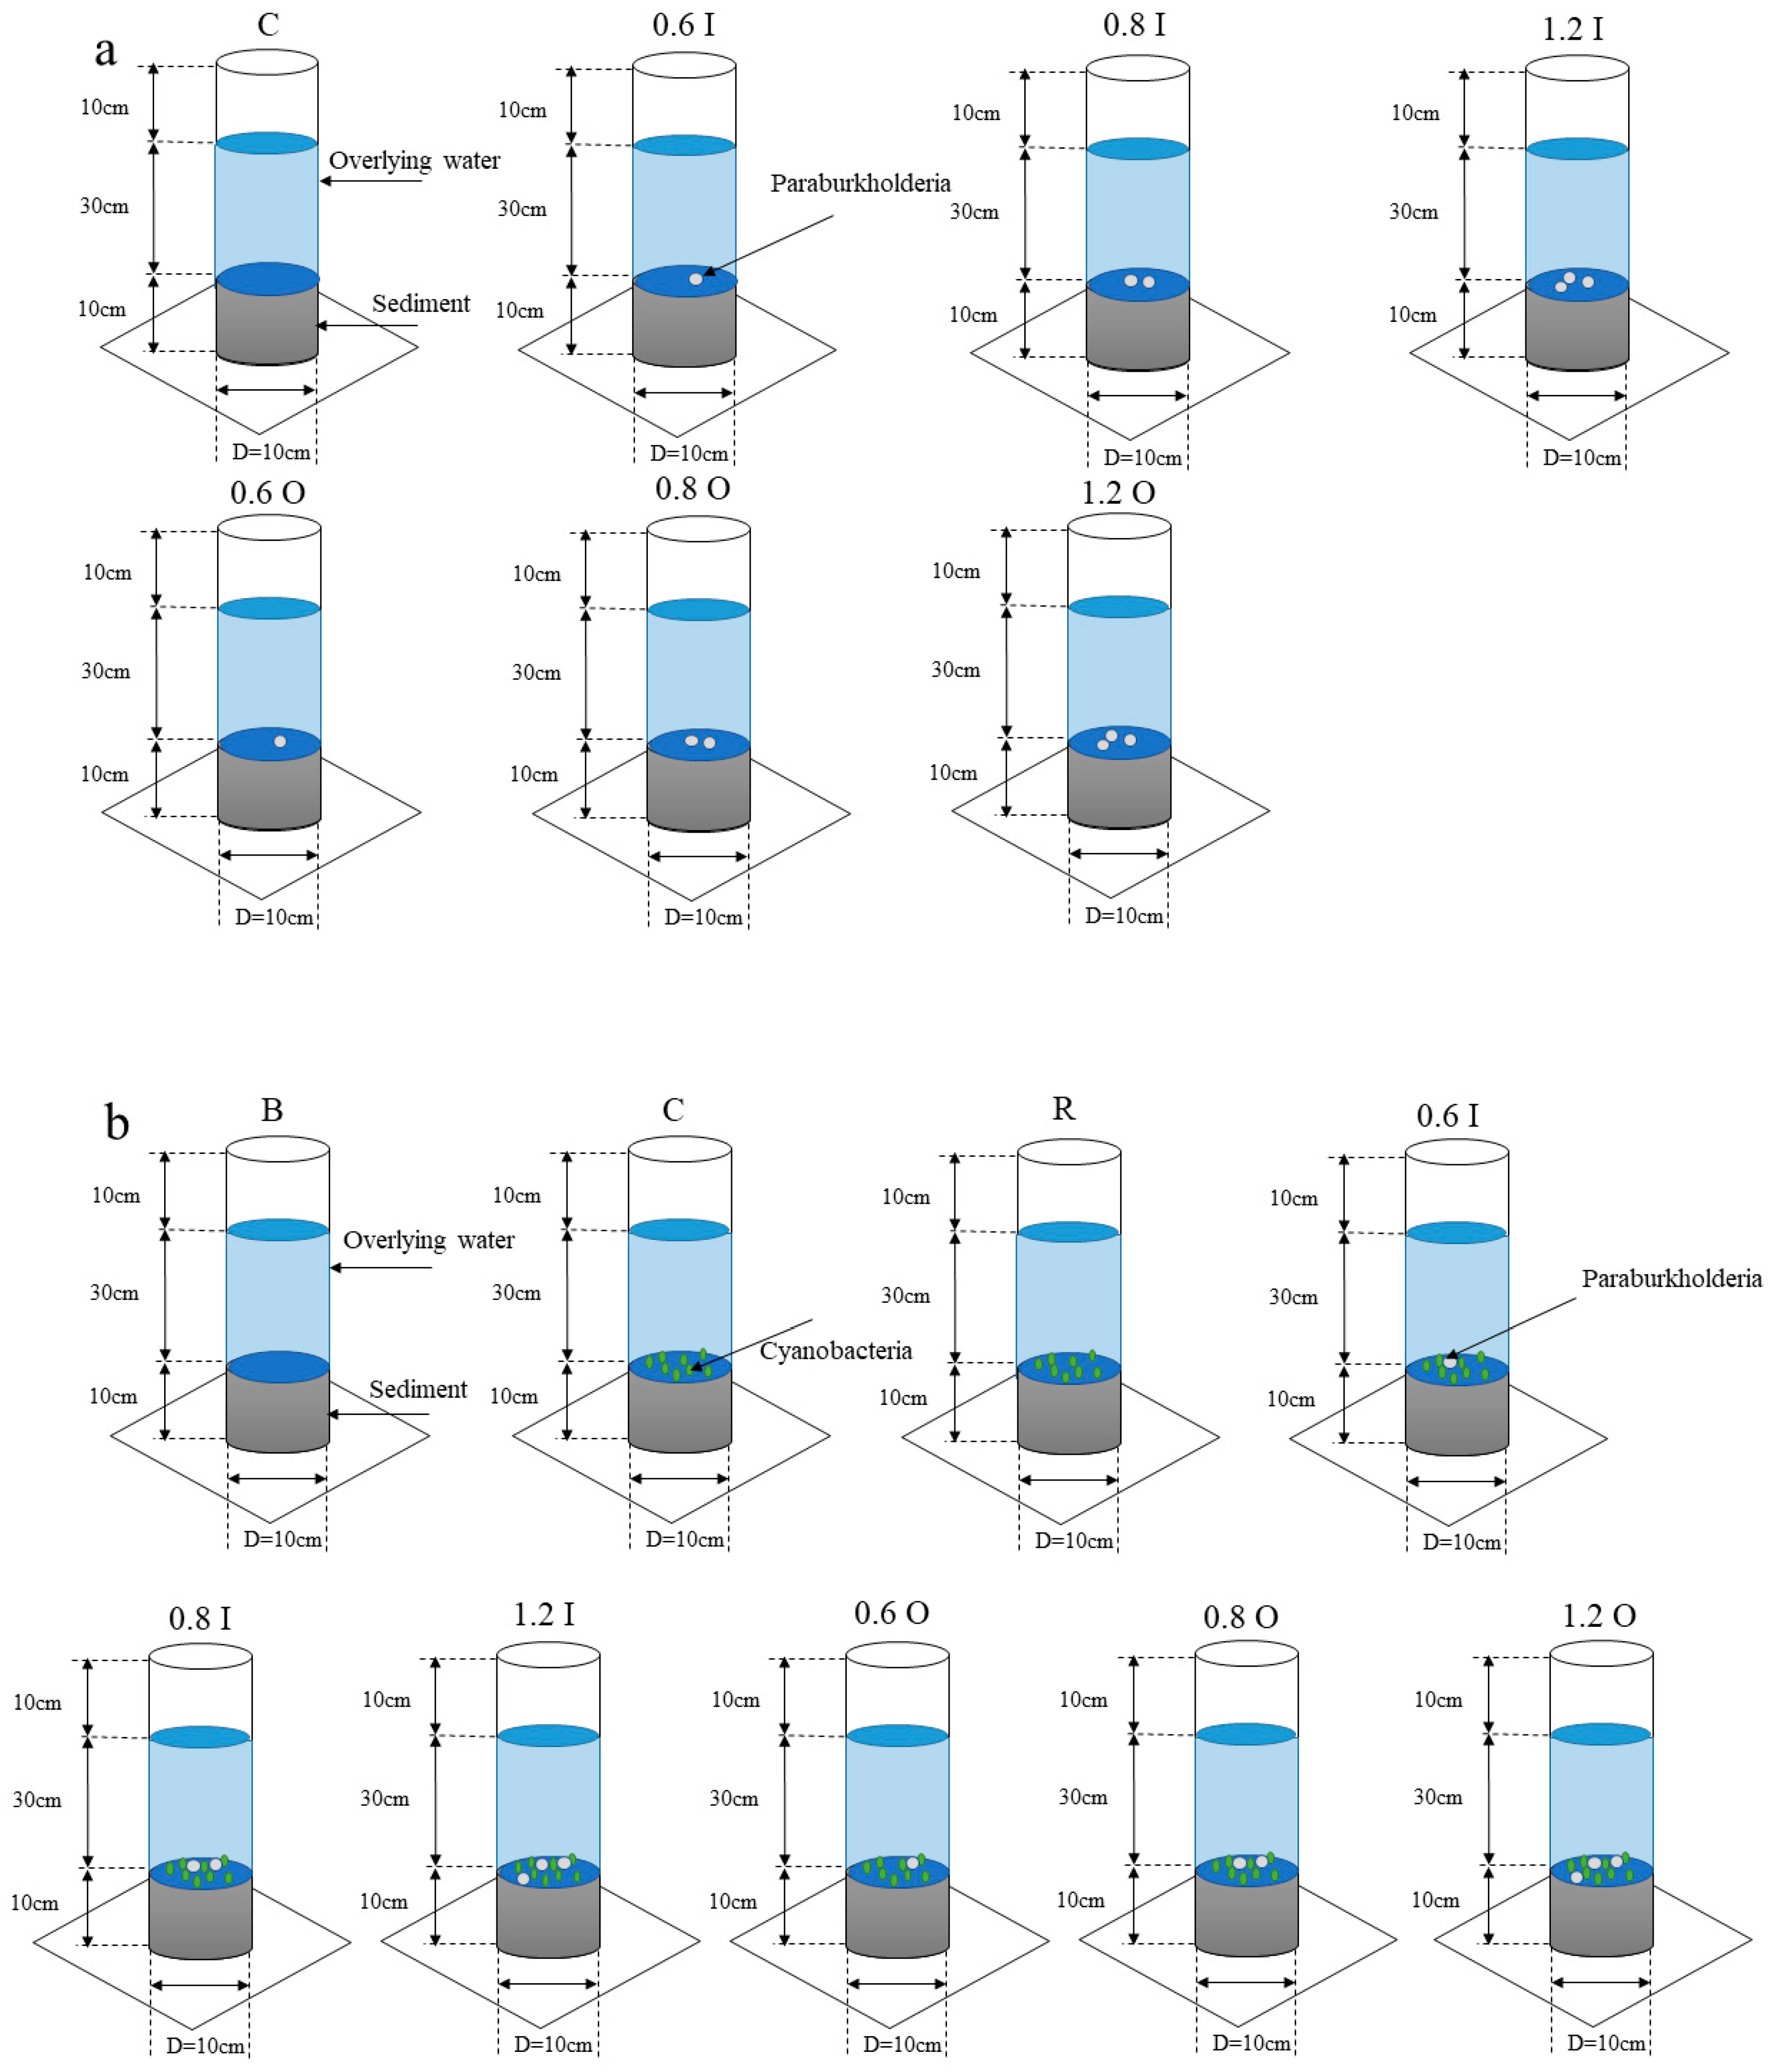
2.2. Constructing an SWI with Different Concentrations of Bacteria

The experimental apparatus was composed of an acrylic tube with an outer diameter of 10 cm (inner diameter of 9 cm) and a height of 50 cm. The overlying water and sediment were gathered to build the SWI (the depth ratio of sediment to water was 1:3) during the dormancy phases of the cyanobacteria (December 2020) in Meiliang Bay. One control group and six experimental groups were set up in this experiment (Figure 1a). Sediment cores containing Paraburkholderia were constructed as experimental groups. Since Paraburkholderia has the property of solubilizing both inorganic and organic phosphorus, the experimental groups were divided into two main groups. No Paraburkholderia were added in the control group. Additionally, the experimental groups of 0.6 I, 0.8 I, 1.2 I, 0.6 O, 0.8 O and 1.2 O were added to the control group with Paraburkholderia (property of solubilizing both inorganic and organic phosphorus, OD600 = 0.6, 0.8, 1.2). All the sediment cores were placed in temperature-controlled environments with air conditioning (at 25 ± 1 °C) for 30 days. Water samples were collected and measured daily for the first 10 days and every 4 days for the next 20 days. The samples were supplemented with an equal amount of overlying water. Further, different concentrations of Paraburkholderia (OD600 = 0.6, 0.8, 1.2) were added at 0, 5, 12 and 20 days.

2.3. Construction of the Bacteria–Algae System at the SWI

During this research phase, we added Microcystis aeruginosa (biomass assessment indicators, OD680 = 0.08) on the basis of the first phase. The sediment cores were divided into nine groups (Figure 1b). Sediment cores that only contained sediment and overlying water were constructed as a blank group. Compared to the blank group, Microcystis aeruginosa was added to the control group. Additionally, the experimental groups of 0.6 I, 0.8 I, 1.2 I, 0.6 O, 0.8 O and 1.2 O were added to the control group with Paraburkholderia (property of solubilizing both inorganic and organic phosphorus, OD600 = 0.6, 0.8, 1.2). The resuscitation group was used as a reference, which used sediment cores from the cyanobacterial resuscitation period. The objective was to observe the effects of the sediments from the cyanobacterial dormant period with the addition of Paraburkholderia and the sediments from the cyanobacterial resuscitation period without the addition of Paraburkholderia on the nutrient salinity and cyanobacterial growth in the overlying water; furthermore, we wanted to observe the connection and difference between these two different phases. Similarly, different amounts of characterized bacteria (OD600 = 0.6, 0.8, 1.2) were added at days 0 and 7. In addition to this, 1 g/L glucose solution was added to the solutions at day 7. All sediment cores were placed in a constant light incubator at 25 °C for 14 days. The ratio of light to dark was 12:12 h. The light intensity was 2500 lux.

2.4. Analytical Methods

Dissolved oxygen (DO) and pH were measured at the SWI using a multi-parameter water quality meter (Hach, Loveland, CO, USA). The total phosphorus (TP), soluble reactive phosphorus (SRP), ammonia nitrogen (NH4+-N), nitrate nitrogen (NO3-N), total nitrogen (TN), total iron (Fe), iron ion (Fe2+) and chlorophyll a (Chl a) were tested in the overlying water sample using the environmental quality standardized methods in China. Phosphorus (TP and SRP), nitrogen (NH4+-N, NO3-N and TN), iron (Fe and Fe2+), and Chl a were determined according to the ammonium molybdate spectrophotometric method, Nessler’s reagent spectrophotometry, ultraviolet spectrophotometric methods, alkaline potassium persulfate digestion UV spectrophotometric methods, phenanthroline spectrophotometry, and spectrophotometric method by a UV spectrophotometer (UV 1900i, Shimadzu, Kyoto, Japan), respectively. Sediments (top 5 cm) were collected on days 5, 10, 15, 20, 30 and days 5, 10, 14 at the SWI during the two phases, respectively. Additionally, different forms of phosphorus (TP, NaOH-P, HCl-P, IP and OP) were measured using the SMT protocol [27]. Algal-available phosphorus (AAP) was determined according to the method of a previous study [28]. The organic matter (OM) content of the sediment was calculated according to the loss on ignition to constant mass (4 h) at 550 °C [29].
The apparent diffusion flux (Fi, mg/(m2 d)) of nutrient salts in the sediment was evaluated using the following equations [30]:
F i = C i C 0 V + C j C i ( C j C 0 ) V j /   ( S   t )
where V (L) and Vj (L) represent the total volume and sampling volume from the overlying water, respectively; Ci (mg/L) and Cj (mg/L) are the nutrient concentrations in the overlying water at the time of the i-th and j-th sampling, respectively; C0 (mg/L) is the nutrient concentration in the overlying water before incubation; S (m2) is the cross-sectional area of the SWI; and t (d) is the experimental time.
In this study, all experiments were repeated three times and error bars indicate the standard deviation of the means (n = 3). The relationship between the relevant parameters in the overlying water and phosphorus in the sediment was evaluated using IBM SPSS Statistics 21 (Pearson).

3. Results and Discussion

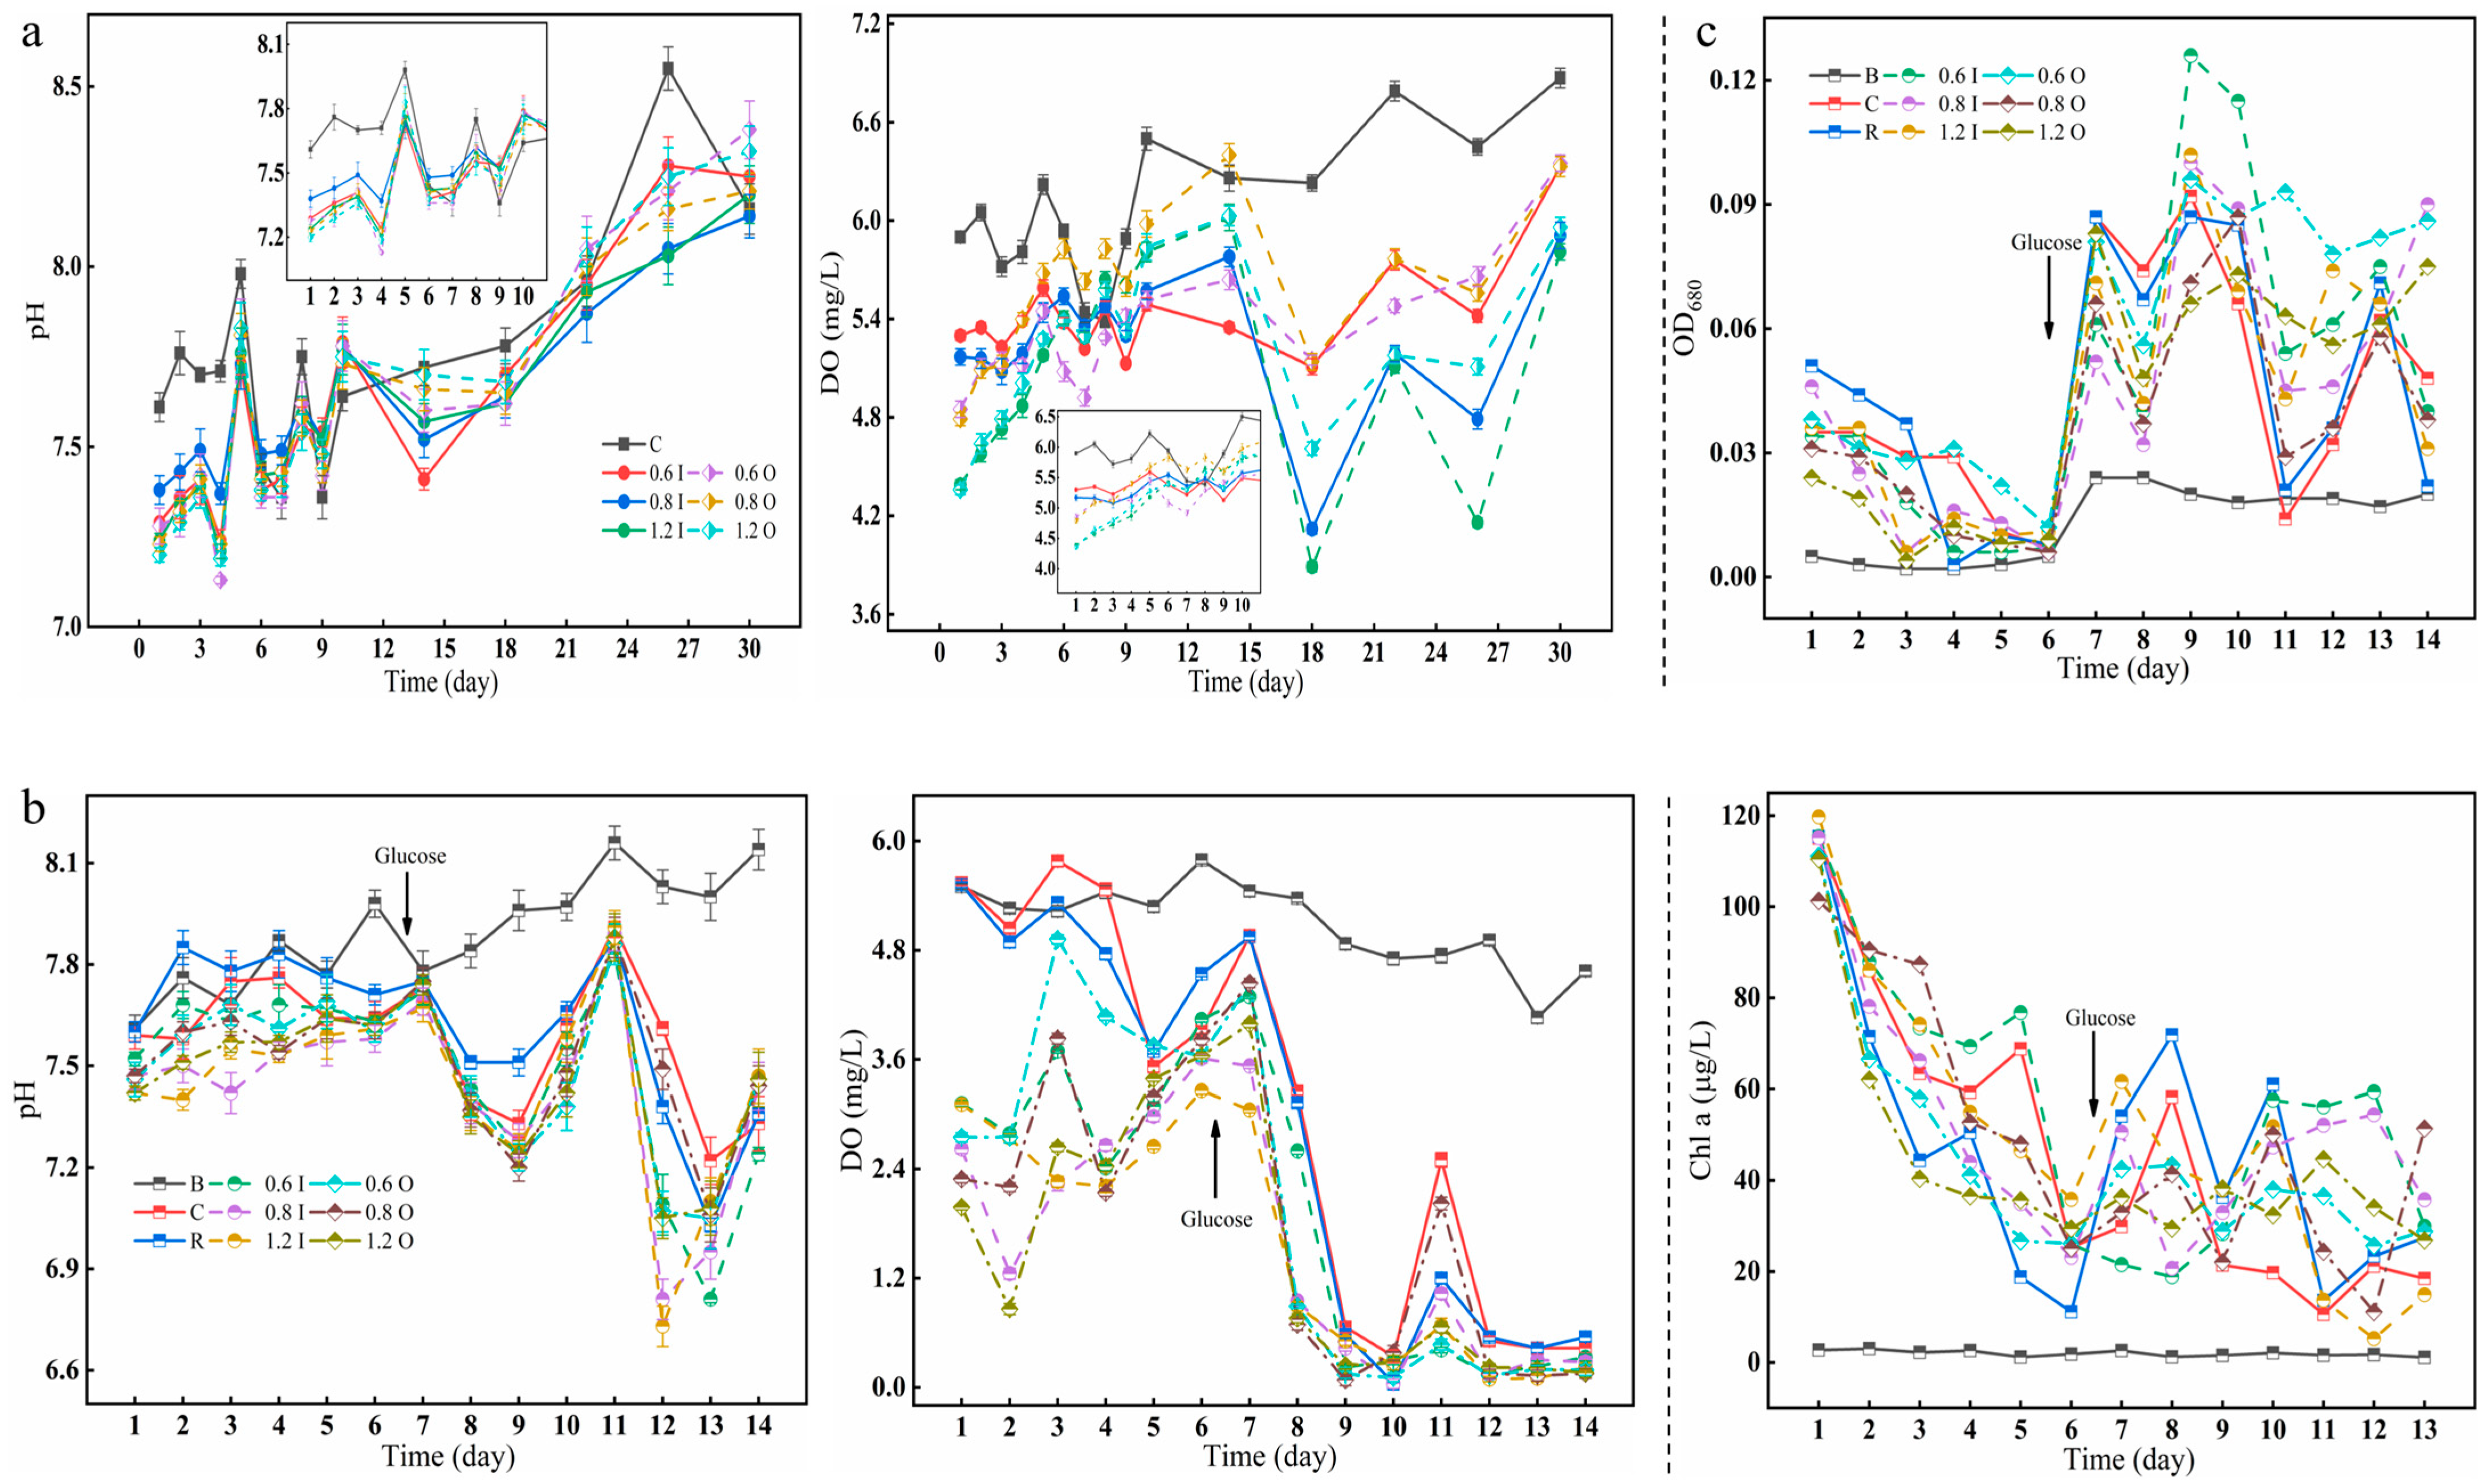
3.1. Changes in Overlying Water pH, DO, and Cyanobacterial Growth

The pH, DO and cyanobacterial growth (OD680 and Chl a) in the overlying water during the two phases are shown in Figure 2. The pH values ranged between 7.0 and 8.5 in the overlying water and was weakly alkaline (Figure 2a). However, in the second phase of the cyanobacterial experiment, the overlying water was weakly acidic after the addition of glucose. Paraburkholderia had the ability to dissolve both IP and OP in the sediments and produce organic acids, such as gluconic acid, succinic acid, citric acid, acetic acid, etc. [31,32]. The fluctuation in the DO of the overlying water showed a strong shift, especially in the later stages of cyanobacterial addition, where the lowest values reached 0.01 mg/L. The growth of cyanobacteria during the second period was estimated by OD680 and Chl a (Figure 2c). The Chl a of each experimental group decreased from about 120 μg/L to 20 μg/L over days 1–6, especially in the resuscitation group (from 115.4 μg/L to 11.14 μg/L), probably because no bacteria were added. The subsequent addition of glucose slightly promoted the growth of cyanobacteria, but this also created a favorable environment for microbial reproduction. The respiration of microbes and cyanobacterial decay and spoilage led to a decrease in DO [18,33].

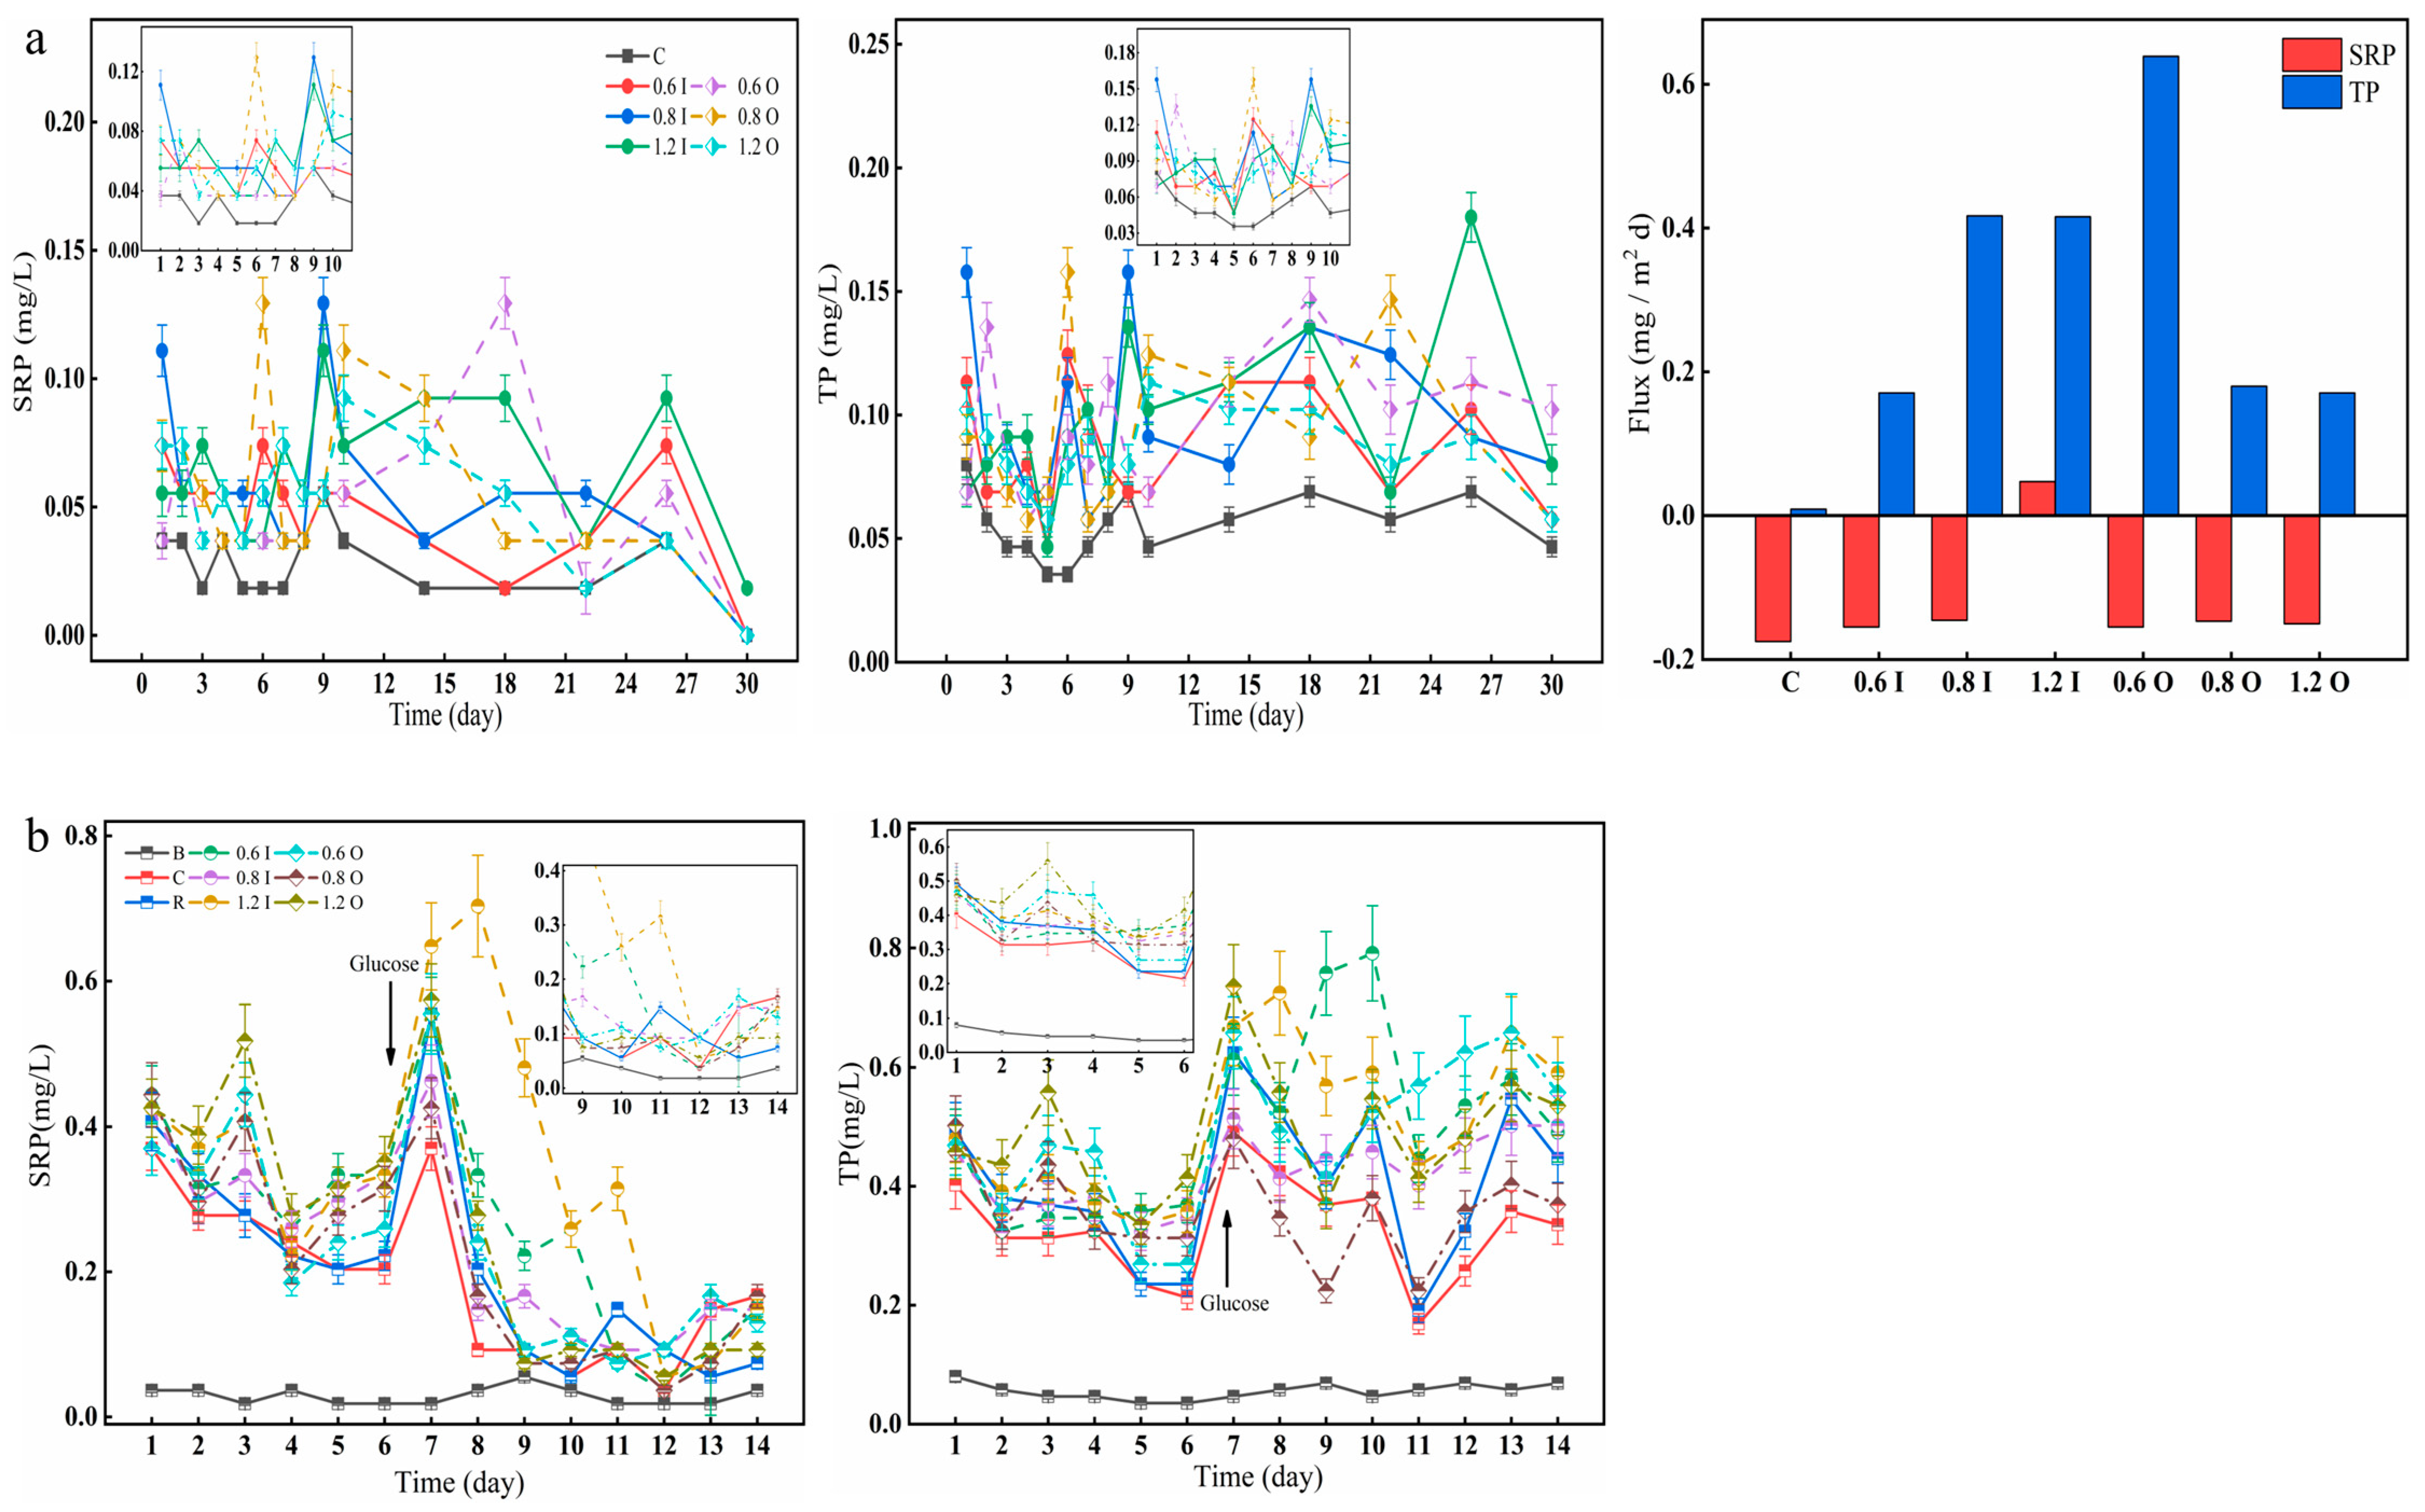
3.2. Phosphorus Performance in the Overlying Water

As shown in Figure 3, the SRP and TP in the overlying water varied significantly between the two stages. There was a slight increase in SRP, and the SRP concentration of the 0.8 I group reached 0.11 mg/L on day 1 (Figure 3a). On day 6, the SRP content of the overlying water in the 0.8 O group reached 0.13 mg/L. The amount of SRP accounted for more than half of the TP, and the trend of the TP was similar. The maximum TP values in the 0.8 I and 0.8 O groups reached 0.16 mg/L on day 9 and 6, respectively. During the second phase after algae addition, there was a significant increase in SRP concentration ranging from 0.05 to 0.80 mg/L (Figure 3b). As presented in Figure 3b, the SRP drastically decreased after glucose addition, while the P content in the overlying water showed a sharp increase. The experimental groups with the addition of Paraburkholderia reached a maximum phosphorus-solubilizing capacity within one week, after which the capacity increased and then decreased with each addition of bacteria. The diffusion flux of TP across the SWI was positive (from the sediment to the overlying water) and had a maximum value of 0.64 mg/(m2d), but the diffusive flux of the SRP was negative for most of the groups. The effect of Paraburkholderia on the SRP diffusion flux was more pronounced in the short term, such that its diffusive flux was negative throughout the period, representing the average value over time. Here, Paraburkholderia had a stronger influence on the TP diffusion fluxes, and the form of TP was inhomogeneous and may contain inorganic soluble phosphorus, inorganic particulate phosphorus, organic phosphorus, colloidal phosphorus, and so on [34]. Overall, the inorganic phosphorus-solubilizing capacity of Paraburkholderia enhanced phosphorus fluxes to the overlying water in the bacteria–algae experimental simulations. When glucose was added, the small amount of bacteria was more favorable for the growth of cyanobacteria, and it was hypothesized that the carbon source altered the relationship between the bacteria and algae, putting them in a competitive relationship [35,36].

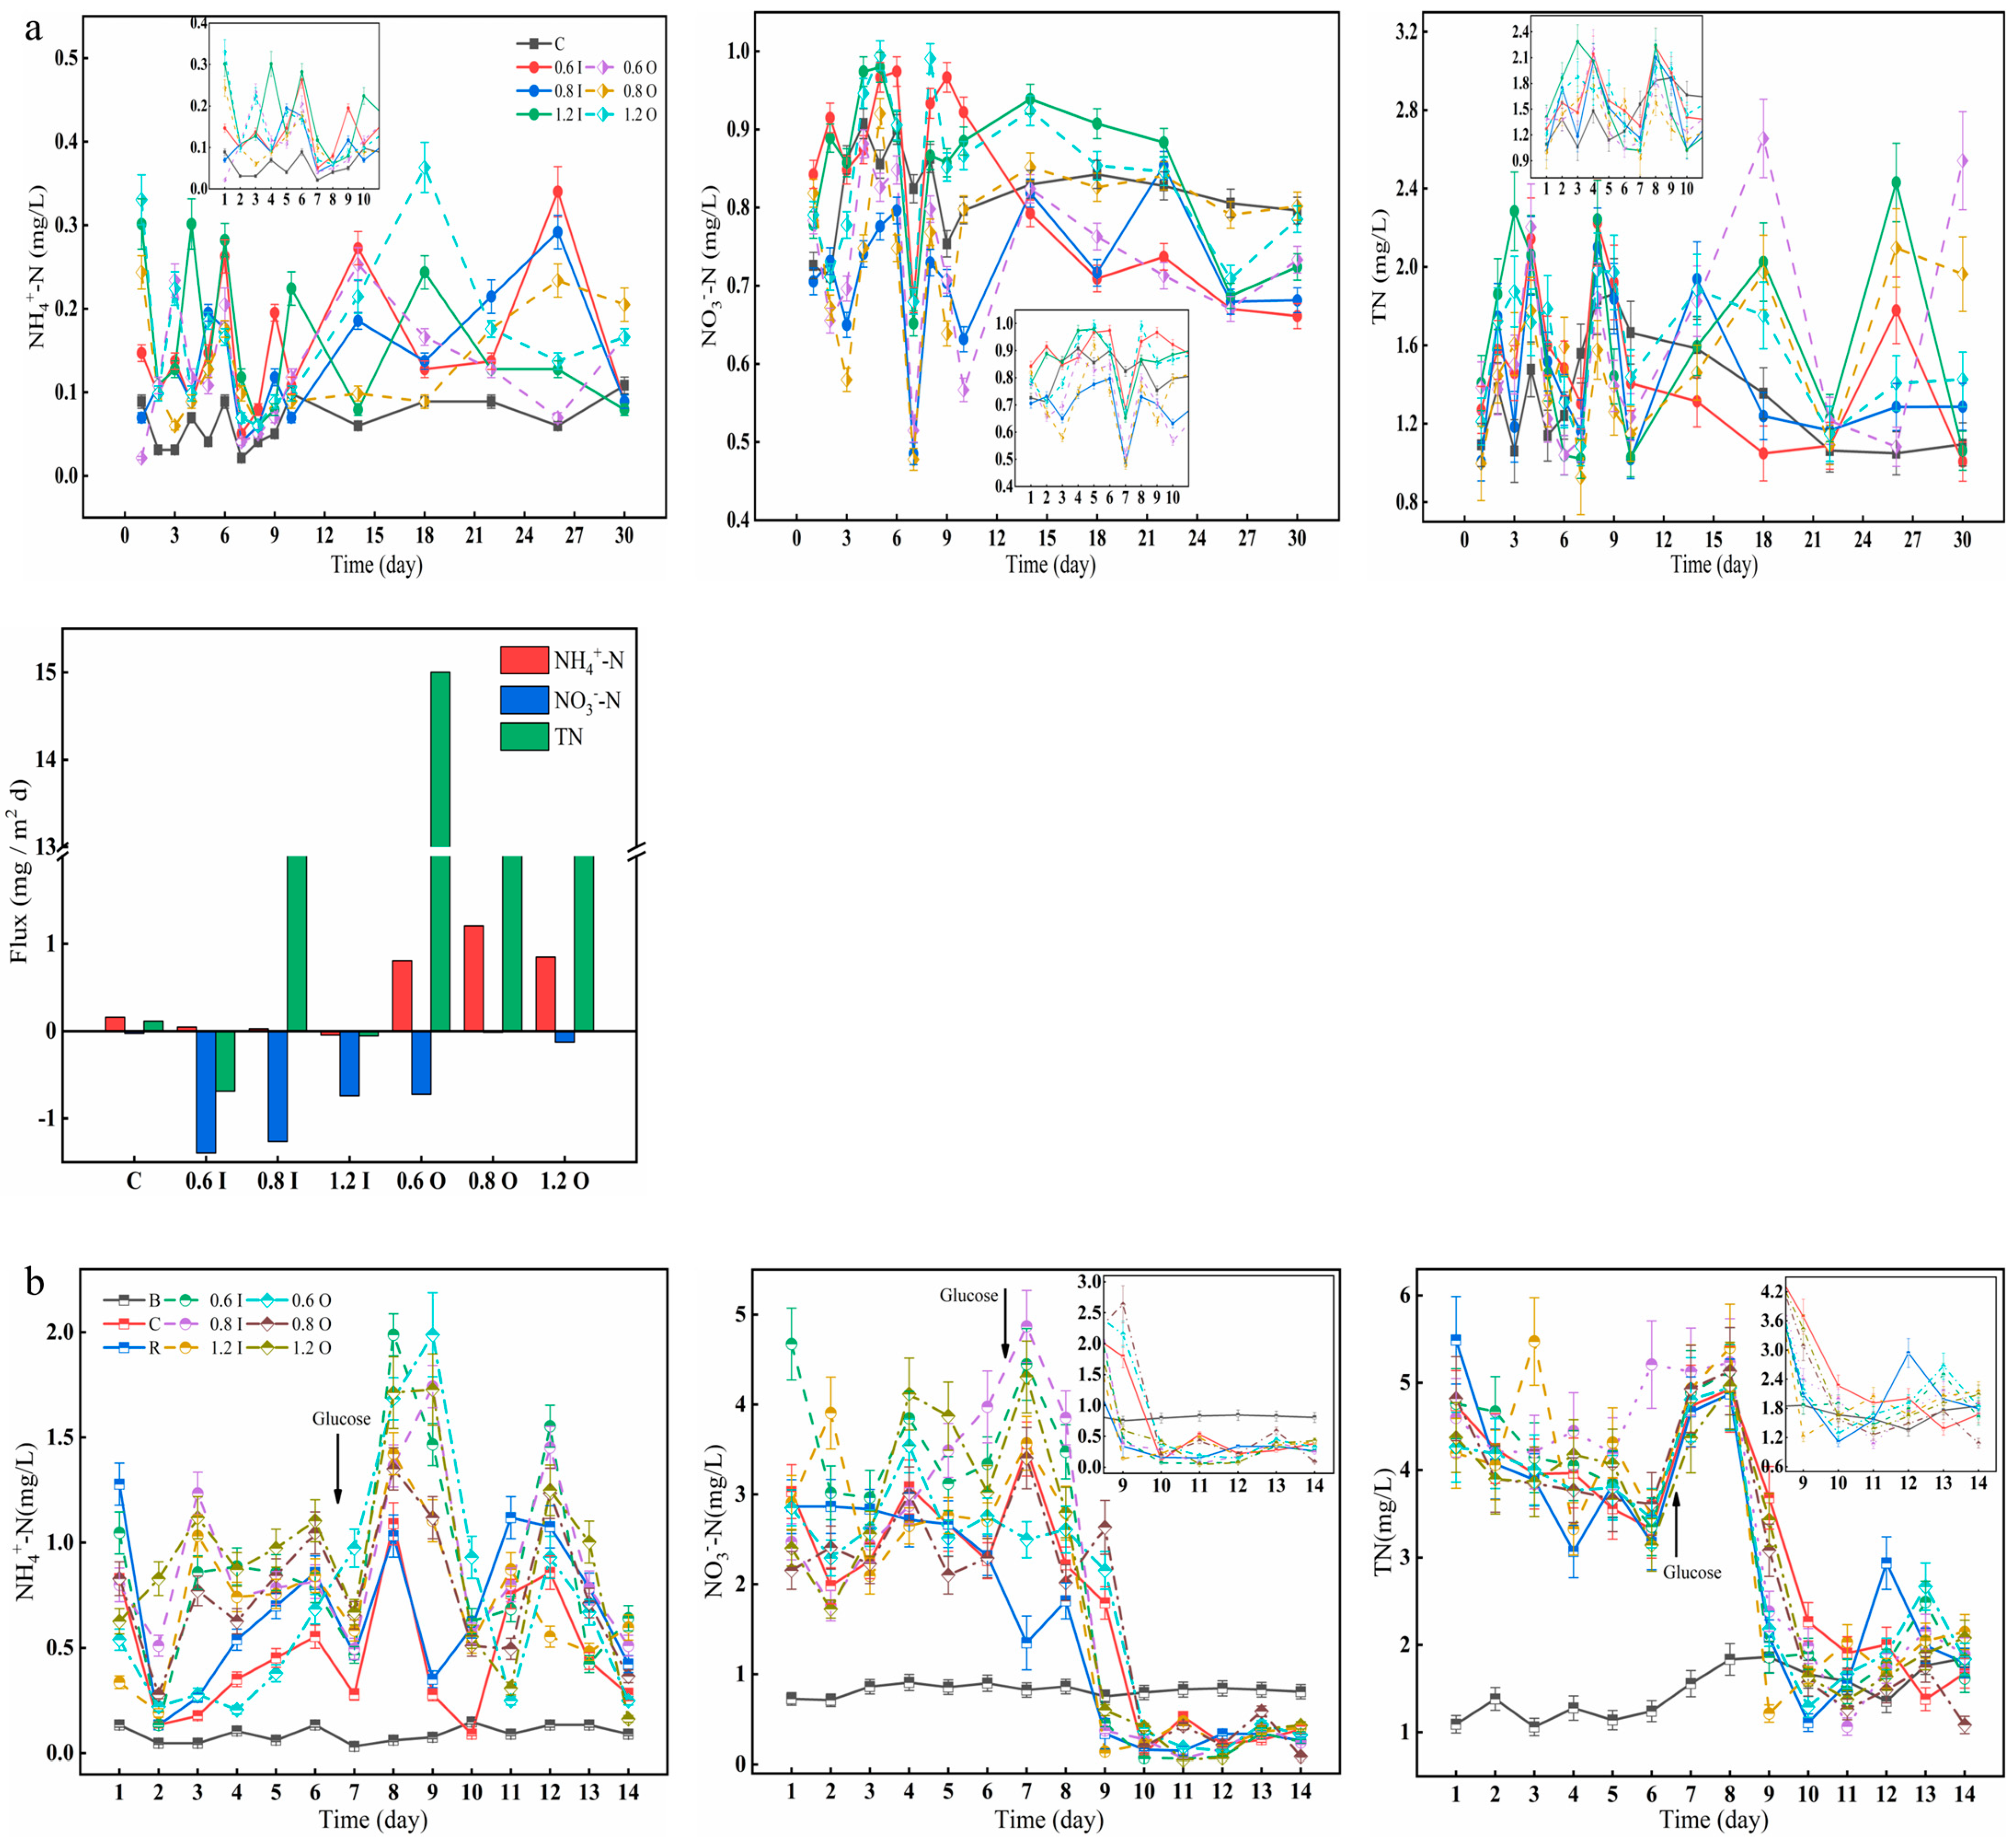
3.3. Nitrogen Concentration in the Overlying Water

Paraburkholderia also have an important role in nitrogen fixation, so changes in nitrogen in the overlying water were observed here over a 30-day incubation period (Figure 4). The concentrations of NH4+-N (range: 0.02–0.40 mg/L) were low, while the concentrations of NO3-N (range: 0.58–0.98 mg/L) were high in the overlying water (Figure 4a). The maximum NH4+-N values in the 1.2 O group reached 0.37 mg/L on day 18. On day 26, the NH4+-N content of the overlying water in the 0.6 I and 0.8 I groups reached the highest values of 0.34 mg/L and 0.29 mg/L, respectively. On day 7, the NO3-N concentration reached its lowest value in most of the experimental groups, which was analyzed here because the addition of bacteria on day 5 caused an increase in oxygen consumption and a low NH4+-N concentration, resulting in a blockade of the nitrification process [37]. Overall, the NO3-N concentrations were relatively high throughout the experimental cycle, but the NO3-N release fluxes were negative. The NH4+-N and TN release fluxes were increased in the overlying water with added Paraburkholderia due to the nitrogen-fixing effect of the bacteria, which can convert atmospheric nitrogen into ammonia [23,24].
The release or uptake of nitrogen from the overlying water by cyanobacteria affects the transformation and transport of various nitrogen forms at the SWI, which in turn influences the concentration gradient [38,39]. The NH4+-N and NO3-N concentrations fluctuated in the range of 0.13–1.11 mg/L and 1.72–4.68 mg/L, respectively; then they increased rapidly after the addition of glucose (Figure 4b). For the 0.6 I group, the overlying water NH4+-N concentration reached a maximum of 1.99 mg/L on day 8. The different characteristics and concentrations of Paraburkholderia can accelerate cyanobacterial cell decay, which in turn can lead to changes in NH4+-N concentrations, and it has been found that the degradation of decaying cyanobacterial cells can produce a sharp increase in NH4+-N concentrations [40,41]. The trend of TN concentrations in the overlying water were similar to that of NO3-N, showing a dramatic decrease from the 8th day and finally fluctuating within a range. For the glucose treatment, higher NH4+-N and lower NO3-N were found over the experiment owing to the intensification of anaerobic denitrification [42].

3.4. Iron Content of the Overlying Water

The Fe2+ and Fe concentrations displayed significantly different temporal distributions among the different treatments (Figure 5). For the bacteria treatment, Fe2+ and Fe first fluctuated and then increased rapidly with the addition of glucose. On day 26, the 0.6 I group reached 0.46 mg/L and 0.83 mg/L, respectively (Figure 5a). Here, the analysis found that the respiration of microorganisms consumes oxygen, resulting in a decreased DO concentration, which further leads to a rise in Fe2+. With strong bacterial action, both Fe2+ and Fe diffusion fluxes were positive, up to 4.01 mg/(m2d) and 5.02 mg/(m2d), respectively. As the experiment progressed, the percentage of Fe2+/Fe became larger and larger. The Fe2+ diffusion flux was larger due to the smaller initial Fe2+ concentration and larger Fe2+ value at later stages of the experiment. Here, it appeared that the Fe2+ diffusive flux was greater than the Fe diffusive flux (for the 0.8 O and 1.2 O groups). The concentration of Fe2+ and Fe ranged from 0.11 to 0.39 mg/L and from 0.16 to 0.52 mg/L during the first six days (Figure 5b), respectively, which continued to increase during the latter period and confirmed that cyanobacterial decay and anaerobic waters can promote the reduction of Fe3+ and facilitate the rapid increase in Fe2+ [43].

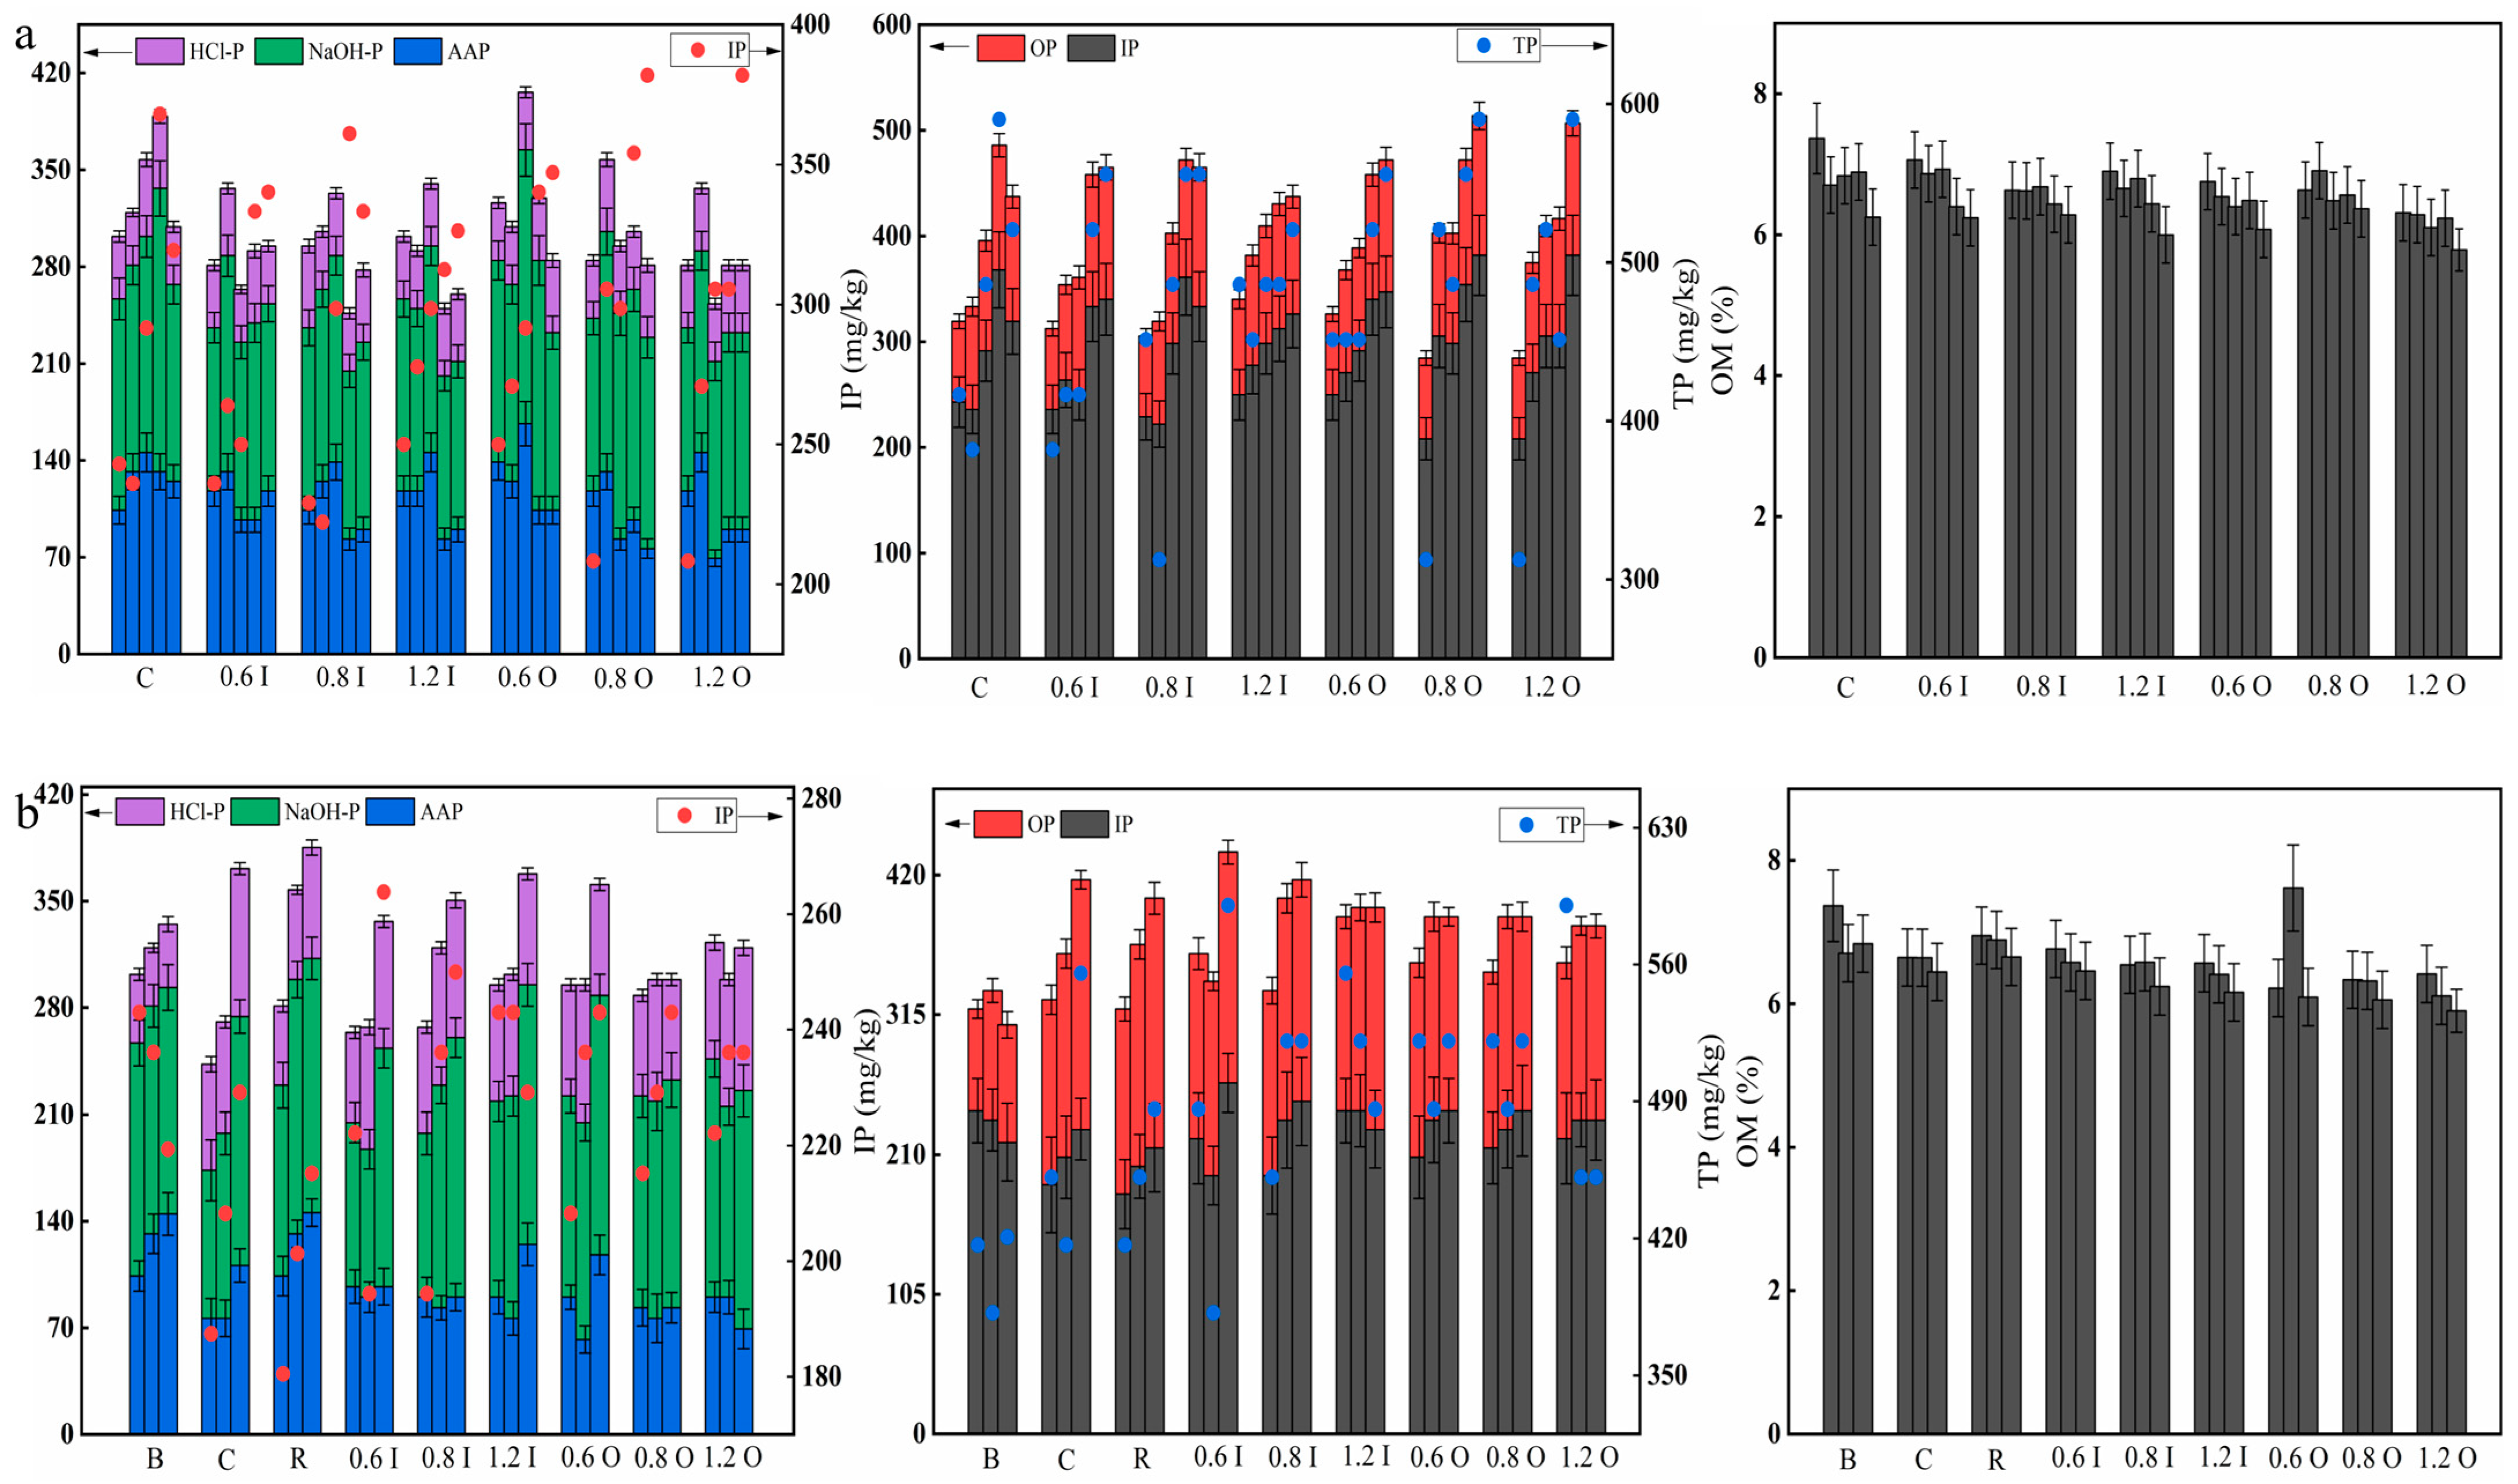
3.5. Variations in the Phosphorus Fractions and OM in the Sediments

Figure 6 shows the changes in the phosphorus fractions and OM in the sediments during the two phases. In general, the amount of IP was much larger than OP, and NaOH-P was its predominant form, suggesting that Paraburkholderia solubilized HCl-P. It was observed that as the added Paraburkholderia increased, there was a decrease in each form of phosphorus. On day 5, the IP and OP levels in the sediments of the 1.2 I and 1.2 O groups were 249.93 mg/kg and 76.32 mg/kg, respectively. Additionally, all of them showed an upward trend, indicating that the ability of the bacteria decreased with the increase in reaction time. Figure 6a shows that the OM values were all reduced in the sediments, especially in the 1.2 I group (range: 6.90% to 6.00%), implying that the bacteria consumed OM.
Higher sediment TP (from 381.9 to 590.3 mg/kg) concentrations were observed in the experimental groups, and significant differences were found after the second phase of cyanobacterial addition (Figure 6b). The increase in sediment TP was mainly due to phosphorus release from cyanobacterial decline [44]. The AAP/NaOH-P values in the blank group were larger than those in the experimental groups, which was analyzed because AAP was algal-available phosphorus in the sediment and “pumped” out during cyanobacterial growth [44]. For the 0.8 I and 0.6 O groups, the OM content of the sediments showed an increasing and then decreasing trend, indicating that OM was consumed by the bacteria and produced by the decomposition of cyanobacterial decay [45].

3.6. Analysis of the Linkage between the Relevant Parameters of the Overlying Water and Phosphorus in the Sediment

Table 1 shows the correlation between the relevant parameters of the overlying water and the P concentrations in the sediment for the two phases. The TP content in the overlying water was significantly and positively correlated with the NaOH-P in the sediments (p < 0.05). The SRP content in the overlying water showed a significant positive correlation with the AAP concentration (p < 0.05) in the sediments. The SRP content was positively correlated with TP concentration in the overlying water (p < 0.01). In the second phase (bacteria–algae system), the TP content was positively correlated with the NaOH-P concentration in the sediments (p < 0.05). The SRP content in the overlying water was significantly and negatively correlated with the HCl-P (p < 0.01) and NaOH-P (p < 0.05) values in the sediments. The NaOH-P content in the sediments was also related to the Chl a concentration. Therefore, Paraburkholderia can increase the solubilization of HCl-P and NaOH-P, especially HCl-P. There was a short-term increase in SRP in the overlying water, causing an increase in cyanobacterial biomass. In addition, cyanobacterial blooms consume phosphorus from the overlying water, and cyanobacterial decay can also carry phosphorus back into the sediments [46].

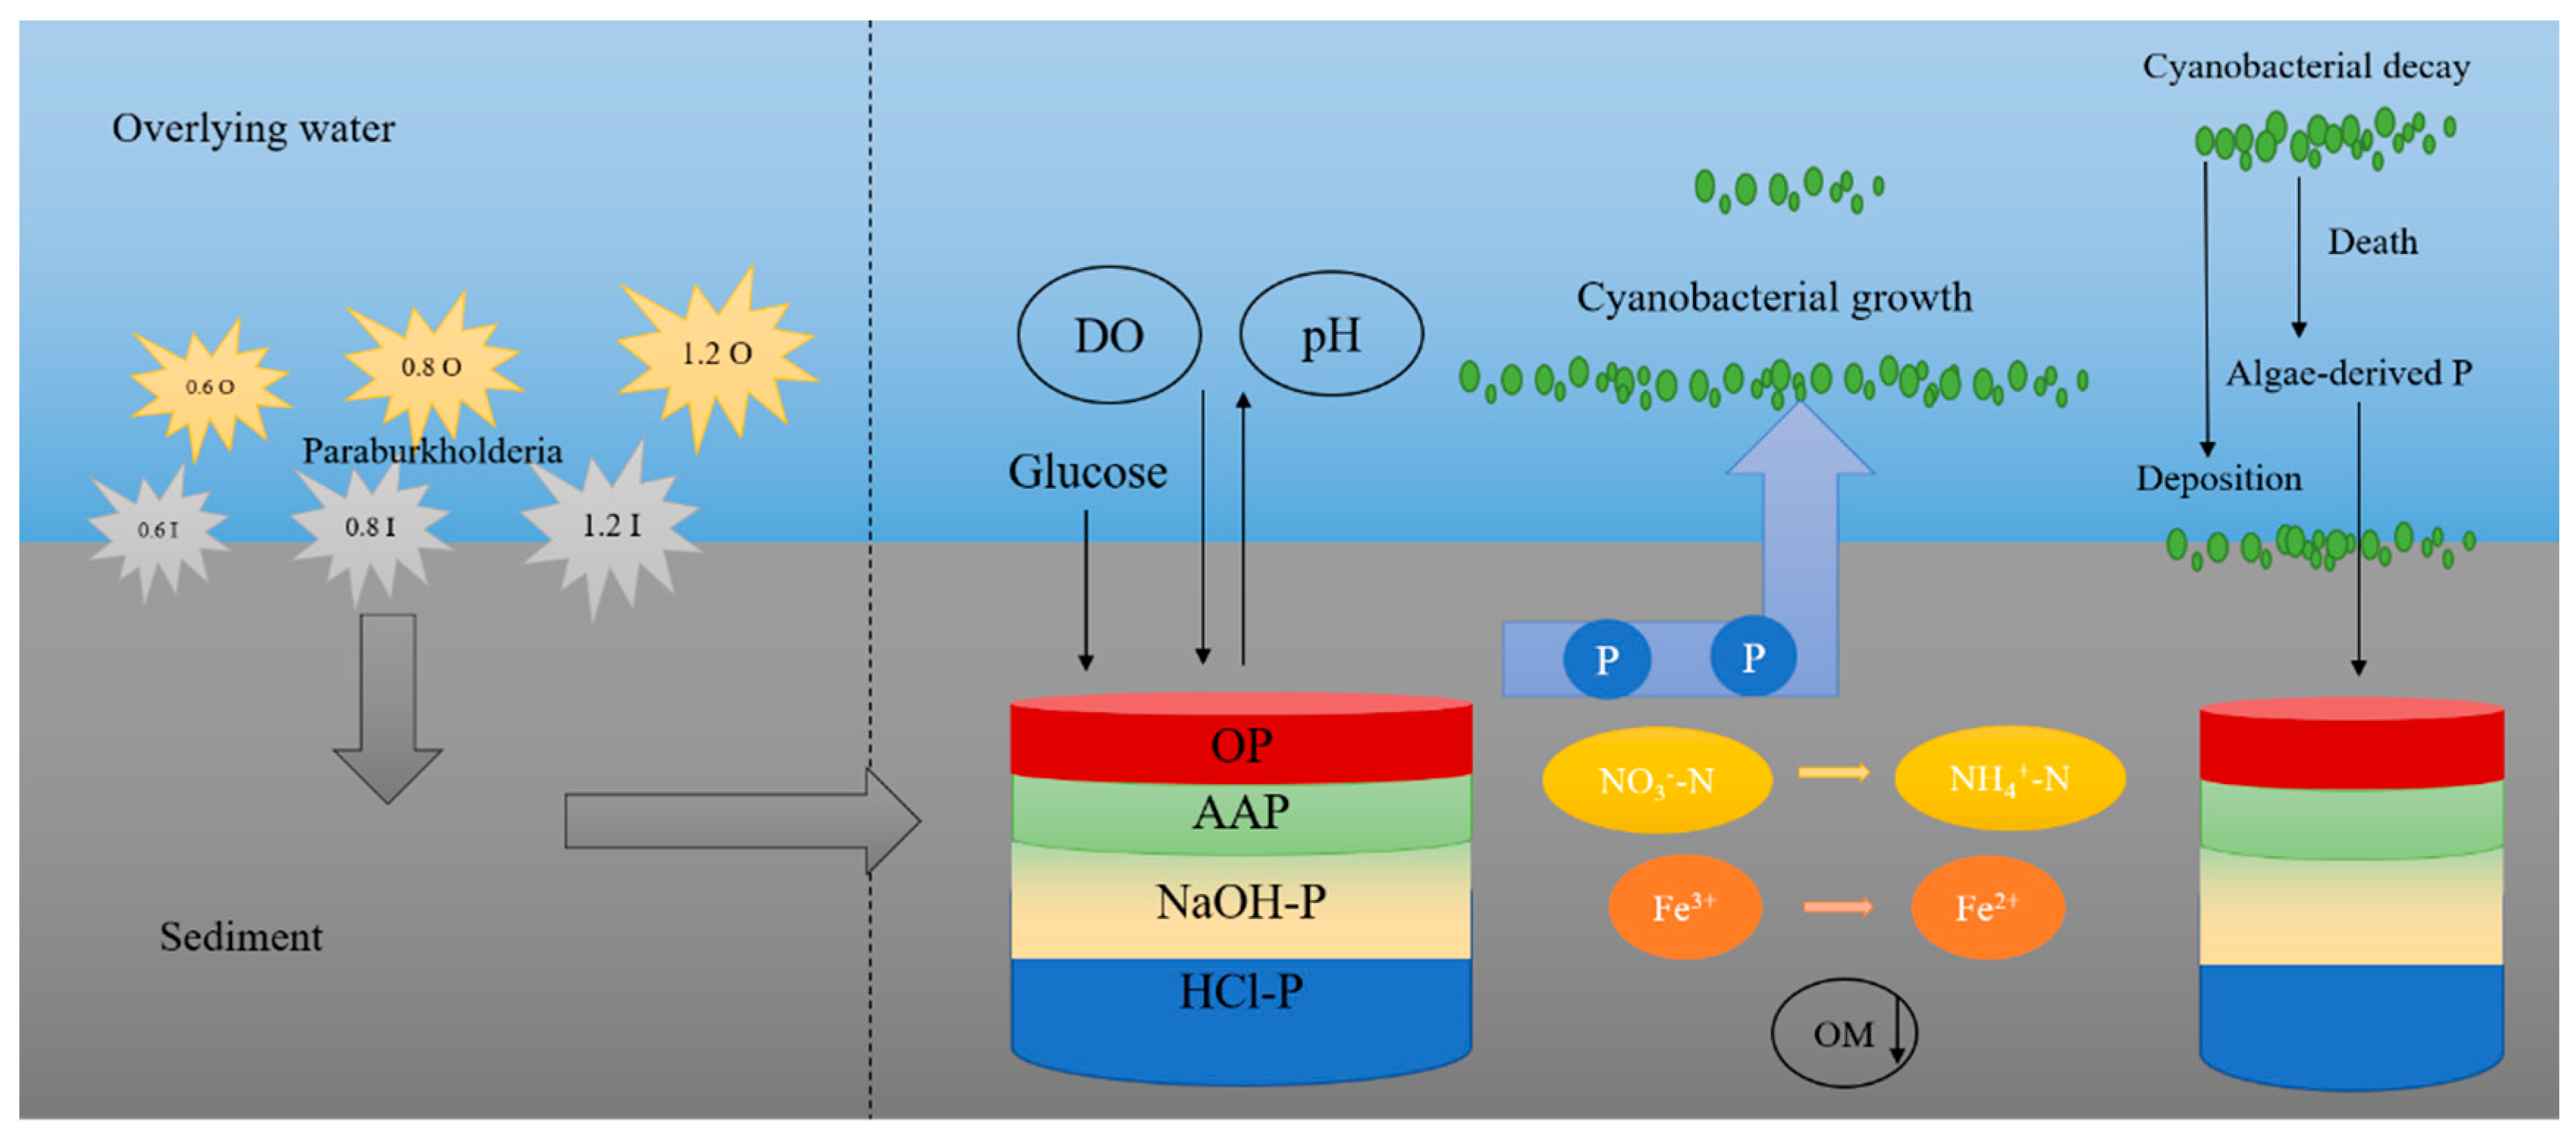
3.7. Analyzing the Potential Function of Paraburkholderia

Paraburkholderia has been shown to be important for nitrogen and phosphorus in the sediments (Figure 7). The VTr53 strain belonging to Paraburkholderia exhibit strong a nitrogen-fixing capacity [47]. The sediment is a major pool of nutrients in lake systems, which can significantly impact water quality through releasing nutrients [48,49]. The phosphorus fractions in the sediments can be in different forms, but not all forms of phosphorus can be released from the sediments. The forms of phosphorus in sediments are mainly IP and OP. IP is usually adsorbed onto metal compounds in the sediments [50]. NaOH-P (iron/aluminum-bound inorganic phosphorus) is highly active and readily bioavailable, and HCl-P (calcium-bound inorganic phosphorus) has low activity and impact [51]. OP is mostly found in microbial debris and humus, and contains a variety of different compounds, including nucleotides, phospholipids, phosphates, phosphoprotein, inositol phosphate, etc. [52,53]. The interaction between Fe and P cycles contribute to the retention and mobilization of P in the sediments [54]. Fe oxides can adsorb and sequester P by electrostatic adsorption and complexation of functional groups, and these Fe oxides are reduced to Fe2+ under anaerobic conditions to exacerbate the release of P into the overlying water [55,56]. The sediments were rich in phosphorus, and the contained phosphate-solubilizing bacteria were able to convert insoluble phosphorus into soluble phosphorus by secreting organic acids or acid phosphatases [57]. Gluconic acid secretion through direct oxidation of glucose was the main mechanism of P solubilization by Paraburkholderia [58]. Gluconic acid has chelating properties and can form insoluble complexes with Ca2+, which in turn released phosphate from tricalcium phosphate [59]. Additionally, the solubilization of phosphate was associated with the pH reduction caused by the bacteria [60]. The effects of different concentrations and characteristics of Paraburkholderia on eutrophic lakes were investigated here (Figure 7). The ability of Paraburkholderia to release endogenous phosphorus was not necessarily associated with higher concentrations of bacteria, which may be related to its characteristics. The process of nutrient release from sediments was influenced by various physicochemical factors (i.e., pH and DO) [16]. Hypoxia and algal toxin production caused by cyanobacterial blooms can disrupt the water environment and lead to the death of microorganisms [17,61]. Similarly, the survival to death of cyanobacteria exacerbated the anaerobic environment and could induce the release of nutrients from the sediments [62]. The survival of microbes altered the redox conditions at the SWI; increased DO depletion; and affected phosphorus, iron, and nitrogen cycling [3,33,63,64].

4. Conclusions

In this study, the disturbance of Paraburkholderia played an important role in driving sediment nutrient changes and cyanobacterial growth in the overlying water. Paraburkholderia can increase the solubilization of HCl-P and NaOH-P, especially HCl-P. There was a short-term increase in SRP and Chl a in the overlying water, causing an increase in the cyanobacterial biomass. The diffusion fluxes of most nutrients at the SWI were positive, while some were negative in the bacteria only experiment. For the bacteria–algae system, the concentration of each nutrient salt was much higher than in the bacteria only experiment. The volume ratio of the sediment to overlying water and the glucose content drastically affected water quality and cyanobacterial growth. The study of Paraburkholderia as a microbial ecological factor is expected to provide new perspectives for the study of nutrient conditions in eutrophic lakes.

Author Contributions

C.T.: investigation, data curation, formal analysis, and writing—original draft. Y.C.: investigation, and data curation. X.D.: investigation, and data curation. W.H.: conceptualization, methodology, and funding acquisition. All authors have read and agreed to the published version of the manuscript.

Funding

This study was supported by the Natural Science Foundation of Shanghai (23ZR1400700) and the National Natural Science Foundation (52000024).

Data Availability Statement

The datasets used and/or analyzed in the study are available from the corresponding author upon reasonable request.

Conflicts of Interest

The authors declare no conflict of interest.

References

  1. Tanvir, R.U.; Hu, Z.; Zhang, Y.; Lu, J. Cyanobacterial community succession and associated cyanotoxin production in hypereutrophic and eutrophic freshwaters. Environ. Pollut. 2021, 290, 118056. [Google Scholar] [CrossRef]
  2. Berry, M.A.; Davis, T.W.; Cory, R.M.; Duhaime, M.B.; Johengen, T.H.; Kling, G.W.; Marino, J.A.; Den Uyl, P.A.; Gossiaux, D.; Dick, G.J.; et al. Cyanobacterial harmful algal blooms are a biological disturbance to Western Lake Erie bacterial communities. Environ. Microbiol. 2017, 19, 1149–1162. [Google Scholar] [CrossRef]
  3. Gao, L.; Zhang, L.; Hou, J.; Wei, Q.; Fu, F.; Shao, H. Decomposition of macroalgal blooms influences phosphorus release from the sediments and implications for coastal restoration in Swan Lake, Shandong, China. Ecol. Eng. 2013, 60, 19–28. [Google Scholar] [CrossRef]
  4. Dai, J.; Chen, D.; Wu, S.; Wu, X.; Gao, G.; Tang, X.; Shao, K.; Lv, X.; Xue, W.; Yang, Q. Dynamics of phosphorus and bacterial phoX genes during the decomposition of Microcystis blooms in a mesocosm. PLoS ONE 2018, 13, e0195205. [Google Scholar] [CrossRef] [PubMed]
  5. Yang, Y.; Chen, J.; Chen, X.; Jiang, Q.; Liu, Y.; Xie, S. Cyanobacterial bloom induces structural and functional succession of microbial communities in eutrophic lake sediments. Environ. Pollut. 2021, 284, 117157. [Google Scholar] [CrossRef] [PubMed]
  6. Tu, C.Q.; Jin, Z.H.; Che, F.F.; Cao, X.; Song, X.S.; Lu, C.Y.; Huang, W. Characterization of phosphorus sorption and microbial community in lake sediments during overwinter and recruitment periods of cyanobacteria. Chemosphere 2022, 307, 135777. [Google Scholar] [CrossRef]
  7. Schindler, D.W.; Hecky, R.; Findlay, D.; Stainton, M.; Parker, B.; Paterson, M.; Beaty, K.; Lyng, M.; Kasian, S. Eutrophication of lakes cannot be controlled by reducing nitrogen input: Results of a 37-year whole-ecosystem experiment. Proc. Natl. Acad. Sci. USA 2008, 105, 11254–11258. [Google Scholar] [CrossRef] [PubMed]
  8. Xie, E.; Su, Y.; Deng, S.; Kontopyrgou, M.; Zhang, D. Significant influence of phosphorus resources on the growth and alkaline phosphatase activities of Microcystis aeruginosa. Environ. Pollut. 2021, 268, 115807. [Google Scholar] [CrossRef] [PubMed]
  9. Hu, J.; Shen, Q.; Liu, Y.; Liu, J. Mobility of different phosphorus pools in the sediment of Lake Dianchi during cyanobacterial blooms. Environ. Monit. Assess. 2007, 132, 141–153. [Google Scholar] [CrossRef]
  10. Yao, L.; Zhao, X.; Zhou, G.-J.; Liang, R.; Gou, T.; Xia, B.; Li, S.; Liu, C. Seasonal succession of phytoplankton functional groups and driving factors of cyanobacterial blooms in a subtropical reservoir in South China. Water 2020, 12, 1167. [Google Scholar] [CrossRef]
  11. Zhu, M.; Zhu, G.; Li, W.; Zhang, Y.; Zhao, L.; Gu, Z. Estimation of the algal-available phosphorus pool in sediments of a large, shallow eutrophic lake (Taihu, China) using profiled SMT fractional analysis. Environ. Pollut. 2013, 173, 216–223. [Google Scholar] [CrossRef] [PubMed]
  12. Dolman, A.M.; Rücker, J.; Pick, F.R.; Fastner, J.; Rohrlack, T.; Mischke, U.; Wiedner, C. Cyanobacteria and cyanotoxins: The influence of nitrogen versus phosphorus. PLoS ONE 2012, 7, e38757. [Google Scholar] [CrossRef] [PubMed]
  13. O’Neil, J.M.; Davis, T.W.; Burford, M.A.; Gobler, C.J. The rise of harmful cyanobacteria blooms: The potential roles of eutrophication and climate change. Harmful Algae 2012, 14, 313–334. [Google Scholar] [CrossRef]
  14. Gibson, G.; Carlson, R.; Simpson, J.; Smeltzer, E.; Gerritson, J.; Chapra, S.; Heiskary, S.; Jones, J.; Kennedy, R. Nutrient Criteria Technical Guidance Manual: Lakes and Reservoirs (EPA-822-B-00-001); United States Environment Protection Agency: Washington, DC, USA, 2000. [Google Scholar]
  15. Grant, W.D.; Long, P.E. Environmental Microbiology; Springer Science & Business Media: Berlin, Germany, 2013. [Google Scholar]
  16. Xie, L.; Xie, P.; Tang, H. Enhancement of dissolved phosphorus release from sediment to lake water by Microcystis blooms—An enclosure experiment in a hyper-eutrophic, subtropical Chinese lake. Environ. Pollut. 2003, 122, 391–399. [Google Scholar] [CrossRef] [PubMed]
  17. Tang, C.; Li, Y.; He, C.; Acharya, K. Dynamic behavior of sediment resuspension and nutrients release in the shallow and wind-exposed Meiliang Bay of Lake Taihu. Sci. Total Environ. 2020, 708, 135131. [Google Scholar] [CrossRef] [PubMed]
  18. Cao, X.; Wang, Y.Q.; He, J.; Luo, X.Z.; Zheng, Z. Phosphorus mobility among sediments, water and cyanobacteria enhanced by cyanobacteria blooms in eutrophic Lake Dianchi. Environ. Pollut. 2016, 219, 580–587. [Google Scholar] [CrossRef]
  19. Jalali, M.; Peikam, E.N. Phosphorus sorption-desorption behaviour of river bed sediments in the Abshineh river, Hamedan, Iran, related to their composition. Environ. Monit. Assess. 2013, 185, 537–552. [Google Scholar] [CrossRef]
  20. Burkholder, W.H. Three bacterial plant pathogens: Phytomonas earyophylli sp. n., Phytomonas alliicola sp. n., and Phytomonas manihotis (Arthaud-Berthet et Sondar) Viégas. Phytopathology 1942, 32, 141–149. [Google Scholar]
  21. Yabuuchi, E.; Kosako, Y.; Oyaizu, H.; Yano, I.; Hotta, H.; Hashimoto, Y.; Ezaki, T.; Arakawa, M. Proposal of Burkholderia gen. nov. and transfer of seven species of the genus Pseudomonas homology group II to the new genus, with the type species Burkholderia cepacia (Palleroni and Holmes 1981) comb. nov. Microbiol. Immunol. 1992, 36, 1251–1275. [Google Scholar] [CrossRef]
  22. Coenye, T.; Vandamme, P. Diversity and significance of Burkholderia species occupying diverse ecological niches. Environ. Microbiol. 2003, 5, 719–729. [Google Scholar] [CrossRef]
  23. Estrada-De Los Santos, P.; Bustillos-Cristales, R.O.; Caballero-Mellado, J. Burkholderia, a genus rich in plant-associated nitrogen fixers with wide environmental and geographic distribution. Appl. Environ. Microbiol. 2001, 67, 2790–2798. [Google Scholar] [CrossRef] [PubMed]
  24. Martínez-Aguilar, L.; Díaz, R.; Pena-Cabriales, J.J.; Estrada-de Los Santos, P.; Dunn, M.F.; Caballero-Mellado, J. Multichromosomal genome structure and confirmation of diazotrophy in novel plant-associated Burkholderia species. Appl. Environ. Microbiol. 2008, 74, 4574–4579. [Google Scholar] [CrossRef] [PubMed]
  25. Caballero-Mellado, J.; Onofre-Lemus, J.; Estrada-De Los Santos, P.; Martínez-Aguilar, L. The tomato rhizosphere, an environment rich in nitrogen-fixing Burkholderia species with capabilities of interest for agriculture and bioremediation. Appl. Environ. Microbiol. 2007, 73, 5308–5319. [Google Scholar] [CrossRef] [PubMed]
  26. Peix, A.; Mateos, P.; Rodriguez-Barrueco, C.; Martinez-Molina, E.; Velazquez, E. Growth promotion of common bean (Phaseolus vulgaris L.) by a strain of Burkholderia cepacia under growth chamber conditions. Soil Biol. Biochem. 2001, 33, 1927–1935. [Google Scholar] [CrossRef]
  27. Ruban, V.; López-Sánchez, J.; Pardo, P.; Rauret, G.; Muntau, H.; Quevauviller, P. Harmonized protocol and certified reference material for the determination of extractable contents of phosphorus in freshwater sediments—A synthesis of recent works. Fresenius’ J. Anal. Chem. 2001, 370, 224–228. [Google Scholar] [CrossRef]
  28. Younis, A.M.; Soliman, N.F.; Elkady, E.M.; Mohamedein, L.I. Distribution and ecological risk evaluation of bioavailable phosphorus in sediments of El Temsah Lake, Suez Canal. Oceanologia 2022, 64, 287–298. [Google Scholar] [CrossRef]
  29. Huang, W.; Lu, Y.; Li, J.H.; Zheng, Z.; Zhang, J.B.; Jiang, X. Effect of ionic strength on phosphorus sorption in different sediments from a eutrophic plateau lake. Rsc Adv. 2015, 5, 79607–79615. [Google Scholar] [CrossRef]
  30. Hu, M.; Sardans, J.; Le, Y.; Yan, R.; Zhong, Y.; Huang, J.; Peñuelas, J.; Tong, C. Biogeochemical behavior of P in the soil and porewater of a low-salinity estuarine wetland: Availability, diffusion kinetics, and mobilization mechanism. Water Res. 2022, 219, 118617. [Google Scholar] [CrossRef]
  31. Liu, Y.Q.; Cao, X.Y.; Li, H.; Zhou, Z.J.; Wang, S.Y.; Wang, Z.C.; Song, C.L.; Zhou, Y.Y. Distribution of phosphorus-solubilizing bacteria in relation to fractionation and sorption behaviors of phosphorus in sediment of the Three Gorges Reservoir. Environ. Sci. Pollut. Res. 2017, 24, 17679–17687. [Google Scholar] [CrossRef]
  32. Teng, Z.; Shao, W.; Zhang, K.; Huo, Y.; Li, M. Characterization of phosphate solubilizing bacteria isolated from heavy metal contaminated soils and their potential for lead immobilization. J. Environ. Manag. 2019, 231, 189–197. [Google Scholar] [CrossRef]
  33. Chelsky, A.; Pitt, K.A.; Ferguson, A.J.; Bennett, W.W.; Teasdale, P.R.; Welsh, D.T. Decomposition of jellyfish carrion in situ: Short-term impacts on infauna, benthic nutrient fluxes and sediment redox conditions. Sci. Total Environ. 2016, 566, 929–937. [Google Scholar] [CrossRef] [PubMed]
  34. Yang, B.; Lin, H.; Bartlett, S.L.; Houghton, E.M.; Robertson, D.M.; Guo, L. Partitioning and transformation of organic and inorganic phosphorus among dissolved, colloidal and particulate phases in a hypereutrophic freshwater estuary. Water Res. 2021, 196, 117025. [Google Scholar] [CrossRef]
  35. Olguin, E.; Hernández, B.; Araus, A.; Camacho, R.; González, R.; Ramírez, M.; Galicia, S.; Mercado, G. Simultaneous high-biomass protein production and nutrient removal using Spirulina maxima in sea water supplemented with anaerobic effluents. World J. Microbiol. Biotechnol. 1994, 10, 576–578. [Google Scholar] [CrossRef] [PubMed]
  36. Van Baalen, C.; Hoare, D.S.; Brandt, E. Heterotrophic growth of blue-green algae in dim light. J. Bacteriol. 1971, 105, 685–689. [Google Scholar] [CrossRef] [PubMed]
  37. Lewis Jr, W.M.; Wurtsbaugh, W.A.; Paerl, H.W. Rationale for control of anthropogenic nitrogen and phosphorus to reduce eutrophication of inland waters. Environ. Sci. Technol. 2011, 45, 10300–10305. [Google Scholar] [CrossRef] [PubMed]
  38. Sarneel, J.; Geurts, J.; Beltman, B.; Lamers, L.; Nijzink, M.; Soons, M.; Verhoeven, J. The effect of nutrient enrichment of either the bank or the surface water on shoreline vegetation and decomposition. Ecosystems 2010, 13, 1275–1286. [Google Scholar] [CrossRef]
  39. Zhu, M.; Zhu, G.; Zhao, L.; Yao, X.; Zhang, Y.; Gao, G.; Qin, B. Influence of algal bloom degradation on nutrient release at the sediment–water interface in Lake Taihu, China. Environ. Sci. Pollut. Res. 2013, 20, 1803–1811. [Google Scholar] [CrossRef]
  40. Capone, D.G.; Carpenter, E.J. Nitrogen fixation in the marine environment. Science 1982, 217, 1140–1142. [Google Scholar] [CrossRef]
  41. Gao, Y.; Cornwell, J.C.; Stoecker, D.K.; Owens, M.S. Influence of cyanobacteria blooms on sediment biogeochemistry and nutrient fluxes. Limnol. Oceanogr. 2014, 59, 959–971. [Google Scholar] [CrossRef]
  42. Brunberg, A.-K. Contribution of bacteria in the mucilage of Microcystis spp.(Cyanobacteria) to benthic and pelagic bacterial production in a hypereutrophic lake. FEMS Microbiol. Ecol. 1999, 29, 13–22. [Google Scholar] [CrossRef]
  43. Zhao, Y.; Wu, S.; Yu, M.; Zhang, Z.; Wang, X.; Zhang, S.; Wang, G. Seasonal iron-sulfur interactions and the stimulated phosphorus mobilization in freshwater lake sediments. Sci. Total Environ. 2021, 768, 144336. [Google Scholar] [CrossRef]
  44. Wang, J.; Zhou, Y.; Bai, X.; Li, W. Effect of algal blooms outbreak and decline on phosphorus migration in Lake Taihu, China. Environ. Pollut. 2022, 296, 118761. [Google Scholar] [CrossRef] [PubMed]
  45. Kalscheur, K.N.; Rojas, M.; Peterson, C.G.; Kelly, J.J.; Gray, K.A. Algal exudates and stream organic matter influence the structure and function of denitrifying bacterial communities. Microb. Ecol. 2012, 64, 881–892. [Google Scholar] [CrossRef]
  46. Han, C.; Ding, S.; Yao, L.; Shen, Q.; Zhu, C.; Wang, Y.; Xu, D. Dynamics of phosphorus–iron–sulfur at the sediment–water interface influenced by algae blooms decomposition. J. Hazard. Mater. 2015, 300, 329–337. [Google Scholar] [CrossRef] [PubMed]
  47. Ramírez, M.D.A.; España, M.; Aguirre, C.; Kojima, K.; Ohkama-Ohtsu, N.; Sekimoto, H.; Yokoyama, T. Burkholderia and Paraburkholderia are predominant soybean rhizobial genera in Venezuelan soils in different climatic and topographical regions. Microbes Environ. 2019, 34, 43–58. [Google Scholar] [CrossRef] [PubMed]
  48. Nürnberg, G.K.; Molot, L.A.; O’Connor, E.; Jarjanazi, H.; Winter, J.; Young, J. Evidence for internal phosphorus loading, hypoxia and effects on phytoplankton in partially polymictic Lake Simcoe, Ontario. J. Great Lakes Res. 2013, 39, 259–270. [Google Scholar] [CrossRef]
  49. Markovic, S.; Liang, A.; Watson, S.B.; Guo, J.; Mugalingam, S.; Arhonditsis, G.; Morley, A.; Dittrich, M. Biogeochemical mechanisms controlling phosphorus diagenesis and internal loading in a remediated hard water eutrophic embayment. Chem. Geol. 2019, 514, 122–137. [Google Scholar] [CrossRef]
  50. Norton, S.A.; Coolidge, K.; Amirbahman, A.; Bouchard, R.; Kopacek, J.; Reinhardt, R. Speciation of Al, Fe, and P in recent sediment from three lakes in Maine, USA. Sci. Total Environ. 2008, 404, 276–283. [Google Scholar] [CrossRef]
  51. Jan, J.; Borovec, J.; Kopacek, J.; Hejzlar, J. What do results of common sequential fractionation and single-step extractions tell us about P binding with Fe and Al compounds in non-calcareous sediments? Water Res. 2013, 47, 547–557. [Google Scholar] [CrossRef]
  52. Worsfold, P.J.; Monbet, P.; Tappin, A.D.; Fitzsimons, M.F.; Stiles, D.A.; McKelvie, I.D. Characterisation and quantification of organic phosphorus and organic nitrogen components in aquatic systems: A review. Anal Chim Acta 2008, 624, 37–58. [Google Scholar] [CrossRef]
  53. Venkatesan, A.K.; Gan, W.; Ashani, H.; Herckes, P.; Westerhoff, P. Size exclusion chromatography with online ICP-MS enables molecular weight fractionation of dissolved phosphorus species in water samples. Water Res. 2018, 133, 264–271. [Google Scholar] [CrossRef]
  54. Ding, S.; Sun, Q.; Xu, D.; Jia, F.; He, X.; Zhang, C. High-resolution simultaneous measurements of dissolved reactive phosphorus and dissolved sulfide: The first observation of their simultaneous release in sediments. Environ. Sci. Technol. 2012, 46, 8297–8304. [Google Scholar] [CrossRef] [PubMed]
  55. Queiroz, H.M.; Ferreira, T.O.; Barcellos, D.; Nóbrega, G.N.; Antelo, J.; Otero, X.L.; Bernardino, A.F. From sinks to sources: The role of Fe oxyhydroxide transformations on phosphorus dynamics in estuarine soils. J. Environ. Manage. 2021, 278, 111575. [Google Scholar] [CrossRef] [PubMed]
  56. Jordan, T.E.; Cornwell, J.C.; Boynton, W.R.; Anderson, J.T. Changes in phosphorus biogeochemistry along an estuarine salinity gradient: The iron conveyer belt. Limnol. Oceanogr. 2008, 53, 172–184. [Google Scholar] [CrossRef]
  57. Tripura, C.; Sashidhar, B.; Podile, A.R. Ethyl methanesulfonate mutagenesis–enhanced mineral phosphate solubilization by groundnut-associated Serratia marcescens GPS-5. Curr. Microbiol. 2007, 54, 79–84. [Google Scholar] [CrossRef] [PubMed]
  58. Stephen, J.; Jisha, M. Gluconic acid production as the principal mechanism of mineral phosphate solubilization by Burkholderia sp.(MTCC 8369). J. Trop. Agric. 2011, 49, 99–103. [Google Scholar]
  59. Lin, T.-F.; Huang, H.-I.; Shen, F.-T.; Young, C.-C. The protons of gluconic acid are the major factor responsible for the dissolution of tricalcium phosphate by Burkholderia cepacia CC-Al74. Bioresour. Technol. 2006, 97, 957–960. [Google Scholar] [CrossRef] [PubMed]
  60. Song, O.-R.; Lee, S.-J.; Lee, Y.-S.; Lee, S.-C.; Kim, K.-K.; Choi, Y.-L. Solubilization of insoluble inorganic phosphate by Burkholderia cepacia DA23 isolated from cultivated soil. Braz. J. Microbiol. 2008, 39, 151–156. [Google Scholar] [CrossRef] [PubMed]
  61. Maar, M.; Timmermann, K.; Petersen, J.K.; Gustafsson, K.E.; Storm, L.M. A model study of the regulation of blue mussels by nutrient loadings and water column stability in a shallow estuary, the Limfjorden. J. Sea Res. 2010, 64, 322–333. [Google Scholar] [CrossRef]
  62. Nędzarek, A.; Tórz, A.; Rakusa-Suszczewski, S.; Bonisławska, M. Nitrogen and phosphorus release during fish decomposition and implications for the ecosystem of maritime Antarctica. Polar Biol. 2015, 38, 733–740. [Google Scholar] [CrossRef]
  63. Li, X.; Song, J.; Ma, Q.; Li, N.; Yuan, H.; Duan, L.; Qu, B. Experiments and evidences: Jellyfish (Nemopilema nomurai) decomposing and nutrients (nitrogen and phosphorus) released. Acta Oceanol. Sin. 2015, 34, 1–12. [Google Scholar] [CrossRef]
  64. Yao, Y.; Wang, P.; Wang, C.; Hou, J.; Miao, L.; Yuan, Y.; Wang, T.; Liu, C. Assessment of mobilization of labile phosphorus and iron across sediment-water interface in a shallow lake (Hongze) based on in situ high-resolution measurement. Environ. Pollut. 2016, 219, 873–882. [Google Scholar] [CrossRef] [PubMed]
Figure 1. Experimental setup (bacteria only (a), bacteria–algae (b)).
Separations 10 00595 g001
Figure 2. Changes in pH and DO (a,b) as well as cyanobacterial biomass (c indicates OD680 and Chl a). The error bars represent the standard deviation of three replicates.
Separations 10 00595 g002
Figure 3. Variation in the concentrations of SRP and TP (a,b) in the overlying water and diffusion fluxes (a). The error bars represent the standard deviation of three replicates.
Separations 10 00595 g003
Figure 4. Changes in the concentrations of NH4+-N, NO3-N and TN (a,b) in the overlying water and diffusion fluxes (a). The error bars represent the standard deviation of three replicates.
Separations 10 00595 g004
Figure 5. Variation in the concentrations of Fe2+ and Fe (a,b) in the overlying water and diffusion fluxes (a). The error bars represent the standard deviation of three replicates.
Separations 10 00595 g005
Figure 6. Distribution of the phosphorus fractions and OM in the sediments at days 5, 10, 15, 20, 30 (a) and days 5, 10, 14 (b) during the two phases. The error bars represent the standard deviation of three replicates.
Separations 10 00595 g006
Figure 7. The mechanism of nutrient induction by Paraburkholderia in eutrophic lakes.
Separations 10 00595 g007
Table 1. Correlation analysis of the relevant parameters in the overlying water and P concentrations in the sediment.
Phase I (bacteria only)
TPsNaOH-PHCl-PAAPSRPTPwTNFe
TPs1 0.24 0.32 −0.40 *−0.30 0.21 0.08 0.41 *
NaOH-P0.24 1 −0.01 0.36 0.32 0.45 *0.04 0.17
HCl-P0.32 −0.01 1 −0.27 −0.17 −0.24 0.22 0.04
AAP−0.40 *0.36 −0.27 1 0.42 *0.05 0.06 −0.35
SRP−0.30 0.32 −0.17 0.42 *1 0.52 **−0.11 −0.39 *
TPw0.21 0.45 *−0.24 0.05 0.52 **1 −0.06 0.31
TN0.08 0.04 0.22 0.06 −0.11 −0.06 1 −0.20
Fe0.41 *0.17 0.04 −0.35 −0.39 *0.31 −0.20 1
Phase II (bacteria–algae)
TPsNaOH-PHCl-PAAPChl aSRPTPwTNFe
TPs1 0.55 *−0.07 0.12 −0.15 0.15 −0.51 *0.20 0.02
NaOH-P0.55 *1 0.34 0.21 −0.58 *−0.51 *0.06 −0.39 0.58 *
HCl-P−0.07 0.34 1−0.43 −0.36 −0.63 **0.45 −0.50 *0.34
AAP0.12 0.21 −0.43 1−0.31 0.12 0.13 0.15 0.16
Chl a−0.15 −0.58 *−0.36 −0.31 1 0.43 −0.09 0.11 −0.33
SRP0.15 −0.51 *−0.63 **0.12 0.43 1 −0.36 0.80 **−0.60 **
TPw−0.51 *0.06 0.45 0.13 −0.09 −0.36 1 −0.64 **0.46
TN0.20 −0.39 −0.50 *0.15 0.11 0.80 **−0.64 **1 −0.73 **
Fe0.02 0.58 *0.34 0.16 −0.33 −0.60 **0.46 −0.73 **1
Note: TPs and TPw represent the TP in the sediment and overlying water, respectively. * correlation is significant at the 0.05 level; ** correlation is significant at the 0.01 level. n1 = 30 and n2 = 18.
Disclaimer/Publisher’s Note: The statements, opinions and data contained in all publications are solely those of the individual author(s) and contributor(s) and not of MDPI and/or the editor(s). MDPI and/or the editor(s) disclaim responsibility for any injury to people or property resulting from any ideas, methods, instructions or products referred to in the content.

