Article

Hazard-Free Treatment of Electrolytic Manganese Residue and Recovery of High-Concentration SO2 Using High-Temperature Reduction Roasting Process

1
Faculty of Environmental Science and Engineering, Kunming University of Science and Technology, Kunming 650500, China
2
Faculty of Chemical Engineering, Kunming University of Science and Technology, Kunming 650500, China
*
Authors to whom correspondence should be addressed.
These authors contributed equally to this work.
Separations 2023, 10(5), 288; https://doi.org/10.3390/separations10050288
Submission received: 4 April 2023 / Revised: 24 April 2023 / Accepted: 25 April 2023 / Published: 4 May 2023
(This article belongs to the Section Environmental Separations)

Abstract

:
A combined preparation of SO2 and recovery of solid products was investigated as a hazard-free method to use coke as a reducer to treat electrolytic manganese residue (EMR) at high temperature. In this study, the response surface prediction and thermodynamic analysis of the high-temperature calcination of EMR were evaluated. In addition, the effects of mole ratio of EMR to coke and temperature on the gas–solid phase and the feasibility of calcined solid products as cement raw materials were also studied. The results showed that the release of sulfur from EMR mainly depends on the mole ratio of EMR to coke and temperature. The best condition for preparing SO2 was EMR calcined for 60 min at 1000 °C and the molar ratio of C:CaSO4 = 0.78:1. At this time, the volume fraction of SO2 reached 7.6%, which meets the requirements for preparing sulfuric acid with SO2. Under this condition, the sulfur in desulfurization manganese residue (DMR) was reduced to 0.38%, and DMR was used as cement raw material to prepare cement. The cement prepared by adding 10% DMR meets the national standard GB175. The method realized the recovery of sulfur in EMR and calcined solid products and promoted the resource utilization of EMR.

Graphical Abstract

1. Introduction

Electrolytic manganese is an important raw material in alloy, battery, catalyst and chemical industry [1,2]. China is the largest manufacturer of electrolytic manganese, with an annual output of 1.4 million tons, which accounts for about over 97% of global output [3]. Electrolytic manganese residue (EMR) is the waste residue produced by acid hydrolysis, neutralization, impurity removal and pressure filtration of manganese mineral in the process of electrolytic metal manganese production [4]. The production of 1 ton of electrolytic manganese is generally accompanied by 10–12 tons of EMR [5]. The random disposal of EMR has caused various environmental and land occupation problems, and the reuse of this solid waste has become an urgent task [6].
With the increasingly stringent environmental regulations in China, the hazard-free treatment of EMR has become very important. Wang et al. proposed that EMR can be used to prepare non-sintered permeable bricks [7]. Zhan et al. had investigated that EMR with fly ash were co-recycled to form lightweight ceramsite [8]. Zhang et al. studied the synergistic effect of EMR-red mud–carbide slag as the main raw materials on the strength and durability properties of the road base material [9]. However, these methods of reuse may be limited by their complicated processes, low utilization efficiencies of EMR and high costs. EMR is an inert silicon aluminum material rich in sulfate [10]. At present, the application of EMR in the preparation of materials is mainly simple addition, and its high content of sulfate is not fully utilized [11]. By contrast, using EMR as a cement additive is simpler, of high utilization and has low costs [12,13]. High-temperature reduction by coke and calcining desulfurization are applied for EMR. The composition of desulfurization manganese residue (DMR) is similar to that of cement [14,15]. Cheng et al. proposed that high-temperature reduction and calcining desulfurization of EMR can significantly improve the activity of EMR and greatly improve the content of EMR in cement and realize the large-scale utilization of EMR [16]. At the same time, high-concentration SO2 flue gas is emitted during EMR calcination [17]. Therefore, controlling the concentration of SO2 in flue gas is the key factor for the resource utilization of EMR.
Yao et al. proposed a new route of electrolytic manganese production (EMP): high-concentration SO2 can be used to prepare sulfuric acid leaching manganese [18]. In this study, flue gas from EMR calcination was a breakthrough, combined with manganese oxide ore and anolyte (MOOA) desulphurization and the EMP process, the internal recycling of sulfur resources in manganese industry is realized. Hence, in this process, EMR calcination is a very important link, which requires that SO2 flue gas concentration is guaranteed, and the calcined solid products can be used as cement additives. The schematic of this new technique is shown in Figure 1.
In this study, a new method of the combined preparation of SO2 and the recovery of solid products was investigated using EMR as raw material and coke as the reducing agent. In combination with the electrolytic manganese production process, the internal recycling of sulfur resources in the manganese industry is achieved as an objective. In this process, electrolytic manganese slag roasting is a very important link, and the main task is to ensure the concentration of SO2 flue gas, while the solid products after roasting can be used as cement additives. This work verifies the feasibility of simultaneously producing high-concentration SO2 and calcined products as cement additives. The effects of mole ratio of EMR to coke and temperature on the gas–solid phase and the feasibility of calcined solid products as cement raw materials were investigated. In addition, the thermodynamic analysis of the high-temperature calcination of EMR were also evaluated. This study can provide considerable technical support for the new EMP process and promote the resource utilization of EMR.

2. Materials and Methods

2.1. Raw Materials

EMR was provided by Tianyuan Manganese Industry Co., Ltd. (Zhongning, Ningxia, China), which was the biggest EMP enterprise in the world. Additionally, its main components based on XRF analysis were listed in Table S1. Before the application of desulfurization, the EMR need to be crushed and sieved to pass a 200-mesh screen (90% screening rate).
Coke was shipped from Shandong Metallurgical Research Institute, China. The proximate analysis showed that its main components were C (85.67%), total sulfur (0.5%), ash (12.42%), volatiles (1.39%), and P (0.02%).

2.2. Experiment Method

EMR was roasted in a tubular furnace, and the data were collected to determine the best conditions for SO2 production. Nitrogen was used as the protective atmosphere, the flow was 200 mL/min, the temperature rose from the room temperature to the set temperature and the holding time was 1 h. During the experiment, the gas samples produced by decomposition were collected in 1 L air bags at the calcination temperature for 5 min each. The air bags were fed into the TH-880F microcomputer smoke parallel sampler to measure SO2 concentration. The SO2 gas concentration of each air bag was the average concentration, and the maximum average concentration of SO2 was measured with 1 h of roasting time.

2.3. SO3 Analysis Method

According to GB/T176-2017 [19], the determination method of SO3 in solid products after roasting of EMR is as follows: after calcination of the solid product of EMR with hydrochloric acid, the solid product generates S O 4 2 , and Ba2+ in barium chloride reacts with S O 4 2 under boiling to form barium sulfate precipitation. After filtration and burning, pure barium sulfate is obtained. The mass of barium sulfate is weighed and converted into the mass of sulfur trioxide. Finally, the content of SO3 in solid products after roasting of EMR is calculated by mass fraction. The content of SO3 in solid is calculated using the following formula [19]:
w ( S O 3 ) = m 1 × 0.343 / m × 100 %
where m1 is the mass of barium sulfate precipitation after burning, g; m is the mass of the solid product after roasting of the weighed EMR, g; 0.343 is the conversion coefficient of barium sulfate to sulfur trioxide.

2.4. Methods of Analysis

A vacuum tube high-temperature furnace was used for calcination (GS-1500X-OTF, Hefei, China). Microcomputer smoke parallel samplers were used to measure SO2 content in flue gas (Th-880f, Wuhan, China). The chemical composition of EMR was determined by X-ray fluorescence spectrometry (XRF-1800, Shimadzu, Tokyo, Japan). The EMR and the solid product of EMR were analyzed by the use of X-ray diffraction instrument (XRD). The data of XRD were analyzed by Jade 6.0. The morphologies of solids were determined by using scanning electron microscopy (SEM, JEOL JSM-7800F, Tokyo, Japan).

3. Results and Discussion

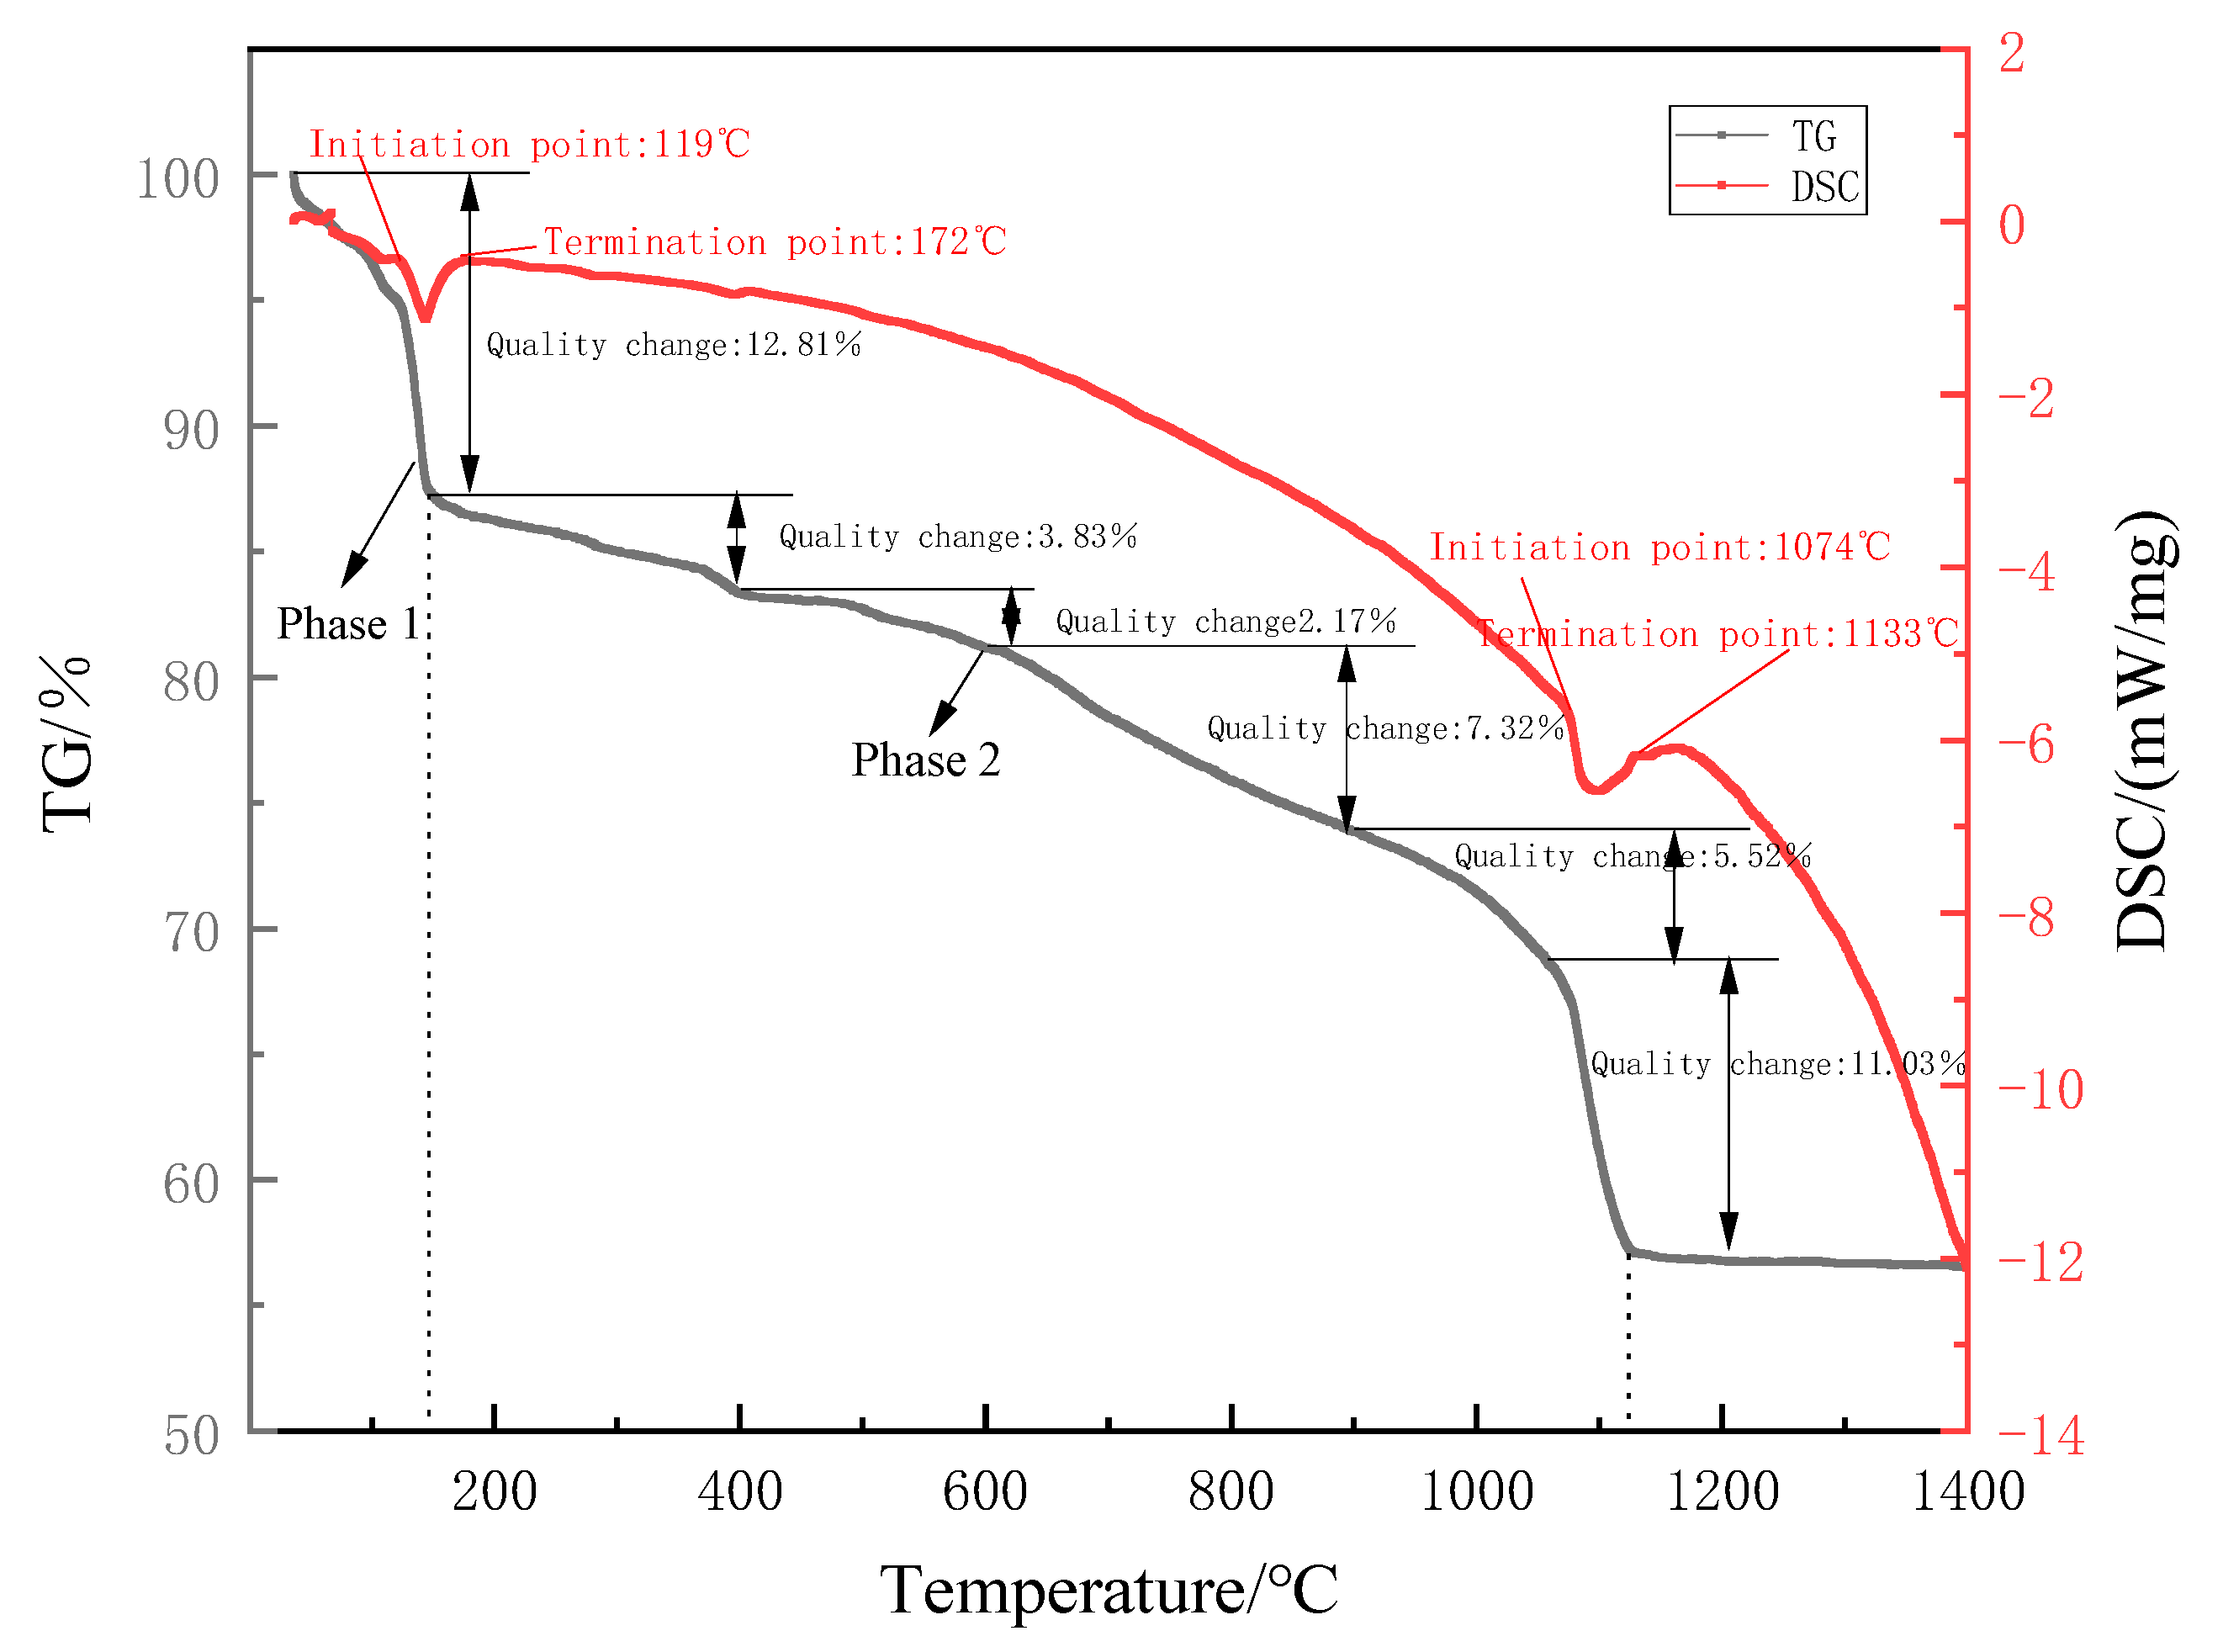
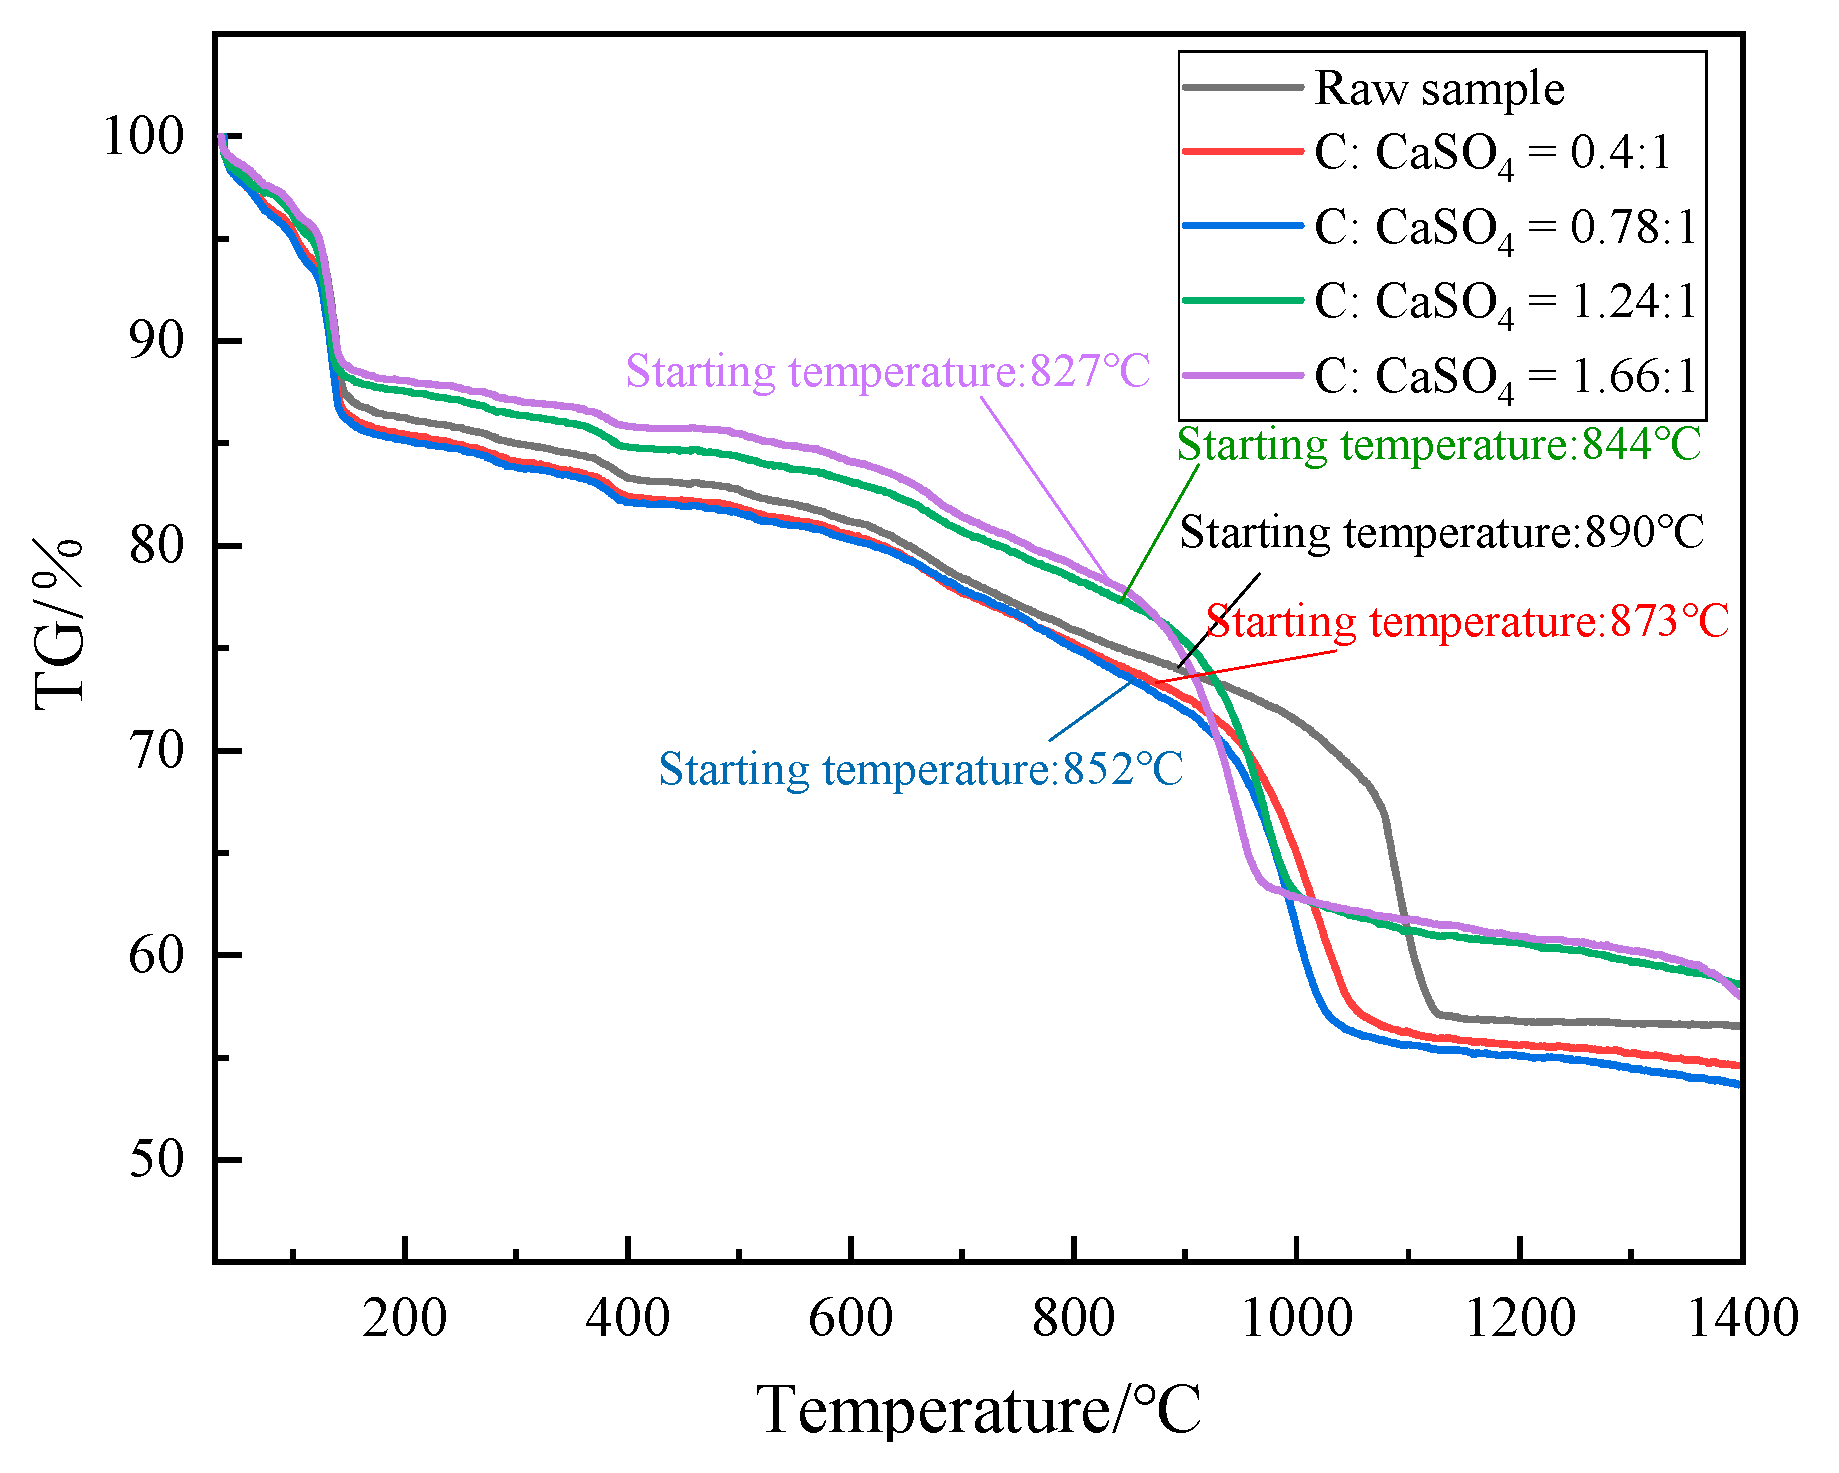
3.1. Properties of Raw Materials

Figure 2 shows that the surface morphology of EMR is different; granular crystals and flake crystals are staggered and scattered disorderly, and the binding between the particles is not tight. They mainly contain quartz (SiO2), gypsum (CaSO4·2H2O), MnSO4, FeSO4 and MgSO4.
The particle size distribution and density of EMR are shown in Table S2. From the results, it can be seen that the water content of EMR is 7.5%, the bulk density is 1110 kg/m3, the particle size is mostly less than 2 mm and the specific surface area of EMR is 12.43 m2/g, mainly with medium and large pores.
From the results shown in Figure 3, it can be seen that there are six different weight loss temperature segments: 36~149 °C, 149~393 °C, 393~603 °C, 603~890 °C, 890~1074 °C and 1074~1133 °C. The results show that different substances have different thermal decomposition temperatures and heat resistance. The first temperature segment is mainly the dehydration loss of gypsum. The second temperature segment is the thermal decomposition of ammonium sulfate, and the latter four temperature sections from low to high correspond to the decomposition of FeSO4, MgSO4, MnSO4 and CaSO4, respectively. Finally, about 55.0% of the remaining EMR is not to be decomposed. The decomposition temperature of MnSO4, FeSO4 and MgSO4 is significantly lower than that of calcium sulfate [20,21]. Therefore, the reduction in sulfur content by EMR calcination is mainly due to the decomposition of CaSO4.

3.2. EMR Calcination

3.2.1. Response Surface Prediction Model of Flue Gas from EMR

Design expert 8.0.6 (Stat-Ease Inc., Minneapolis, MN, USA) software was used for processing. The Box–Behnken design (BBD) module based on response surface method considers the effects of temperature, EMR dosage and coke dosage on SO2 production in flue gas of EMR calcination. Three factor levels were set for each test factor in Table S3.
Use Design expert 8.0.6 to fit the x value in Table S4 to obtain the regression equation:
V s o 2 = 92.7 + 0.17 x 1 0.55 x 2 + 28.42 x 3 + 3.3 × 10 3 x 1 x 2 0.03 x 1 x 3 8.75 × 10 5 x 1 2 0.083 x 2 2 1.18 x 3 2
where Vso2 is the volume fraction of SO2; x1~x3, respectively, represents the test factor temperature, EMR dosage and coke dosage.
The above regression equation was analyzed by variance, and the results are shown in Table 1. As can be seen, the established model was significant (p < 0.05); the mismatch term (p > 0.05) was not significant, indicating that the model had high reliability. Through the analysis of variance, the order of the influence of the three factors on the volume fraction of SO2 was found to be x1 > x2 > x3, that is, temperature > EMR dosage > coke dosage. Here, the primary items x1 and x2 had an extremely significant effect on the results (p < 0.01), the interaction term x1 x2 had a significant effect on the results (p < 0.05) and the quadratic term x22 had a significant effect on the results (p < 0.05).
Based on the significance level of p < 0.05, Equation (2) can be expressed as:
V S O 2 = 92.7 + 0.17 x 1 0.55 x 2 + 3.3 × 10 3 x 1 x 2 0.83 x 2 2
Accordingly, the experiment was carried out with the dosage of EMR of 15 g to explore the effects on the calcination of EMR. Based on the above results, the effects of temperature and coke addition were further investigated subsequently.

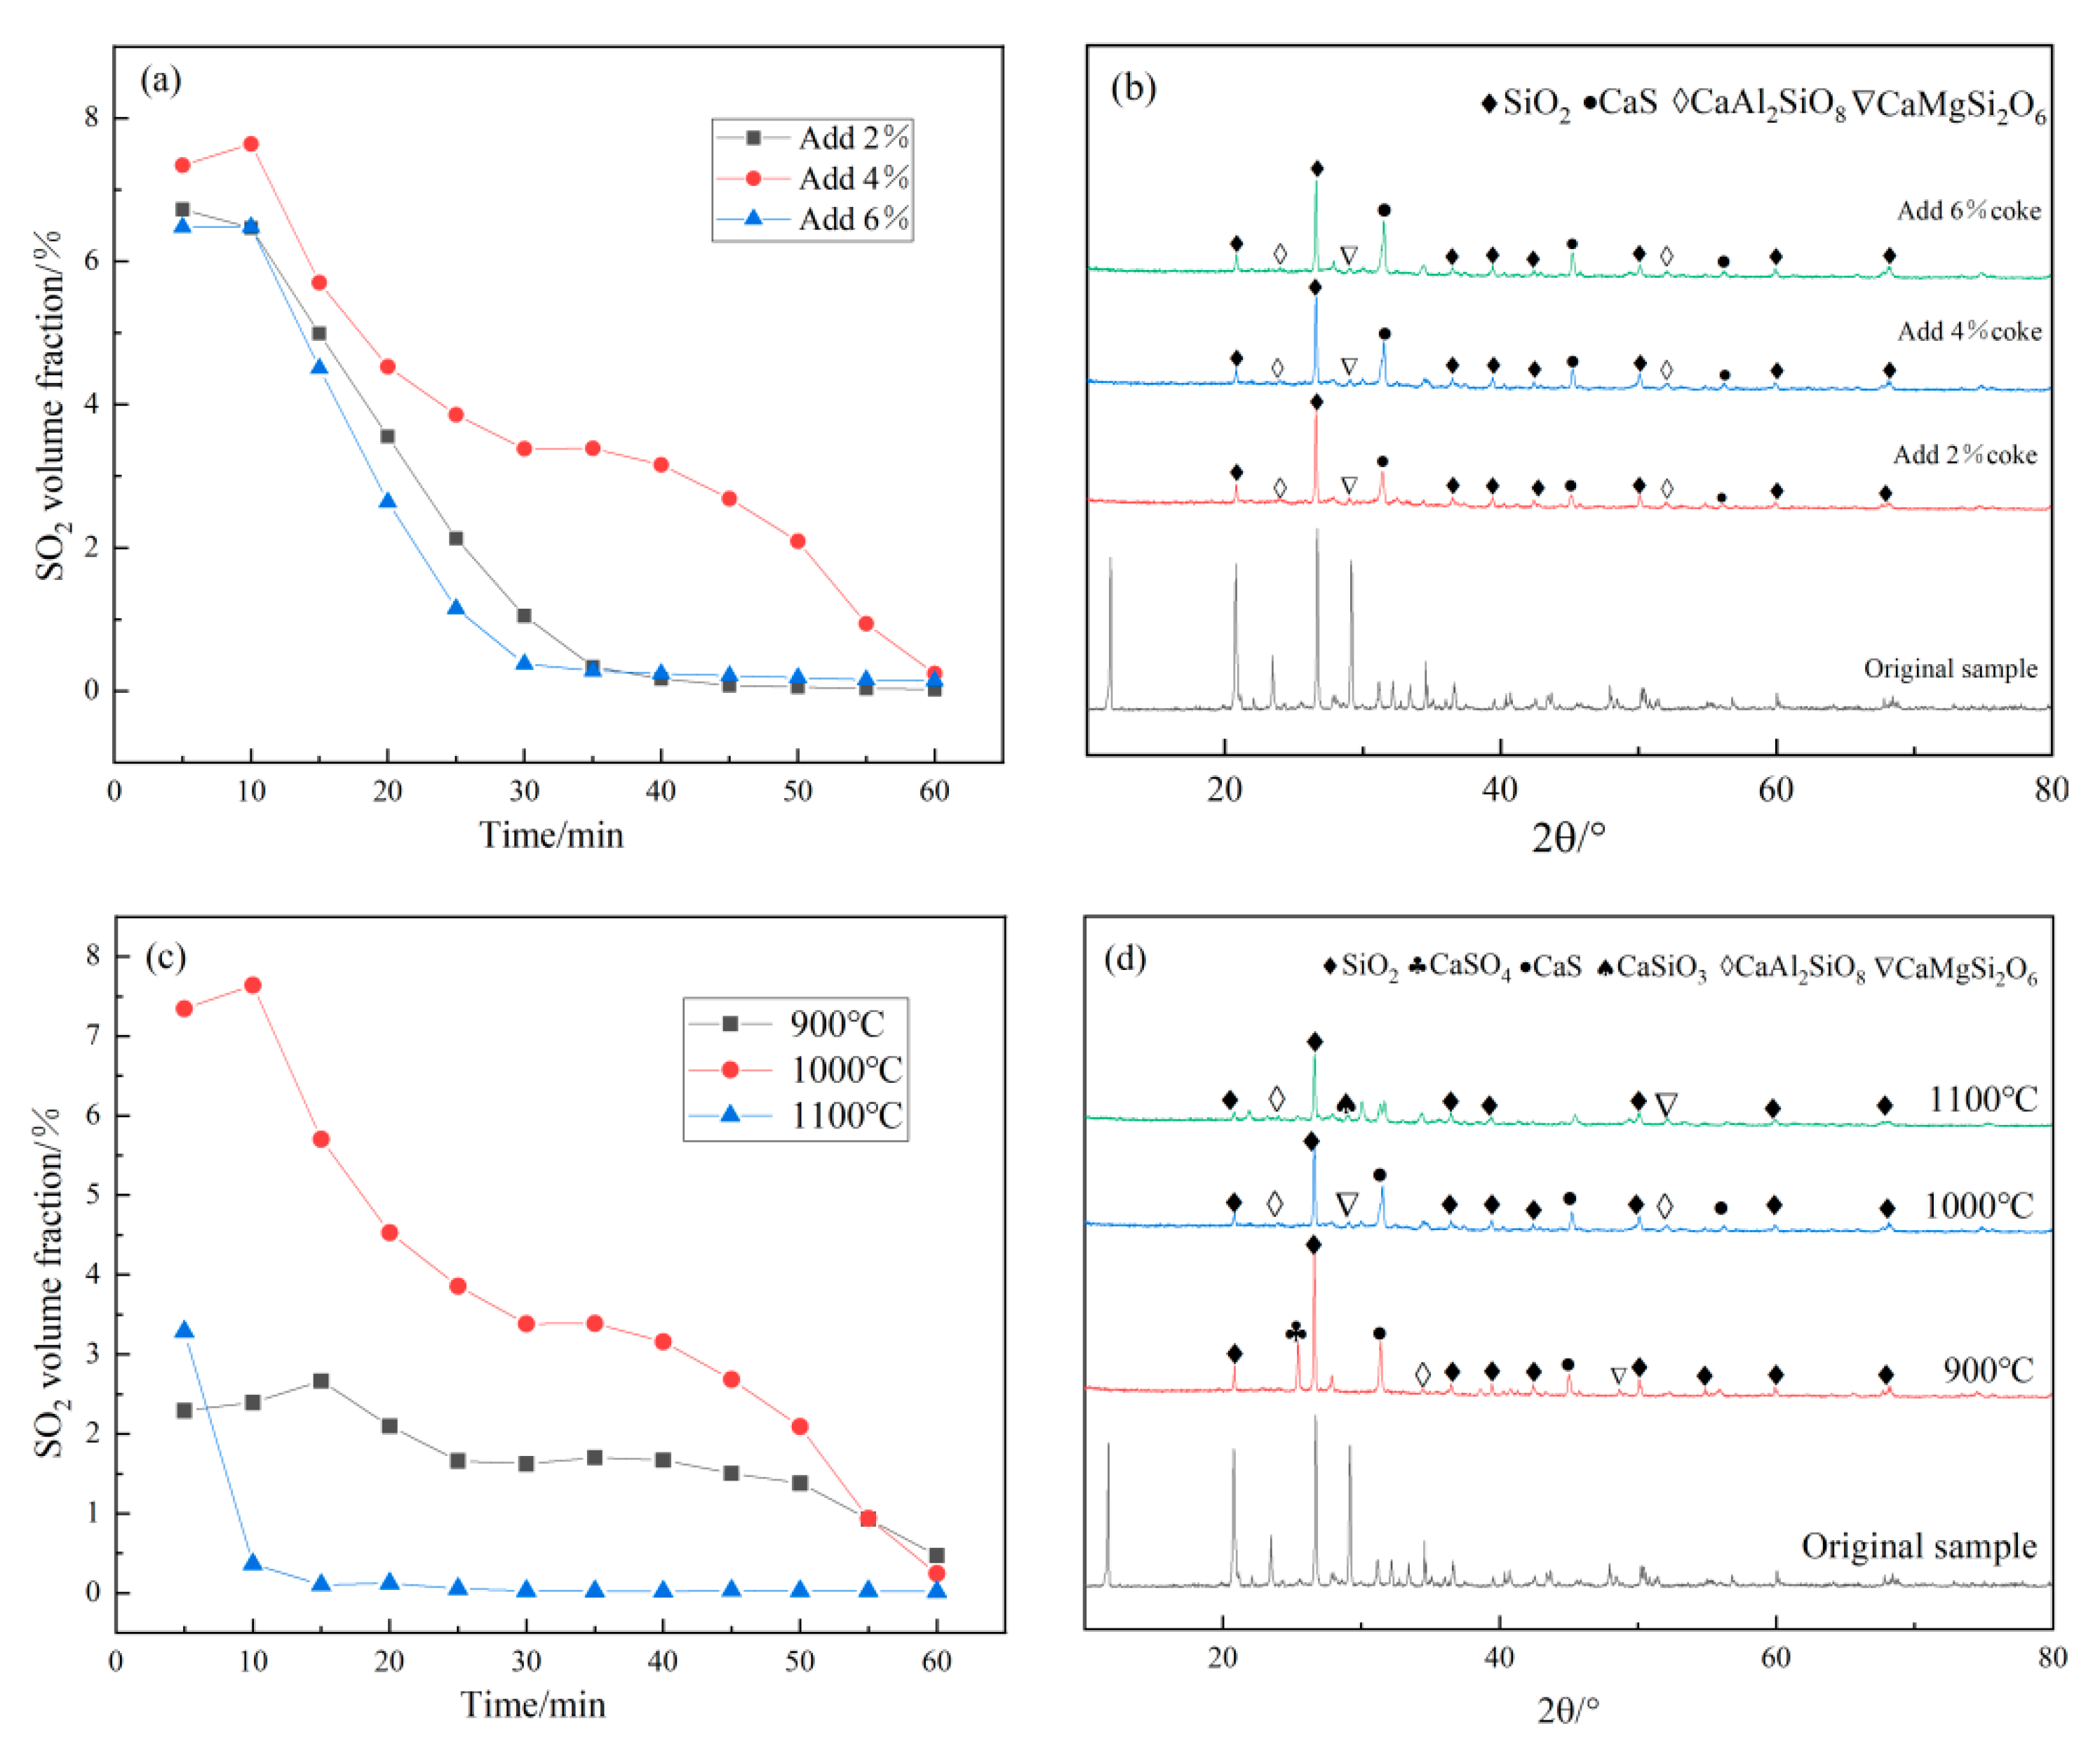
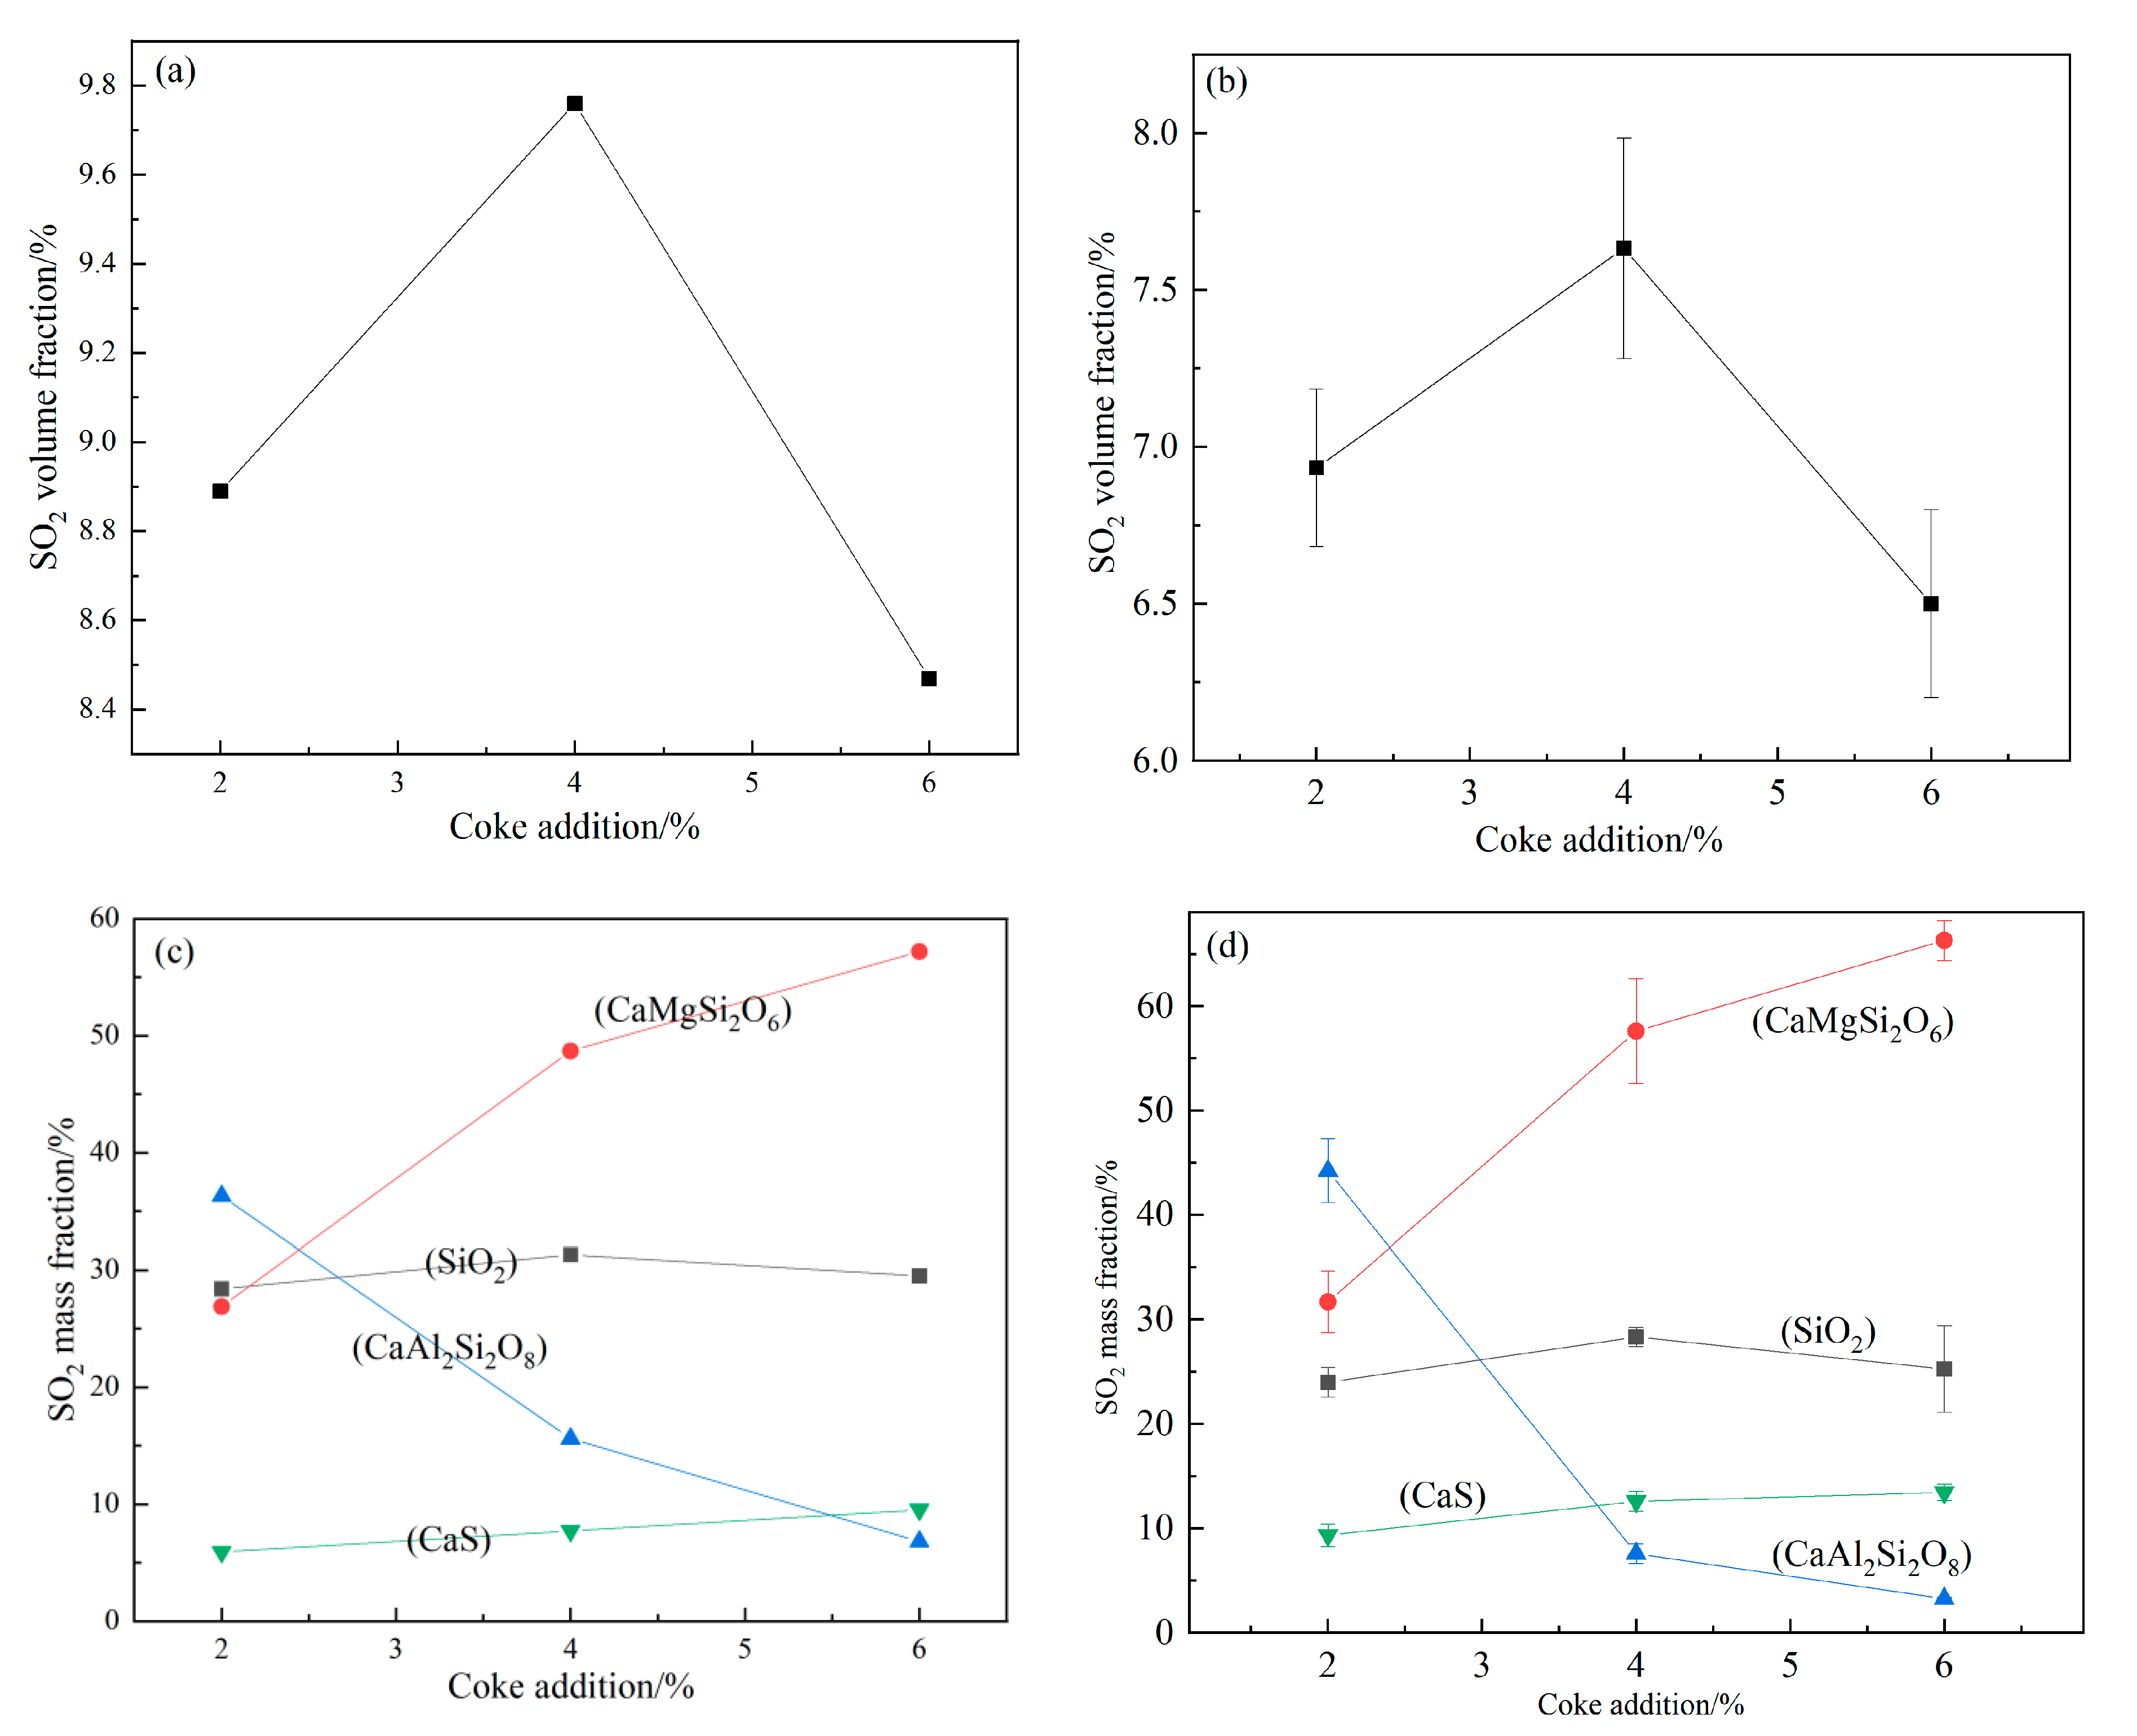
3.2.2. Effect of the Mole Ratio of EMR to Coke

EMR contained high sulfur content, mainly in the form of sulfate such as CaSO4. Due to the high decomposition temperature and slow decomposition speed of CaSO4, and the complex composition of EMR, the eutectic temperature of CaSO4 was high. The high-temperature reduction and calcination of EMR by coke reduced the decomposition temperature of sulfates such as CaSO4 [22,23,24], prepared the high concentration SO2 and reduced the sulfur content.
Figure 4 shows that the first mass loss stage is mainly the precipitation of crystalline water of EMR, and the mass loss decreases with the increase in molar ratio, because the higher the molar proportions, the less the relative content of EMR and the less the crystalline water content. The second mass loss stage is mainly the decomposition of EMR. The addition of coke reduces the initial reaction temperature. With the increase in molar ratio, the lower the initial reaction temperature, the faster the reaction rate.
One of the main objectives of this study was to investigate the gas–solid characteristics of EMR samples under the condition of high-temperature reduction calcination in nitrogen. During the high-temperature reduction calcination process, the following reactions are possible:
Reaction (1): CaSO4(s) + C(s)  CaO(s) + SO2(g) + CO(g)
Reaction (2): CaSO4(s) + CO(g)  CaO(s) + SO2(g) + CO2(g)
Reaction (3): CaSO4(s) + 2C(s)  CaS(s) + 2CO2(g)
Reaction (4): 3CaSO4(s) + CaS(s) 4CaO(s) + 4SO2(g)
Reaction (5): CaSO4(s) + 4CO(g)  CaS(s) + 4CO2(g)
Reaction (6): CaSO4  CaO + SO2 + 1/2O2
Figure 5a indicates that the initial yield of SO2 and the decomposition reaction rate of EMR increase with the increase in molar ratio. When the molar ratio was 0.78:1, the maximum volume fraction of SO2 was 7.6%. The formation of SO2 expressed in reaction (4) (Equation (6)) is predominant. At this time, the SO2 concentration meets the industrial requirements and can be used for the industrial preparation of sulfuric acid. When the molar ratio increased to 1.24:1, the maximum volume fraction of SO2 was only 6.5%, and the yield of SO2 decreased because CaS produced by the expression of reaction (3) (Equation (5)) was predominant. Therefore, the molar ratio of reactants was chosen as 0.78:1 in the next experiment.
Figure 5b illustrates that with the increase in molar ratio, the peak intensity of CaSO4 gradually disappeared, indicating that the addition of coke reduced CaSO4 to CaS. However, the CaS diffraction peak increased with the molar ratio, indicating that the CaS produced by reaction (4) (Equation (6)) reacted with CaSO4 to produce SO2. Combined with the change of SO2 volume fraction (Figure 4), at 1000 °C the expression of CaS was dominated by reaction (5) (Equation (7)). Part of CaS and CaSO4 was expressed by reaction (4) (Equation (6)) to produce SO2.
Figure 5b illustrates that with the increase in molar ratio, the peak intensity of CaSO4 gradually disappeared, indicating that the addition of coke reduced CaSO4 to CaS. However, the CaS diffraction peak increased with the molar ratio, indicating that the CaS produced by reaction (4) (Equation (6)) reacted with CaSO4 to produce SO2. Combined with the change of SO2 volume fraction (Figure 4), at 1000 °C the expression of CaS was dominated by reaction (3) (Equation (5)). Part of CaS and CaSO4 was expressed by reaction (4) (Equation (6)) to produce SO2.

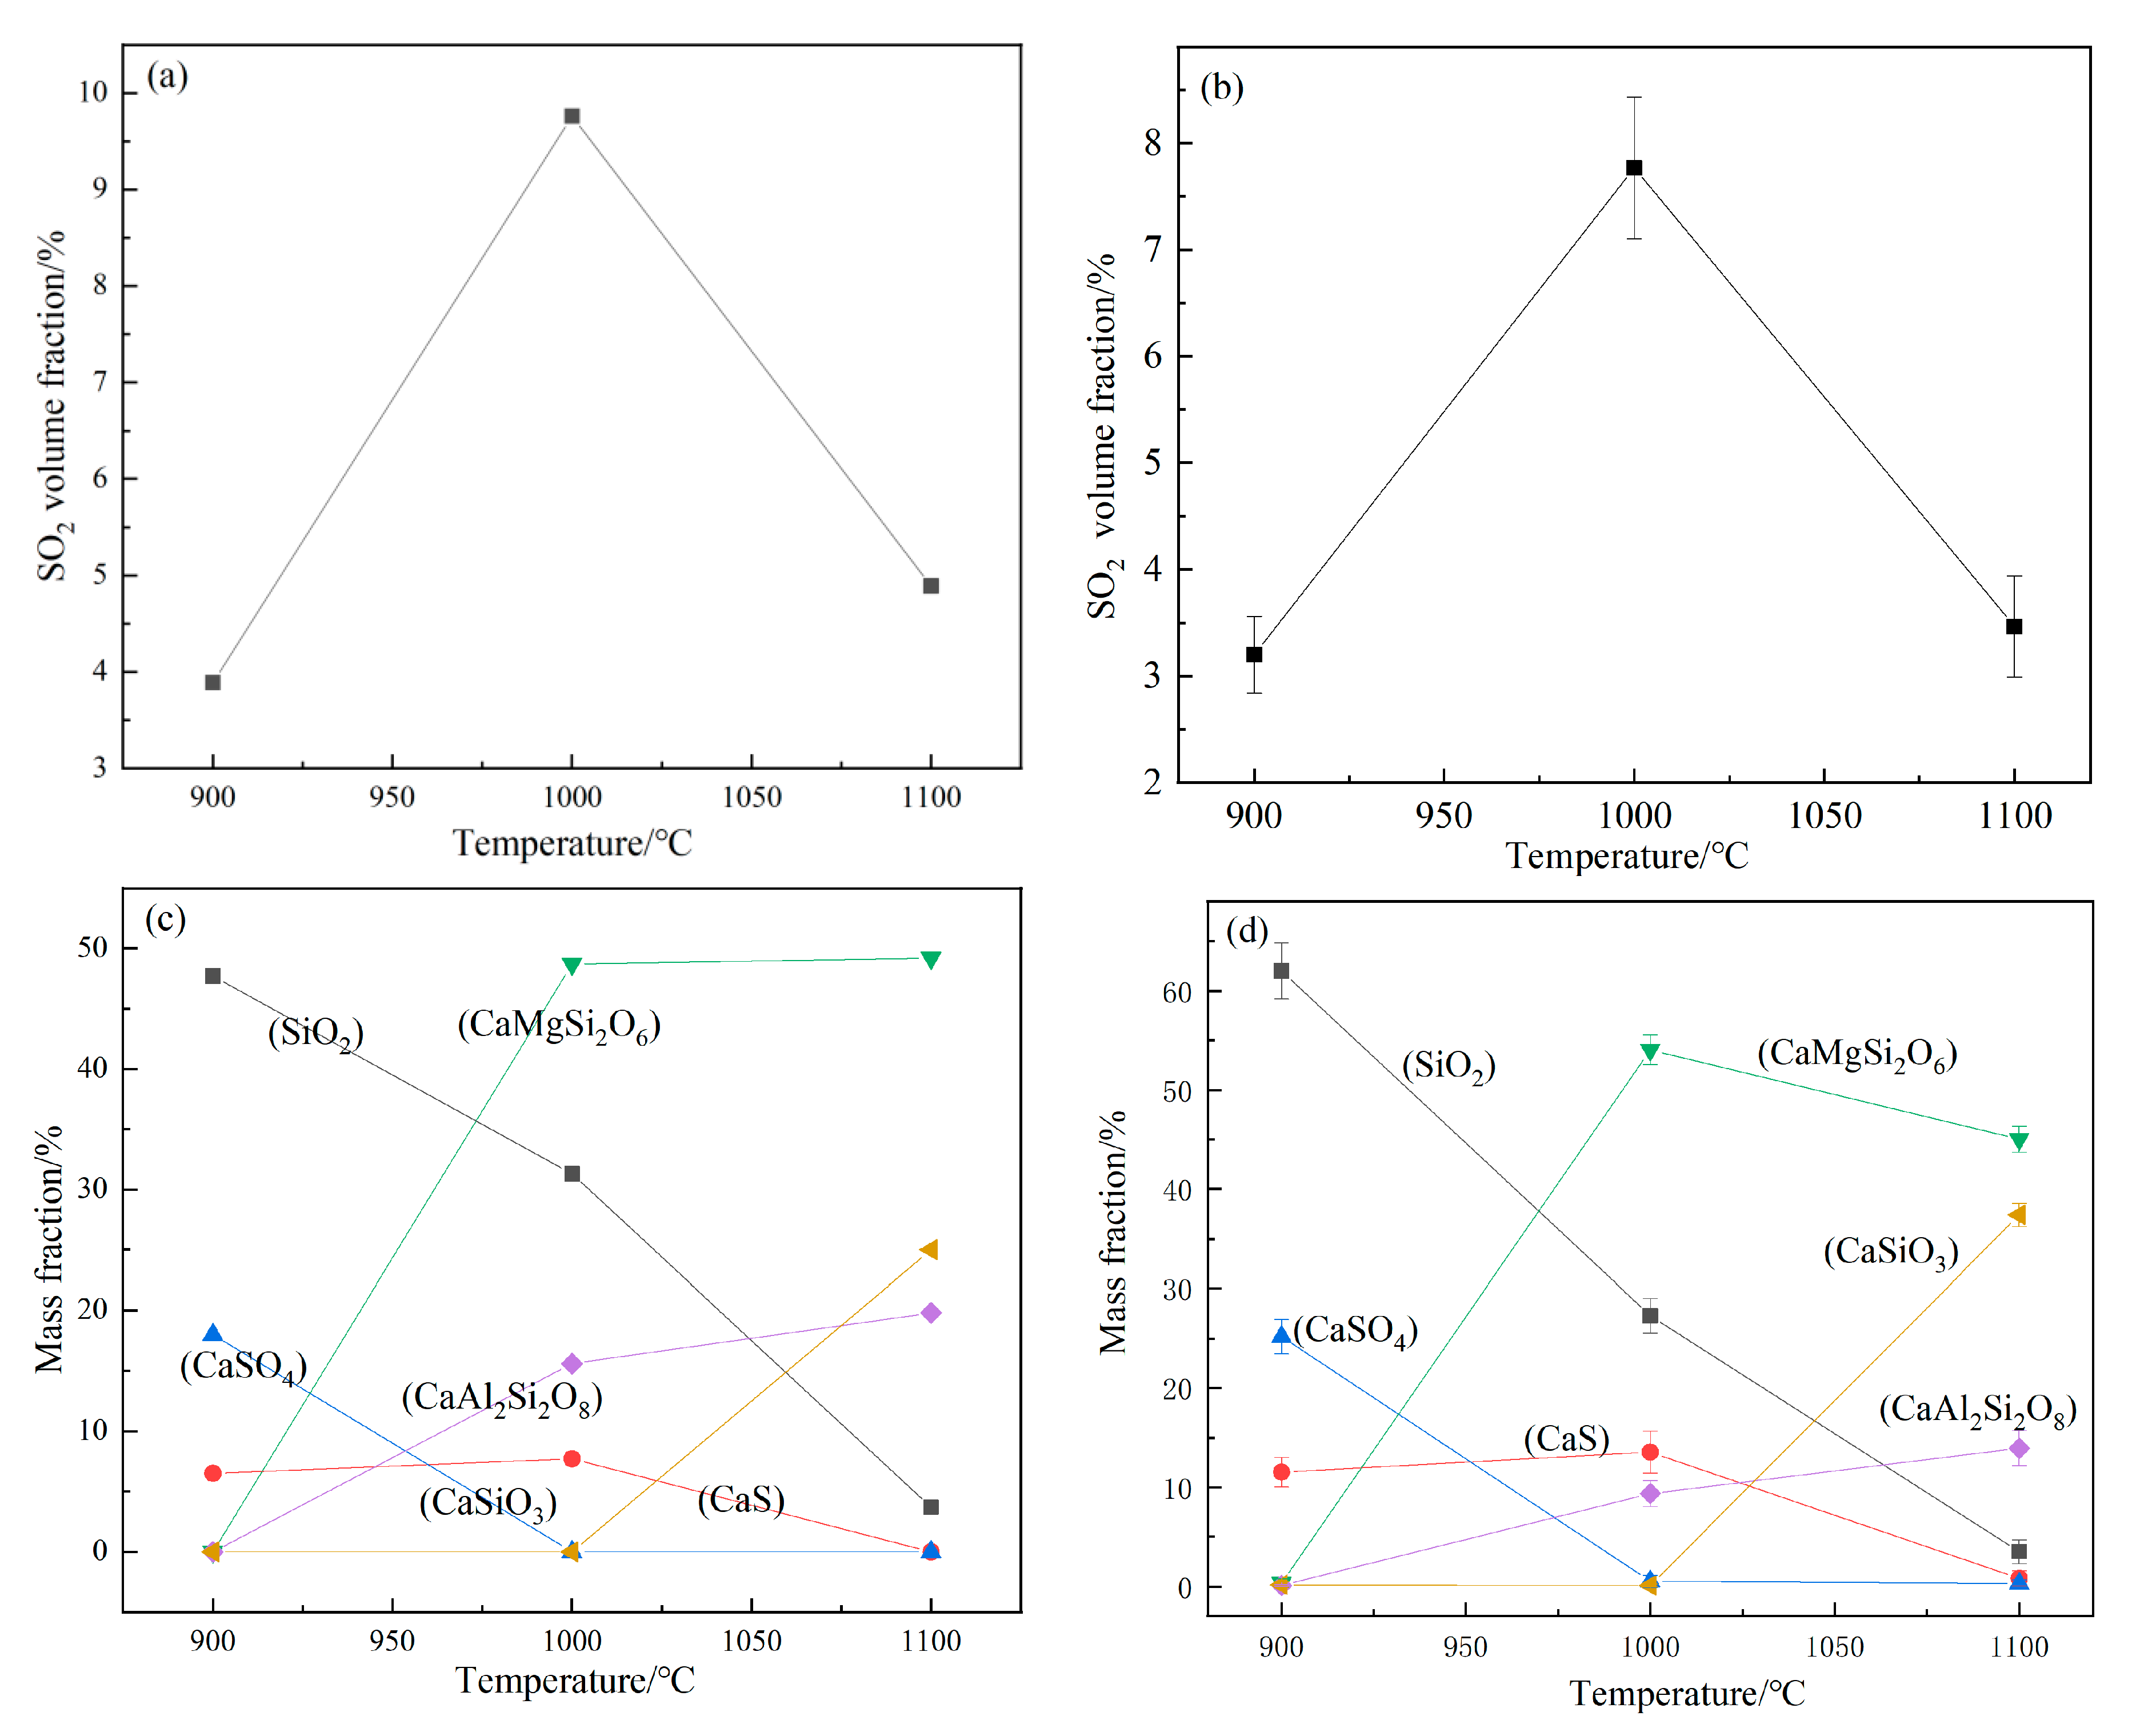
3.2.3. Effect of the Reaction Temperature

Figure 5c shows that the volume fraction of SO2 was only 2.7% at 900 °C. At this temperature, the reduction and decomposition of EMR to SO2 may not be completed, or it was dominated by the reaction (4) (Equation (6)), expressing CaS. At 1000 °C, the maximum volume fraction of SO2 was 7.6%. Obviously, higher reaction temperature was conducive to increasing SO2 concentration. When the reaction temperature rose from 1000 °C to 1100 °C, the volume fraction of SO2 decreased to 3.3%, and it was possible that the EMR and coke melt together at a higher temperature [25,26,27]. Therefore, the decomposition of EMR into SO2 has not been completed.
The above results show that the best reaction condition is when the reaction temperature is 1000 °C and the coke addition is 4% (Figure 4). At this time, the SO2 concentration reaches the maximum volume fraction of 7.6%, which meets the industrial requirements.
It can be seen from Figure 5d that, with the increase in temperature, the peak intensity of CaSO4 decreased until it disappeared. The addition of coke reduced the decomposition temperature of calcium sulfate [28]. At lower temperature, CaSO4 was reduced to CaS; at higher temperature, there was no peak intensity of CaS, which further indicates that the remaining CaS can further react and release SO2.

3.3. Study on the Solid Product of EMR Calcination as Cement Raw Material

Under the condition of 1000 °C and adding 4% coke, the EMR after calcination and desulfurization take Si, Ca, Al and Fe as the main components, which is similar to the raw material composition of cement production [14,15]. In theory, it can be used as the raw material of cement production. In order to study the feasibility of desulfurized manganese residue as cement raw material, electrolytic manganese residue was desulfurized to obtain desulfurized manganese residue (DMR). Table S6 shows the chemical composition of EMR and DMR. According to the chemical composition, the DMR is mixed with other cement raw materials, as shown in Table S6. Additionally, the raw material proportioning scheme is shown in Table S7.
It can be seen from Table 2 that the three-day, seven-day and twenty-eight-day compressive and flexural strength of clinker added with DMR meet the requirements of the National Standard of China GB175-2020 [29], indicating that the use of DME, as cement raw material will not have a negative impact on the strength of clinker.
Cement is prepared from clinker and gypsum in a certain proportion, the performance test results of cement are shown in Table 3. The results show that the stability of cement is qualified, and the water demand of standard consistency is within the normal range, the initial setting time of 105 min (standard value > 45 min) and the final setting time of 181 min (standard value < 360 min) are also within the normal range.
The technical indexes of cement made of clinker with about 10% desulfurization manganese slag can meet the requirements of the National Standard of China GB/T175-2020 [29]. Therefore, it is feasible to use DMR as cement raw material. However, the specific addition amount of DMR in cement raw materials should also meet the requirements for the heavy metal content of cement clinker in the National Standard of China GB50295-2016 [30] code for design of cement plants (shown in Table S8). Assuming that the conversion ratio of raw clinker is 1.5, compared with the National Standard of China GB50295-2016 [30], the maximum addition amount of DMR must be less than 10.05% due to the limitation of nickel. The specific addition amount depends on the heavy metal content of other cement raw materials.

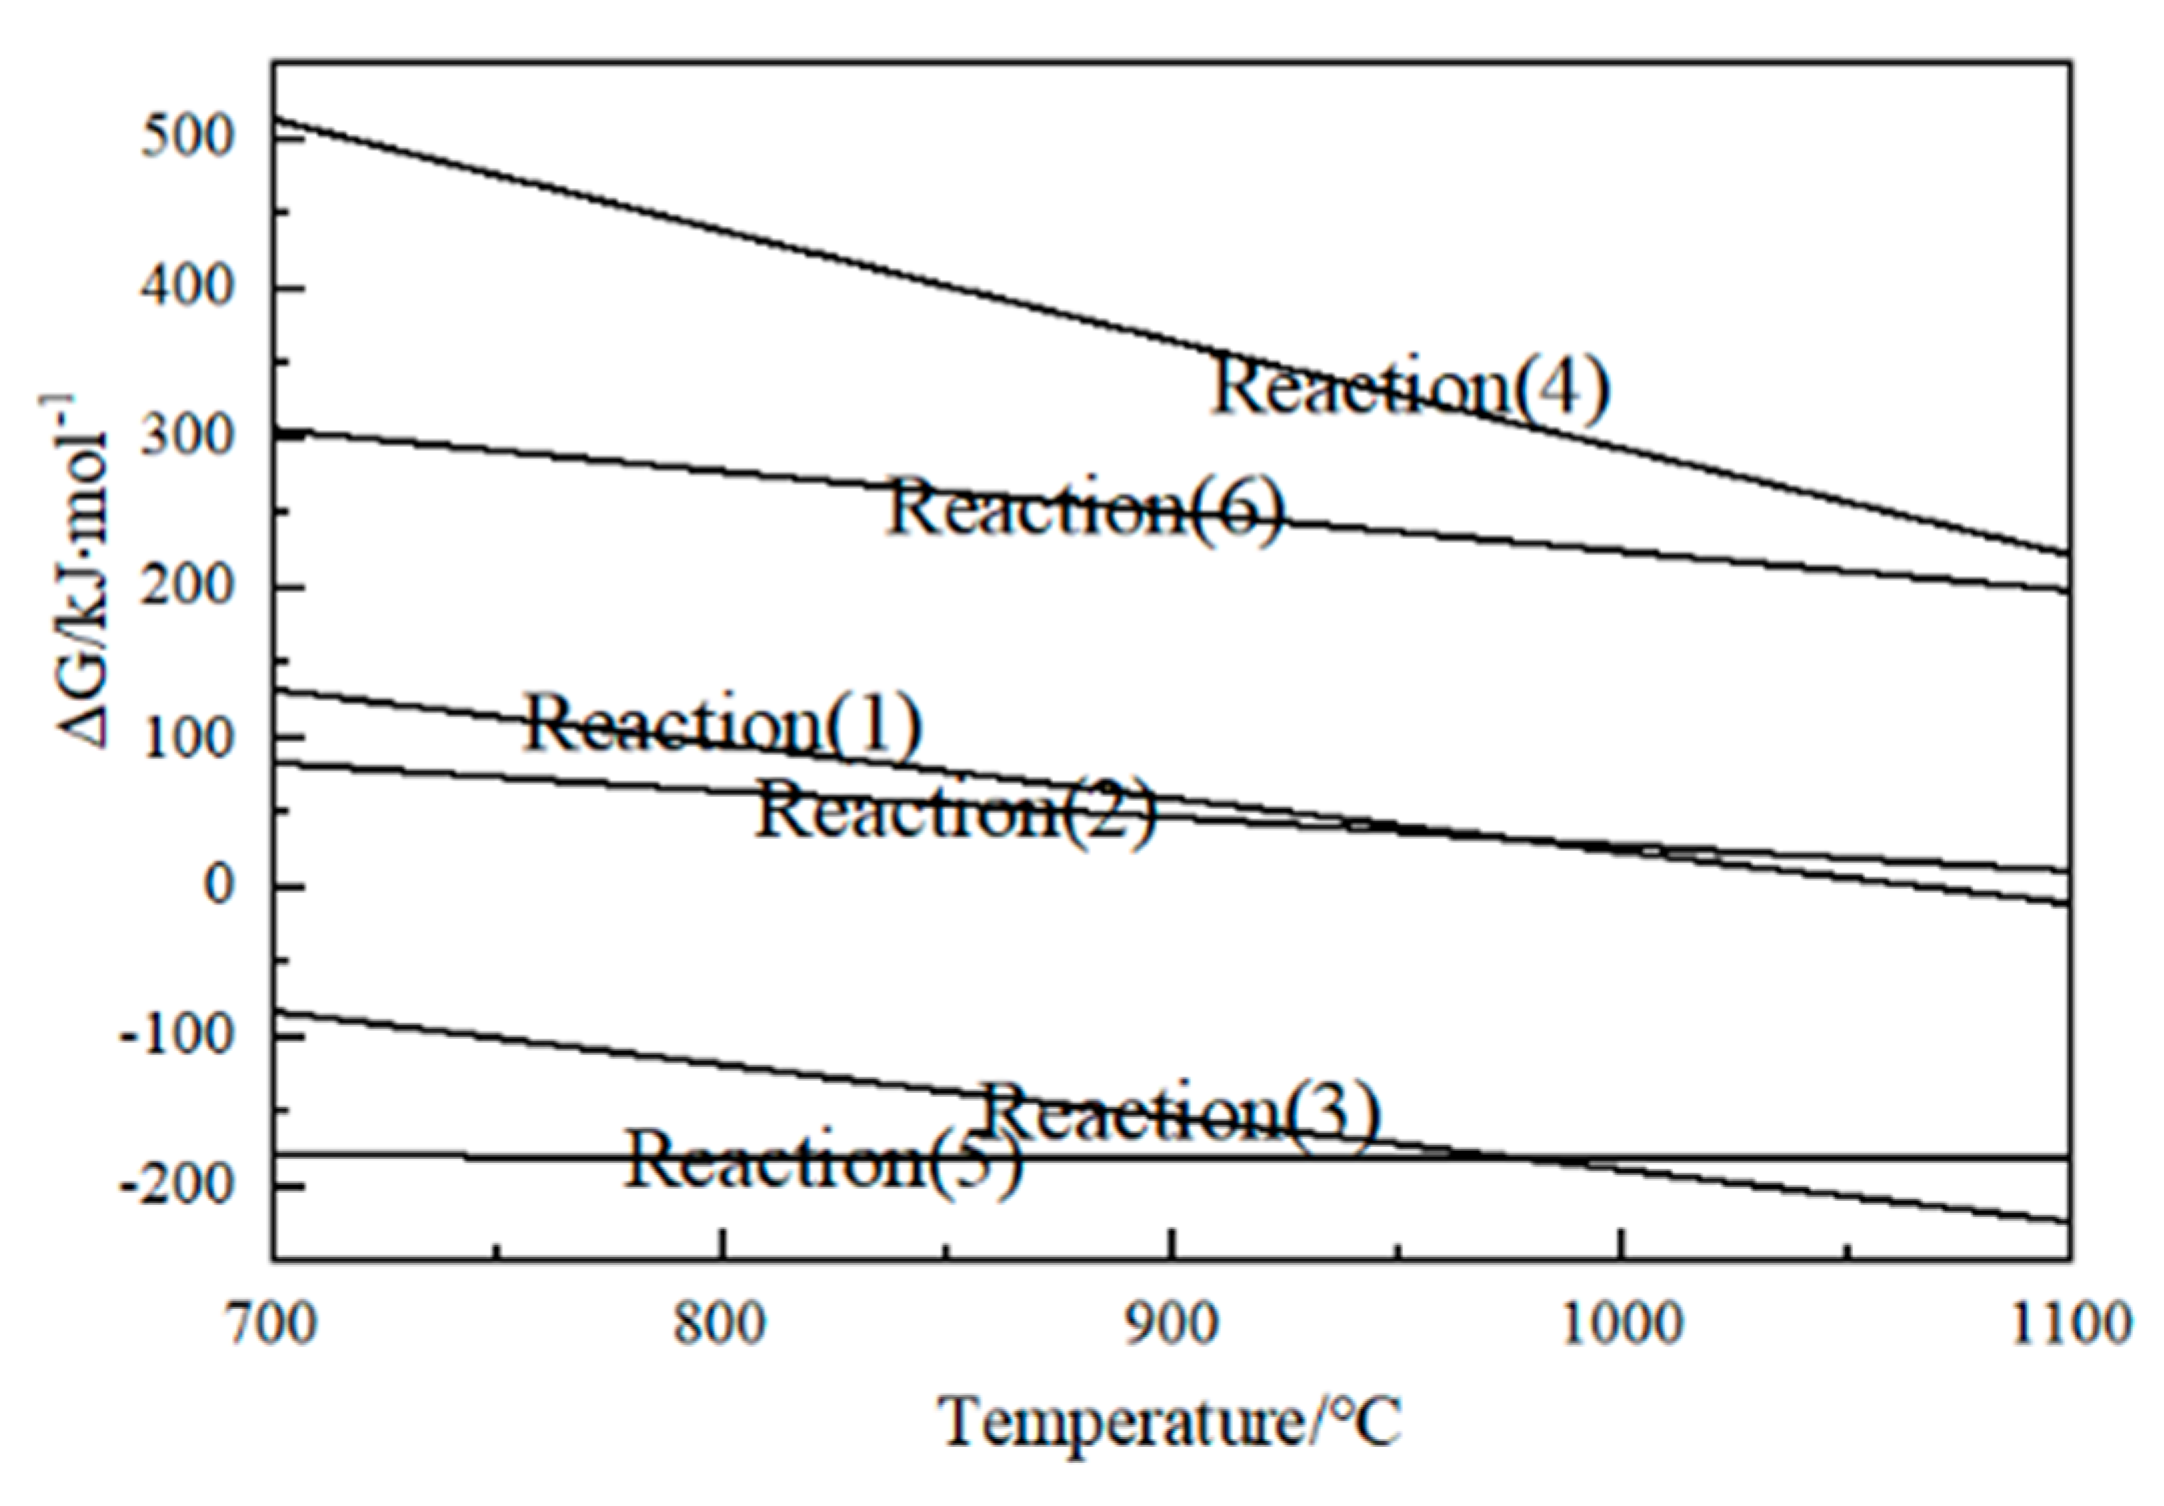
3.4. Calculation and Simulation of Gas–Solid Product Formation during Calcination of EMR

The production and discharge characteristics of gas–solid products in the calcination of EMR were studied by thermodynamic calculation software FactSage 7.1. Considering the reduction effect of coke in the calcination process, the reaction module of FactSage 7.1 calculated that the possible reactions (1)–(6) of EMR in the decomposition process.
Figure 6 illustrates that in the temperature range of 700–1100 °C, the direct decomposition reaction of CaSO4 cannot proceed spontaneously. However, under reduction conditions, the decomposition of CaSO4 can be realized by coupling reactions (1), (2) or (3), (4) and (5). It can be seen from reactions (1) and (2) that, in theory, the addition of coke can promote the decomposition of CaSO4 and reduce the decomposition temperature of CaSO4. The reaction starting temperature of reaction (3) is lower than 700 °C, and the reaction starting temperature of reaction (1)−(4) is higher than 1100 °C, which indicates that when the carbon content is sufficient, reaction (3) reacts first at low temperature and reaction (4) may occur at high temperature. The higher the temperature, the greater the degree of reaction (4). Therefore, whether the product is CaO or CaS, the ΔG of the reactions decrease with the increase in reaction temperature, indicating that the temperature has a significant effect on the reduction and decomposition of CaSO4. From the change trend of ΔG, the higher the temperature, the more conducive to the reactions.
Figure 7a,b displays that with the increase in coke addition, the gas change of thermodynamic calculation (Figure 7a) was consistent with tubular furnace experiment (Figure 7b). The volume fraction of SO2 reached the maximum when the coke addition was 4%. Figure 7c,d shows that the solid change of thermodynamic calculation (Figure 7c) was consistent with tubular furnace experiment Figure 7d. With the increase in coke addition, the main solid products after calcination were SiO2, CaS, CaMgSi2O6 and CaAl2SiO8. The content of SiO2 was basically unchanged, the content of CaAl2SiO8 decreased and the content of CaS and CaMgSi2O6 increased.
We added 4% coke at different temperatures. As the temperature increases from 900 °C to 1100 °C, the changes of main gas products were shown in Figure 8a,b. Under the condition of adding 4% coke, with the increase in temperature, the gas change trend of thermodynamic calculation (Figure 8a) gas was consistent with that of tube furnace experiment (Figure 8b), and reached the maximum at 1000 °C. The changes of main solid products were shown in Figure 8c,d. The change trend in thermodynamic calculation (Figure 8c) was basically consistent with that in tubular furnace experiment (Figure 8d). Since the initial reaction temperature of reaction (3) was lower than 700 °C, CaS generated by reaction (3) was dominant at 1000 °C, and CaSO4 was not completely decomposed at this time. With the increase in temperature, the main solid products after calcination were SiO2, CaS, CaMgSi2O6 and CaAl2SiO8. The content of SiO2 decreased, the content of CaS first increased and then decreased, and the contents of CaMgSi2O6 and CaAl2SiO8 increased.
A comparison of fitted and experimental values, shown in Figure S1, reveals that descriptive equations are adequate and yield predictions that are essentially equivalent. It shows that the model predicts the coke addition and temperature on SO2 concentration very well. The predicted values obtained were quite close to the experimental values (R2 = 0.99, p < 0.05), indicating that the developed model successfully captured the correlation between the process variables and the responses.

4. Conclusions

A harmless treatment method based on the resource utilization of sulfur in EMR was proposed. In this method, the sulfur in EMR and the calcined solid product of EMR were used simultaneously to realize the resource utilization of EMR. The results showed that the composition of EMR was similar to that of cement raw materials and can be used as raw materials for the production of building materials after appropriate treatment. When the optimum calcination condition was that the temperature was 1000 °C and the coke addition was 4%, the maximum volume fraction of SO2 was 7.6%. At this time, the SO3 content in the slag can be reduced to 0.38%. Under the optimum conditions, the calcined DMR can produce qualified cement clinker, and the strength of clinker also meets the National Standard of China GB/T175-2020. After burning the cement raw material with about 10% DMR into mature material, the technical indexes of the cement can meet the requirements of the National Standard of China GB/T175-2020. This method successfully realized the effective utilization of EMR in EMP process and cement.

Supplementary Materials

The following supporting information can be downloaded at: https://www.mdpi.com/article/10.3390/separations10050288/s1, Table S1: chemical composition of the EMR; Table S2: characteristics and particle size distribution of EMR; Table S3: test factor setting and level of response surface design; Table S4: volume integral value of SO2 in calcination flue gas under different conditions; Table S5: Chemical composition analysis of EMR and DMR; Table S6: Cement raw material batching scheme; Table S7: Chemical composition analysis of raw meal and clinker in proportioning scheme; Table S8: Heavy metal content of DMR; Figure S1: The studentized residuals and predicted response plot.

Author Contributions

Conceptualization, H.L. and Y.L.; methodology, Y.L. and S.C.; validation, L.Z. and Y.X.; formal analysis, L.Z., Y.X. and H.L.; investigation, L.Z. and Y.X.; resources, S.T.; data curation, H.L.; writing—original draft preparation, L.Z.; writing—review and editing, H.L.; visualization, L.Z. and Y.X.; supervision, Y.L., S.C. and S.T.; project administration, Y.L. and S.C.; funding acquisition, Y.L. All authors have read and agreed to the published version of the manuscript.

Funding

This research was funded by National Key R&D Program of China, grant number 2018YFC0213405.

Data Availability Statement

The authors confirm that the data supporting the findings of this study are available within the article and its Supplementary Materials. Supplementary Data associated with this article can be found in the online version.

Conflicts of Interest

The authors declare no conflict of interest. The funders had no role in the design of the study; in the collection, analyses, or interpretation of data; in the writing of the manuscript; or in the decision to publish the results.

References

  1. Hagelstein, K. Globally sustainable manganese metal production and use. J. Environ. Manag. 2009, 90, 3736–3740. [Google Scholar] [CrossRef] [PubMed]
  2. Xu, F.Y.; Jiang, L.H.; Dan, Z. Water balance analysis and wastewater recycling investigation in electrolytic manganese industry of China—A case study. Hydrometallurgy 2014, 149, 12–22. [Google Scholar] [CrossRef]
  3. Shu, J.; Lin, F.; Chen, M.; Li, B. An innovative method to enhance manganese and ammonia nitrogen leaching from electrolytic manganese residue by surfactant and anode iron plate. Hydrometallurgy 2020, 193, 105311. [Google Scholar] [CrossRef]
  4. Wang, D.; Wang, Q.; Xue, J. Reuse of hazardous electrolytic manganese residue: Detailed leaching characterization and novel application as a cementitious material. Resour. Conserv. Recycl. 2020, 154, 104645. [Google Scholar] [CrossRef]
  5. He, S.; Wilson, B.; Lundstrom, M. Hazard-free treatment of electrolytic manganese residue and recovery of manganese using low temperature roasting-water washing process. J. Hazard. Mater. 2021, 402, 11223561. [Google Scholar] [CrossRef]
  6. Zhang, Y.; Liu, X.; Xu, Y. Preparation of road base material by utilizing electrolytic manganese residue based on Si-Al structure: Mechanical properties and Mn2+ stabilization/solidification characterization. J. Hazard. Mater. 2020, 390, 122188. [Google Scholar] [CrossRef]
  7. Wang, Y.; Gao, S.; Liu, X. Preparation of non-sintered permeable bricks using electrolytic manganese residue: Environmental and NH3-N recovery benefits. J. Hazard. Mater. 2019, 378, 120768. [Google Scholar] [CrossRef]
  8. Zhan, X.; Wang, L.; Wang, L. Co-sintering MSWI fly ash with electrolytic manganese residue and coal fly ash for lightweight ceramisite. Chemosphere 2021, 263, 127914. [Google Scholar] [CrossRef]
  9. Zhang, Y.; Liu, X.; Xu, Y. Synergic effects of electrolytic manganese residue-red mud-carbide slag on the road base strength and durability properties. Constr. Build. Mater. 2019, 220, 364–374. [Google Scholar] [CrossRef]
  10. Wang, Z.; Guo, Q.; Jiang, X. Sulphate activating of electrolytic manganese residue to fly ash. Non−met. Ore 2011, 4, 5–8. (In Chinese) [Google Scholar]
  11. Zhou, C.; Wang, J.; Wang, N. Treating electrolytic manganese residue with alkaline additives for stabilizing manganese and removing ammonia. Korean J. Chem. Eng. 2013, 30, 2037–2042. [Google Scholar] [CrossRef]
  12. Wang, J.; Peng, B.; Chai, L. Preparation of electrolytic manganese residue–ground granulated blastfurnace slag cement. Powder Technol. 2013, 241, 12–18. [Google Scholar] [CrossRef]
  13. Du, B.; Zhou, C.; Dan, Z.; Luan, Z.; Duan, N. Preparation and characteristics of steam-autoclaved bricks produced from electrolytic manganese solid waste. Constr. Build. Mater. 2014, 50, 291–299. [Google Scholar] [CrossRef]
  14. Arezoumandi, M.; Volz, J.S.; Ortega, C.A.; Myers, J.J. Effect of total cementitious content on shear strength of high-volume fly ash concrete beams. Mater. Des. 2013, 46, 301–309. [Google Scholar] [CrossRef]
  15. Lo, T.Y.; Cui, H.Z.; Li, Z.G. Influence of aggregate pre-wetting and fly ash on mechanical properties of lightweight concrete. Waste Manag. 2004, 24, 333–338. [Google Scholar] [CrossRef]
  16. Chen, S.; Shuo, Z.; Shi, X. Study on application of manganese slag as cement mixture. China Build. Mater. Sci. Technol. 2019, 28, 48–49. (In Chinese) [Google Scholar]
  17. Van der Merwe, E.M.; Strydom, C.A.; Potgieter, J.H. Thermogravimetric analysis of the reaction between carbon and CaSO4·2H2O, gypsum and phosphogypsum in an inert atmosphere. Thermochim. Acta 1999, 340, 431–437. [Google Scholar] [CrossRef]
  18. Yao, L.; Xin, G.; Pu, P.; Yang, L.; Jiang, X.; Jiang, Z.; Jiang, W. Promotion of manganese extraction and flue gas desulfurization with manganese ore by iron in the anodic solution of electrolytic manganese. Hydrometallurgy 2021, 199, 105542. [Google Scholar] [CrossRef]
  19. GB/T176-2017; The State General Administration of the People’s Republic of China for Quality Supervision and Inspection and Quarantine, Methods for Chemical Analysis of Cement, The State Standard of the People’s Republic of China. Standards Press of China: Beijing, China, 2017. (In Chinese)
  20. Xu, R. Study on the Influence of Coke and Its Impurities on Pyrolysis Process of Calcium Sulfate; East China University of Science and Technology: Shanghai, China, 2011. [Google Scholar]
  21. Tagawa, H. Thermal decomposition temperatures of metal sulfates. Thermochim. Acta 1984, 80, 23–33. [Google Scholar] [CrossRef]
  22. Kato, T.; Murakami, K.; Sugawara, K. Carbon reduction of gypsum produced from flue gas desulfurization. Chem. Eng. Trans. 2012, 29, 805–810. [Google Scholar]
  23. Zheng, S.; Ning, P.; Ma, L.; Niu, X.; Zhang, W.; Chen, Y. Reductive decomposition of phosphogypsum with high-sulfur-concentration coal to SO2 in an inert atmosphere. Chem. Eng. Res. Des. 2011, 89, 2736–2741. [Google Scholar] [CrossRef]
  24. Li, C.; Zhong, H.; Wang, S.; Xue, J.; Wang, H. Reaction process and mechanism analysis for CaS generation in the process of reductive decomposition of CaSO3 with coal. J. Taiwan Inst. Chem. Eng. 2015, 50, 173–181. [Google Scholar] [CrossRef]
  25. Jia, X.; Wang, Q.; Cen, K.; Chen, L. An experimental study of CaSO4 decomposition during coal pyrolysis. Fuel 2016, 163, 157–165. [Google Scholar] [CrossRef]
  26. Li, X.; Zhang, Y.; Shen, X.D. Kinetics of calcium sulfoaluminate formation from tricalcium aluminate, calcium sulfate and calcium oxide. Cem. Concr. Res. 2014, 55, 79–87. [Google Scholar] [CrossRef]
  27. Yan, Z.Q.; Wang, Z.A.; Wang, X.F. Kinetic model for calcium sulfate decomposition at high temperature. Trans. Nonferrous Met. Soc. China 2015, 25, 3490–3497. [Google Scholar] [CrossRef]
  28. Zheng, D.; Lu, H.; Sun, X.; Liu, X.; Han, W.; Wang, L. Reaction mechanism of reductive decomposition of FGD gypsum with anthracite. Thermochim. Acta 2013, 559, 23–31. [Google Scholar] [CrossRef]
  29. GB175-2020; The State General Administration of the People’s Republic of China for Quality Supervision and Inspection and Quarantine, Common Portland Cement, The State Standard of the People’s Republic of China. Standards Press of China: Beijing, China, 2020. (In Chinese)
  30. GB50295-2016; The State General Administration of the People’s Republic of China for Quality Supervision and Inspection and Quarantine, Code for Design of Cement Plant, The State Standard of the People’s Republic of China. Standards Press of China: Beijing, China, 2016. (In Chinese)
Figure 1. Schematic of the new technique.
Separations 10 00288 g001
Figure 2. Characterization of the EMR sample: (a) SEM morphology, (b) general appearance and XRD pattern.
Separations 10 00288 g002
Figure 3. The thermogravimetric differential thermal curve of the original EMR.
Separations 10 00288 g003
Figure 4. Thermogravimetric curves of EMR and coke at different molar proportions (raw sample staring temperature 890 °C, C/CaSO4 = 0.4 for staring temperature 873 °C, C/CaSO4 = 0.78 for staring temperature 852 °C, C/CaSO4 = 1.24 for staring temperature 844 °C, and C/CaSO4 = 1.66 for staring temperature 827 °C).
Separations 10 00288 g004
Figure 5. (a) The concentration–time curves of SO2 at different molar proportions; (b) the XRD characterization of the product at different molar proportions; (c) the concentration–time curves of SO2 at different temperatures; (d) the XRD characterization of the product at different temperature.
Separations 10 00288 g005
Figure 6. Variation of ΔG of CaSO4−C decomposition reactions with temperature.
Separations 10 00288 g006
Figure 7. Changes of main gas (a,b) and solid (c,d) products after adding different proportions of coke at 1000 °C.
Separations 10 00288 g007
Figure 8. Changes of main gas (a,b) and solid (c,d) products after adding 4% coke at different temperatures.
Separations 10 00288 g008
Table 1. Analysis of variance of response surface test results.
Square Difference SourceSum of SquaresFree DegreeMean SquareFpSignificance
Model117.5913.066.490.011*
x135.28135.2817.540.0041**
x23213215.910.0053**
x30.7210.720.360.5685
x1 x210.89110.895.410.0529
x1  x312.96112.966.440.0388*
x2  x31.9611.960.970.3565
x123.2213.221.60.246
x2218.13118.139.010.0199*
x320.7610.760.380.5581
Residual14.0872.01
Spurious term14.0834.69
Error term040
Sum131.5816
Note: “*” means significant impact on the results (p < 0.05); “**” indicates that it has a highly significant impact on the results (p < 0.01).
Table 2. Performance test results of clinker.
TypeF-CaO
(%)
Density
(g/cm3)
Specific Surface Area (cm3/g)3 Days Intensity (Mpa)7 Days Intensity (Mpa)28 Days Intensity
(Mpa)
Compressive StrengthFlexural StrengthCompressive StrengthFlexural StrengthCompressive StrengthFlexural Strength
Clinker2.793.11455021.33.835.75.756.38.2
Table 3. Performance test results of cement.
TypeStabilityWater Demand/%Initial Setting Time
/Min
Final Setting Time
/Min
Cement made of clinkerqualified24.5105181
Disclaimer/Publisher’s Note: The statements, opinions and data contained in all publications are solely those of the individual author(s) and contributor(s) and not of MDPI and/or the editor(s). MDPI and/or the editor(s) disclaim responsibility for any injury to people or property resulting from any ideas, methods, instructions or products referred to in the content.

