Abstract
Chrysanthemum morifolium Ramat., known as Hangbaiju (HBJ), is a high-value edible, medicinal product where the flowers are infused in hot water and drunk as tea. Its quality and efficacy are closely related to its geographical origin. Consequently, it is vulnerable to fraudulent substitution by other lower-value Chrysanthemum products. In this study, cultivation (variety and different growth stages) and isotopic fractionation between the flower, stem, and leaf were studied. Samples from four different HBJ varieties were characterized using stable isotopes (δ13C, δ15N, δ2H, δ18O, %C, and %N) across three producing regions in Zhejiang province, China. The results showed that there were no significant differences in stable isotopic compositions for different HBJ varieties, but there were significant differences for different plant tissues (flower, stem, leaf, etc.). Furthermore, the stable isotopic composition altered dramatically at different growth stages. The δ15N (r = 0.6809) and δ2H (r = 0.6102) correlations between stems and leaves (SL) and flowers (F) of HBJ were relatively good, the δ13C correlation (r = 0.2636) between SL and F was weak, but δ18O correlation (r = 0.01) had almost no correlation. A supervised multivariate statistical model (partial least squares discriminant analysis, PLS-DA) was used to discriminate three different producing regions with high accuracy (66.7%, 66.7%, and 100%, respectively). Our findings show that stable isotopes combined with multivariate statistical analysis provide an effective method for the geographical identification of HBJ.
1. Introduction
Chrysanthemum morifolium Ramat., a perennial Asteraceae plant, is an edible, medicinal food product that is high in polysaccharides, amino acids, vitamins, and other components [1,2,3,4]. It contains anti-inflammatory, anti-oxidant, and anti-allergy properties, along with the reported ability for liver cleansing, improving eyesight, overcoming fever, and detoxification effects [5,6,7,8]. Commonly known as Hangbaiju (HBJ), it is traditionally grown in Zhejiang Province (a subtropical monsoon climate zone) [9], and it has been listed as a Chinese product of protected geographical indication (PGI). Currently, the HBJ planting area in Zhejiang Province exceeds 3000 ha, and the production yield is about 11,000 t/year [10]. HBJ from Zhejiang Province possesses a unique flavor and quality that commands greater prices than other regions, which makes it prone to market fraud and false labeling. Consequently, there is an urgent need to provide effective assurance methods to authenticate the geographical origin of HBJ.
Stable isotopes reflect the growing environment of plants and have been shown to be an effective means of origin traceability and geographical indication for high-value product protection [11,12,13,14]. Over the past decade, stable isotope analysis has evolved into one of the most important tools to fight food fraud and origin mislabeling in China, including grains [15], vegetables [16], meat [17], aquatic products [18], etc. These past studies reveal that stable isotope values of foods or agricultural products have specific values according to different origins or growing conditions.
Carbon stable isotope values (δ13C) of land plants are closely related to their photosynthesis conditions [19,20,21]. Different photosynthetic pathways (C3, C4, or CAM) cause significant variations in the δ13C values of plants [22,23,24]. Nitrogen is an essential macronutrient for crops, which usually needs to be supplemented by fertilizer application. Fertilizer type has a significant effect on the nitrogen isotopic composition (δ15N) of crops [25,26]. The δ15N values of organic nitrogen sources are higher than that of endogenous soil and chemical fertilizers, so consequently, the δ15N values of crops fertilized with organic fertilizers are higher than crops that receive chemical fertilizers or no fertilizer [27,28]. The hydrogen (δ2H) and oxygen (δ18O) isotopic compositions of agricultural crops depend on local climate conditions and geographical origins, as δ2H and δ18O values generally decrease with increasing latitude and altitude [13,29]. Meanwhile, under the influence of precipitation and irrigation, δ2H and δ18O values of plants also show certain trends related to their geographical origins, especially for δ2H values [30]. The above isotopic studies indicate that δ13C, δ15N, δ2H, and δ18O values can be regarded as suitable markers for the origin authentication of common Chinese agricultural products. Previous isotope studies of garlic [31] and rice [15] samples from different major production regions in China differ substantially. Deng et al. [32] discovered that stable isotope analysis combined with a random forest model could not only discriminate West Lake Longjing green tea from other green tea-producing regions, but also correctly identify green tea from nearby regions. These findings imply that isotope technology may be widely applied to other similar traceability and authentication studies of horticultural products.
Notably, the stable isotopic composition of plants varies according to different growth stages [33], suggesting that δ13C, δ15N, δ2H, and δ18O values could be useful markers to understand the authentication of different commercial types of HBJ products sold into the marketplace. Researchers have routinely used stable isotopes for the origin traceability of other medicinal materials, such as ginseng [34,35], cassiae semen [36], dendrobium officinale [37], and chrysanthemum [38]. However, stable isotope techniques have not yet been applied to PGI HBJ products. In this study, freshly harvested HBJ samples were investigated using stable isotopes combined with multivariate statistics to (1) characterize the stable isotopic composition of different varieties of HBJ samples from a single region; (2) assess isotopic variations of different HBJ plant tissues at different growing stages; and (3) compare the isotopic composition of HBJ flower samples from three different producing regions. The findings of this study lay the foundations for improving the geographical origin traceability of HBJ and other edible PGI medicinal products.
2. Materials and Methods
2.1. Sample Collection and Preparation
Two groups of HBJ samples were collected in Zhejiang Province. Group 1 (cultivar and tissue fractionation study) samples were an assortment of plant tissues from different HBJ varieties collected from HBJ cultivation fields in Wuyi county. Group 2 (origin study) samples comprised only flower samples collected from Wuyi, Tongxiang, and Chun’an counties, as most HBJ products are sold as flowers. A total of 147 origin-guaranteed HBJ samples were collected from both groups.
Group 1 samples consisted of four different varieties of HBJ samples collected from Wuyi, namely Zao Xiaoyangju (Zao), Jinju 2 (Jin2), Shouju 1 (Shou1), and Shouju 2 (Shou2). The sample collection period was from May to September 2018, and included different plant tissues from the ten recognized HBJ plant development stages: seedling, layering, first pinching, second pinching, flower bud stage (stem and leaf only), flower bud, early blooming flower stage (stem and leaf only), early blooming flower (EBF), mid-blooming flower stage (stem and leaf only), and mid-blooming flower (MBF).
Compound fertilizer is typically applied to HBJ plants to improve growth after the second pinching (usually in June to July). Five bunches of HBJ samples were combined at each stage to form a single sample, with three sample replicates taken at each stage for a total of 120 samples from the four varieties. In addition, another 27 HBJ samples (Group 2, only flowers) were collected from Wuyi (119°58′ E, 29°03′ N), Tongxiang (120°39′ E, 30°47′ N), and Chun’an (119°20′ E, 30°02′ N) to determine the isotopic characteristics of HBJ from different producing regions.
The altitude of HBJ planting for these three regions is roughly 200 m, and the soil type is sandy soil. The mean annual temperature for Wuyi, Tongxiang, and Chun’an (17.1, 16.5, and 17.2 °C) and mean annual precipitation (1474, 1247, and 1430 mm) were similar. All sites have subtropical monsoon climates, and the main rainfall period is primarily from March to June, with March being the coldest month and June being the warmest month.
The sampling locality information and HBJ sample types are shown in Figure 1. All samples were collected fresh, then frozen at −20 °C for 24 h, and freeze-dried in a SCIENTZ-10ND/A freeze dryer (SCIENTZ, Ningbo, China) until completely dry and ground into a fine powder using a SCIENTZ-48 grinder (SCIENTZ, Ningbo, China). The powdered HBJ was stored in a desiccator until analysis.
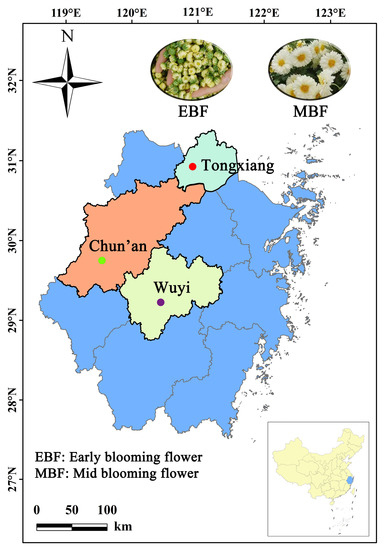
Figure 1.
Hangbaiju sampling sites in Zhejiang Province, China.
2.2. Stable Isotope Analysis
Group 1 HBJ tissues and Group 2 HBJ flowers were analyzed for δ13C, δ15N, δ2H, and δ18O isotopes using an elemental analyzer combined with an isotope ratio mass spectrometer (EA-IRMS). The IRMS primarily achieves stable isotope separation and ratio computation through front-end sample conversion into a gas using a high-temperature combustion furnace. The gas molecules are then ionized in the ion source, and the charged ions are separated by a magnetic field due to their different masses; finally, the intensity of an ion beam of a specific mass is measured by Faraday collection cups [31].
The δ13C and δ15N values and associated elemental content (%C and %N) of HBJ samples were determined using an EA (Isotope Cube, Elementar, Langenselbold, Germany) coupled with an IRMS (BioVision, Elementar, Langenselbold, Germany). Powdered HBJ (5.0 mg of flower, 3.5 mg of stem and leaf) was weighed into tin capsules in duplicate. Samples were combusted at 1150 °C in a combustion tube, and the gases were reduced at 850 °C in a reduction tube with a carrier gas flow (He) of 235 mL min−1 [15]. The resulting sample gases (CO2 and N2) were then separated using a CentrION diluter, and the stable isotope ratios were determined using a mass spectrometer. When CO2 is ionized in the ion source, it forms ion beams of different masses. Three Faraday cups achieved separation of ion beams with mass 44 (12C16O16O), 45 (13C16O16O, 12C17O16O), and 46 (12C18O16O, 12C17O17O, 13C17O16O), then the ratio of 13C to 12C was calculated using the Craig correction formula. Similarly, N2 was ionized to form ion beams with mass 28 (14N14N), 29 (14N15N), and 30 (15N15N, where the contribution is negligible), respectively, thus determining the value of 15N/14N.
Approximately 1.0 mg of dried, finely ground HBJ sample was weighed into silver capsules in triplicate for hydrogen and oxygen isotopes (δ2H and δ18O) and analyzed using a high-temperature EA (PYRO Cube, Elementar, Langenselbold, Germany) coupled with the IRMS (Isoprime 100, Elementar, Cheadle, UK). The H and O isotopes were analyzed at 1450 °C in a pyrolysis tube with a carrier gas flow (He) of 130 mL min−1 [15]. The samples were converted to H2 and CO, then separated using a diluter, and detected using a mass spectrometer. This MS system has two H Faraday cups, so that the ion beam with mass 2 (1H1H) and 3 (1H2H) are separated efficiently and further used to calculate the value of 2H/1H. Three Faraday cups separated the ionized CO into three ion beams of mass 28 (12C16O), 29 (13C16O, 12C17O), and 30 (12C18O, 13C17O), and the ratio of 18O to 16O was determined by the Craig formula.
Multipoint calibration was performed using commercial stable isotope reference standard materials. These included: IAEA-CH-6 (sucrose, δ13C = −10.4‰) and IAEA-N-2 (ammonium sulfate, δ15N = +20.3‰) from the International Atomic Energy Agency (IAEA) (Vienna, Austria); B2155 (protein, δ13C = −27.0‰, δ15N = +5.94‰) from Elemental Microanalysis Ltd. (Devon, UK); USGS64 (glycine, δ13C = −40.8‰, δ15N = +1.8‰), USGS40 (L-glutamic acid, δ13C = −26.4‰, δ15N = −4.5‰), USGS54 (Canadian lodgepole pine, δ2H = −150.4‰, δ18O = +17.8‰), USGS55 (Mexican ziricote, δ2H = −28.2‰, δ18O = +19.1‰), and USGS56 (δ2H = −44.0‰, δ18O = +27.23‰) from Reston Isotope Laboratory (Reston, VA, United States).
The stable isotope ratios of samples were calculated using the following equation [39,40]:
where δiE represents δ13C, δ15N, δ2H, or δ18O; i is the mass number of the heavier isotope; and Rsa and Rstd represent the ratio of the relative abundance of heavy isotope to light isotope in the analytical sample and standard substances, respectively, namely 13C/12C, 15N/14N, 2H/1H, and 18O/16O. The δ value is usually expressed in units “per mil” (‰), so the value calculated in Equation (1) multiplied by 1000 is the final composition of the stable isotope [41]. The tested data were processed by the method of multipoint calibration. Analytical precisions were based on an in-house quality control HBJ sample, ≤±0.1‰ for δ13C, ±0.2‰ for δ15N, ±3‰ for δ2H, ±0.4‰ for δ18O, and ±0.1% for %C and %N.
δiE = (Rsa/Rstd − 1)
2.3. Data Statistics and Analysis
The mean and standard deviation (SD) of each variable (δ13C, δ15N, δ2H, δ18O, %C, and %N) were calculated. Scatter plots, linear regression plots, and a heat map were created using OriginPro 2022b (OriginLab, Northampton, MA, USA). One-way ANOVA and Student’s t-tests were used to examine the significant differences between groups (p < 0.05) to use SPSS 17.0 (IBM, Armonk, NY, USA). SIMCA 14.1 (Umetrics, Umeaa, Sweden) was utilized for multivariate statistical discriminant analysis, which included unsupervised principal component analysis (PCA) and supervised partial least squares discriminant analysis (PLS-DA). The classification performance of the PLS-DA model was evaluated by sensitivity, specificity, and accuracy.
The model’s sensitivity is the ability to correctly classify the HBJ class. It is calculated according to the following [42]:
where TP and FN are true positive and false negative samples, respectively.
Sensitivity = TP/(TP + FN)
The specificity is the capacity of the model to correctly identify the samples that do not belong to the modeled class [42]:
where TN and FP are true negatives and false positives samples, respectively.
Specificity = TN/(TN + FP)
The accuracy is the proportion of correct classification [42]:
Accuracy = (TP + TN)/Total samples
3. Results and Discussion
3.1. Stable Isotopes of Different HBJ Cultivars (Single Location)
EBF and MBF flowers are two of the most common commodity types of HBJ sold in Chinese traditional medicine markets. EBF and MBF samples from four different HBJ varieties (Zao, Shou1, Shou2, and Jin2) from Wuyi county were analyzed for δ13C, δ15N, δ2H, δ18O, %C, and %N values (Table 1). δ15N, δ2H, δ18O, %C, and %N mean values were 3.0‰, −90‰, 24.0‰, 40.0%, and 2.0%, respectively. These five variables (excluding δ13C) revealed no significant differences between the four varieties.

Table 1.
Stable isotope composition and element content of different Hangbaiju varieties from Wuyi county. Data represent the mean of six samples with standard errors. Different letters indicate significant differences at p < 0.05 between different varieties using Tukey’s mean grouping tests.
Conversely, the δ13C values of Zao differed significantly from the other varieties. Specifically, the mean δ13C value of Zao was −28.5‰, while the other three varieties were −27.5‰. The carbon isotopic value of most terrestrial plants is strongly influenced by the photosynthetic pathway (C3, C4, and CAM) but also climatic conditions, which may account for this difference [22,23,24]. The δ13C values of the four HBJ varieties confirm them as C3 plants, as they are all within the typical C3 plant isotopic range (−35‰ to −22‰) [43].
Fertilization has a significant impact on the nitrogen isotopic composition of plants [25,26]. The δ15N values of all HBJ samples were around 3‰, indicating that the compound fertilizer applied during growth is primarily of chemical origin rather than organic fertilizer. In addition, the %N values of all samples were about 2.0%, suggesting that the protein content in all commercially edible HBJ products exceeds 10%.
The hydrogen and oxygen isotopes are connected to climate and altitude effects [13,29]. In this study, δ2H and δ18O variations among different varieties were not significant, owing to the identical planting regions and irrigation practices. Overall, there was no significant isotopic difference between the four HBJ varieties. Accordingly, the isotopic investigation of HBJ samples from different varieties proposed that varietal impact would have no effect on an origin discrimination model.
3.2. Stable Isotopes of EBF and MBF (Single Location)
Given there were no varietal isotopic differences found for Wuyi county HBJ samples, the isotopic differences between EBF and MBF from the four Wuyi cultivars were investigated. The δ13C, δ15N, δ2H, δ18O, %C, and %N values of early (EBF) and mid (MBF) blooming HBJ flower samples from Wuyi county were compared using a paired sample t-test (Table 2). δ13C was the only isotope not to show a significant difference among the two flower types, while other variables had significant differences. Although the carbon isotopic composition of specific plants can be affected by photosynthesis and climate, it is relatively stable in the same geographical location [20]. Differences between EBF and MBF follow established fractionation patterns and may be based on irrigation and plant nutrient uptake. δ15N values are affected by agricultural practices, especially fertilizer use [25]. Furthermore, plant growth also causes the fractionation of nitrogen isotopes [44]. Rainfall has the greatest influence on the isotopic composition of hydrogen and oxygen [30]. Moreover, δ18O values are also affected by plant transpiration and respiration [45]. As a result, variations in precipitation during different growth stages can cause changes in δ2H and δ18O values of plant tissues. According to the above findings, it is necessary to compare the two early and mid-blooming flowers with HBJ plant tissue sampled at different growth stages to better understand fractionation and isotopic transfer and improve origin authentication.
Table 2.
Stable isotopic composition and element content of Hangbaiju early blooming flower (EBF) or mid-blooming flower (MBF) from Wuyi county. Data represent the mean of 12 samples with standard errors. The tcalc and tcriti values represent the calculated and critical t-value of each variable, respectively. The tcriti value (0.05, 0.05, 12) = 2.179, when |tcalc| > tcriti, indicating the stable isotopic composition of these two flower types is significantly different.
3.3. Stable Isotope Variations between Ten Different HBJ Growth Stages (Single Location)
HBJ goes through a lengthy process of growth and development from seedling to early blooming flower (EBF) and mid-blooming flower (MBF). Its isotopic composition (δ13C, δ15N, δ2H, and δ18O) and element content (%C and %N) may also alter to a certain extent during this process [33]. The Jin2 variety was used to investigate the impact of the growing environment on the above variables, and the results are reported in Figure 2. The entire growth procedure was separated into 10 stages or periods, which included seedling, layering, first pinching, second pinching, the flower bud stage (stem and leaf, flower bud), the EBF stage (stem and leaf, flower), and the MBF stage (stem and leaf, flower). Furthermore, aside from the influence of growth stage and environmental conditions, agricultural processes, such as fertilizer application, were also found to have an impact on the isotopic composition and element content of HBJ plants. The pink dashed line in Figure 2 separates the 10 stages or growth periods into two groups (between stages 4 and 5) based on the fertilization status of the crop (namely, fertilizer was administered after the second pinching).
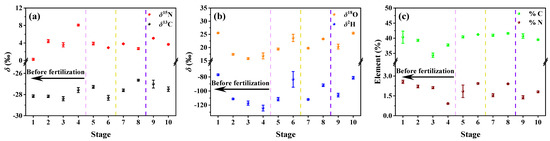
Figure 2.
Variation characteristics of (a) δ13C and δ15N, (b) δ2H and δ18O, and (c) %C and %N in Jin2 Hangbaiju samples at different growth stages. The stages 1 to 10 represent (1) seedling, (2) layering, (3) first pinching, (4) second pinching, (5) flower bud stage (stem and leaf only), (6) flower bud, (7) early blooming flower stage (stem and leaf only), (8) early blooming flower, (9) mid-blooming flower stage (stem and leaf only), and (10) mid-blooming flower. Data from each stage represent the mean of three samples with standard errors. Fertilization occurs between Stages 4 and 5 (before pink dotted line). Stages 5 to 6 represents the flower bud stage (between pink to yellow dotted lines), Stages 7 to 8 represents the early blooming flower stage (between yellow to blue dotted lines), and Stages 9 to 10 represents the mid-blooming flower stage (after blue dotted line).
Prior to fertilization, the δ15N values increase with growing time as the plant removes nutrients from the soil and fractionates nutrient 15N towards higher ratios. This is supported by decreasing %N values in the plant as the nutrient sources are absorbed and used for physiological processes during early growth. After stage 4, the application of compound fertilizer occurs, and the δ15N values stay more or less stable during the main flowering period (Figure 2a). After fertilization, the δ15N values of stems and leaves were greater than flowers, indicating that fractionation occurred as the lighter isotopes were transferred to the flowers, and the heavier isotopes were retained in the leaves and stems. This also follows the law of nitrogen synthesis and usage in plants, which states that nitrogen is acquired from the roots and fractionates between the stem, leaf, and flower [46].
The different HBJ plant tissue δ13C values from different stages tend to be more affected by light conditions [19], and only vary slightly before and after fertilization (Figure 2a). The fractionation trends for δ2H and δ18O were similar to each other in that their stable isotopic composition was greatest before fertilization, and the heavy isotope was generally enriched in seedlings (Figure 2b). Although the hydrogen and oxygen isotopic compositions of stems and leaves became more positive after fertilization, the δ2H and δ18O values of subsequent stages did not change significantly, and the isotopic compositions of flowers tended towards more positive values.
The %C was lowest in the first pinching stem samples, increased during the second pinching, and then stayed constant (Figure 2c). After the second pinching, the %N decreased to the lowest level, but increased again after fertilization (addition of nitrogen nutrients), and the %N in flowers was higher than in stems and leaves (Figure 2c). The stable isotope trends and variations of the other three HBJ varieties (Zao, Shou1, and Shou2) were similar to those of Jin2 in each period, and the corresponding results are shown in Figures S1 to S3. Nitrogen isotopes typically reflect the planting and fertilization methods of plants (farming conditions such as conventional, green, and organic), while carbon, hydrogen, and oxygen isotopes are related to geographical origin and climate conditions [16]. As the study is undertaken in the same region with similar climatic conditions and fertilization methods, the stable isotopic compositions of the four different HBJ varieties follow similar patterns.
3.4. Stable Isotopes of HBJ Stem/Leaf and Flower (Single Location)
The δ13C, δ15N, δ2H, and δ18O values of stem and leaf (SL) and flower (F) samples after fertilization (a total of 72 samples from four varieties) were compared to further explore the relationship between the isotopic composition of different HBJ tissues (Figure 3). There was a significant correlation (p < 0.01) between δ15N and δ2H in SL and F, with correlation coefficients (r) of 0.6809 (Figure 3b) and 0.6102 (Figure 3c). On the other hand, the correlation of δ13C is not significant (p > 0.05), with an r value of only 0.2636 (Figure 3a). However, there was almost no correlation between the two tissues in terms of δ18O (r = 0.01, p > 0.05) (Figure 3d). Plant carbon is mostly acquired through photosynthesis in the leaves [47], which is subsequently transferred to other tissues. Meanwhile, plant respiration emits some carbon dioxide, and the intensity of leaf respiration is quite high, resulting in a weaker δ13C correlation between SL and F. Nitrogen and hydrogen are predominantly obtained from nutrients and water absorption from the soil [30,48], respectively, and are subsequently transported through the stem to the leaves and flowers, resulting in a higher δ15N and δ2H correlations between SL and F. Water absorption and respiration are the primary sources of oxygen [30,45]. Furthermore, throughout the photosynthetic process, the leaves release oxygen, resulting in lower oxygen levels in the leaves than in flowers.
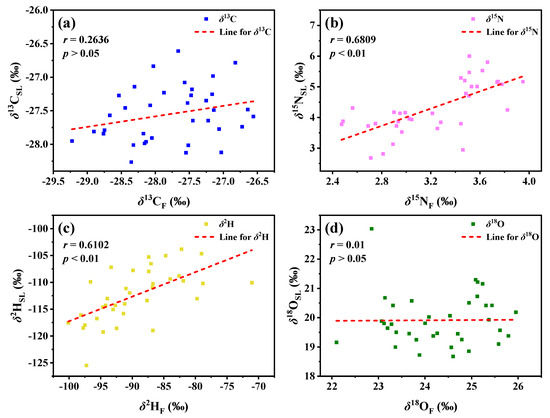
Figure 3.
Scatter plot correlation between (a) δ13C, (b) δ15N, (c) δ2H, and (d) δ18O of Hangbaiju stem and leaf (SL) and flower (F).
Pearson’s correlation was used to analyze each isotope variable for SL and F after fertilization (Figure 4). The correlation between δ15N in flowers and other isotopes was strong, as was the correlation between δ2H and δ18O in flowers and δ13C and δ15N in stems. Similarly, the correlation between δ2H and other isotopes in SL was also high. Since photosynthesis is related to the soil–root water use efficiency of plants, and the δ2H and δ18O values in leaves are derived from water absorption, there was also a certain correlation with δ13C values [49]. The isotope correlation of various tissues is important to understand the elemental metabolism in various plant tissues, such as nitrogen absorption, distribution, and fractionation. Most nitrogen in plants is absorbed from the soil and then transported to various tissues after absorption. δ15N values showed multiple correlations in this study, supporting the metabolic process of transporting nitrogen into cells of multiple plant tissues [48].
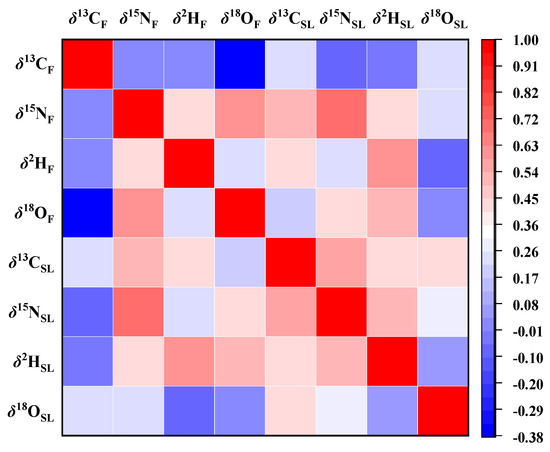
Figure 4.
Pearson’s correlation heat map of isotopes from Hangbaiju stem and leaf (SL) and flower (F). Variables from left to right or top to bottom are δ13C, δ15N, δ2H, and δ18O of F and SL, respectively.
3.5. Geographical Authentication of HBJ Samples from Three Different Producing Regions
A final study was undertaken to examine HBJ flower samples (MBF only) that are sold as traditional medicine. Initial results showed that there was little to no isotopic difference for different varieties of HBJ, so all MBF samples from three regions were examined for their geographical characteristics. A total of 27 MBF samples were collected from Wuyi (WY, n = 9), Tongxiang (TX, n = 9), and Chun’an (CA, n = 9) in Zhejiang Province and analyzed using four stable isotopes: δ13C, δ15N, δ2H, and δ18O (Table 3). The results indicated that HBJ flowers showed different isotopic trends according to geographical location.
Table 3.
Stable isotope values of MBF Hangbaiju samples from different regions. Data represent the mean of nine samples with standard errors, and different letters indicate significant differences at p < 0.05 between different varieties using Tukey’s mean grouping tests.
As previously mentioned, δ15N is closely related to farming practices and fertilization type [28]. The average MBF HBJ δ15N values from Wuyi, Tongxiang, and Chun’an were 1.8‰, 3.6‰, and 0.9‰, respectively, with a significant difference between origins. The use of compound fertilizers can lead to lower δ15N values, while higher δ15N values (>6‰) usually indicate the use of organic fertilizers [50,51,52], and unfertilized (natural background) soil δ15N values are generally around 4‰ to 6‰ [53]. We speculate there may be several different compound fertilizer sources used across the different regions due to lower mean δ15N values and the range of δ15N values across the three regions. The mean δ15N value of Chun’an HBJ was close to 0‰, which indicates that a higher proportion of chemical fertilizer may have been used in the fertilization process.
HBJ is a C3 plant, and the δ13C values of MBF from the three regions ranged from −29.0‰ to −27.8‰, which is consistent with the literature C3 plant distribution range (−35‰ to −22‰) [43]. Mean δ2H and δ18O values of Wuyi and Tongxiang HBJ were around −70‰ and 22‰, respectively, while those from Chun’an were around −60‰ and 25‰, respectively. Carbon, hydrogen, and oxygen isotopes are influenced by a combination of local geography (latitude and altitude), climate (rainfall), light, and water source characteristics [54,55,56,57,58]. There was no significant difference in δ13C, δ2H, and δ18O values between Wuyi and Tongxiang HBJ, probably because they have similar latitudes and altitudes. δ13C, δ2H, and δ18O values in Chun’an were significantly more positive than the other two regions, which may be related to higher sunshine duration, different water sources and climate characteristics, or other complex environmental factors.
Tukey’s mean grouping suggested MBF HBJ samples grown in Wuyi, Tongxiang, and Chunan can be effectively distinguished from each other (Table 3). On this basis, an HBJ origin discrimination model was constructed using multivariate statistical analysis. Firstly, unsupervised principal component analysis (PCA) was used to process the four isotope variables to further observe the differences across regions and obtain eigenvalues and variance contribution rates of each component (Table S1). Meanwhile, the principal component scores were plotted, which presents the preliminary classification results for MBF HBJ samples from different regions (Figure 5). Previous PCA studies have revealed that the first two or three components indicate the main influencing factors [59,60]. In this study, two principal components were extracted using a cumulative contribution rate > 85% as the extraction criterion [61]. The contribution rate of the first two principal components (PC1 and PC2) explained 69.9% and 18.9% of the total variance, respectively, and the cumulative contribution rate reached 88.8% (Table S1). In general, the PCA results revealed that MBF HBJ samples from Chun’an could be completely separated from the other two regions. However, the MBF HBJ samples from Wuyi and Tongxiang overlapped, making it harder to completely distinguish these origins. Thus, a PLS-DA model with a supervised algorithm was applied to improve the origin discrimination analysis [53].
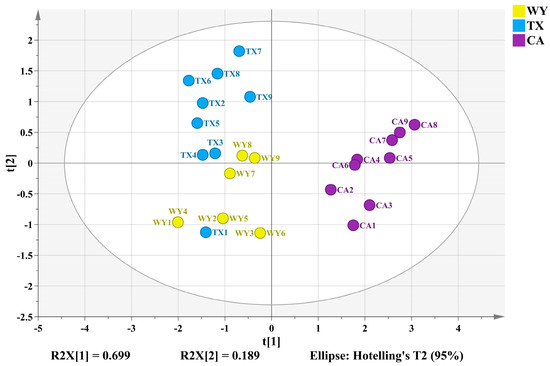
Figure 5.
Stable isotope scatter plot of MBF Hangbaiju samples from different regions using principal component analysis. WY, TX, and CA represent Wuyi, Tongxiang, and Chun’an, respectively.
The loadings plot (Figure 6a) showed that Chun’an MBF HBJ samples were primarily distinguished by their δ13C, δ2H, and δ18O values, which may be related to photosynthesis and rainfall [20,30]. Moreover, Tongxiang samples were strongly influenced by δ15N, most likely due to the application and accumulation of nitrogenous fertilizers [44], suggesting that δ15N might be a suitable variable for tracing the origin of MBF HBJ from Tongxiang. The variable importance of projection (VIP, a measure of a variable’s importance in the PLS-DA model) was >1 for δ2H values and close to 1 for δ13C, δ18O, and δ15N values (Figure 6b), suggesting that they are all important variables to construct the PLS-DA model.
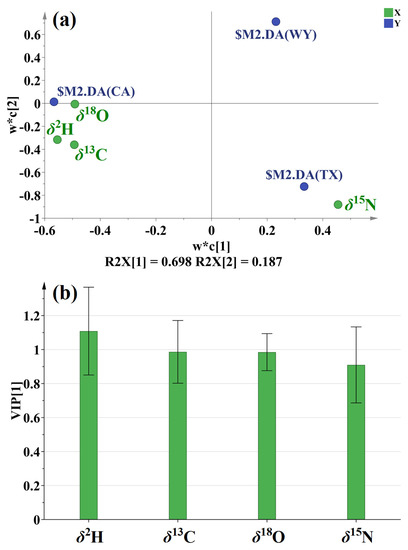
Figure 6.
(a) Loadings and (b) VIP plots of PLS-DA models based on C, N, H, and O isotopes of MBF Hangbaiju samples from different regions. VIP represents the variable importance of projection, where VIP values > 1 have significant importance to the model.
Geographical variables for Wuyi, Tongxiang, and Chun’an were used to discriminate HBJ origin. To build the classification model, the data set was divided into training and test sets. The training set is used to build classification rules, and the test set is used to validate the model (external validation). A total of 21 samples (seven samples from each region) were randomly selected to form the training set, and the remaining 6 samples formed the test set. The performance and prediction ability of the model were evaluated by leave-one-out cross-validation. The results obtained for the training and test set are summarized in Table 4. The cross-validation gives sensitivity and specificity to the training set in the ranges between 85.7% and 100%, showing the high performance and prediction ability of the classification model. However, the sensitivity and specificity ranged between 50% and 100% for the test set. The lower value was due to a lower number of samples in the test set and will be addressed in future research. Nevertheless, the model had a high accuracy (discriminsation rate of 100%) for the calibration set (Table 4). Furthermore, the discrimination rates (accuracy) for the test set were still 66.7%, 66.7%, and 100%, respectively. In summary, the use of a supervised model improved the origin discrimination accuracy of HBJ samples. These results confirm that stable isotopes play an important role in the origin traceability of HBJ samples, which is similar to some previous findings for other agricultural products [31,36,37].
Table 4.
PLS-DA model of Hangbaiju from different regions. The 1, 2, and 3 represent Wuyi, Tongxiang, and Chun’an, respectively.
4. Conclusions
Stable isotopes (δ13C, δ15N, δ2H, and δ18O) and elemental analysis (%C and %N) were used to characterize four varieties of HBJ from three regions (Wuyi, Tongxiang, and Chun’an) of Zhejiang province, China. Isotopic differences of HBJ flower samples from different cultivar varieties from a single region were not significant due to similar cultivar physiological responses to their growing conditions. In contrast, HBJ samples from various growth stages were shown to be significantly different, owing to the fact that the isotopic composition of different growth stages is strongly impacted by fertilizer application, irrigation water sources, climatic fluctuations, and other environmental and physiological factors. A supervised PLS-DA model was built using multi-isotopes to identify HBJ samples from three producing regions in Zhejiang and had a relatively higher accuracy (66.7%, 66.7%, and 100%, respectively). Overall, multi-isotope analysis of HBJ samples provides a viable approach for enhancing the identification and origin traceability of this edible PGI product, and will provide new applications to protect consumers and prevent fraud.
Supplementary Materials
The following supporting information can be downloaded at: https://www.mdpi.com/article/10.3390/separations10050287/s1, Figure S1: Variation characteristics of (a) δ13C and δ15N, (b) δ2H and δ18O, (c) %C and %N in Zao Hangbaiju samples at different growth stages. The stages 1 to 10 represent (1) seedling, (2) layering, (3) first pinching, (4) second pinching, (5) flower bud stage (stem and leaf only), (6) flower bud, (7) early blooming flower stage (stem and leaf only), (8) early blooming flower (9) mid blooming flower stage (stem and leaf only) and (10) mid blooming flower. Data from each stage represent the mean of three samples with standard errors. Fertilization occurs between Stages 4 and 5 (before pink dotted line). Stages 5 to 6 represents the flower bud stage (between pink to yellow dotted lines), Stages 7 to 8 represents the early blooming flower stage (between yellow to blue dotted lines), and Stages 9 to 10 represents the mid-blooming flower stage (after blue dotted line); Figure S2: Variation characteristics of (a) δ13C and δ15N, (b) δ2H and δ18O, (c) %C and %N in Shou1 Hangbaiju samples at different growth stages. The stages 1 to 10 represent (1) seedling, (2) layering, (3) first pinching, (4) second pinching, (5) flower bud stage (stem and leaf only), (6) flower bud, (7) early blooming flower stage (stem and leaf only), (8) early blooming flower (9) mid blooming flower stage (stem and leaf only) and (10) mid blooming flower. Data from each stage represent the mean of three samples with standard errors. Fertilization occurs between Stages 4 and 5 (before pink dotted line). Stages 5 to 6 represents the flower bud stage (between pink to yellow dotted lines), Stages 7 to 8 represents the early blooming flower stage (between yellow to blue dotted lines), and Stages 9 to 10 represents the mid-blooming flower stage (after blue dotted line); Figure S3: Variation characteristics of (a) δ13C and δ15N, (b) δ2H and δ18O, (c) %C and %N in Shou2 Hangbaiju samples at different growth stages. The stages 1 to 10 represent (1) seedling, (2) layering, (3) first pinching, (4) second pinching, (5) flower bud stage (stem and leaf only), (6) flower bud, (7) early blooming flower stage (stem and leaf only), (8) early blooming flower (9) mid blooming flower stage (stem and leaf only) and (10) mid blooming flower. Data from each stage represent the mean of three samples with standard errors. Fertilization occurs between Stages 4 and 5 (before pink dotted line). Stages 5 to 6 represents the flower bud stage (between pink to yellow dotted lines), Stages 7 to 8 represents the early blooming flower stage (between yellow to blue dotted lines), and Stages 9 to 10 represents the mid-blooming flower stage (after blue dotted line); Table S1: Principal component eigenvalues and variance contribution rates of four indexes of different regions of Hangbaiju.
Author Contributions
Conceptualization, H.M.; methodology, J.N., C.L., S.S. (Shanshan Shao), and Y.Y.; software, C.L.; validation, Y.Z.; formal analysis, H.M., S.S. (Shengzhi Shao); investigation, J.N., S.W., Y.Z., C.L., and S.S. (Shanshan Shao); resources, J.N., S.W., and S.S. (Shanshan Shao); data curation, S.S. (Shengzhi Shao); writing—original draft preparation, H.M., J.N. and S.W.; writing—review and editing, K.M.R., and Y.Y.; visualization, H.M.; supervision, K.M.R., and Y.Y.; funding acquisition, Y.Y. All authors have read and agreed to the published version of the manuscript.
Funding
This work was supported by funding from central government key projects: the Special Fund of Discipline Construction for Traceability of Agricultural Product (2021-ZAAS) and the Zhejiang Key Agricultural Enterprise Institute Project (No. 2017Y20001).
Data Availability Statement
Not applicable.
Acknowledgments
Not applicable.
Conflicts of Interest
The authors declare no conflict of interest.
References
- Lu, C.; Li, Y.; Wang, J.; Qu, J.; Chen, Y.; Chen, X.; Huang, H.; Dai, S. Flower color classification and correlation between color space values with pigments in potted multiflora chrysanthemum. Sci. Hortic. 2021, 283, 110082. [Google Scholar] [CrossRef]
- Wang, T.; Guo, Q.-S.; Mao, P.-F. Flavonoid accumulation during florescence in three Chrysanthemum morifolium Ramat cv. ‘Hangju’ genotypes. Biochem. Syst. Ecol. 2014, 55, 79–83. [Google Scholar] [CrossRef]
- Yu, Q.; Chen, W.; Zhong, J.; Qing, D.; Yan, C. Structural elucidation of three novel oligosaccharides from Kunlun Chrysanthemum flower tea and their bioactivities. Food Chem. Toxicol. 2021, 149, 112032. [Google Scholar] [CrossRef] [PubMed]
- Yuan, H.; Jiang, S.; Liu, Y.; Daniyal, M.; Jian, Y.; Peng, C.; Shen, J.; Liu, S.; Wang, W. The flower head of Chrysanthemum morifolium Ramat. (Juhua): A paradigm of flowers serving as Chinese dietary herbal medicine. J. Ethnopharmacol. 2020, 261, 113043. [Google Scholar] [CrossRef] [PubMed]
- Lee, D.Y.; Choi, G.; Yoon, T.; Cheon, M.S.; Choo, B.K.; Kim, H.K. Anti-inflammatory activity of Chrysanthemum indicum extract in acute and chronic cutaneous inflammation. J. Ethnopharmacol. 2009, 123, 149–154. [Google Scholar] [CrossRef]
- Lii, C.-K.; Lei, Y.-P.; Yao, H.-T.; Hsieh, Y.-S.; Tsai, C.-W.; Liu, K.-L.; Chen, H.-W. Chrysanthemum morifolium Ramat. reduces the oxidized LDL-induced expression of intercellular adhesion molecule-1 and E-selectin in human umbilical vein endothelial cells. J. Ethnopharmacol. 2010, 128, 213–220. [Google Scholar] [CrossRef]
- Rusu, M.A.; Tamas, M.; Puica, C.; Roman, I.; Sabadas, M. The hepatoprotective action of ten herbal extracts in CCl4 intoxicated liver. Phytother. Res. 2005, 19, 744–749. [Google Scholar] [CrossRef]
- Ukiya, M.; Akihisa, T.; Tokuda, H.; Suzuki, H.; Mukainaka, T.; Ichiishi, E.; Nishino, H. Constituents of compositae plants III. antitumor promoting effects and cytotoxic activity against human cancer cell lines of triterpenediols and triols from edible chrysanthemum flowers. Cancer Lett. 2002, 177, 7–12. [Google Scholar] [CrossRef]
- Zhang, L. The Trace and Authentication Technologies on Plant Derived Agricultural Products. Doctor’s Thesis, Zhejiang University, Hangzhou, China, 2012. [Google Scholar]
- Yan, K.R. Virus Identification and Analysis of Yield and Quality of Virus-Free Plantlets at Different Generations on Chrysanthemun Morifolium. Master’s Thesis, Zhejiang University, Hangzhou, China, 2021. [Google Scholar]
- Calvi, M.; Bontempo, L.; Pizzini, S.; Cucinotta, L.; Camin, F.; Stenni, B. Isotopic Characterization of Italian Industrial Hemp (Cannabis sativa L.) Intended for Food Use: A First Exploratory Study. Separations 2022, 9, 136. [Google Scholar] [CrossRef]
- Camin, F.; Boner, M.; Bontempo, L.; Fauhl-Hassek, C.; Kelly, S.D.; Riedl, J.; Rossmann, A. Stable isotope techniques for verifying the declared geographical origin of food in legal cases. Trends Food Sci. Technol. 2017, 61, 176–187. [Google Scholar]
- Kelly, S.; Heaton, K.; Hoogewerff, J. Tracing the geographical origin of food: The application of multi-element and multi-isotope analysis. Trends Food Sci. Technol. 2005, 16, 555–567. [Google Scholar] [CrossRef]
- Versari, A.; Laurie, V.F.; Ricci, A.; Laghi, L.; Parpinello, G.P. Progress in authentication, typification and traceability of grapes and wines by chemometric approaches. Food Res. Int. 2014, 60, 2–18. [Google Scholar] [CrossRef]
- Li, C.; Nie, J.; Zhang, Y.; Shao, S.; Liu, Z.; Rogers, K.M.; Zhang, W.; Yuan, Y. Geographical origin modeling of Chinese rice using stable isotopes and trace elements. Food Control. 2022, 138, 108997. [Google Scholar] [CrossRef]
- Liu, X.; Liu, Z.; Qian, Q.; Song, W.; Rogers, K.M.; Rao, Q.; Wang, S.; Zhang, Q.; Shao, S.; Tian, M.; et al. Isotope chemometrics determines farming methods and geographical origin of vegetables from Yangtze River Delta Region, China. Food Chem. 2021, 342, 128379. [Google Scholar] [CrossRef]
- Nie, J.; Shao, S.; Xia, W.; Liu, Z.; Yu, C.; Li, R.; Wang, W.; Li, J.; Yuan, Y.; Rogers, K.M. Stable isotopes verify geographical origin of yak meat from Qinghai-Tibet plateau. Meat Sci. 2020, 165, 108113. [Google Scholar] [CrossRef]
- Liu, Z.; Yuan, Y.; Zhao, Y.; Zhang, Y.; Nie, J.; Shao, S.; Rogers, K.M. Differentiating wild, lake-farmed and pond-farmed carp using stable isotope and multi-element analysis of fish scales with chemometrics. Food Chem. 2020, 328, 127115. [Google Scholar] [CrossRef]
- Cornwell, W.K.; Wright, I.J.; Turner, J.; Maire, V.; Barbour, M.M.; Cernusak, L.A.; Dawson, T.; Ellsworth, D.; Farquhar, G.D.; Griffiths, H.; et al. Climate and soils together regulate photosynthetic carbon isotope discrimination within C3 plants worldwide. Global Ecol. Biogeogr. 2018, 27, 1056–1067. [Google Scholar] [CrossRef]
- Flanagan, L.B.; Cai, T.; Black, T.A.; Barr, A.G.; McCaughey, J.H.; Margolis, H.A. Measuring and modeling ecosystem photosynthesis and the carbon isotope composition of ecosystem-respired CO2 in three boreal coniferous forests. Agric. For. Meteorol. 2012, 153, 165–176. [Google Scholar] [CrossRef]
- Scher, M.A.; Barclay, R.S.; Baczynski, A.A.; Smith, B.A.; Sappington, J.; Bennett, L.A.; Chakraborty, S.; Wilson, J.P.; Megonigal, J.P.; Wing, S.L. The effect of CO2 concentration on carbon isotope discrimination during photosynthesis in Ginkgo biloba: Implications for reconstructing atmospheric CO2 levels in the geologic past. Geochim. Cosmochim. Acta 2022, 337, 82–94. [Google Scholar] [CrossRef]
- Badeck, F.W.; Tcherkez, G.; Nogues, S.; Piel, C.; Ghashghaie, J. Post-photosynthetic fractionation of stable carbon isotopes between plant organs--a widespread phenomenon. Rapid Commun. Mass Spectrom. 2005, 19, 1381–1391. [Google Scholar] [CrossRef]
- Meng, J.; Liu, Z.; Gou, C.-L.; Rogers, K.M.; Yu, W.-J.; Zhang, S.-S.; Yuan, Y.-W.; Zhang, L. Geographical origin of Chinese wolfberry (goji) determined by carbon isotope analysis of specific volatile compounds. J. Chromatogr. B 2019, 1105, 104–112. [Google Scholar] [CrossRef] [PubMed]
- van Leeuwen, K.A.; Prenzler, P.D.; Ryan, D.; Camin, F. Gas Chromatography-Combustion-Isotope Ratio Mass Spectrometry for Traceability and Authenticity in Foods and Beverages. Compr. Rev. Food Sci. Food Saf. 2014, 13, 814–837. [Google Scholar] [CrossRef]
- Szpak, P.; Millaire, J.-F.; White, C.D.; Longstaffe, F.J. Influence of seabird guano and camelid dung fertilization on the nitrogen isotopic composition of field-grown maize (Zea mays). J. Archaeol. Sci. 2012, 39, 3721–3740. [Google Scholar] [CrossRef]
- Szpak, P.; Longstaffe, F.J.; Millaire, J.-F.; White, C.D. Large variation in nitrogen isotopic composition of a fertilized legume. J. Archaeol. Sci. 2014, 45, 72–79. [Google Scholar] [CrossRef]
- Yuan, Y.; Zhao, M.; Zhang, Z.; Chen, T.; Yang, G.; Wang, Q. Effect of different fertilizers on nitrogen isotope composition and nitrate content of Brassica campestris. J. Agric. Food Chem. 2012, 60, 1456–1460. [Google Scholar] [CrossRef]
- Zhou, W.; Hu, C.-S.; Li, J.; Christie, P.; He, X.-H.; Ju, X.-T. Natural 15N Abundance in Winter Wheat Amended with Urea and Compost: A Long-Term Experiment. Pedosphere 2013, 23, 835–843. [Google Scholar] [CrossRef]
- Dansgaard, W. Stable isotopes in precipitation. Tellus 1964, 16, 436–468. [Google Scholar] [CrossRef]
- Stewart, M.K. Stable isotope fractionation due to the evaporation and isotopic exchange of falling water drops: Applications to atmospheric processes and evaporation of lakes. J. Geophys. Res. 1975, 80, 1133–1146. [Google Scholar] [CrossRef]
- Nie, J.; Weng, R.; Li, C.; Liu, X.; Wang, F.; Rogers, K.M.; Yuan, Y. Chemometric origin classification of Chinese garlic using sulfur-containing compounds, assisted by stable isotopes and bioelements. Food Chem. 2022, 394, 133557. [Google Scholar] [CrossRef]
- Deng, X.; Liu, Z.; Zhan, Y.; Ni, K.; Zhang, Y.; Ma, W.; Shao, S.; Lv, X.; Yuan, Y.; Rogers, K.M. Predictive geographical authentication of green tea with protected designation of origin using a random forest model. Food Control. 2020, 107, 106807. [Google Scholar] [CrossRef]
- Xia, W.; Li, Z.; Yu, C.; Liu, Z.; Nie, J.; Li, C.; Shao, S.; Zhang, Y.; Rogers, K.M.; Yuan, Y. Understanding processing, maturity and harvest period effects to authenticate early-spring Longjing tea using stable isotopes and chemometric analyses. Food Control. 2021, 124, 107907. [Google Scholar] [CrossRef]
- Horacek, M.; Min, J.S.; Heo, S.C.; Soja, G. Discrimination between ginseng from Korea and China by light stable isotope analysis. Anal. Chim. Acta 2010, 682, 77–81. [Google Scholar] [CrossRef]
- Wang, J.; Zhang, T.; Ge, Y. C/N/H/O stable isotope analysis for determining the geographical origin of American ginseng (Panax quinquefolius). J. Food Compos. Anal. 2021, 96, 103756. [Google Scholar] [CrossRef]
- Wang, Y.; Kang, L.; Zhao, Y.; Xiong, F.; Yuan, Y.; Nie, J.; Huang, L.; Yang, J. Stable isotope and multi-element profiling of Cassiae Semen tea combined with chemometrics for geographical discrimination. J. Food Compos. Anal. 2022, 107, 104359. [Google Scholar] [CrossRef]
- Xiong, F.; Yuan, Y.; Li, C.; Lyu, C.; Wan, X.; Nie, J.; Li, H.; Yang, J.; Guo, L. Stable isotopic and elemental characteristics with chemometrics for the geographical origin authentication of Dendrobium officinale at two spatial scales. LWT 2022, 167, 113871. [Google Scholar] [CrossRef]
- Lim, S.-S.; Choi, W.-J.; Kwak, J.-H.; Jung, J.-W.; Chang, S.X.; Kim, H.-Y.; Yoon, K.-S.; Choi, S.-M. Nitrogen and carbon isotope responses of Chinese cabbage and chrysanthemum to the application of liquid pig manure. Plant Soil 2007, 295, 67–77. [Google Scholar] [CrossRef]
- Coplen, T.B. Guidelines and recommended terms for expression of stable-isotope-ratio and gas-ratio measurement results. Rapid Commun. Mass Spectrom. 2011, 25, 2538–2560. [Google Scholar] [CrossRef]
- Coplen, T.B.; Shrestha, Y. Isotope-abundance variations and atomic weights of selected elements_ 2016 (IUPAC Technical Report). Pure Appl. Chem. 2016, 88, 1203–1224. [Google Scholar] [CrossRef]
- Brand, W.A.; Coplen, T.B.; Vogl, J.; Rosner, M.; Prohaska, T. Assessment of international reference materials for isotope-ratio analysis (IUPAC Technical Report). Pure Appl. Chem. 2014, 86, 425–467. [Google Scholar] [CrossRef]
- Campos, N.S.; Oliveira, K.S.; Almeida, M.R.; Stephani, R.; de Oliveira, L.F. Classification of frankfurters by FT-Raman spectroscopy and chemometric methods. Molecules 2014, 19, 18980–18992. [Google Scholar] [CrossRef]
- Cerling, T.E.; Barnette, J.E.; Bowen, G.J.; Chesson, L.A.; Ehleringer, J.R.; Remien, C.H.; Shea, P.; Tipple, B.J.; West, J.B. Forensic Stable Isotope Biogeochemistry. Annu. Rev. Earth Planet. Sci. 2016, 44, 175–206. [Google Scholar] [CrossRef]
- Yoneyama, T.; Ito, O.; Engelaar, W.M.H.G. Uptake, metabolism and distribution of nitrogen in crop plants traced by enriched and natural 15N_ Progress over the last 30 years. Phytochem. Rev. 2003, 2, 121–132. [Google Scholar] [CrossRef]
- Lane, G.A.; Dole, M. Fractionation of oxygen isotopes during respiration. Science 1956, 175, 574–576. [Google Scholar] [CrossRef] [PubMed]
- Evans, R.D. Physiological mechanisms influencing plant nitrogen isotope composition. Trends Plant Sci. 2001, 6, 121–126. [Google Scholar] [CrossRef] [PubMed]
- Hartmann, H.; Bahn, M.; Carbone, M.; Richardson, A.D. Plant carbon allocation in a changing world—challenges and progress: Introduction to a Virtual Issue on carbon allocation: Introduction to a virtual issue on carbon allocation. New Phytol. 2020, 227, 981–988. [Google Scholar] [CrossRef]
- Hashim MMa Yusop, M.K.; Othman, R.; Wahid, S.A. Characterization of Nitrogen Uptake Pattern in Malaysian Rice MR219 at Different Growth Stages Using 15N Isotope. Rice Sci. 2015, 22, 250–254. [Google Scholar] [CrossRef]
- Broeckx, L.S.; Fichot, R.; Verlinden, M.S.; Ceulemans, R. Seasonal variations in photosynthesis, intrinsic water-use efficiency and stable isotope composition of poplar leaves in a short-rotation plantation. Tree Physiol. 2014, 34, 701–715. [Google Scholar] [CrossRef]
- Kelly, S.D.; Bateman, A.S. Comparison of mineral concentrations in commercially grown organic and conventional crops—Tomatoes (Lycopersicon esculentum) and lettuces (Lactuca sativa). Food Chem. 2010, 119, 738–745. [Google Scholar] [CrossRef]
- Li, C.; Wang, Q.; Shao, S.; Chen, Z.; Nie, J.; Liu, Z.; Rogers, K.M.; Yuan, Y. Stable Isotope Effects of Biogas Slurry Applied as an Organic Fertilizer to Rice, Straw, and Soil. J. Agric. Food Chem. 2021, 69, 8090–8097. [Google Scholar] [CrossRef]
- Nie, J.; Shao, S.; Zhang, Y.; Li, C.; Liu, Z.; Rogers, K.M.; Wu, M.-C.; Lee, C.-P.; Yuan, Y. Discriminating protected geographical indication Chinese Jinxiang garlic from other origins using stable isotopes and chemometrics. J. Food Compos. Anal. 2021, 99, 103856. [Google Scholar] [CrossRef]
- Rogers, K.M.; Martin, A.P.; Pradel, G.; Yuan, Y.; Zhang, Y.; Turnbull, R.E. Elemental and isotopic compositions of New Zealand regional soils identifies human and climate-induced effects. Appl. Geochem. 2022, 143, 105356. [Google Scholar] [CrossRef]
- Camin, F.; Dordevic, N.; Wehrens, R.; Neteler, M.; Delucchi, L.; Postma, G.; Buydens, L. Climatic and geographical dependence of the H, C and O stable isotope ratios of Italian wine. Anal. Chim. Acta 2015, 853, 384–390. [Google Scholar] [CrossRef]
- Ghosh, P.; Brand, W.A. Stable isotope ratio mass spectrometry in global climate change research. Int. J. Mass Spectrom. 2003, 228, 1–33. [Google Scholar] [CrossRef]
- Kelly, S.; Baxter, M.; Chapman, S.; Rhodes, C.; Dennis, J.; Brereton, P. The application of isotopic and elemental analysis to determine the geographical origin of premium long grain rice. Eur. Food Res. Technol. 2014, 214, 72–78. [Google Scholar] [CrossRef]
- Sanchez-Bragado, R.; Serret, M.D.; Marimon, R.M.; Bort, J.; Araus, J.L. The Hydrogen Isotope Composition delta(2)H Reflects Plant Performance. Plant Physiol. 2019, 180, 793–812. [Google Scholar] [CrossRef]
- Schmidt, H.L.; Werner, R.A.; Roûmann, A. 18O Pattern and biosynthesis of natural plant products. Phytochemistry 2001, 58, 9–32. [Google Scholar] [CrossRef]
- Andrews, S.S.; Karlen, D.L.; Mitchell, J.P. A comparison of soil quality indexing methods for vegetable production systems in Northern California. Agric. Ecosyst. Environ. 2002, 90, 25–45. [Google Scholar] [CrossRef]
- Fu, H.; Wei, L.; Chen, H.; Yang, X.; Kang, L.; Hao, Q.; Guo, L. Combining stable C, N, O, H, Sr isotope and multi-element with chemometrics for identifying the geographical origins and farming patterns of Huangjing herb. J. Food Compos. Anal. 2021, 102, 103972. [Google Scholar] [CrossRef]
- Martín-Sanz, J.P.; de Santiago-Martín, A.; Valverde-Asenjo, I.; Quintana-Nieto, J.R.; González-Huecas, C.; López-Lafuente, A.L. Comparison of soil quality indexes calculated by network and principal component analysis for carbonated soils under different uses. Ecol. Indic. 2022, 143, 109374. [Google Scholar] [CrossRef]


Disclaimer/Publisher’s Note: The statements, opinions and data contained in all publications are solely those of the individual author(s) and contributor(s) and not of MDPI and/or the editor(s). MDPI and/or the editor(s) disclaim responsibility for any injury to people or property resulting from any ideas, methods, instructions or products referred to in the content. |
© 2023 by the authors. Licensee MDPI, Basel, Switzerland. This article is an open access article distributed under the terms and conditions of the Creative Commons Attribution (CC BY) license (https://creativecommons.org/licenses/by/4.0/).