Article

Optimization of the Vacuum Fractional Distillation Process for Enhancing the α-Guaiene of Patchouli Oil with Response Surface Methodology

1
Doctoral Program Agroindustrial Technology, Faculty of Agro-Industrial Technology, Universitas Padjadjaran, Bandung-Sumedang Street km 21, Jatinangor, Sumedang 45363, Indonesia
2
Department of Agricultural and Biosystem Engineering, Faculty of Agro-Industrial Technology, Universitas Padjadjaran, Bandung-Sumedang Street km 21, Jatinangor, Sumedang 45363, Indonesia
3
Department of Food Technology, Faculty of Agro-Industrial Technology, Universitas Padjadjaran, Bandung-Sumedang Street km 21, Jatinangor, Sumedang 45363, Indonesia
4
School of Chemistry and Environment, Faculty of Applied Sciences, Universiti Teknologi MARA, Shah Alam 40450, Malaysia
5
Atta-ur-Rahman Institute for Natural Product Discovery, Universiti Teknologi MARA, Cawangan Selangor, Kampus Puncak Alam, Bandar Puncak Alam 42300, Malaysia
*
Author to whom correspondence should be addressed.
Separations 2023, 10(9), 469; https://doi.org/10.3390/separations10090469
Submission received: 13 July 2023 / Revised: 16 August 2023 / Accepted: 21 August 2023 / Published: 25 August 2023

Abstract

:
α-guaiene is one of the primary sesquiterpene compounds used as a flavor and fragrance agent in patchouli oil. The fraction of patchouli oil that is rich in α-guaiene has been successfully isolated. In the present work, α-guaiene was isolated from crude patchouli oil through vacuum fractional distillation followed by GC-MS identification. Three important process parameters—feed volume, reflux ratio, and applied run pressure—were investigated and optimized using Box–Behnken design. The research methodology was an experimental laboratory using response surface methodology (RSM) with a feed volume level from 75 mL to 125 mL, a reflux ratio from 10:1 to 30:1, and an applied run pressure from 5 mmHg to 15 mmHg. The α-guaiene-enriched fraction was found in the first distillate fraction patchouli. The optimum condition that generated α-guaiene fraction at 44.70% purity was the treatment with a feed volume of 75 mL, a reflux ratio of 24:1, and applied run pressure of 14.80 mmHg. Results indicated that feed volume did not significantly affect the α-guaiene content, while the applied run pressure and reflux ratio used had a significant effect. A quadratic mathematical model with R2 0.861 and validation 96.14% was suitable for predicting the optimum α-guaiene fraction content during the vacuum fractional distillation process.

Graphical Abstract

1. Introduction

Patchouli oil is widely used in perfume industries, particularly as a binding agent for the main constituents of perfume. It blends well with a variety of essential oils, and there is no synthetic chemical that can be substituted for patchouli oil, which raises its value and demand in the perfumery and cosmetics markets [1]. Patchouli oil is greatly valued for its distinct and unique characteristics and long-lasting woody, earthy, and camphoraceous odor [2]. Recently, patchouli oil has also been used as a natural additive for food flavoring. Previous studies showed that a very low concentration (2 mg kg−1) of oil is used for flavoring beverages, gelatin, frozen dry desserts, candy, baked goods, meat, and meat products [3].
Patchouli oil is comprised of a complex mixture of volatile compounds; over 24 different sesquiterpene hydrocarbons and their oxygenated derivatives have been identified so far [2]. Patchouli alcohol, a tricyclic oxygenated sesquiterpene hydrocarbon, is the predominant constituent responsible for the quality of patchouli oil. Several other sesquiterpene hydrocarbons affected the aromatic properties of patchouli oil, namely caryophyllene; pogostol; α-, β-, γ-, and δ-patchoulene; cycloseychellene; α- and β-bulnesene; and norpatchoulenol [4]. Additionally, isoaromadendrene epoxide, cis-thujopsene, corymbolone, and α-guaiene are also reported as important odor constituents [5].
Patchouli oil contains guaiene compounds such as α-guaiene and δ-guaiene. The patchouli oil standard norm stated the allowed ranges of several constituents of patchouli oil—for example, δ-guaiene (13–21%) and α-guaiene (11–16%) [6]. Several reports regarding the GC-MS analyses on the quality of the sesquiterpenes for both α-guaiene and δ-guaiene from patchouli oil were reported (Table 1). Differences in the chemical composition of guaiene in patchouli oil, both qualitatively and quantitatively, might be affected by environmental variables (location of origin), different harvesting times, and the existence of two chemotypes, namely pogostone-patchouliol type and interim type [7]. The huge variations are partly related to patchouli essential oil’s highly changeable ratio of hydrocarbons to oxygenated components [8]. Additionally, the method of the distillation process will lead to different oil constituents [4].
Both the food and pharmaceutical industries could benefit from guaiene. In industrial applications, α-guaiene serves as a flavor and fragrance agent [17]. Recently, α-guaiene was observed to be a universal precursor to fragrances rotundone (peppery aroma compound) under simple aerial oxidation conditions [18,19,20]. The potential benefit of α-guaiene has been investigated due to antimicrobial activities [21] and antifungal properties [22].
The engineering distillation method’s application for guaiene purification is limited. Few studies relative to the isolation of guaiene have been performed to find an effective and economical method for separating guaiene from patchouli oil. A previous study using the molecular distillation technique effectively raised α-guaiene content from 18.67 to 23.53% and δ-guaiene content from 15.30 to 33.10% during the 1.43 h distillation process [23]. Furthermore, the two-stage vacuum fractional distillations have successfully isolated α-guaiene (31.05% purity) from the distillate fraction of patchouli oil after 19.23 h processing time [24]. The process conditions did not allow for the production of α-guaiene with high purity, and it was also less economical since the process took a long time to distill the component.
The vapor pressure of a pure chemical is proportional to the temperature at which it vaporizes. Vacuum fractional distillation is a distillation method for obtaining a high-purity substance. In it, separation is based on partial vaporization of the mixture and separate recovery of vapor and residue. Evaluating the time, temperature, and distillation rate is crucial in the design of the fractional distillation process. Other fractional distillation process specifications include the feed flow rate, composition, thermal properties of the feed, the desired distillate composition, and the expected yield [25]. Some important factors that affect fractional distillation are reflux ratio, pressure, temperature, column–tray configuration, and fractional column length [16,25,26].
The response surface method (RSM) is a set of mathematical and statistical approaches for modeling and evaluating situations involving responses impacted by several variables and is used to optimize these responses [27]. Box–Behnken design (BBD) is a popular RSM tool for developing experimental trials. Experiments utilizing BBD are more efficient than traditional approaches because they reduce the complexity of the experimental trials required to analyze various variables and their interactions [28]. In recent years, RSM has been widely used to optimize numerous variables in a variety of bioprocesses, including agriculture, biology, food, chemistry, and others [29]. To the best of our knowledge, no studies have been published on the application of RSM to the enrichment of α-guaiene from patchouli oil through vacuum fractional distillation. The research objective was to determine the optimum process conditions in isolating α-guaiene from patchouli oil through vacuum fractional distillation by using a combination of three factors—feed volume, applied run pressure, and reflux ratio to obtain α-guaiene-enriched fraction. The color, specific gravity, and refractive index of the obtained material were also investigated.

2. Materials and Methods

The research material used as a sample was crude patchouli oil obtained from CV. Putra Atsiri Distiller, Subang, Jawa Barat, Indonesia. The supporting chemical ingredients were acetone as a cleaning solvent and a silicon oil vacuum pump.

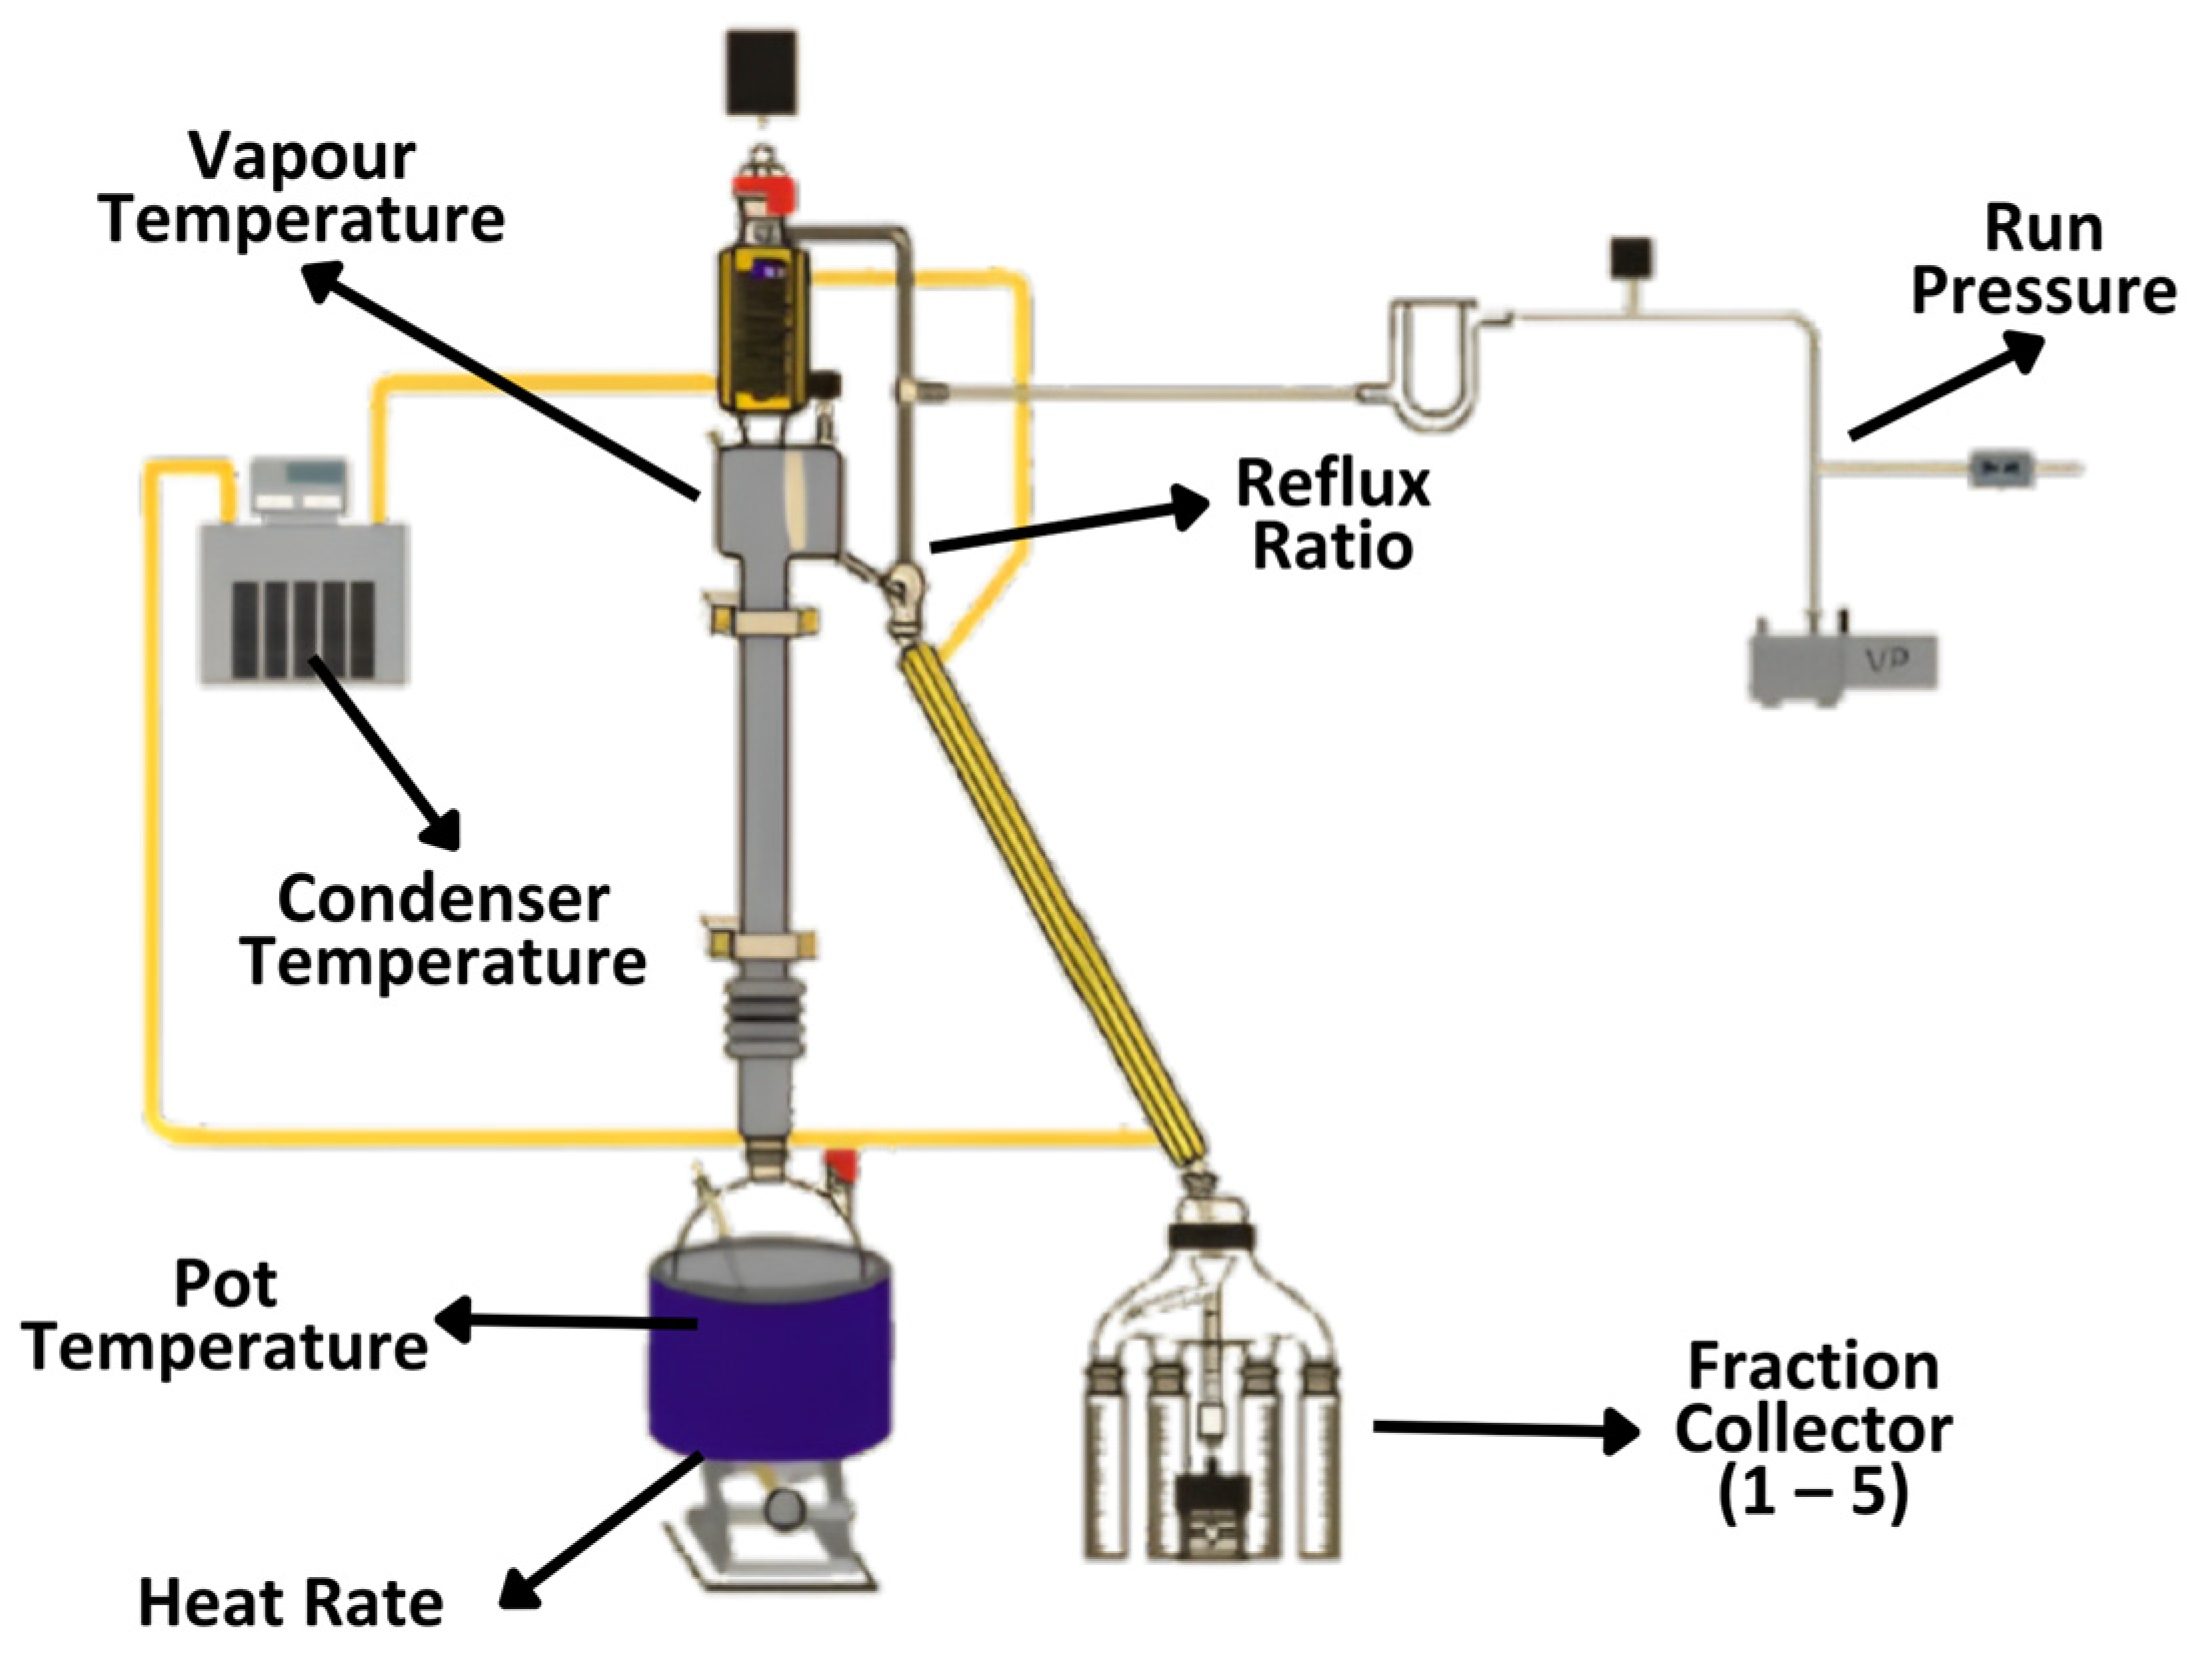
2.1. Vacuum Fractional Distillation

The distillation equipment used was a fractional distillation system (B/R Instrument-Model 36-100 (USA) integrated with the computer by the BR M 690 control program (Figure 1). The fractionation distillation process was carried out with fractionation column Teflon band 36-100-60 (60 cm). A stirrer was put inside the flask, then a 75–125 mL patchouli oil sample was poured into a boiling flask which was connected to a fractionation column. The computer was used to configure the process parameters, which included the run pressure, boiling temperature, reflux ratio, equilibration time, initial heat, heat rate, condenser temperature, and maximum pot temperature.
Fractional distillation was conducted at a run pressure of 5–10 mmHg, equilibration time of 15 min, initial heat of 25%, maximum pot temperature of 300 °C, heat rate of 17%, reflux ratio of 10:1–30:1, and condenser temperature of 35 °C. The fractionation temperature is modified based on the boiling point temperature of the components in the material. The temperature setting of each fraction was set to vapor atmospheric equivalent temperature (vapor AET), namely fraction 1 (249–254 °C), fraction 2 (254–259 °C), fraction 3(259–264 °C), fraction 4 (264–269 °C), and fraction 5(269–274 °C). AET was a calculation of equivalent temperature at atmospheric pressure from the actual temperature and vacuum level. After the process conditions were adjusted according to the distillation plan, the condenser, the heater under the boiling flask, and the vacuum pump were turned on and the fractional distillation process began. All of the samples were slowly distilled, then distillate and residue were collected in their respective flasks.

2.2. Experimental Design

The research method used was a laboratory experimental method using the RSM-type Box–Behnken design, and the number of treatments researched was predetermined using the data processing software application Design Expert 13. This design was used by merging three independent variables, namely feed volume, applied run pressure, and reflux ratio. The dependent variable or response was the relative peak area of α-guaiene in fraction 1. Each variable has a minimum value (−) and a maximum limit (+). Based on the experimental design of each variable in this study was shown in Table 2.
Reflux ratio is the ratio of boil up-rate (the number of drops that fall from the blue tip) to take-off rate (the amount of distillate removed from the still in a given time. Therefore, a 10:1 reflux ratio refers to 10 portions of liquid condensed from the rising vapor which return to the boiling flask with 1 portion of distillate that is removed from the still and collected. The reflux ratio range of 10:1 to 30:1 was simplified to 10–30 for the RSM study.
According to the number of factors and the Box–Behnken type level with software Design Expert 13 experimental designs in the study, there were 17 treatments (run) consisting of 5 central points per block. The results are shown in Table 3.
The results of the experiment were evaluated and interpreted using statistical tools. The analysis of variance (ANOVA), regression analysis, and charting of the response surface were the three primary analytical stages. The first step in studying the response surface was to use least square regression to estimate the model’s parameters and use ANOVA to gain information about the fit. The Fischer variance ratio (F-ratio) and the coefficient of determination (R-squared) were particularly important.

2.3. Gas Chromatography–Mass Spectroscopy (GC-MS) Analysis

The analysis of crude patchouli oil and distillate fraction distillation products was performed on an Agilent Technologies 7890 Gas Chromatograph, where the carrier gas was helium with a flow rate of 0.6 mL/min and a split ratio 250:1. A 1 μL patchouli oil sample was injected into the equipment, the injection port temperature was 250 °C, ion source temperature 230 °C, and detector temperature was 280 °C using an HP Innowax Capillary Column 30 m × 0.25 mm, 0.25 (μm) film thickness. The initial oven temperature was 60–150 °C at 2 °C/min and increased to 150–210 °C at 20 °C/min with an initial hold of 2 min. GC-MS analysis was conducted in electron impact with the method of ionization (EI) using a 5975 Mass Selective Detector. The peak area percentage was obtained in the Chemstation Integrator, and then mass spectral data were identified using The National Institute of Standards and Technology (NIST17.L) mass spectral library.

2.4. Physicochemical Characterization of α-Guaiene Enriched Fraction

Color characteristics that expressed the reflectance spectrum were quantified using a Spectrophotometer Ultrascan Pro (D65, Hunter Lab, Reston, VA, USA). Specific gravity was determined using a 1 mL pycnometer at 25 °C reference temperature. The refractive index of the sample was measured at 20 °C using an Atago NAR-1T liquid Abbe Refractometer (Atago, Tokyo, Japan).

3. Results

3.1. Composition of Crude Patchouli Oil

Prior to the vacuum fractional distillation process, the chemical composition of crude patchouli oil was identified via GC-MS. According to the results of the GC-MS test, it was found that crude patchouli oil contains 20 compounds consisting of 5 oxygenated hydrocarbon compounds and 15 sesquiterpene hydrocarbon compounds. The chemical compound presence in crude patchouli oil was dominated by patchouli alcohol (32.04%), α-guaiene (19.33%), and δ-guaiene (19.25%) relative peak areas. The whole chemical constituents of crude patchouli oil are presented in Table 4.

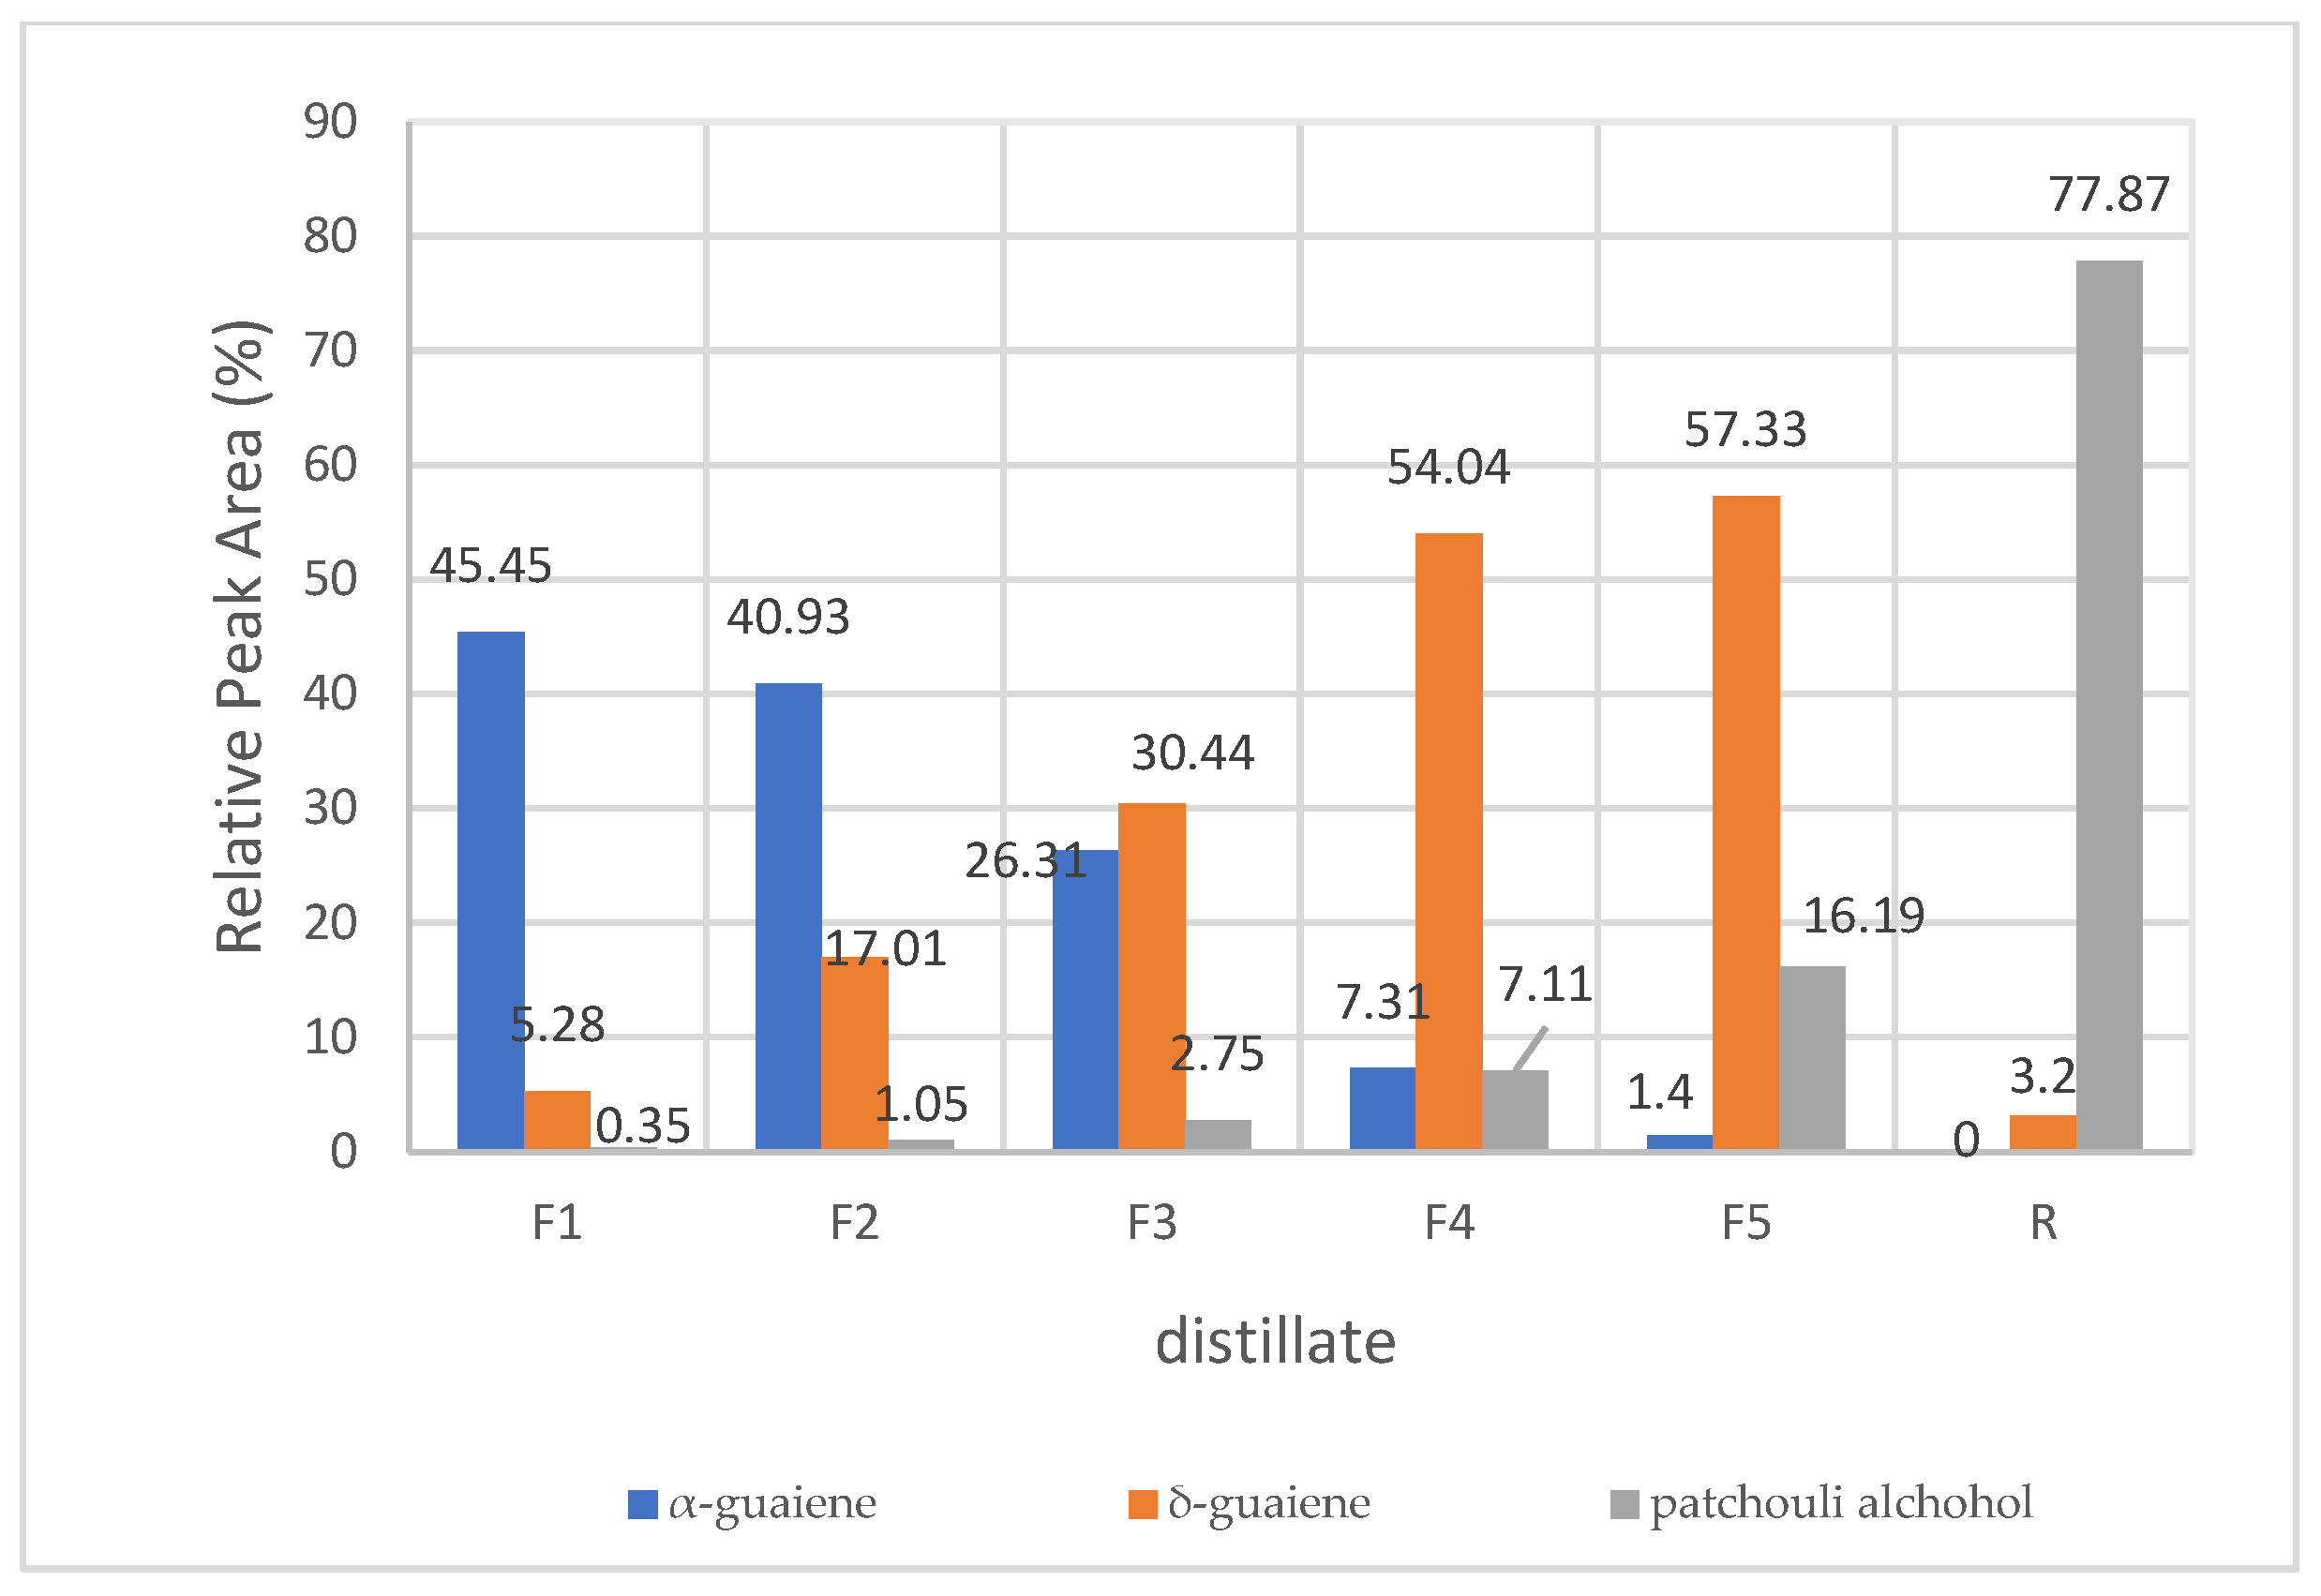
3.2. Determination of the Presence of α-Guaiene Enriched Fraction

Determination of the α-guaiene enriched fraction was carried out by GC-MS test on the distillation results in the preliminary study of a sample of 75 mL which was given a pressure of 5 mmHg, a heat rate of 25%, a reflux ratio of 20:1 to produce 5 fractions (F1–F5) and residues. The contents of the three main components of each fraction, namely α-guaiene, δ-guaiene, and patchouli alcohol, were further presented in Figure 2.
Based on Figure 2, it was reported that fraction 1 (F1) was a fraction rich in α-guaiene with a relative composition of 45.45%, fraction 5 (F5) was a fraction rich in δ-guaiene with a relative composition of 57.33%, while the residue (R) contained 77.87% patchouli alcohol. Furthermore, a comparison of the α-guaiene fraction was made to the results of the first fraction of fractional distillation with a pressure of 5 mmHg and 10 mmHg, 45.45% and 46.03%, respectively. This showed that the rich content of the α-guaiene fraction in the first fraction (249–254° AET) and the highest relative peak area was 46.03% in fractional distillation with 10 mmHg. Therefore, the determination of GC-MS was conducted only in F1.

3.3. Analysis of Treatment and Response Optimization

Response gained for each run of the Box–Behnken design effect factor of the feed volume (A), reflux ratio (B), and applied run pressure (C) on the experimental value for α-guaiene content of fraction 1 (response) was considered. The experimental value obtained for α-guaiene enriched fraction for each treatment combination was in Table 3. The response α-guaiene content of fraction 1 varied greatly as a function of the parameter settings of the experiments (from 43.42–46.48%). Experiment run number 9 had the highest relative peak area of α-guaiene, whereas the lowest value was found in experiment run number 12.

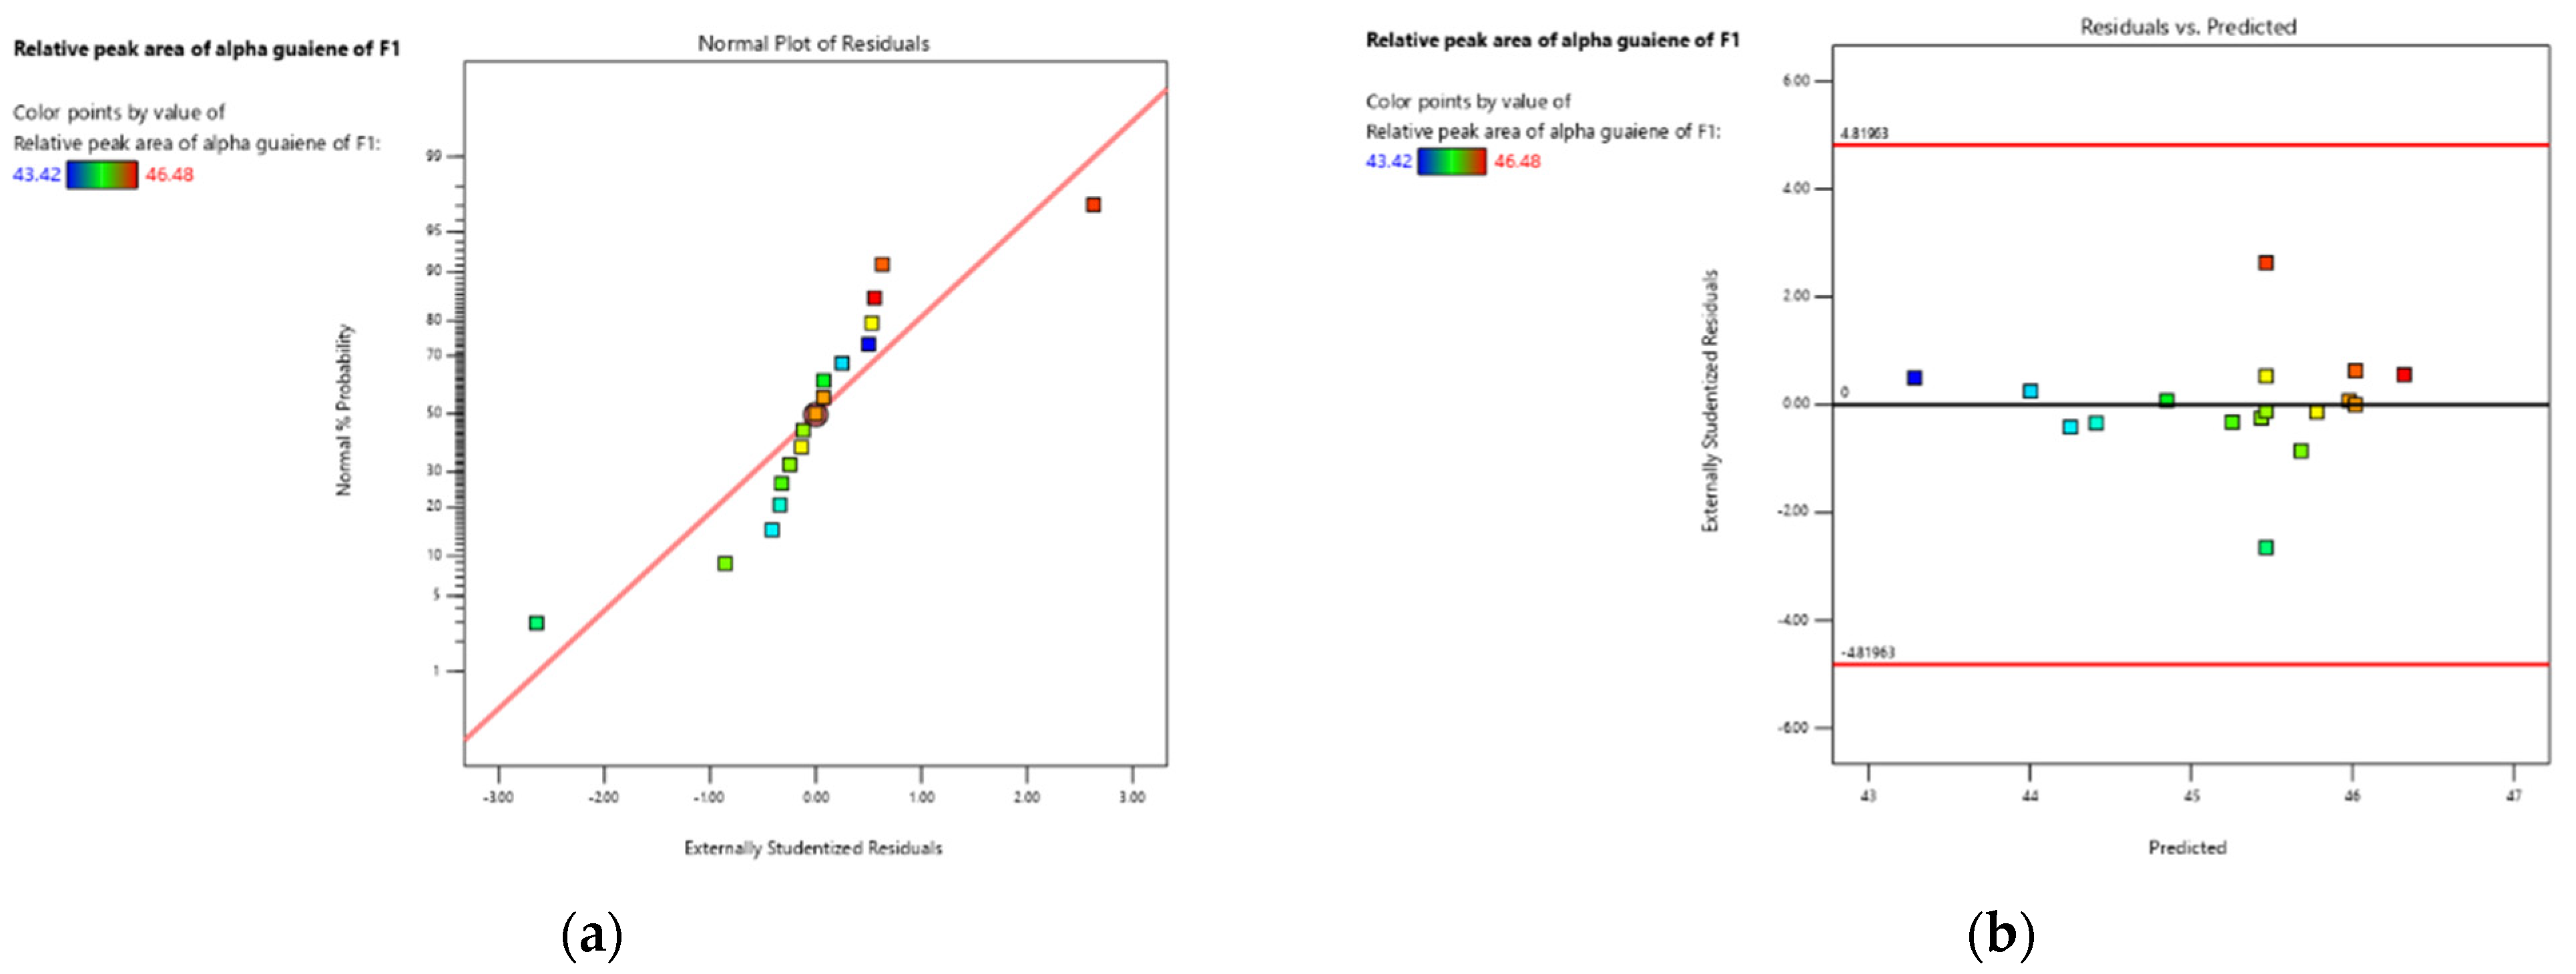
3.3.1. Data Analysis, Data Processing, and Model Fitting

ANOVA analysis for the response to the relative peak area α-guaiene of fraction 1 used a quadratic model as suggested by the design expert application with a p-value of 0.0251, lack of fit 0.9597, adjusted R2 0.6823, and predicted R2 0.6523. The ANOVA results for the response to the alpha guaiene of fraction 1 showed the suitability of the model, and the interaction variables were presented in Table 5. The fit statistic results for the response to the alpha guaiene content of fraction 1 showed the suitability of the model and the interaction variables were presented in Table 6.
The significance of the model was in accordance with the 95% confidence level, which means it was significant if the value was below 0.05 (α = 5%). The results presented in Table 5 demonstrate a p-value smaller than 0.05, and it could be concluded that this model appears to be highly significant. The lack of fit value was more than 0.05, namely 0.9597, which means that the response to α-guaiene of fraction 1 can be explained well by the model. As a result, the model was appropriate for describing the response data. The insignificant lack of fit indicates the suitability of the resulting model. The lack of fit, which was not significant, confirmed that the conditions of the model were good.
The value and intensity of the coefficients could be used to interpret the variable’s effect on the response. The negative sign of the coefficient denotes a decrease in the reaction as the level of the variable rises, whereas the positive sign denotes an increase in the response. The ANOVA results showed that the variables that had a significant effect on α- guaiene were reflux ratio (B), the applied vacuum pressure (C), and the quadratic of the reflux ratio (B2). The p-value of the factor the reflux ratio (B), applied run pressure (C), and the quadratic value of reflux ratio (B2) are all ≤ 0.05, which means these factors have a significant effect on percentage of relative peak area α-guaiene in fraction 1. A p-value ≥ 0.05 means the factors are not significant.
Based on Table 6, it could be seen that the R2 value obtained in this research was 0.8610, which means it was quite high because it was close to 1. The value of R2 shows the magnitude of the combination of the independent variables that affects the response value. The closer the R2 value to one, the better the model obtained because it shows that there was a deviation in the data or that the error in the data research was not too large. The adjusted R2 value for the yield response was 0.6823, the predicted R2 value was 0.6523, and the difference between the two was 0.03. A good model should have a difference between adjusted R2 and predicted R2 below 0.2 [30]. The value of the adequate precision calculation, which was the comparison between the predicted value at each design point with the average prediction error, produces a value of 7.9217, and this indicates that the model can be used and accepted because the ratio obtained was more than four [30]. The condition of each treatment point can be used to determine the quadratic model of the response more clearly using the normal curve plot of residuals. If the condition of the residual points was along the center line, it can be assumed that the normality of the selected model was correct. The normality curve of the residual plot to the relative peak area of α-guaiene of F1 response was presented in Figure 3a,b.
Figure 3a expresses that the average residual point formed was along the line. There are several points that are far outside the line, and this indicates a discrepancy in value, which can cause deviations in the model. The points that were closer to the normality line show that the data was normally distributed, which indicates that the significance of the actual results approaches the predicted results produced by the design expert application. The results of the model values between the residual conditions and the predictions generated by the program were presented in Figure 3b.
The relationship of the three factors that affect the response of the α-guaiene of fraction 1 forms an equation model produced by RSM. The polynomial equations were presented in coded equations and actual equations, both of which are used to make response predictions for each factor. The coded equation displays the equation in the factors using a code, such as a value of +1 for the high variable value of the factor used and a −1 value for the low variable value of the factor. The actual equation displays the equation with the corresponding variable value for each factor and was not displayed in a scale model or code. The model forms a quadratic-type mathematical equation, which means that the response to α-guaiene of fraction 1 was influenced by the interaction between independent variables. The polynomial equations generated from the coefficients in Table 7.
The mathematical model of the Box–Behnken type RSM experimental design was shown for the predicted response value of the α-guaiene of fraction 1 (Y), with a factor of the feed volume (A), reflux ratio (B), and applied run pressure (C). The equation was modeled as follows:
Y = 45.47 0.0300 A + 0.8338 B + 0.4123 C + 0.0500 AB 0.1200 AC + 0.0525 BC + 0.4890 A 2 0.7885 B 2 0.1965 C 2
The mathematical equation stated that the response to α-guaiene is directly proportional to the increase in reflux ratio, pressure, the interaction between the number of samples and the reflux ratio, the interaction between the reflux ratio and pressure, and the interaction between the feed volume. This was indicated by a positive constant value. The relative peak area of α-guaiene decreased with the increase in the feed volume, the interaction of the feed volume and pressure, and the interaction between the reflux ratio and pressure. This was designated by a negative equation constant.

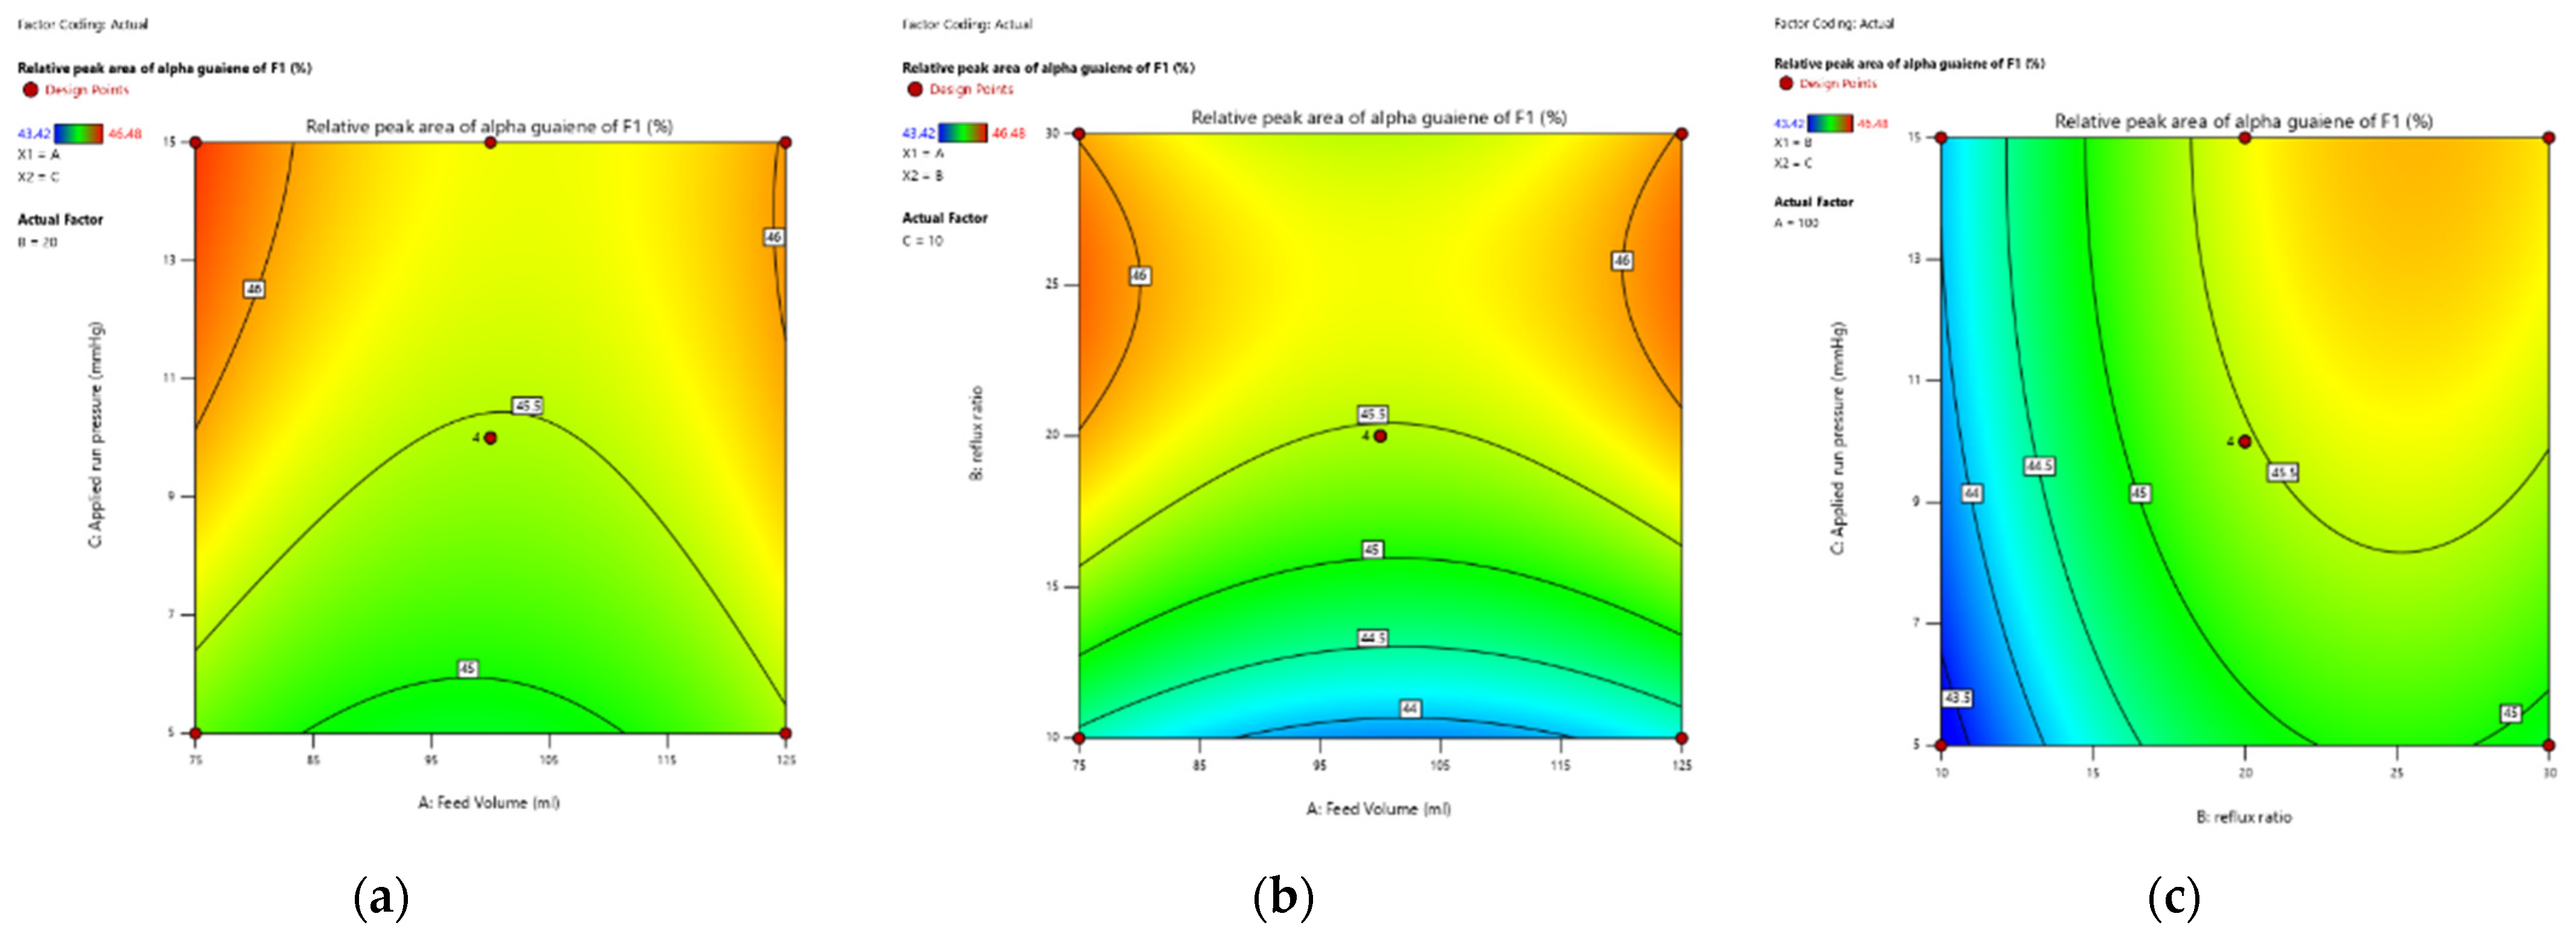
3.3.2. Contour Diagram

To better visualize the substantial interaction effect of independent factors on the α-guaiene content during fractional distillation, response surfaces were plotted. Three-dimensional (3D) response surface graphs and contour plots for the α-guaiene content response—namely between the feed volume (A) and applied vacuum pressure (C), reflux ratio (B) and feed volume (A), and the ratio of reflux (B) and applied vacuum pressure (C)—are shown in Figure 4a–c.
Figure 4 served visual appearance of results feed volume, reflux ratio, and applied run pressure in the shape of a three-dimensional curve with distinct colors. The lower the response value, the bluer the area; the higher the response value, the redder the region. Because the model utilized was a quadratic model, the three-dimensional graphic design was in the shape of parabola. All responses generated 3D curves in blue areas, or the lowest-value α-guaiene, which was obtained via fractional distillation at (100 mL, 10:1, 5 mmHg); otherwise, the graph with the red region, or high α-guaiene, was obtained via fractional distillation at the lowest volume (75 mL, 20:1, 15 mmHg).
It can be observed from Figure 4a, the relation of applied run pressure to α-guaiene increased in a straight line. The volume of feed with α-guaiene followed a parabolic curve. At the midpoint, α-guaiene was decreased. On the other hand, the interaction between applied run pressure and feed volume with α-guaiene was like a parabolic line. At the midpoint, α-guaiene reached a peak. The higher the applied run pressure, the more the α-guaiene produced will increase. This findings were in line with [24] in that the percentage of high relative peak area of the distillate produced can be influenced by the pressure employed and that the patchouli oil should be fractionated in a vacuum because high pressure and temperature can cause the oil components to decompose.
Figure 4b demonstrated that α-guaiene was increased with the increase of reflux ratio. The feed volume with α-guaiene followed a parabolic curve, with the α-guaiene content decreasing at the halfway point. With α-guaiene, the interaction between reflux ratio and feed volume was like a parabolic line, with α-guaiene peaking at the midpoint. The higher the reflux ratio, the more α-guaiene is formed. This revealed that for α-guaiene, the quadratic of the reflux ratio was significant. According to [31], for reflux ratio the purity of the chemical was unaffected by fractional distillation. However, the ratio reflux has an effect on the operating conditions, as the higher the reflux ratio, the longer the fractional distillation process takes. Because of the shorter reflux period, the operating condition of a reflux ratio of 20:1 was regarded as more efficient, saving processing time and producing a high yield.
As shown in Figure 4c, curvatures in α-guaiene curves revealed that the fluctuation in alpha guaiene could be described by a nonlinear function. The inverted parabola shape was insignificantly related to feed volume. The interaction between applied run pressure and reflux ratio exhibited a parabolic. The α-guaiene c raised as the applied run pressure and reflux ratio increased, as seen in the graph. It can be concluded that those two parameters had a favorable effect on α-guaiene rise. As can be observed, the main effects of the parameters are in the following order: main effect of reflux ratio > quadratic of reflux ratio > applied run pressure. The p-values of the parameters are 0.0021, 0.0144, and 0.0441, respectively. These results were in agreement with earlier reports in the literature in [24], which stated that the rise in α-guaiene content was considered due to the applied run pressure that represented the vacuum fractional distillation, allowing more α-guaiene to be separated.

3.3.3. Determination of Optimum Point

Optimization was carried out after obtaining a mathematical model for the response to α-guaiene content. The objective of optimization was to obtain the response or treatment that best suits the desired process conditions in vacuum fractional distillation. The target optimization for determining the optimum point of vacuum fractional distillation of α-guaiene-rich fraction in RSM is presented in Table 8.
Variable components or influencing factors are optimized in their respective ranges. The importance of 3, the number of samples (mL), reflux ratio, and pressure (mmHg) will affect the response results of α-guaiene content fraction 1. α-guaiene response fraction 1 is optimized with a maximization target with an importance level of 5 because it was expected that the α-guaiene produced could be maximized with the efforts of the effective variables so as to obtain optimal process conditions. The weighting of importance can be adjusted from 1 to 5 according to the importance of the variable and response. The more positive signs given, the higher the level of importance of the response variable [32]. The level of desire (desirability) shown for the α-guaiene of fraction 1 response analysis is presented in more detail in Table 9.
The design above produced 79 solutions suggested by RSM. The desirability value or the level of desire that was closest to the value 1 indicates the optimal suitability of the optimization process with the desired response variable. The RSM application provides optimization conditions for the distillation fractionation of patchouli oil to obtain fraction 1 (a fraction rich in α-guaiene) with a sample size of 75.456 mL, a reflux ratio of 23.618, and a pressure of 14.803 mmHg. The selected process conditions with a high level of desirability that could predict α-guaiene fraction 1 was 46.49%; the recommended influence factor was rounded up with a solvent volume of 75 mL, a reflux ratio of 24:1, and a pressure of 14.8 mmHg. The value of the desirability level of 1 indicated the accuracy of the results, which implied that there was an optimal match between the conditions of the fractional distillation process and the response variable containing α-guaiene fraction 1.
The results of optimization α-guaiene content of fraction 1 and desirability (optimization targets) can be described in the form of a contour, which can be seen in Figure 5a–c).

3.3.4. Model Validation

Furthermore, model validation was carried out to determine the accuracy of the mathematical model obtained. Model validation was the comparison of actual α-guaiene with predicted α-guaiene The actual α-guaiene obtained from the experimental results. The results of the model validation obtained are shown in Table 10.
Based on the data in Table 10, it can be observed that there was a significant difference between the actual research α-guaiene and the optimization prediction using the Box–Behnken-type RSM. It also contains confirmation of the RSM’s optimal solution, in which the actual result values were still in the predicted range of 95% PI low and 95% PI high. The accuracy of the validation results obtained from the RSM model was 96.14%. In other words, the type RSM model obtained was reliable to be used as a reference for the fractional distillation of α-guaiene.
Based on the results of the comparison of the verified data to the predictions made by the application, the actual value was in the range of 95% PI low and 95% PI high. The prediction interval (PI) was a range that indicates the desired measurement results or the expectation of the next response under the same conditions [32]. The actual test results, which are still in the prediction range, indicate that the model can be used to predict the yield response well. The response value of the selected combination of factors and the response in the prediction interval range shows that the model can be applied and the response is good. Furthermore, the calculation of the validation percentage can be carried out; the actual result is divided by the predicted result multiplied by 100%. The percentage of validation obtained from the comparison of the actual and predicted value of α-guaiene fraction 1 was 96.14%, and the result was close to the validation percentage value, which was 100%. The model was suitable for predicting the conditions of the fractional distillation process to obtain the optimum α-guaiene fraction 1.

3.4. Characteristics of α-Guaiene-Enriched Fraction

3.4.1. Yield of α-Guaiene-Enriched Fraction 1

The yield was the ratio between the mass of α-guaiene-enriched fraction 1 produced and the mass of the crude patchouli oil as a raw material. The yield of α-guaiene-enriched fraction can be seen in Table 11.
It can be revealed that each treatment has a different partial yield of α-guaiene-enriched fraction 1. Table 11 showed that the yield produced by each treatment was varied. The highest total yield of 20.16% mass was produced by run 6, with feed a volume of 100 mL, reflux ratio of 20:1, and applied run pressure of 10 mmHg. Meanwhile, the lowest partial yield of 5.61% was produced by run 12, with with a feed volume of 100 mL, reflux ratio of 10:1, and applied run pressure of 5 mmHg. According to [31], variables which affect the yield include the pressure and temperature used in distillation. However, the resulting data of the partial yield were not affected by feed volume, reflux ratio, or applied run pressure. This was presumably due to treatment with a small range (feed volume, reflux ratio, and applied run pressure) producing a closed yield. In addition, the yield of the α-guaiene-enriched optimum fraction was 15.92% mass.

3.4.2. Composition of Optimum-α-Guaiene-Enriched Fraction 1

As shown in Table 12, it was found that optimum-α-guaiene-enriched fraction contains 28 compounds consisting of 3 oxygenated hydrocarbon compounds, 24 sesquiterpene hydrocarbon compounds, and 1 miscellaneous compound (C16H14N6OS). The composition of optimum α-guaiene-enriched fraction was dominated by α-guaiene 44.47%, seychellene 15.54%, and β-patchoulene 11.98%. There were 18 chemical components that had molecular formula similar to α-guaiene (C15H24). This proved that the separation process using vacuum fractional distillation could successfully separate the sesquiterpenes of patchouli oil compounds. The overall composition of optimum-α-guaiene-enriched fraction can be seen in Table 12.

3.4.3. Color of α-Guaiene-Enriched Fraction 1

The hue value is a value that represents the dominant wavelength. Hue value is the value obtained from the a * and b * values. The hue value obtained is then adjusted to the chromaticity color range. Based on the data obtained, the hue value of crude PO was 34.2 (red). Hue values between 18 and 54 were classified as red [33]. The hue values for all runs were between 95.34–109.44. Based on the previous literature, hue values from 90–126 were classified as yellow. In addition, the optimum α-guaiene hue value was 103.70, which was yellow in color. The detailed results of the color appearance test can be seen in Table 13.

3.4.4. Refractive Index and Specific Gravity of α-Guaiene-Enriched Fraction

The characteristics of patchouli oil in International Standard specifies certain characteristics of the oil, such as refractive index and specific gravity. The refractive index of patchouli oil at 20 °C was 1.505–1.515, while specific gravity at 20 °C was 0.952–0.975 [6]. The crude patchouli oil used in the experiment had values of 1.506 and 0.974, respectively, which is in accordance with the patchouli oil standard. Furthermore, the specific gravity of α-guaiene-enriched fraction varied from 0.903–0.930. The specific gravity of optimum α-guaiene fraction was 0.918. This results were in line with the data of α-guaiene refractive index, which were 0.8970–0.9030 [17]. In this study, the refractive index of α-guaiene enriched fraction varied from 1.498–1.501. In addition, the refractive index of optimum α-guaiene was 1.499. These findings matched the literature, which stated that the specific gravity of guaiene was 1.499 [17]. The refractive index and specific gravity of all runs are presented in Table 13.

4. Conclusions

The resulting mathematical model was statistically significant, with a quadratic form at p value < 0.05 and R2 0.8610. The accuracy of the validation results obtained from the Box–Behnken design was 96.14%. The model obtained was good enough to be used as a reference for the vacuum fractional distillation. The variables that have a substantial impact on α-guaiene response include reflux ratio (B), the quadratic of the reflux ratio (B2), and applied run pressure (C), while the variables that that did not have a major impact on α-guaiene content consist of feed volume (A), the interaction between feed volume and reflux ratio (AB), the interaction between feed volume and applied run pressure (AC), the interaction between reflux ratio and applied run pressure (BC), the quadratic of the feed volume (A2), and the quadratic of applied run pressure (C2). When the independent variables feed volume, reflux ratio, and applied run pressure are employed, this model can be used to determine the α-guaiene that can be generated. Based on the highest desirability, the combination of 75 mL feed volume, reflux ratio 24:1, and applied run pressure 14.8 mmHg resulted in an optimum fractional distillation condition with 44.47% α-guaiene relative peak area, hue value 103.70 (yellow), refractive index 1.499, and specific gravity 0.918, respectively. The practical implication of the observed behavior in obtaining a higher-percentage relative peak area of α-guaiene is in modulating the run pressure. This allows more eficient vacuum fractional distillation, save processing time, and less energy for separation.

Author Contributions

Conceptualization, A.W. and S.N.; methodology, S.N., C.P.O. and A.W.; resources, A.W.; data curation, A.W., B.N. and S.N.; writing—original draft preparation, A.W.; writing—review and editing, A.W. and S.N. visualization, B.N. and C.P.O.; supervision, A.W. All authors have read and agreed to the published version of the manuscript.

Funding

This research was funded by Universitas Padjadjaran Grant, Hibah Internal Unpad, Riset Disertasi Doktor Unpad (RDDU) Project No. 1427/UN6.3.1/LT/2021.

Institutional Review Board Statement

Not applicable.

Informed Consent Statement

Not applicable.

Data Availability Statement

Not applicable.

Acknowledgments

The authors are grateful for the GC-MS facilities provided by Labkesda Jakarta.

Conflicts of Interest

The authors declare no conflict of interest.

References

  1. Ramya, H.G.; Palanimuthu, V.; Rachna, S. An introduction to patchouli (Pogostemon cablin Benth.)—A medicinal and aromatic plant: It’s importance to mankind. Agric. Eng. Int. CIGR J. 2013, 15, 243–250. [Google Scholar]
  2. Deguerry, F.; Pastore, L.; Wu, S.; Clark, A.; Chappell, J.; Schalk, M. The diverse sesquiterpene profile of patchouli, Pogostemon cablin, is correlated with a limited number of sesquiterpene synthases. Arch. Biochem. Biophys. 2006, 454, 123–136. [Google Scholar] [CrossRef]
  3. Das, K. Patchouli (Pogostemon Cablin Benth) Oils; Elsevier Inc.: Amsterdam, The Netherlands, 2016. [Google Scholar]
  4. Swamy, M.K.; Sinniah, U.R. A comprehensive review on the phytochemical constituents and pharmacological activities of Pogostemon cablin Benth.: An aromatic medicinal plant of industrial importance. Molecules 2015, 20, 8521–8547. [Google Scholar] [CrossRef] [PubMed]
  5. Hasegawa, T.; Yoshitome, K.; Fujihara, T.; Santoso, M.; Aziz, M.A. Characteristic changes in the aroma profile of patchouli depending on manufacturing process. J. Oleo Sci. 2017, 66, 863–869. [Google Scholar] [CrossRef]
  6. ISO 3757:2002; International Standard 3757 ISO Oil of Patchouli [Pogostemon cablin (Blanco) Benth.]. 2nd ed. ISO: Geneva, Switzerland, 2002.
  7. Hu, L.F.; Li, S.P.; Cao, H.; Liu, J.J.; Gao, J.L.; Yang, F.Q.; Wang, Y.T. GC-MS fingerprint of Pogostemon cablin in China. J. Pharm. Biomed. Anal. 2006, 42, 200–206. [Google Scholar] [CrossRef] [PubMed]
  8. Isfaroiny, R.; Jurusan, M.; Fmipa, K.; Negeri, U.; Kampus, S.; Surabaya, K. Peningkatan Kadar Patchouli Alcohol Pada Minyak Nilam. Berk. Penelit. Hayati 2005, 10, 123–127. [Google Scholar] [CrossRef]
  9. Rakotonirainy, O.; Gaydou, E.M.; Faure, R.; Bombarda, I. Sesquiterpenes from Patchouli (Pogostemon cablin) Essential Oil. Assignment of the Proton and Carbon-13 NMR Spectra. J. Essent. Oil Res. 1997, 9, 321–327. [Google Scholar] [CrossRef]
  10. Buré, C.M.; Sellier, N.M. Analysis of the essential oil of indonesian patchouli (Pogostemon cabin benth.) using GC/MS (EI/CI). J. Essent. Oil Res. 2004, 16, 17–19. [Google Scholar] [CrossRef]
  11. Anonis, D.P. Woody notes in perfumery Patchouly Oil, Absolute and Aroma Chemicals: Part I. Perfum. Flavorist Mag. 2006, 31, 3–6. [Google Scholar]
  12. Tsai, Y.C.; Hsu, H.C.; Yang, W.C.; Tsai, W.J.; Chen, C.C.; Watanabe, T. α-Bulnesene, a PAF inhibitor isolated from the essential oil of Pogostemon cablin. Fitoterapia 2007, 78, 7–11. [Google Scholar] [CrossRef]
  13. Prakash, O.; Joshi, S.; Shukla, A.K.; Pant, A.K. Sesquiterpenoid Rich Essential Oil from the Leaves of Pogostemon patchouli Pellet Grown Organically Under Tarai Conditions. J. Essent. Oil Bear. Plants 2013, 10, 157–161. [Google Scholar] [CrossRef]
  14. Blank, A.F.; Sant’ana, T.C.P.; Santos, P.S.; Arrigoni-Blank, M.F.; do Nascimento Prata, A.P.; Jesus, H.C.R.; Alves, P.B. Chemical characterization of the essential oil from patchouli accessions harvested over four seasons. Ind. Crops Prod. 2011, 34, 831–837. [Google Scholar] [CrossRef]
  15. Hussin, N.; Mondello, L.; Costa, R.; Dugo, P.; Yusoff, N.I.N.; Yarmo, M.A.; AbWahab, A.; Said, M. Quantitative and physical evaluation of patchouli essential oils obtained from different sources of Pogostemon cablin. Nat. Prod. Commun. 2012, 7, 927–930. [Google Scholar] [CrossRef]
  16. Aisyah, Y.; Anwar, S.H.; Annisa, Y. Effect of the Fractional Distillation on an Increment Patchouli Alcohol Content in Patchouli Oil Chemical Constituent of Patchouli. In Proceedings of the 2nd International Conference of Essential Oils (ICEO 2019), Banda Aceh, Indonesia, 29–30 October 2019; pp. 80–85. [Google Scholar] [CrossRef]
  17. The GoodScent Company. TGSC Information System: Alpha Guaiene. 2019. Available online: http://www.thegoodscentscompany.com/data/rw1054351.html#tosafiu (accessed on 6 October 2019).
  18. Huang, A.-C.; Sefton, M.A.; Taylor, D.K. Comparison of the Formation of Peppery and Woody Sesquiterpenes Derived from α-Guaiene and α-Bulnesene under Aerial Oxidative Conditions. J. Agric. Food Chem. 2015, 63, 1932–1938. [Google Scholar] [CrossRef] [PubMed]
  19. Huang, A.-C.; Burrett, S.; Sefton, M.A.; Taylor, D.K. Production of the pepper aroma compound, (-)-rotundone, by aerial oxidation of α-guaiene. J. Agric. Food Chem. 2014, 62, 10809–10815. [Google Scholar] [CrossRef] [PubMed]
  20. Huang, A.-C.; Sefton, M.A.; Sumby, C.J.; Tiekink, E.R.T.; Taylor, D.K. Mechanistic studies on the autoxidation of α-guaiene: Structural diversity of the sesquiterpenoid downstream products. J. Nat. Prod. 2015, 78, 131–145. [Google Scholar] [CrossRef]
  21. Anggraeni, N.D.; Nurjanah, S.; Lembong, E. Uji Aktivitas Antibakteri α-guaiene Minyak Nilam terhadap Bakteri Staphylococcus aureus DAN Staphylococcus epidermidis. Gontor Agrotech Sci. J. 2020, 6, 413–423. [Google Scholar] [CrossRef]
  22. Maulani, M.; Nurjanah, S.; Lembong, E. Antifungal activites of α-guaiene from Pathouli against Microsporum gypseum ATCC 14683 and Tricophyton mentagrophytes. J. Keteknikan Pertan. Trop. Dan Biosist. 2022, 10, 74–83. [Google Scholar] [CrossRef]
  23. Widyasanti, A.; Nurjanah, S.; Nurhadi, B.; Osman, C.P. Isolation of guaiene from crude and distillate patchouli oil extracted by molecular distillation. IOP Conf. Ser. Earth Environ. Sci. 2021, 924, 012008. [Google Scholar] [CrossRef]
  24. Nurjanah, S.; Rialita, T.; Lembong, E.; Muhaemin, M.; Widyasanti, A.; Sidabutar, I.; Aprima, Z.E.; Amrullah, R. Isolation of guaiene from patchouli (Pogostemon cablin Benth.) oil using vacuum fractionation distillation. IOP Conf. Ser. Earth Environ. Sci. 2020, 443, 012094. [Google Scholar] [CrossRef]
  25. Berk, Z.; Berk, Z. Chapter 13—Distillation. In Food Process Engineering and Technology; Elsevier: Amsterdam, The Netherlands, 2009; pp. 295–315. [Google Scholar]
  26. Foust, A.S.; Wenzel, L.A.; Clump, C.W.; Maus, L.; Andersen, L.B. Principles of Unit Operations; John Wiley & Sons: Hoboken, NJ, USA, 2009. [Google Scholar]
  27. Carley, K.M.; Kamneva, N.Y.; Reminga, J. Response Surface Methodology: CASOS Technical Report. Network 2004, 2, 128–149. [Google Scholar] [CrossRef]
  28. Wang, R.; Wang, R.; Yang, B. Extraction of essential oils from five cinnamon leaves and identification of their volatile compound compositions. Innov. Food Sci. Emerg. Technol. 2009, 10, 289–292. [Google Scholar] [CrossRef]
  29. Belhachat, D.; Mekimene, L.; Belhachat, M.; Ferradji, A.; Aid, F. Application of response surface methodology to optimize the extraction of essential oil from ripe berries of Pistacia lentiscus using ultrasonic pretreatment. J. Appl. Res. Med. Aromat. Plants 2018, 9, 132–140. [Google Scholar] [CrossRef]
  30. Mohamed, O.A.; Masood, S.H.; Bhowmik, J.L. Mathematical modeling and FDM process parameters optimization using response surface methodology based on Q-optimal design. Appl. Math. Model. 2016, 40, 10052–10073. [Google Scholar] [CrossRef]
  31. Sidabutar, I.J.; Widyasanti, A.; Nurjanah, S.; Nurhadi, B.; Rialita, T.; Lembong, E. Kajian Rasio Refluk pada Isolasi Beberapa Senyawa Minyak Nilam (Pogestemon cablin Benth) dengan Metode Destilasi Fraksinasi. J. Ilm. Rekayasa Pertan. Dan Biosist. 2020, 8, 71–78. [Google Scholar] [CrossRef]
  32. Engelen, A.; Sugiyono; Budijanto, S. Optimasi Proses dan Formula pada Pengolahan mi Sagu Kering. Agritech 2015, 35, 359–367. [Google Scholar] [CrossRef]
  33. Hutching, J.B. Food Color and Appearance, 2nd ed.; Aspen Pub.: Frederick, MD, USA, 1999; p. 1999. [Google Scholar]
Figure 1. Experimental setup of B/R instrument, model 36-100.
Separations 10 00469 g001
Figure 2. Composition of α-guaiene, δ-guaiene, and patchouli alcohol in each fraction, Notes: F1 = first fraction, F2 = second fraction, F3 = third fraction, F4 = fourth fraction, F5 = fifth fraction, R = residue.
Separations 10 00469 g002
Figure 3. (a) The normality curve of α-guaiene relative peak area of fraction 1 response; (b) the residuals versus predicted using Design Expert software version 13.
Separations 10 00469 g003
Figure 4. (a) Interaction of feed volume (A) and applied run pressure (C); (b) Interaction of reflux ratio (B) and feed volume (A); (c) Interaction of reflux ratio (B) and applied run pressure (C) on percentage relative peak area α-guaiene of fraction 1, using Design Expert software version 13.
Separations 10 00469 g004
Figure 5. Contour graph of relative peak area of α-guaiene of F1 as a function of (a) feed volume (A) and applied run pressure (C); (b) reflux ratio (B) and feed volume (A); and (c) the ratio of reflux (B) and applied run pressure (C), using Design Expert software version 13.
Separations 10 00469 g005
Table 1. Literature on α-guaiene and δ-guaiene constituent of P. cablin Benth.
Distillation methodα-Guaiene (%)δ-Guaiene (%)References
Steam distillation 21.534.6[9]
Steam distillation15.616.7[10]
Steam distillation15–21.513.0–34.6[11]
Pressurized liquid extractions1.66–10.230.85–12.51[7]
Steam distillation20.6216.18[12]
Hydrodistillation23.321.4[13]
Hydrodistillation3.17–22.29.86–20.3[14]
Hydrodistillation3.4–9.45.2–14.4[15]
Fractional distillation16.61–18.1020.08–21.45[16]
Table 2. Level and code of independent variables of the Box–Behnken design.
Variable IndependentLevel
Low (−1)Medium (0)High (1)
A: Feed volume (mL)75100125
B: Reflux ratio10:120:130:1
C: Applied run pressure (mmHg)51015
Table 3. The result of Box–Behnken design.
RunFactor 1
A: Feed Volume
(mL)
Factor 2
B:
Reflux Ratio
Factor 3
C: Applied Run Pressure
(mmHg)
Response
Relative Peak Area α-Guaiene of Fraction 1 (%)
1100301545.74
2100101544.08
375301046.00
4100201545.31
5125201546.20
6100201045.71
712520545.37
8100201044.62
975201546.48
10125301046.02
117520545.17
1210010543.42
13125101044.14
14100201046.31
1510030544.87
16100201045.41
1775101044.32
Table 4. Composition of Crude Patchouli Oil.
No.RTRelative Peak Area (%)Chemical CompoundMolecular
Formula
Molecular Weight (mol)
Sesquiterpene hydrocarbons
118.8033.21β-PatchouleneC15H24204.351
222.6690.69CycloseychelleneC15H24204.351
324.63019.33α-GuaieneC15H24204.351
424.4465.12α-PatchouleneC15H24204.351
526.6549.49SeychelleneC15H24204.351
627.4530.98PatchouleneC15H24204.351
728.4130.52HumuleneC15H24204.351
828.6310.65Germacrene-bC15H24204.351
930.3642.74AciphylleneC15H24204.351
1031.11619.25δ-GuaieneC15H24204.351
1133.2430.6β-GurjureneC15H24204.351
1248.5550.32Isolongifolene,9,10-dehydroC15H22202.330
1349.0840.84AciphylleneC15H24204.351
1449.4730.21trans-CaryophylleneC15H24204.351
1549.7380.281,8-dimethyl-5-propane-2-ylidenetricyclo [5.3.0.04,8] decaneC15H24204.351
Oxygenated hydrocarbon
1648.3790.69NorpatchoulenolC14H22O206.320
1749.35932.04Patchouli alcoholC15H26O222.000
1849.5300.55Germacra-4(15),5,10(14)-trien-1β-olC15H24O220.351
1949.8212.27PogostolC15H26O222.366
2050.5940.23RotundoneC15H22O218.335
Table 5. ANOVA for quadratic model.
SourceSum of SquaresdfMean SquareF-Valuep-Value
Model10.8191.204.820.0251significant
A-feed volume0.007210.00720.02890.8699non-significant
B-reflux ratio5.5615.5622.310.0021significant
C-applied run pressure1.511.56.000.0441significant
AB0.010010.01000.04010.8469non-significant
AC0.057610.05760.23110.6454non-significant
BC0.011010.01100.04420.8394non-significant
A21.0011.004.020.0850non-significant
B22.6112.6110.450.0144significant
C20.161810.16180.64900.4470non-significant
Residual1.7470.2493
Lack of Fit0.262740.06570.13290.9597non-significant
Pure Error1.4830.4940
Cor Total12.5516
Table 6. Fit statistic of the response of percentage relative peak area α-guaiene of fraction 1.
ParameterValue
Std. Dev.0.4993
Mean45.25
C.V. %1.10
R20.8610
Adjusted R20.6823
Predicted R20.6523
Adequate Precision7.9217
Table 7. Coefficients of polynomial equation of the response of relative peak area α-guaiene of fraction 1.
FactorCoefficient EstimatedfStandard Error95% CI Low95% CI HighVIF
Intercept45.4710.243944.8946.04
A-feed volume−0.030010.1765−0.44740.387410.00
B-reflux ratio0.833810.17650.41641.2510.00
C-applied run pressure0.412310.16830.01430.81021.02
AB0.050010.2496−0.54030.640310.00
AC−0.120010.2496−0.71030.470310.00
BC0.052510.2496−0.53780.642810.00
A20.489010.2439−0.08771.071.01
B2−0.788510.2439−1.37−0.21181.01
C2−0.196510.2439−0.77320.38021.01
Notes: df = degree of freedom, CI = confidence interval, VIF = variance inflation factor.
Table 8. The design target optimization of α-guaiene of fraction 1.
Component Variable and ResponseTargetLower LimitUpper Limit Importance
Feed volume (mL)In range751253
Reflux ratioIn range10303
Applied run pressure (mmHg)In range5153
Relative peak area of α-guaiene of fraction 1 (%)Maximize43.4246.485
Table 9. Desirability optimization of the response of α-guaiene of fraction 1.
NoFeed
Volume
Reflux RatioApplied Run Pressure α-Guaiene
of F1
Desirability
175.46823.61814.80346.4931.000Selected
275.49323.52714.93946.4941.000
375.75426.36814.58746.4861.000
............
7975.29725.48213.92346.4841.000
Notes: ”..” Indicate that there are other process condition number 4 up to number 78 with the same desirability.
Table 10. Confirmation of RSM optimal solution and model validation.
ResponsePredictedActual 95% CI Low for Mean95% CI High for MeanStd. DeviationValidation (%)
Relative peak area of α-guaiene of fraction 1(%)46.4944.4743.3949.590.4996.14
Notes: CI = Confidence Interval.
Table 11. Yield α-guaiene-enriched fraction 1.
RunFeed VolumeReflux RatioApplied Run Pressure Yield α-Guaiene-Enriched Fraction 1 (% Mass)
1100301510.3
2100101510.84
375301016.6
4100201014.13
512520158.98
6100201020.16
712520510.15
810020109.19
975201514.72
10125301014.54
117520510.45
121001055.61
13125101014.43
14100201018.09
151003058.58
16100201011.85
177510108.14
Optimum α-guaiene 752414.815.92
Table 12. Composition of optimum-α-guaiene-enriched fraction 1.
SI No.RTArea (%)Chemical
Compound
Molecular FormulaMolecular Weight (mol)
Sesquiterpene hydrocarbons
117.7760.33δ-ElemeneC15H24204.351
218.22711.98β-PatchouleneC15H24204.351
319.0780.1818-Norabieta-8,11,13-trieneC19H28256.425
420.8580.173,5,11-Eudesmatriene C15H22202.335
521.9842.36CycloseycelleneC15H24204.351
622.9960.21CycloisolongifoleneC15H24204.351
723.3690.22β-ElemeneC15H24204.351
821.12744.47α-GuaieneC15H24204.351
925.8137.54α-PatchouleneC15H24204.351
1026.05215.54Seychellene C15H24204.351
1126.4930.14γ-ElemeneC15H24204.351
1226.7831.49Patchoulene C15H24204.351
1327.4160.13α-SelineneC15H24204.351
1427.7380.76HumuleneC15H24204.351
1527.9450.371H-BenzocyclohepteneC15H24204.351
1628.0180.22CaryophylleneC15H24204.351
1729.2370.36aR-HimachaleneC15H22202.330
1829.6631.49AciphylleneC15H24204.351
1929.8242.50γ-GurjuneneC15H24204.351
2030.3958.27δ-GuaieneC15H24204.351
2148.5180.06AristoledieneC15H22202.330
2248.6840.05Silphiperfola-4,7(14)-dieneC15H22202.330
2348.8300.05Aromadendrene, dehydroC15H24204.351
2449.5090.08SolavetivoneC15H22202.330
2549.6700.05δ-GuaieneC15H24204.351
Oxygenated hydrocarbons
2643.3870.24Caryophyllene oxideC15H24O220.350
2748.2230.10β-Caryophyllene oxideC14H22O206.320
2849.1570.57Patchouli alchohol C15H26O222.000
Miscellaneous
2949.8990.062-[1-(4-Methoxy-phenyl)-1H-tetrazol-5-ylsulfanylmethyl]-1H-benzoimidazoleC16H14N6OS308.370
Table 13. Refractive index, specific gravity, and color of α-guaiene fraction 1, crude and optimum.
RunColor Parameters Chromaticity
L *a *b *CHRefractive IndexSpecific Gravity
17.61−0.853.093.20105.311.5010.925Yellow
25.46−0.833.453.55103.461.4990.926Yellow
314.24−2.5313.3813.62100.731.4980.930Yellow
417.97−2.3716.0316.2098.411.4980.925Yellow
514.50−2.1014.5114.6698.251.4980.921Yellow
612.95−1.3013.9013.9695.341.4990.921Yellow
713.20−2.1614.4914.6598.471.4980.919Yellow
89.86−1.006.536.6198.691.4990.917Yellow
99.26−1.428.648.7599.361.4980.913Yellow
1014.61−1.8616.0816.1996.591.4990.903Yellow
1111.82−2.2111.1711.38101.171.4980,920Yellow
124.42−1.233.673.87108.441.4980.919Yellow
1314.41−2.0713.9314.0998.461.4990.920Yellow
1412.18−1.3011.8111.8996.281.4990.923Yellow
1510.38−1.989.279.48102.071.4980.920Yellow
1611.11−1.9610.7610.94100.281.4990.920Yellow
178.42−1.826.977.20104.651.4980.919Yellow
Crude PO2.904.102.794.9634.211.5060.974Red
Optimum α-guaiene8.46−1.064.354.44103.701.4990.918Yellow
Notes: PO = Patchouli oil, L * is symbol for perceptual lightness or lightness value, a * is symbol for relative to the green–magenta opponent colors or redness value, b * is symbol for represents the blue–yellow opponents color or yellowness value.
Disclaimer/Publisher’s Note: The statements, opinions and data contained in all publications are solely those of the individual author(s) and contributor(s) and not of MDPI and/or the editor(s). MDPI and/or the editor(s) disclaim responsibility for any injury to people or property resulting from any ideas, methods, instructions or products referred to in the content.

