Article

Application of a Quality by Design Approach to Develop a Simple, Fast, and Sensitive UPLC-MS/MS Method for Quantification of Safinamide, an Antiparkinson’s Drug, in Plasma

1
Department of Pharmaceutical Chemistry, College of Pharmacy, King Saud University, Riyadh 11451, Saudi Arabia
2
Department of Pharmaceutics, College of Pharmacy, King Saud University, Riyadh 11451, Saudi Arabia
*
Author to whom correspondence should be addressed.
Separations 2023, 10(9), 474; https://doi.org/10.3390/separations10090474
Submission received: 30 June 2023 / Revised: 10 August 2023 / Accepted: 21 August 2023 / Published: 28 August 2023
(This article belongs to the Section Chromatographic Separations)

Abstract

:
Safinamide is an orally active, selective monoamine oxidase-B inhibitor with dopaminergic and non-dopaminergic properties approved by the European Medicine Agency and US Food and Drug Administration for the treatment of mid- to late-stage fluctuating Parkinson’s disease (PD) used in combination with other PD medications such as levodopa. In this study, an analytical quality by design (AQbD) approach was applied to optimize an LC-MS/MS bioanalytical method to determine safinamide in human plasma. A full 33 factorial design was used to optimize safinamide separation conditions, with a method first screened and optimized using chromatographic responses, including peak area and retention time. The results showed that temperature had a significant indirect effect on retention time and peak area (p < 0.05), while ammonium acetate concentration had an insignificant indirect impact on peak area or retention time. However, the temperature was significantly agonistic to the effect of buffer concentration (p < 0.05). The resultant optimized chromatography conditions utilized 9.0 mM ammonium acetate buffer and acetonitrile (22.0:78.0) as mobile phases at a column temperature of 23.2 °C. The assay was linear from 0.1–1000 ng/mL, met acceptance criteria for inter- and intra-assay precision and accuracies across three quality controls, and was successfully applied to in vitro microsomal metabolic stability. The UPLC/MS/MS method was found to be adequately sensitive and suitable for routine safinamide pharmacokinetic studies.

1. Introduction

Safinamide is a novel medication used as an adjunctive medication to carbidopa/levodopa for patients suffering from Parkinson’s disease (PD) and motor fluctuations in the mid-to-late stage. The European Medicines Agency was the first authority to approve and register safinamide [1,2] followed by the US Food and Drug Administration (FDA) [1,3]. The mechanism of action of safinamide involves selective monoamine oxidase-B inhibition, modulation of glutamate release [4], sodium channel blockade, and calcium channel modulation [5]. In patients with idiopathic PD, safinamide is safe and effective in improving motor complications [6,7]. It can be considered a useful option for early stage patients to delay the onset of motor and non-motor complications for levodopa-sparing strategy [8,9]. Motor symptoms and parkinsonism improve with safinamide without worsening dyskinesia [10,11]. These effects are dose-dependent [12].
Safinamide is an anticonvulsant effective in various seizure models with a low potential to induce tolerance and locomotor or cognitive side effects [8]. Administration with L-dopa in patients with PD and motor fluctuations significantly increases total on time with no or non-troublesome dyskinesia, decreases off time, and improves parkinsonism, indicating that it improves motor symptoms and parkinsonism without worsening dyskinesia [13,14]. The effects of safinamide on dyskinesia are attributed mainly to sodium channel inhibition and glutamate release stimulation rather than reduced dopaminergic stimulation [15].
A pharmacokinetic-pharmacodynamic study found that safinamide reversibly inhibited the MAO-B enzyme in a dose-dependent manner. This, in turn, prevented dopamine bioinactivation in patients suffering from Parkinson’s disease [16,17]. Safinamide is metabolized via oxidation to an inactive metabolite and is excreted primarily through the urine. Safinamide absorption is linear and dose-dependent, and the half-life is about 22 h. However, it is cleared without any clinical accumulation at a steady state [17]. After a single dose, the maximum concentration is achieved at 2 h, while after a repetitive dose, the concentration peak is reached at 5–6 h. It is 89% plasma protein bound.
Drug–drug interactions may affect the safety or efficacy of other drugs and can improve or change the systemic exposure of the drug. Ketoconazole has no significant changes in safinamide exposure. The concurrent administration of safinamide with some antidepressant drugs in PD patients seemed to be safe and well tolerated [18]. However, some antiepileptic drugs, such as carbamazepine and phenobarbital, decrease safinamide plasma concentration and shorten the half-life [19,20,21]. On the other hand, safinamide does not affect the plasma concentrations of these drugs. Safinamide also does not affect oral tyramine, which is metabolized mostly by intestinal MAO-A, while safinamide inhibits monoamine oxidase (MAO)-B only [22]. It has been shown that safinamide has direct effects on pain relief and reduces the average individual’s use of pain treatment [23].
The concept of quality by design (QbD) in the pharmaceutical industry has been introduced to enhance robust manufacturing processes. It is also applied in analytical methods that are applicable throughout the product lifecycle, as well as in drug quality control [24,25]. Analytical quality by design (AQbD) helps in the development of a robust and cost-effective analytical method that facilitates regulatory flexibility [26,27].
Therefore, ICHQ introduces the AQbD approach as a trend in the pharmaceutical industry involving the implementation of AQbD in the method development process as a part of risk management, pharmaceutical development, and the pharmaceutical quality system [28,29].
Therapeutic monitoring of safinamide may be useful in certain patients such as those who are not achieving optimal clinical outcomes. Few methods were published for the quantitation of safinamide in plasma. Dal Bo et al. [30] describe methods of safinamide quantitation using micro-bioassay. The first one is relatively sensitive and with low margin (0.5–20 ng/mL) and long retention time (5.5 min). The second is characterized by high margin (6000 ng/mL) and low sensitivity (20 ng/mL). The third method was performed using a fluorescent detector and was less sensitive, with a long retention time (16 min). Safinamide pharmacokinetics was studied using LC-MS/MS method with a sensitivity of 0.5 ng/mL, but no details of the analytical method were mentioned [17] The aim of the present work was designed to develop a fast, sensitive method applying an analytical by design approach. A design of experiments was used to investigate the effects of column temperature, different concentrations of ammonium acetate and different percentage of acetonitrile in the mobile phase (independent factors) on the analytical responses including chromatographic separation retention time and peak area. The chromatographic separation method was applied in the assessment of safinamide in vitro metabolic stability.

2. Materials and Methods

2.1. Chemicals and Reagents

Safinamide (>99.0% purity) was procured from Beijing Mesochem Technology Co., Ltd. (Beijing, China). Ethyl acetate and ammonium acetate were obtained from BDH Laboratory (Lutterworth, UK), while diclofenac (internal standard, IS) was generously provided by ADWIA Co., Cairo, Egypt. HPLC-grade methanol and acetonitrile were acquired from Avonchem Ltd. (Macclesfield, UK). Analytical-grade dimethyl sulfoxide (DMSO) was sourced from Loba Chemie Pvt. Ltd. (Mumbai, India). Human plasma was kindly obtained from the Blood Bank of King Khalid University Hospital in Riyadh, Saudi Arabia.

2.2. Instruments

Waters Acquity TQD UPLC-MS/MS (Waters Co., Milford, MA, USA) Troemner vortex mixer, Taboys® model AP 56, HenryTroemner LLC (Thorofare, NJ, USA), analytical balance Mettler Toledo® model XS 205 (Greifensee, Switzerland) were used. Thermo® Savant SC210A speed Vac (Waltham, MA, USA) sample concentrator. Deionized water was prepared via Milli-Q reverse osmosis (Millipore®, Bedford, MA, USA). NADPH purchased from Enzo Life Sciences (London, UK) diethyl ether, ethyl acetate, n-hexane, methanol and acetonitrile were obtained from Avonchem Ltd. (Wellington House, Cheshire, UK).

2.3. Method

A Quality by Design (QbD) approach was used to identify the factors that have the most significant impact on the chromatographic separation and quantification of safinamide. A working solution of 500 ng/mL of safinamide in methanol was used in the QbD analytical procedures. Three independent factors were investigated, column temperature, percent of the solvent (acetonitrile) in the mobile phase and the concentration of ammonium acetate in the buffer used in the preparation of the mobile phase. A 33 full factorial experimental design was used to characterize the effects of the two independent factors. Using Design Expert® software, version 11, each independent factor was assigned to three levels: low, mean, and high, which were represented by the values of −1, 0, and +1, respectively. A randomized design was used to evaluate the effect of the three independent factors on the peak area and peak retention time. Only one factor was varied at a time (one-variable-at-a-time analysis) while the other variables were kept constant [31]. The experimental design resulted in 27 groups, and three replicates were analyzed. Table 1 shows the design for the analytical procedure of safinamide using UPLC-MS/MS, including the dependent and independent factors. All results were expressed as mean values ± standard deviation. One-way analysis of variance (ANOVA) was used in the statistical analysis and a p-value of less than 0.05 was considered significant.

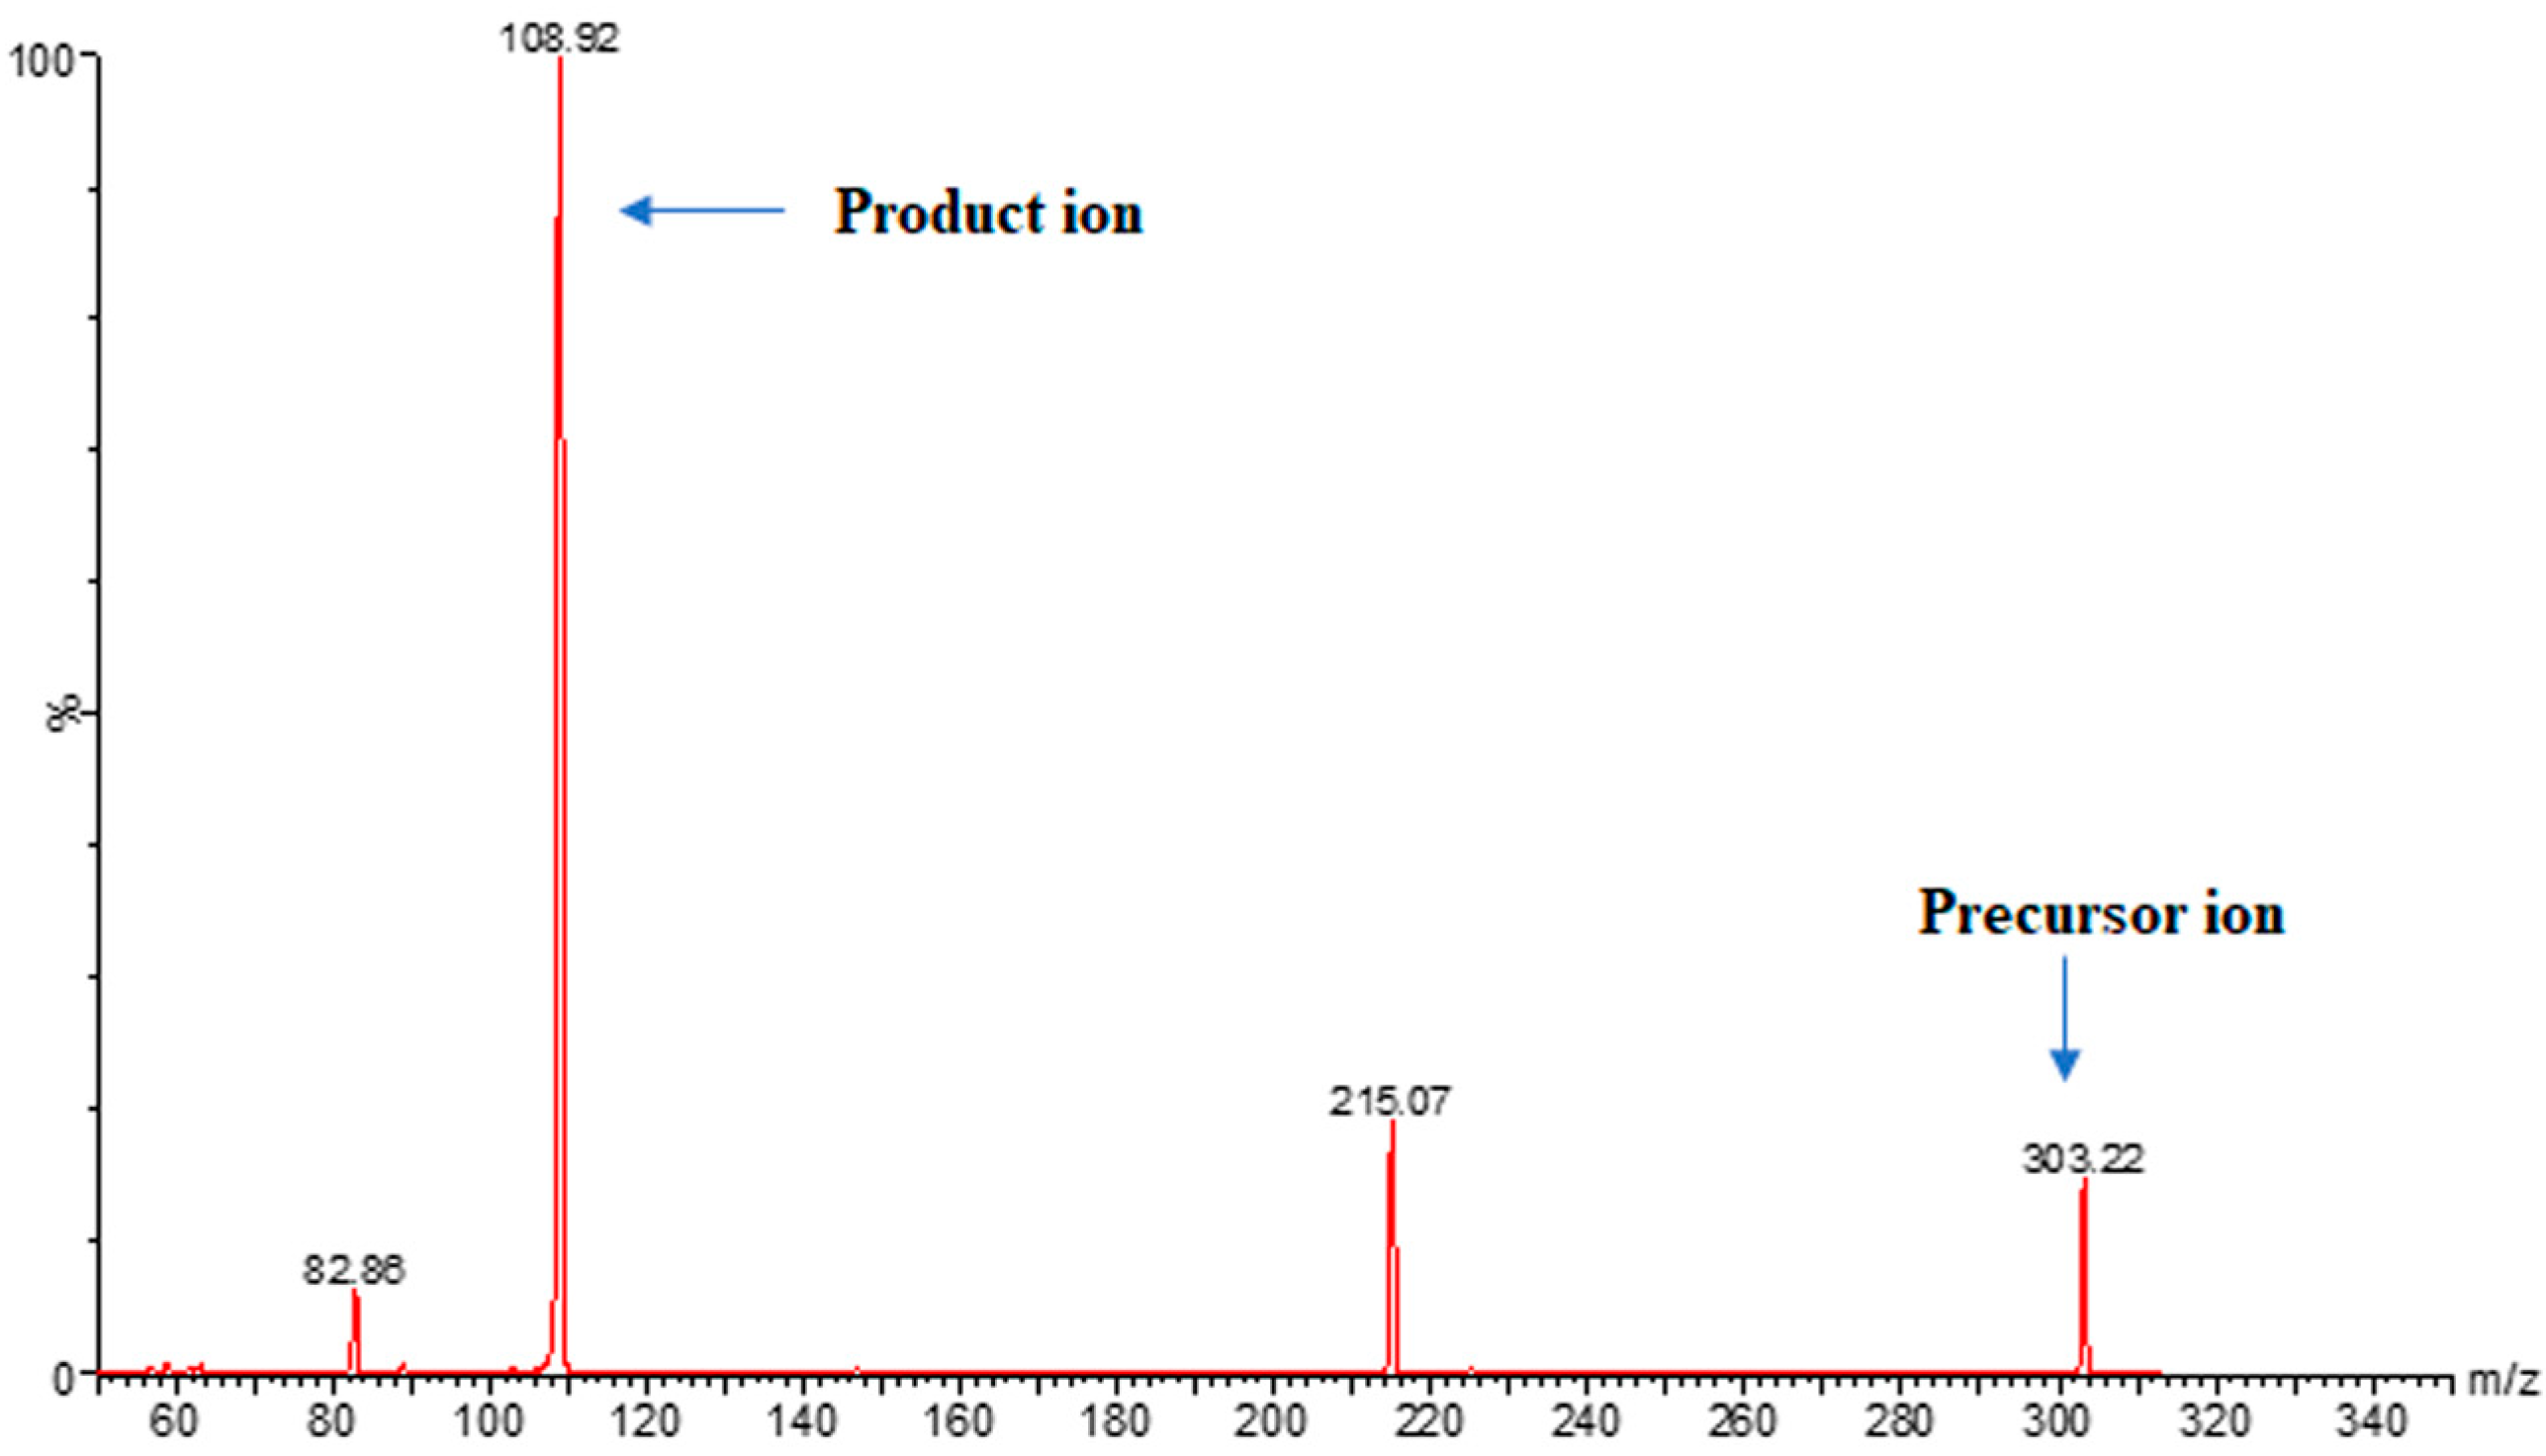
2.3.1. Optimization of MS/MS Conditions

The optimization of MS/MS conditions is crucial for the accurate and sensitive determination of the analyte and internal standard. In this study, the Acquity TQD UPLC-MS/MS instrument was used with an ESI source in positive ion mode. The instrument parameters, including the precursor to product ion transition, collision energy, cone voltage, and dwell time, were optimized for the determination of safinamide and IS. The source temperature was adjusted at 150 °C and the capillary voltage was maintained at 4 KV. The collision gas (argon) flow rate was kept at 0.2 mL/min, and the desolvation gas flow rate was optimized at 600 L/h. For optimization of mass spectrometry conditions, standard solutions of safinamide and IS (500 ng/mL) were directly injected into the instrument. Higher sensitivity was found with using positive mode ionization. The multiple reaction monitoring mass spectrometry (MRM) technique was used, and the ESI was adjusted in the positive mode to monitor the precursor, as well as the product ions. Precursor ions [M + H]+ were monitored at m/z 303.04 > 109.0 for safinamide and m/z 296.06 > 215.0 for IS. The instrument operated by the MassLynxTM program and TargetLynax software, version 4.1, was used for data acquisition. Chromatographic separation was achieved using the Acquity UPLC CSH C18 (1.7 µm 2.1 × 100 mm) column (Waters, Milford, MA, USA). This column was chosen after trying different stationary phases and dimensions to provide rapid analytical techniques with improved resolution within a shorter time.

2.3.2. Stock Solutions, Calibration Standards, and Quality Control (QC) Samples

Stock solutions of safinamide (1 mg/mL) and IS (1 mg/mL) were prepared by dissolving suitable amounts in DMSO. These stock solutions were further serially diluted with acetonitrile/water (50:50 v/v) to prepare the working solutions. Appropriate amounts were spiked to drug-free human plasma to achieve different concentrations of calibration curves (0.1, 0.5, 1.0, 5.,10.0, 20.0, 50.0, 100.0, 500.0, and 1000.0 ng/mL), as well as quality control (QC) samples (0.3, 15.0, 150.0, 750.0 ng/mL). The stock of QC samples was kept in an ultra-freeze (−80 °C). Safinamide and IS working solutions were stored in the refrigerator.

2.3.3. Sample Preparation

To 100 µL of calibrators and QCs samples, 10 µL of IS working solution (20 µg/mL) was added and then mixed with a vortex mixer for 10 s. A total of 50 µL of acetonitrile was added to the tubes and mixed again with a vortex mixer for 1 min. To each tube, 1 mL of ethyl acetate was added and then mixed using a vortex mixer for 30 s and centrifuged at 10,000× g and 8 °C for 10 min. The upper organic layer was then transferred to a clean tube and evaporated to dryness using a vacuum speed concentrator adjusted at 40 °C. The dried extracts were reconstituted with a 100 µL mobile phase and 5 µL was injected into UPLC-MS/MS instrument.

2.4. Method Validation

The method was validated according to the US FDA [32] and ICH 10 [33] guidelines for bioanalytical method validation. The assay was validated for selectivity and specificity, accuracy, precision, linearity, matrix effect, recovery, and stability

2.4.1. Specificity and Selectivity

Method selectivity was evaluated via analysis of blank plasma of six different sources to investigate if there is any peak at the same retention time and the conditions of safinamide and IS separations. To evaluate the specificity of the method, chromatograms of plasma samples spiked with safinamide at the LLOQ concentration level were compared with the chromatograms of those of blank plasma samples obtained from six different sources along with IS.

2.4.2. Linearity, LLOD, LLOQ

Samples of the plasma calibration curves (10 different concentrations including the LLOQ) of safinamide were analyzed. The peak area ratio (safinamide/IS) was plotted against safinamide plasma concentration. The linearity of the calibration curves was determined using the least square method.
The limit of detection (LLOD) is defined as the concentration of an analyte yielding a peak with a signal-to-noise ratio of 3, while this ratio is 5 times the low limit of quantification (LLOQ).

2.4.3. Extraction Recovery and Matrix Effect

Due to the wide range of the calibration curve, four levels of QC samples were used (High QC. [HQC], Middle QC_1 [MQC_1], Middle MQC_2 [MQC_2], and Low QC [LQC]).
Recovery of the method was evaluated by comparing the peak area obtained from plasma samples spiked pre-extraction with that spiked post-extraction with the same concentration level (n = 6). Similarly, the recovery of the IS was also determined at a concentration level of 500 ng/mL. The matrix effect was evaluated at the same level of QCs used in the evaluation of extraction recovery. The peak area obtained for safinamide following the analysis of samples spiked post-extraction was compared with those of standard safinamide prepared directly in acetonitrile at the same concentrations.

2.4.4. Precision and Accuracy

Four QC samples (HQC, MQC_1, MQC_2, LQC) and LLOQ were analyzed in six replicas in one day and in three successive days to assess precision (relative standard deviation, CV%) and accuracy to evaluate intra-day and inter-day precision and accuracy, respectively. The acceptable accuracy and precision were expected to be within ±15% for QCs samples and ±20% for the LLOQ.

2.4.5. Stability

For evaluation of safinamide plasma stability, six replicates of the OCs (Meduin QC_1, and HQC) under different conditions of storage and processing (short-and long-term, freeze–thaw, and auto-sampler stability) were analyzed. The short-term stability was evaluated in LQC and HQC plasma samples after leaving it for 8 h, which represents the maximum time of sample processing, at room temperature (23 °C). The freeze–thaw stability was evaluated using QC plasma samples after three cycles of thaw at room temperature and freeze at −80 °C, respectively. The long-term stability was assessed by analyzing QC plasma samples after storage for 4 weeks at −80 °C. After storage of reconstituted QC samples for 24 h in an autosampler, it was reinjected to evaluate the autosampler stability after this period. According to the acceptance criteria of the applied bioanalytical guidelines, QC samples were considered stable when their value after analysis was ±15% for accuracy and ≤15% for the precision of the nominal value.

2.5. Metabolic Stability

Following the preparation of a safinamide solution in DMSO (1 mg/mL), a working solution of safinamide (10 µg/mL) was prepared in the mobile phase. From this working solution, standard calibration curves in the range of 0.1–1000 ng/mL were constructed between safinamide concentration and peak area.
For the study of safinamide metabolic stability, another working solution of safinamide (800 µg/mL) in phosphate buffer (pH = 7.4) was prepared. To 10 µL of safinamide (800 µg/mL), 450 µL of 0.1 M phosphate buffer (pre-warmed, 37 °C) was added and followed by a 25 µL of 20 mM NADPH solution in phosphate buffer. Incubations were initiated by 10 µL of microsomes and the tubes were kept shaken at 37 °C. To terminate the reaction, 250 µL of acetonitrile containing IS (100 ng/mL) was added at different time intervals (0.0, 0.5, 10.0, 20.0, 30.0, and 40.0 min). The tubes were centrifuged for 5 min at 10,500× g and 10 °C. The supernatant was transferred into the Eppendorf tube. Then, 5 µL of each sample was injected into the UPLC-MS/MS. After analysis, the curve was plotted between the concentration of safinamide representing the percentage remaining (calculated using the regression equation of the calibration curve) versus incubation time. From this curve, another one was plotted between the logarithm (Ln) of the concentration of the points of the linear part of the first curve against its time intervals. The slope of the linear regression represents the metabolic half-life (t1/2) calculated from the slope of the linear regression using Equation (1). The intrinsic clearance was calculated using Equation (2) [34,35]:
I n   v i t r o 1 2 = l n 2 S l o p
C L   i n t = 0.693 i n   v i t r o   t 1 / 2 .   μ L   i n c u b a t i o n m g   m i c r o s o m e s

3. Results

For the optimization of mass spectrometry conditions, standard solutions of safinamide and IS (500 ng/mL) were directly infused into the MS/MS instrument. Higher sensitivity was found with using positive mode ionization. The multiple reaction monitoring mass spectrometry (MRM) technique was used, and electrospray ionization (ESI) was adjusted in the positive mode to monitor the precursor, as well as the product ions. Precursor ions [M + H]+ were monitored at m/z 303.04 > 109.0 for safinamide and m/z 296.06 > 215.0 for diclofenac [Figure 1].

3.1. Optimization of the Chromatographic Separation Conditions

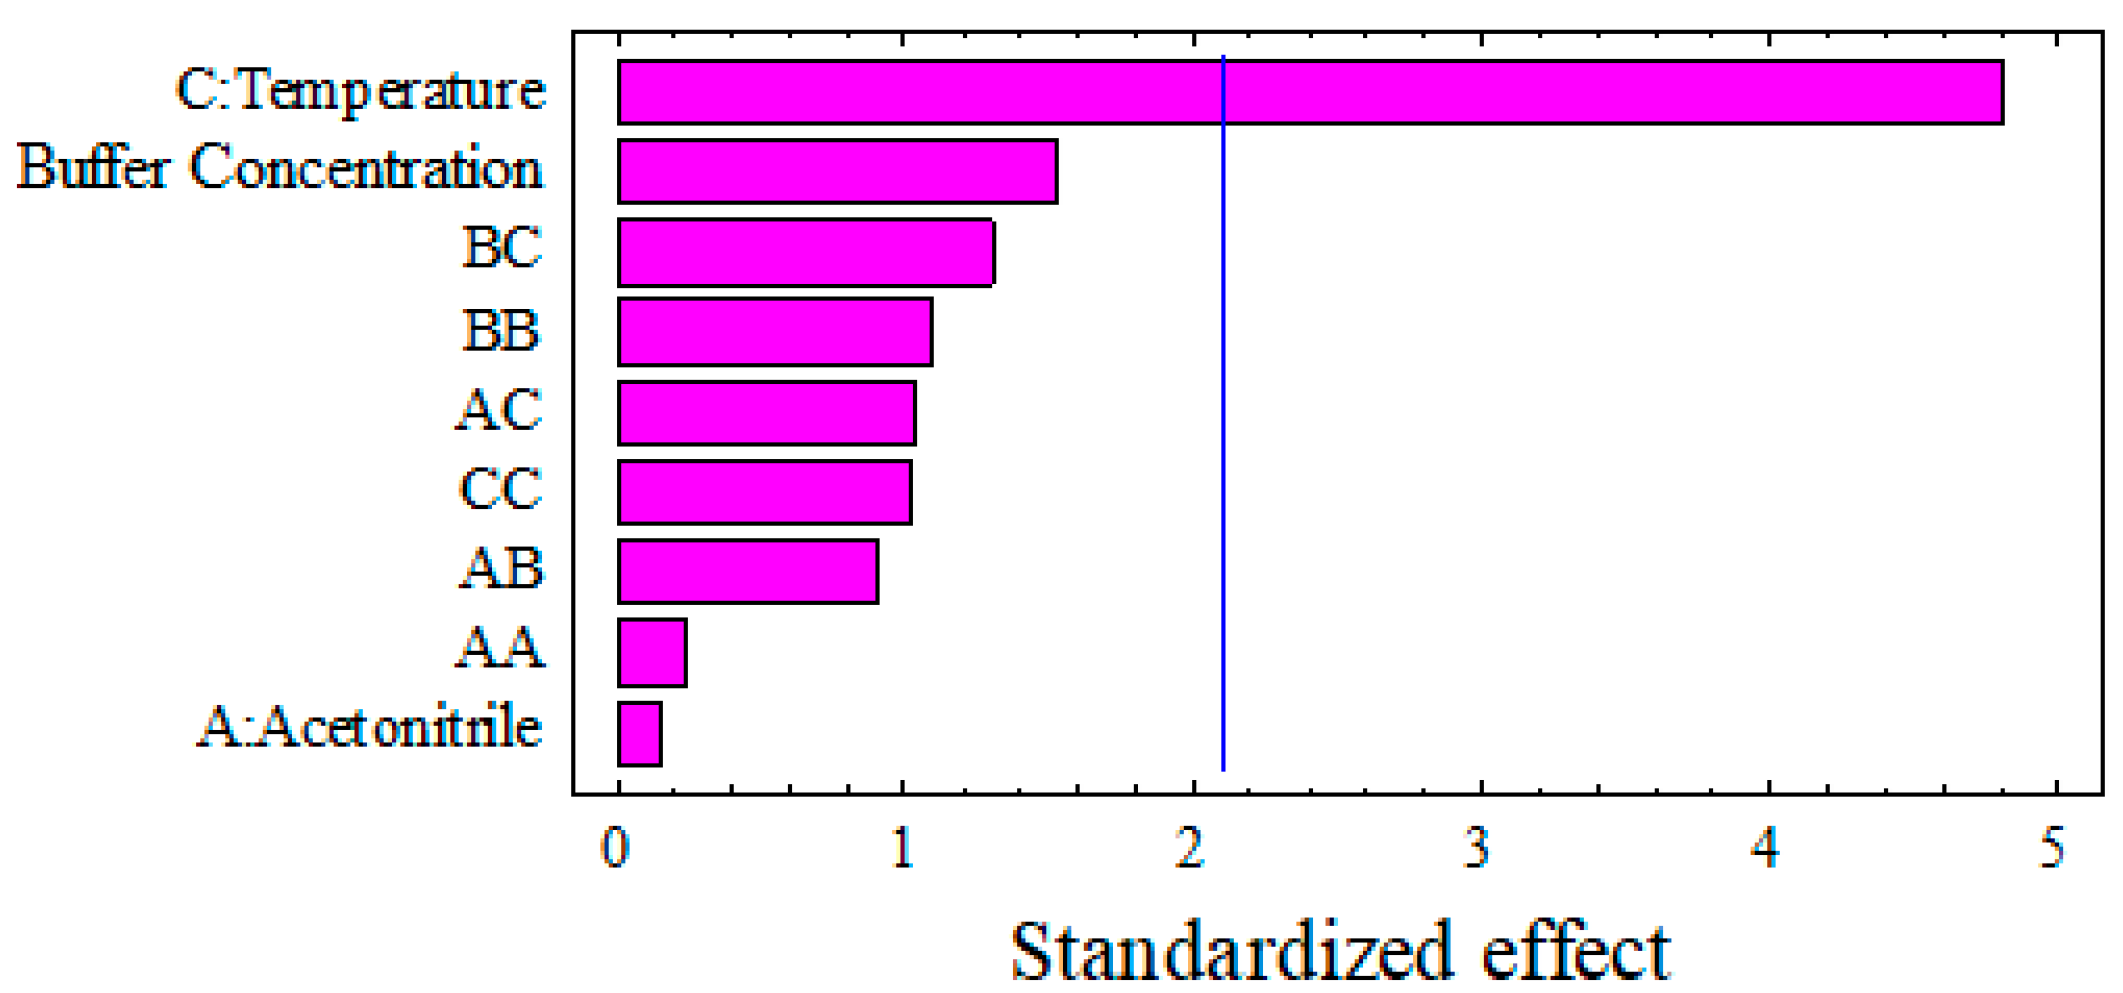
3.1.1. The Effect of the Independent Factors on the Retention Time of the Safinamide Chromatogram

The analysis of the variance table (Table 2) shows that the temperature alone and the interactive of the temperature and buffer concentration of the mobile phase have a significant antagonistic effect on the retention time of the safinamide chromatogram (p value < 0.0269 and 0.0399, respectively). Increasing the column temperature from 20 °C to 40 °C reduces the retention time of the safinamide chromatogram, and the shortest recorded retention time was at 35 °C. The decrease in retention time with the increase of the temperature from 20 °C to 37 °C may be due to a decrease in the viscosity of the mobile phase with the raising temperature (Figure 2). However, an increase in retention time for the column temperature upper than 37 °C to 40 °C can be attributed to the decrease in column efficiency as a result of the decrease in the number of theoretical plates as temperature increased above 37 °C [36].
It is evident that temperature is a significant factor affecting the effect of buffer concentration (B) on retention time (p < 0.0339). The interactive effects of temperature and the percentage of acetonitrile in the mobile phase were insignificant (p > 0.4683). Generally, the independent, quadratic, and interaction factors CC, AA, A, AC, B, BB, and AB do not significantly affect the chromatographic retention time in descending order (Figure 2).
The 3D response plot shows that retention time decreases with increasing temperature and reaches its shortest value at around 35 °C, after which it slightly increases up to 40 °C. Furthermore, increasing the percentage of acetonitrile decreases the retention time, reaching its lowest value of 1.09 min, and then increases as acetonitrile concentration is further increased. In addition, elevating the buffer concentration in the mobile phase decreases the retention time, and the lowest value was recorded at about 10 mM of the acetate buffer (Figure 3).

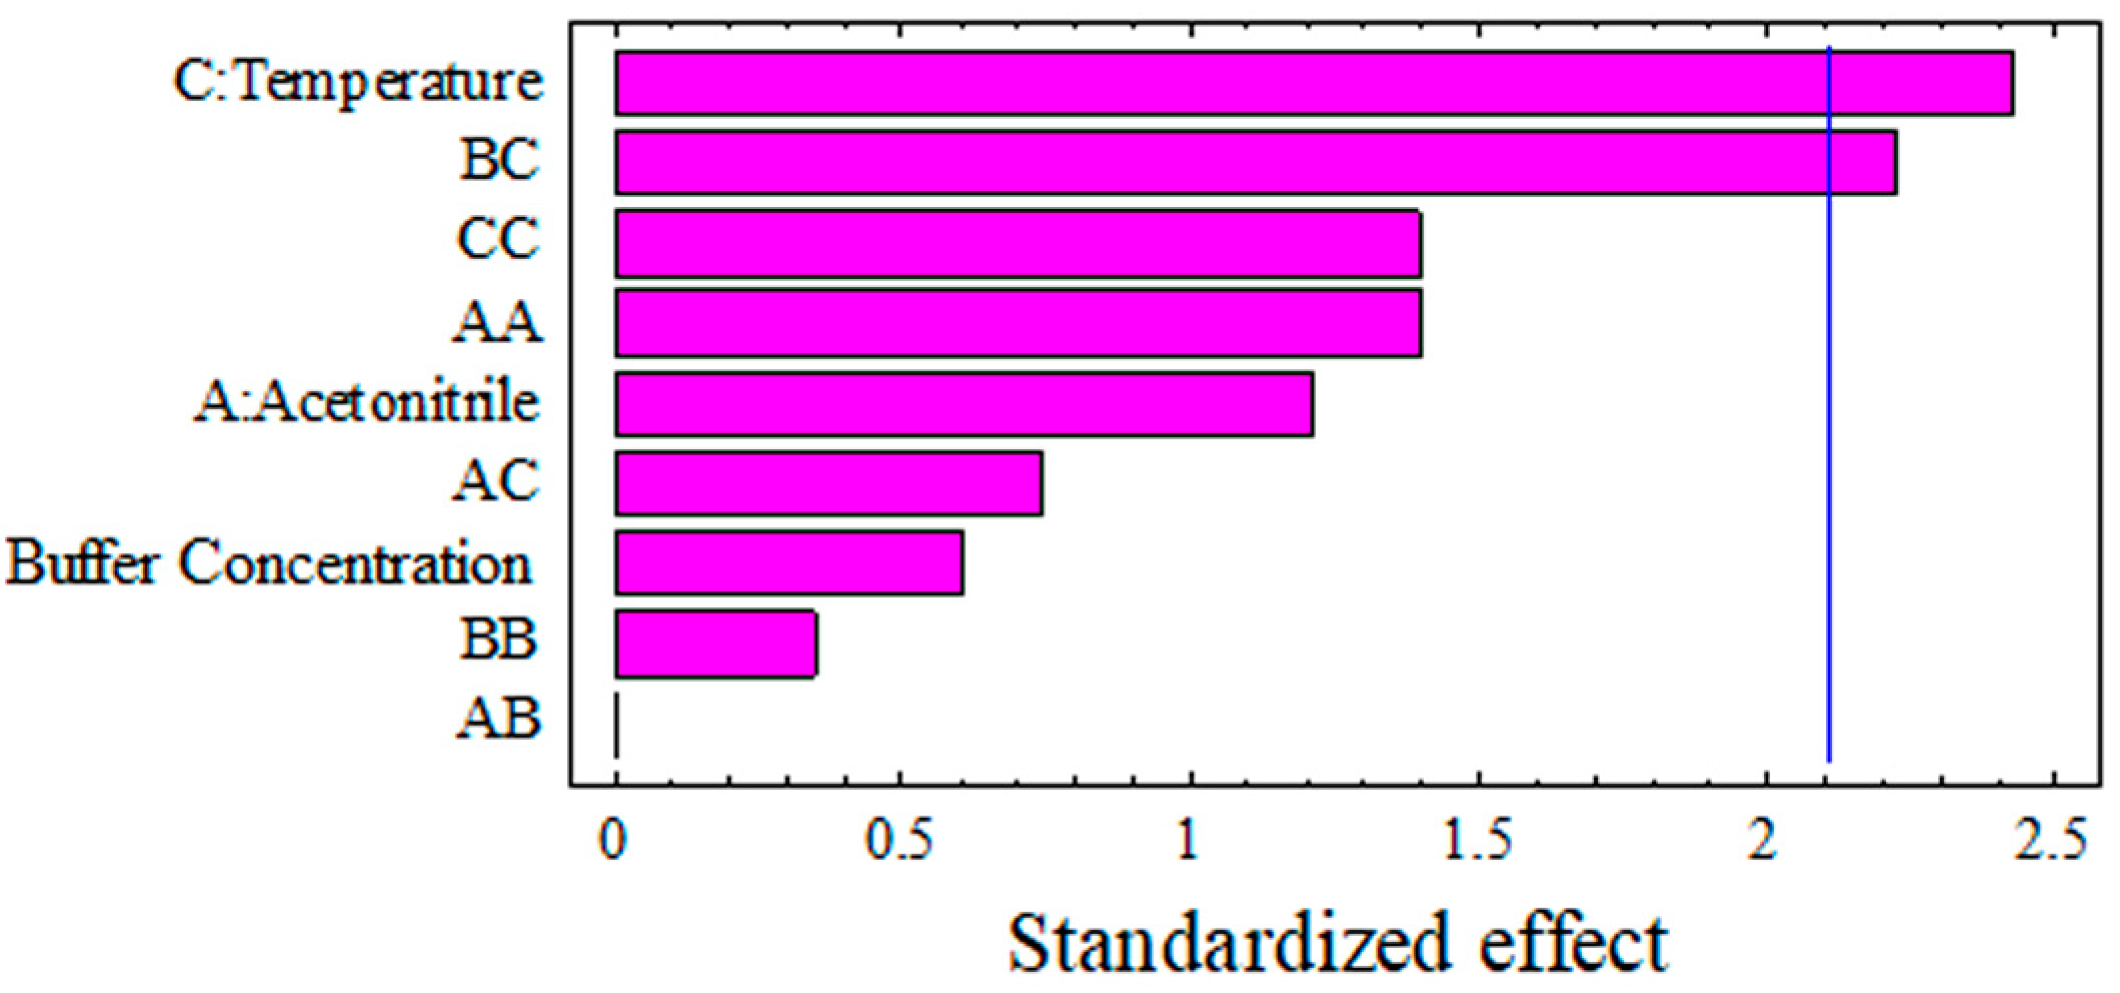
3.1.2. The Effect of the Independent Factors on the Peak Area of Safinamide Chromatogram

The column temperature has a highly significant effect on the chromatographic peak area of safinamide (p > 0.0002) (Table 3). Increasing the temperature in the range of 20 °C to 40 °C resulted in a decrease in peak area. However, other factors, such as the percentage of acetonitrile and buffer concentration, as well as their quadratic and interaction factors, had no significant effects on the peak area of safinamide (p value was higher than 0.05). These effects can be arranged in a descending manner as follows: B, BC, BB, AC, CC, BA, AA, and A, respectively (Table 3, Figure 4).
The 3D response plot indicates that the peak area increases with an increase in the acetonitrile ratio in the mobile phase, with the highest peak area observed at 78% acetonitrile. On the other hand, an increase in temperature results in a decrease in the peak area, with the highest peak area achieved at approximately 22 °C. Furthermore, increasing the concentration of ammonium acetate in the buffer within the mobile phase leads to a reduction in peak area, with the highest peak area observed at around 9.0 mM of the acetate buffer (Figure 5).

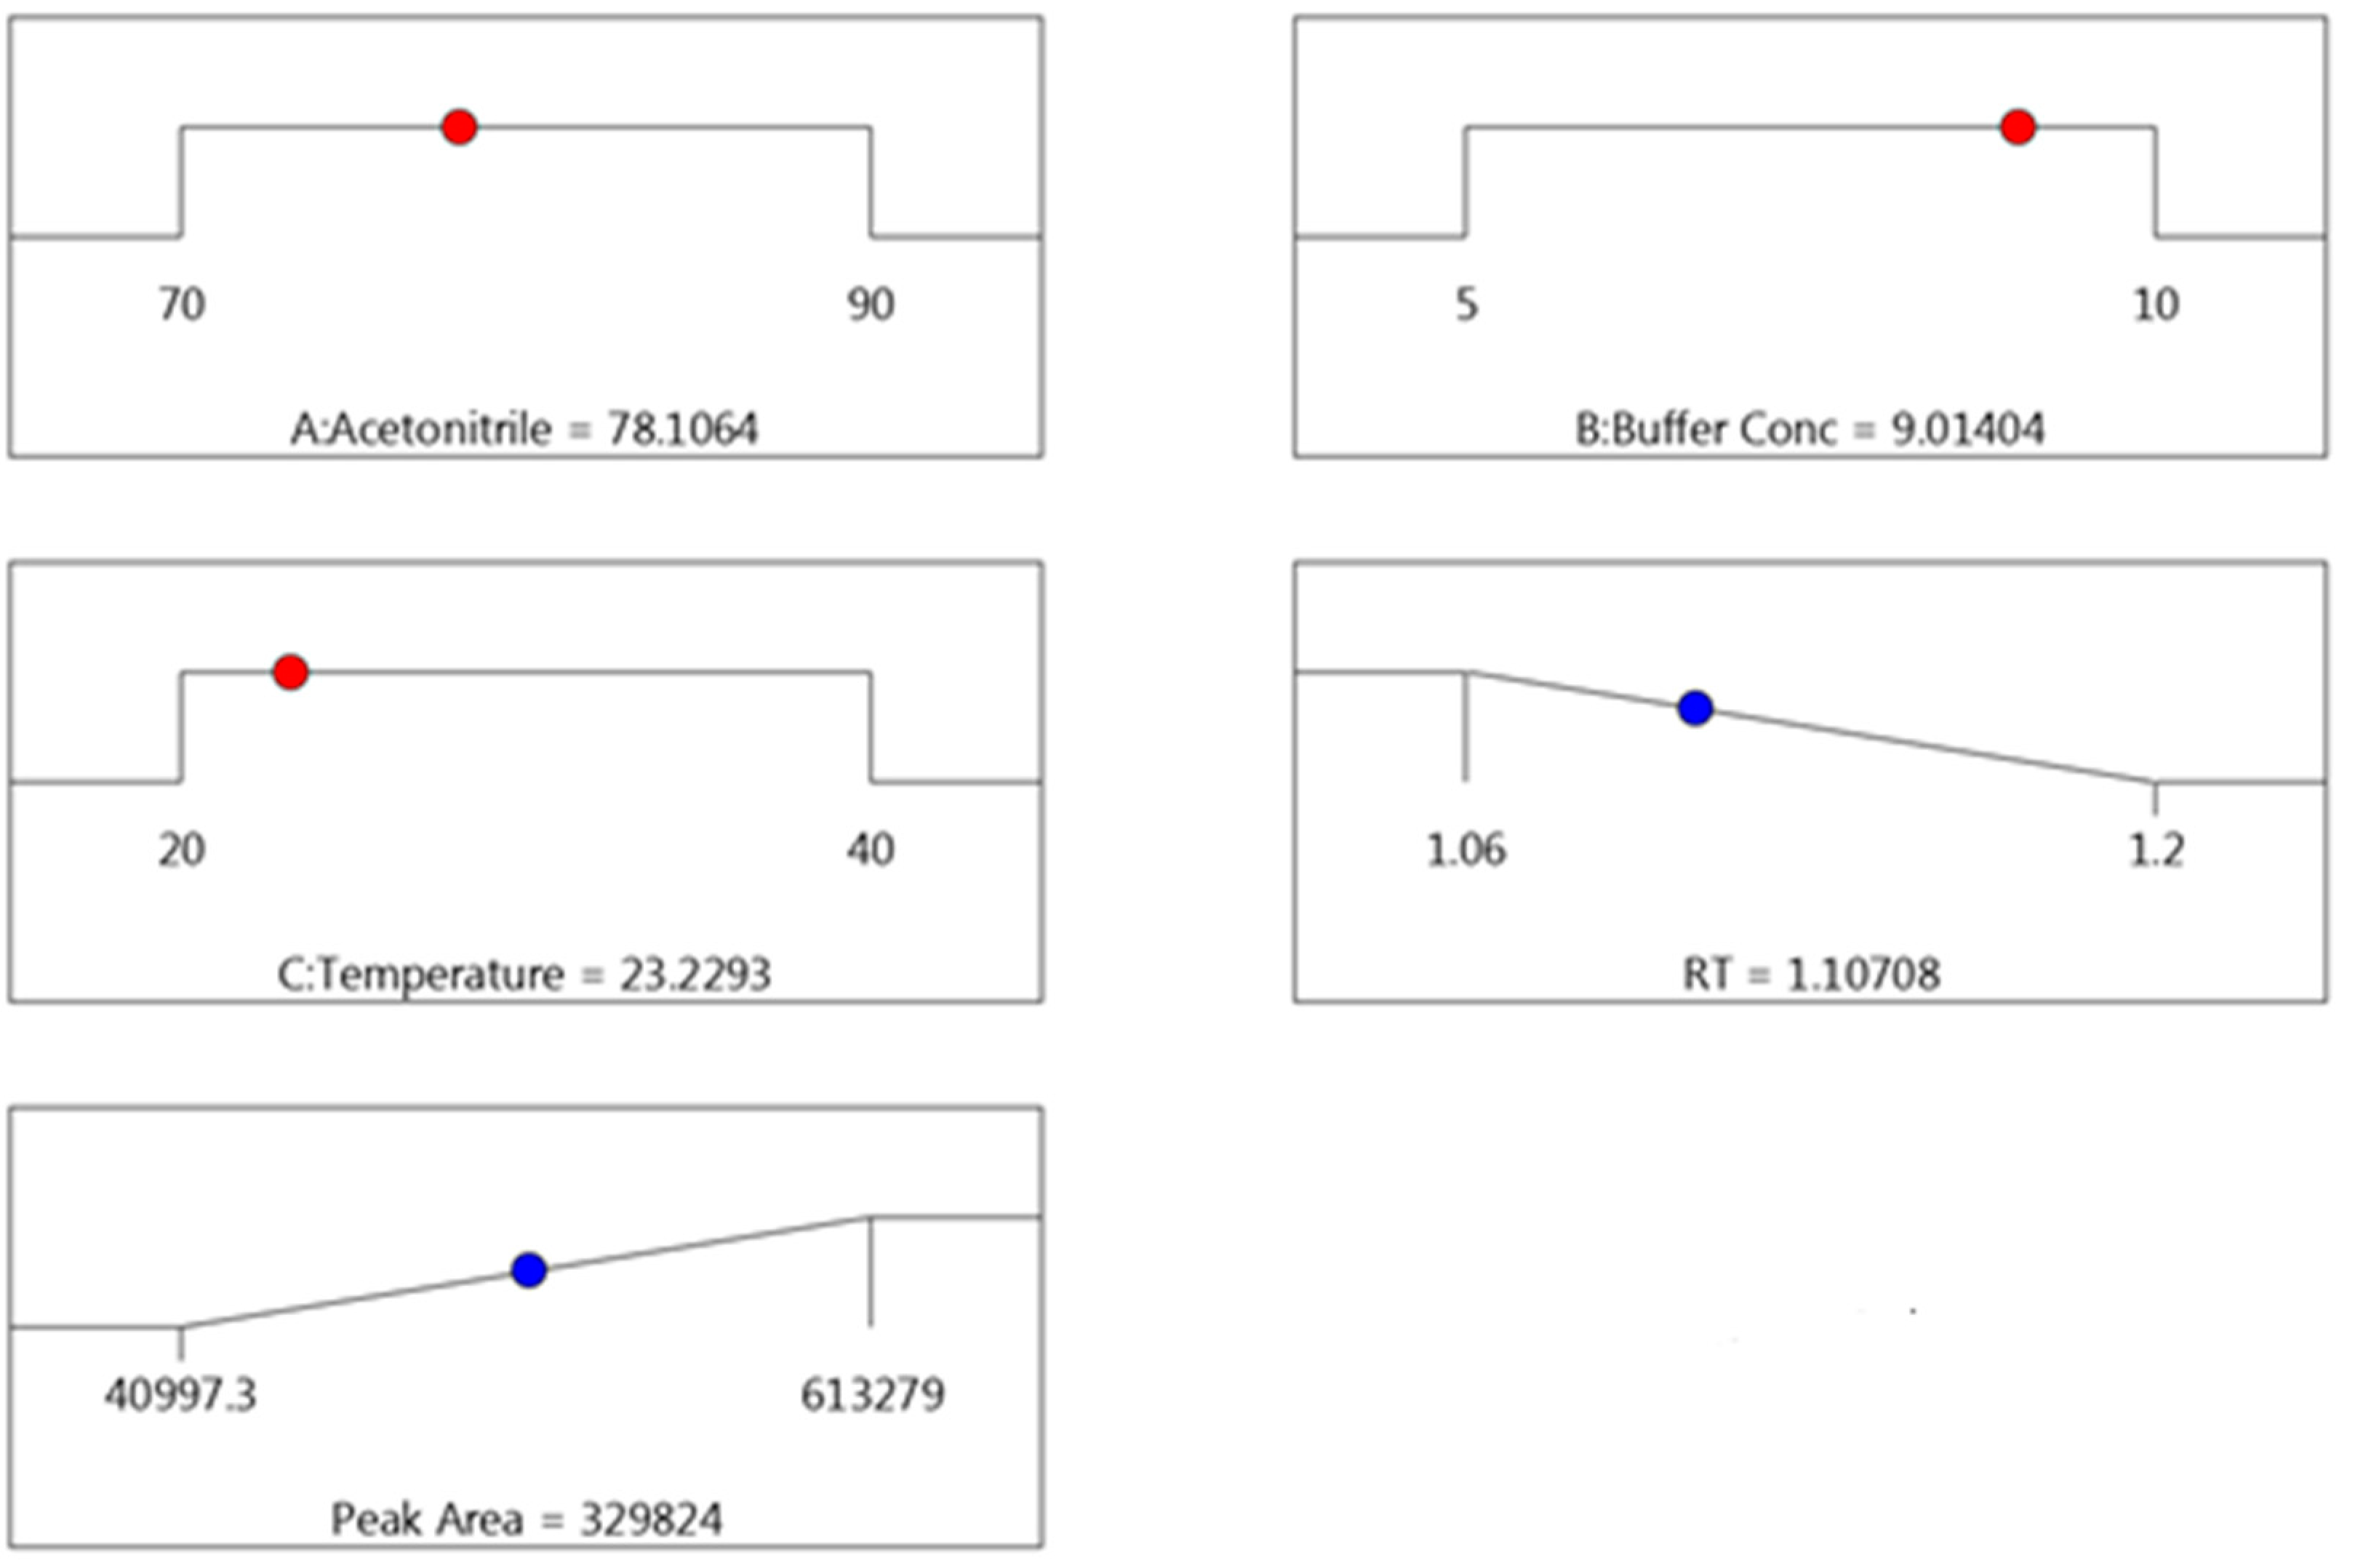
3.1.3. The Optimization of UPLC Conditions for Safinamide Analysis

The optimization of UPLC conditions for safinamide analysis was based on the statistical analysis of each dependent factor, aiming to achieve the minimum safinamide chromatogram retention time and maximum peak area. Based on the statistical evaluation of the obtained results for the optimization of the separation conditions, the most optimal mobile phase constituents were found to be “temperature = 23.0 °C, ammonium acetate = 9.0 mM, and acetonitrile = 78.0%”. The predicted values for the peak area and retention time under these optimal conditions were 329,824 ± 16,491 and 1.09 ± 0.05, respectively. Upon experimental measurement, the obtained values were 315,135 ± 1543 for the peak area and 1.17 ± 0.09 min for retention time. Importantly, no significant difference was observed between the measured and predicted values [Figure 6].

3.2. Sample Preparation

Our aim was to improve the sensitivity and reliability of UPLC-MS/MS analysis by finding the optimum extraction procedure with high recovery and low matrix effects. Protein precipitation is an easy and fast method for drug extraction from biological fluids. We attempted to use both acetonitrile and methanol, but the results were not satisfactory as they yielded lower recovery efficiency and high matrix effects. Therefore, we applied the liquid–liquid extraction method using different solvents such as dichloromethane, diethyl ether, ethyl acetate, n-hexane, and tert-methyl ether. Finally, we found that ethyl acetate was the most efficient solvent. Additionally, treating the plasma sample with 50 µL of acetonitrile before adding ethyl acetate improved the extraction efficiency.

3.3. Method Validation

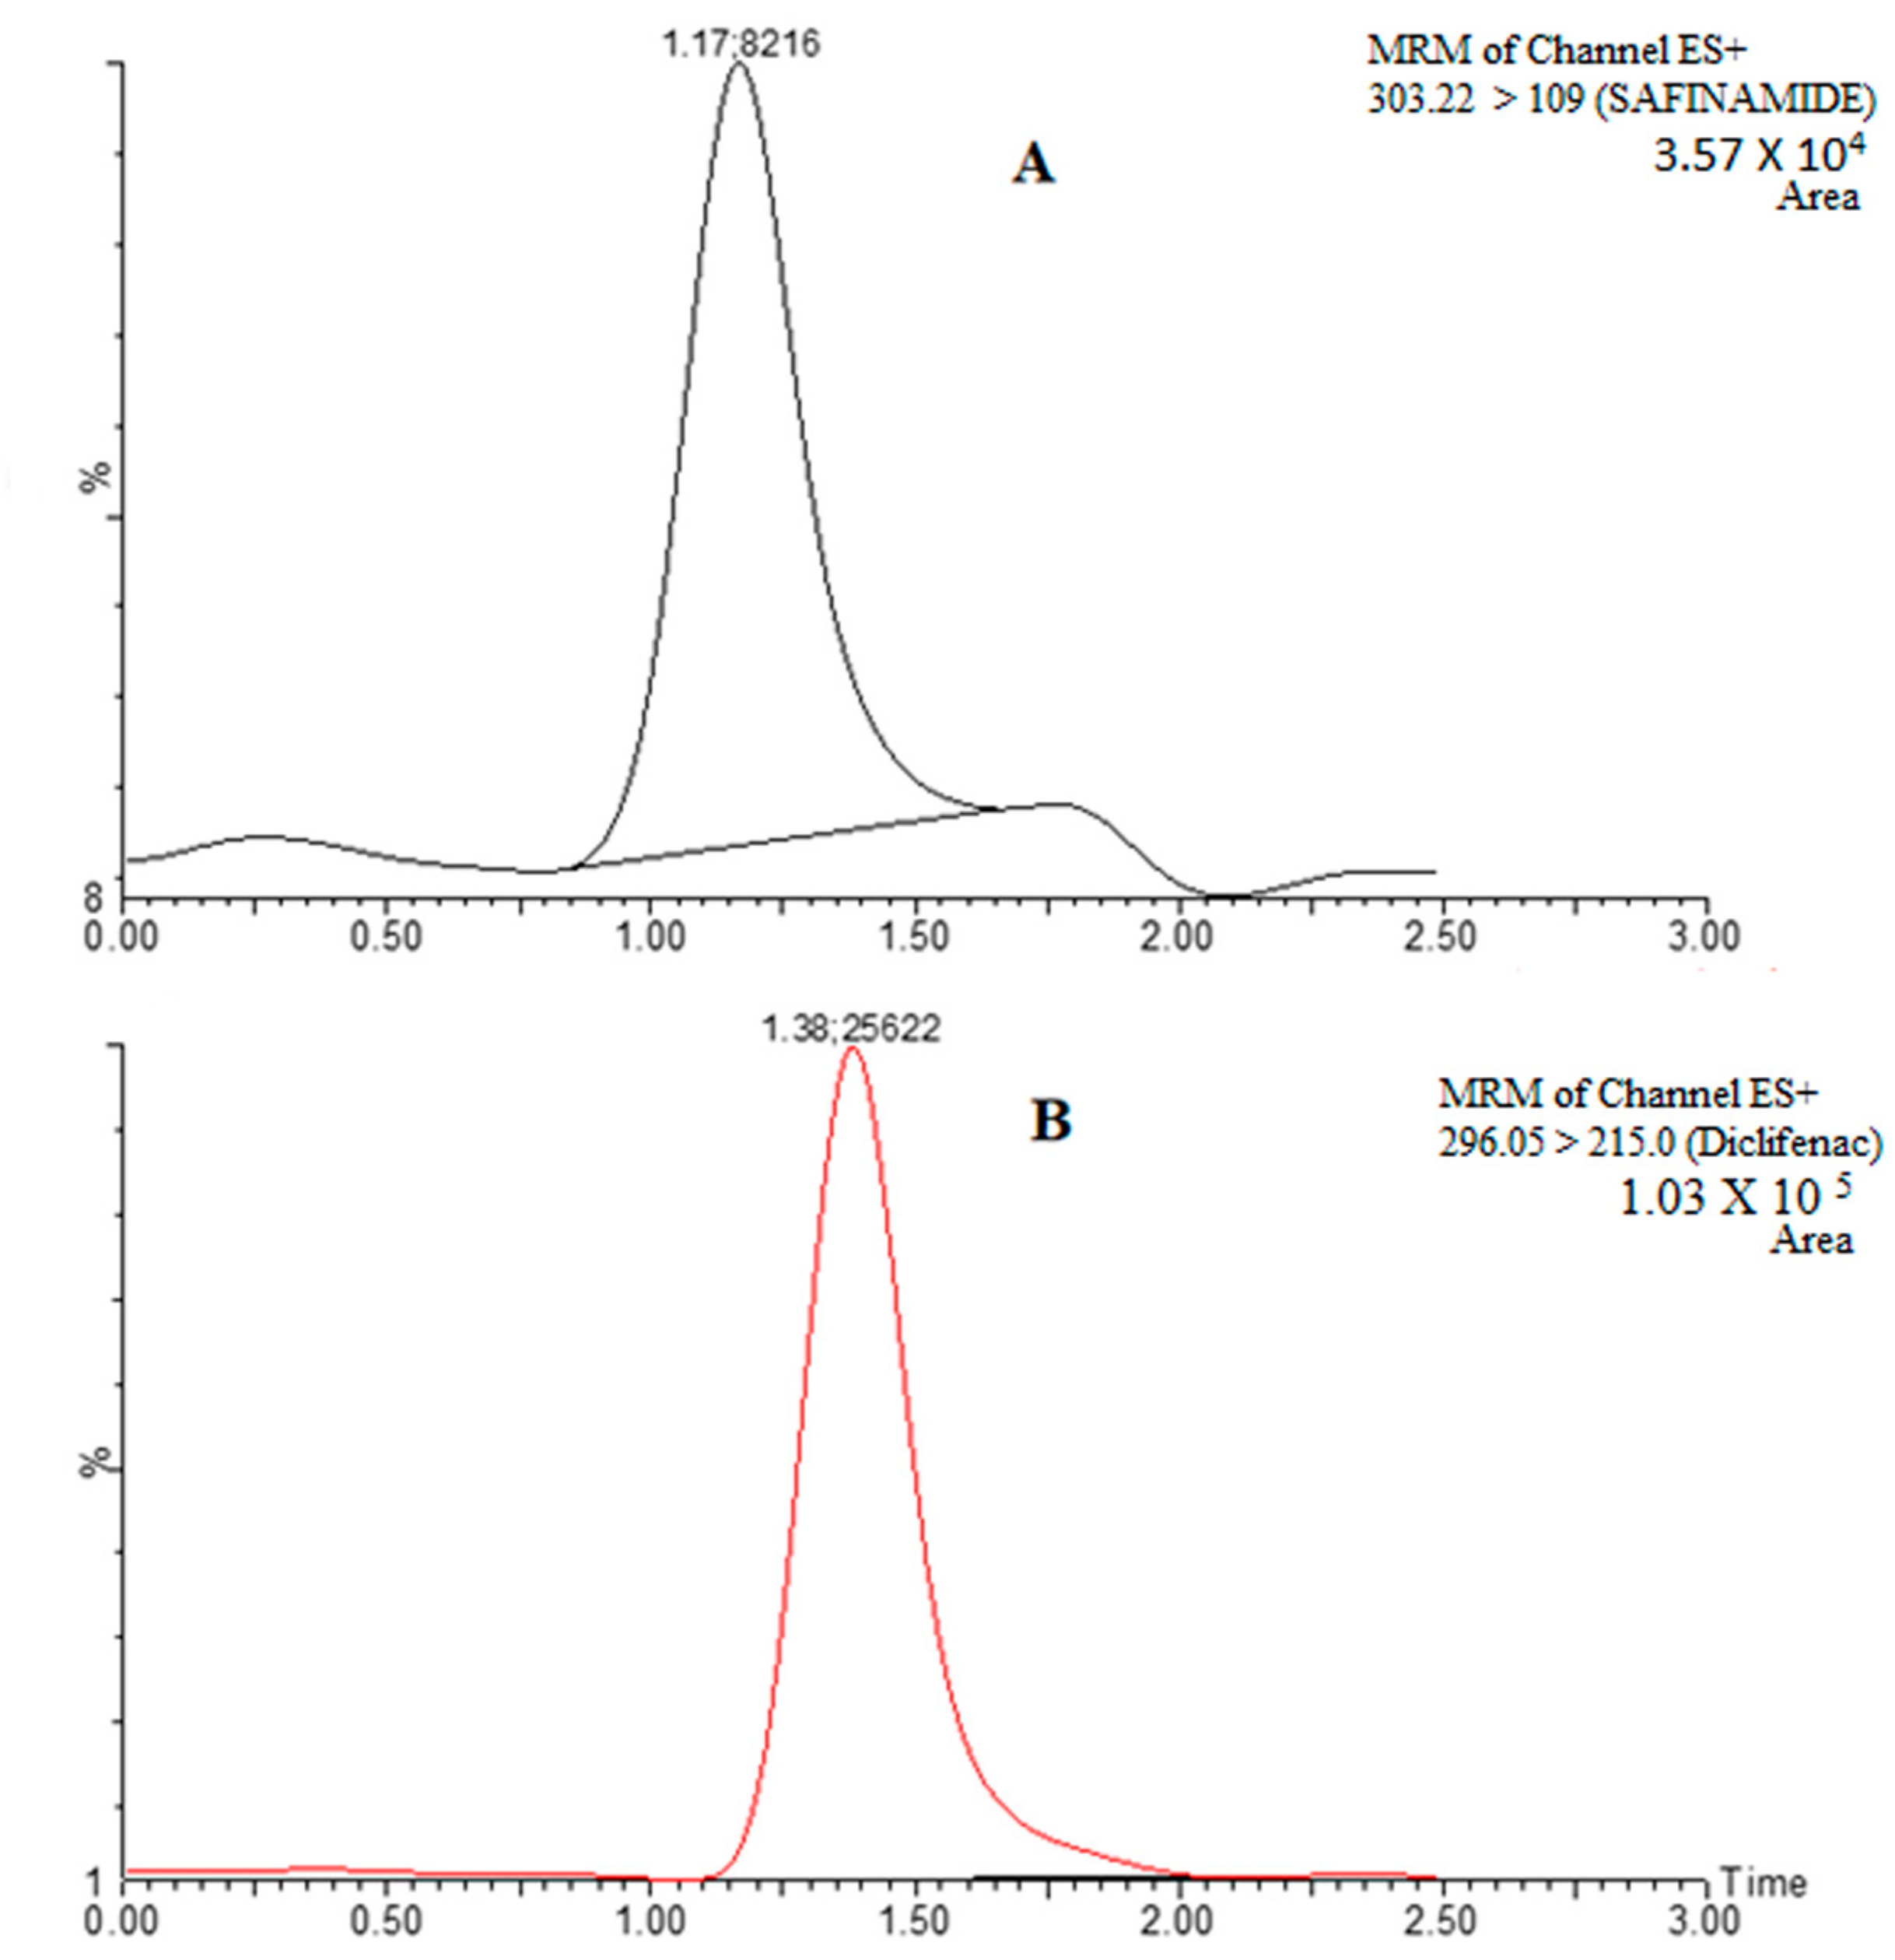
3.3.1. Selectivity and Specificity

No significant interfering peaks were found at the retention time of the chromatograms of drug-free plasma samples and those of plasma samples spiked with safinamide at its LLOQ level. The peak response ratio of safinamide at its LLOQ was more than five times that of the blank, while the IS provided peak areas of more than twenty times the blank signal. The absence of any interference at the retention times of both safinamide and IS indicates that this method is highly specific for safinamide analysis.

3.3.2. Lower Limit of Quantification (LLOQ)

The lower limit of quantification (LLOQ) is the lowest concentration of an analyte that can be reliably and accurately quantified with a given analytical method. The signal/noise ratio (S/N) is a measure of the relative size of the signal (analyte peak) compared to the background noise in a chromatogram. A high S/N ratio indicates a strong signal relative to the background noise, which improves the accuracy and precision of the measurement. In the current method, the S/N ratio was more than five-fold, and the LLOQ was determined to be 0.1 ng/mL, which represented the lowest point in the calibration curve (Figure 7). This value ensures that the method can accurately measure low concentrations of the analyte.

3.3.3. Linearity

The calibration curves were obtained by plotting the peak area ratios of safinamide to IS versus the nominal concentration of safinamide using the least squares method. The calibration curve showed good linearity in the range of 0.1–1000 ng/mL and the variation coefficient (R2) was 0.998.

3.3.4. Recovery and Matrix Effect

The extraction recovery and matrix effects for safinamide were evaluated at four different QC levels (0.3, 15, 150, and 750 ng/mL) and IS (100 ng/mL). The average recovery of safinamide was found to be 85.36%, while that of the IS was 81.26%, and it was concentration independent. These results indicate that this method is sensitive enough and suitable for the determination of safinamide in plasma. The range of the matrix effects was 81.22–90.09% for safinamide and 91.26% for IS (Table 4).

3.3.5. Precision and Accuracy

Precision and accuracy were evaluated by analyzing the different concentrations of the QC samples (LQC, MQC_1. MQC_2, and HQC) and LLOQ. The analysis was carried out in one day or three successive days for evaluation of the intra- and inter-day precision and accuracy, respectively. The precision or CV % ranged from 5.50 to 12.16% and 5.50–13.20% for inter-day and intra-day, respectively (Table 5). The inter-day and intra-day accuracy ranged from 86.62 to 90.47% and from 86.26% to 90.24%, respectively (Table 5). These results showed that the precision and accuracy of safinamide in this method was precise and accurate and were within the acceptable limits as per guidelines.

3.3.6. Stability Studies

Table 6 shows the stability of safinamide in the plasma samples after different conditions of storage and processing. All the samples were analyzed and evaluated against freshly prepared calibration curves. It was found to be stable at room temperature (23 °C) for 8 h and in the refrigerator (8 °C) for 4 weeks and after three freeze–thaw cycles (at room temperature and freeze at −80 °C).

3.4. Comparison of Current and Published Methods for Safinamide Analysis in Plasma

Table 7 provides a comparison of various published methods for the separation and quantitation of safinamide in plasma. The results show that the current method has a distinct advantage over the other methods in terms of sensitivity and separation retention time. This suggests that the current method is a promising approach for safinamide analysis in plasma.

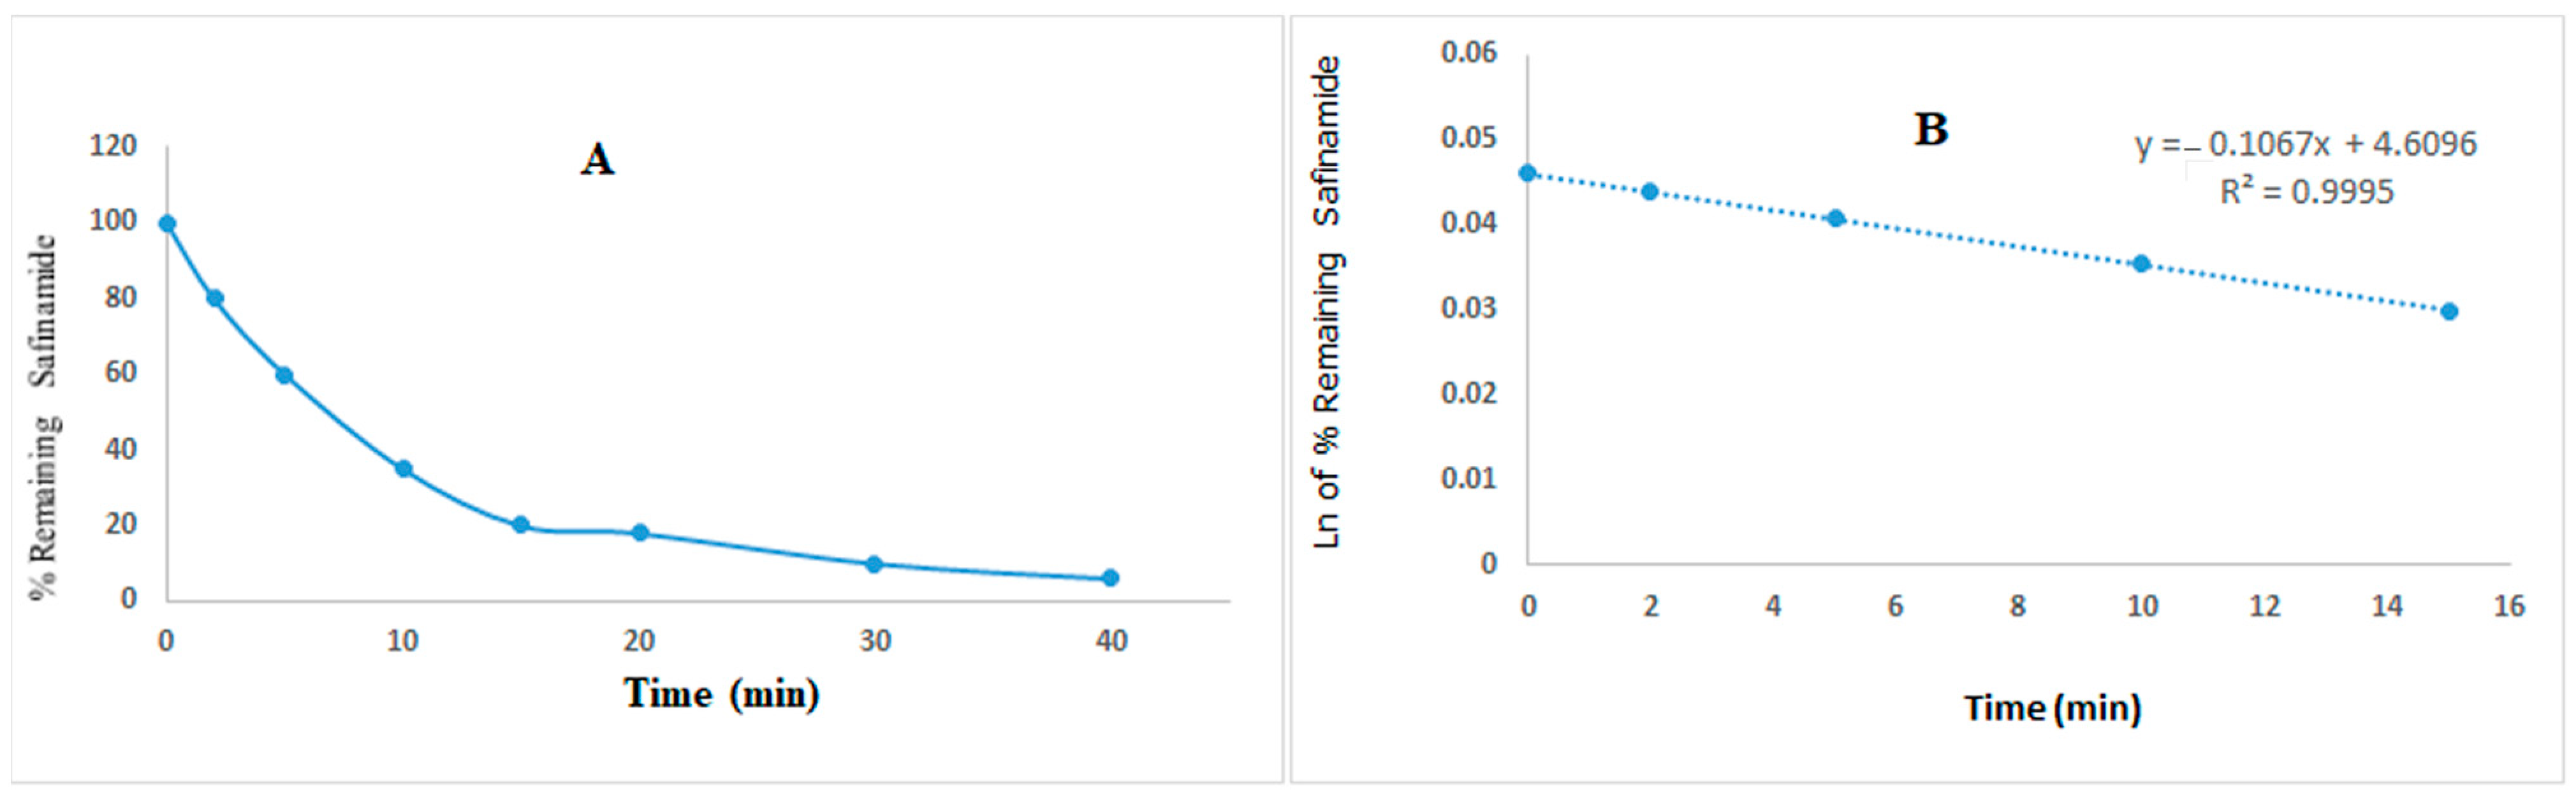
3.5. In Vitro Metabolic Stability Study

Metabolic stability and intrinsic clearance reflect drug disposition characteristics and they determine the half-life and predicted oral bioavailability of a drug. The human liver microsomes have been a key tool in this research. This in vitro system possesses many of the major drug-metabolizing enzymes and is thus applicable to a wide variety of compounds [34]. The prediction of drug clearance in humans is available and easier now using human liver microsomal preparations and/or hepatocytes [35]. The concentrations of the remaining safinamide at different time intervals were calculated using the constructed calibration curve in the mobile phase between the area ratio of safinamide and IS versus nominal concentrations of safinamide. The percentage of residual concentrations of the parent safinamide in the incubated mixtures at different time intervals was measured. These results indicated that safinamide rapidly metabolized during the first 40 min, followed by a slow and partial metabolism. Only 6.0% of the parent compound remained in the reaction mixtures after 40 min of incubation. Figure 8A shows the plot of the relationship between the percentage residual of safinamide versus incubation time points in the metabolic study. From the linear portion of the plotted curve (0–15 min), (Figure 8B) we calculated the in vitro t½ after the determination of slope, which was 6.49 min, and the intrinsic clearance was 10.6 µL/min/mg.

4. Conclusions

The validated method was found to be sensitive, linear, accurate, and specific for the determination of safinamide in plasma. All the validation parameters were found within the acceptance criteria. The quality by design approach deals with the interrelationships of the percentage of solvent in the mobile phase, buffer concentration, and column temperature at three different levels. The response parameters were retention time and peak area. This helps to understand the effects of these factors that influence chromatographic separation to develop UPLC-MS/MS.

Author Contributions

Conceptualization E.A.A. and M.A.I.; methodology, E.A.A.; software, M.A.I.; validation, E.A.A., M.I. and S.A.J.; formal analysis, E.A.A. and S.A.J.; investigation, E.A.A. and M.I.; resources, E.A.A.; data curation, E.A.A., R.A. and M.A.I.; writing—original draft preparation, E.A.A. and M.A.I.; writing—review and editing, R.A. and G.A.M.; visualization, G.A.M.; supervision, E.A.A.; project administration, E.A.A.; funding acquisition, E.A.A. All authors have read and agreed to the published version of the manuscript.

Funding

The research work was supported by researchers supporting project number RSP2023R45 at King Saud University, Riyadh, Saudi Arabia.

Institutional Review Board Statement

Not applicable.

Informed Consent Statement

Not applicable.

Data Availability Statement

The data presented in this study are available on request from the corresponding author.

Acknowledgments

The authors extend their appreciation to the researchers supporting project number RSP2023R45 at King Saud University, Riyadh, Saudi Arabia, for financial support.

Conflicts of Interest

The authors declare no conflict of interest.

References

  1. Bette, S.; Shpiner, D.S.; Singer, C.; Moore, H. Safinamide in the management of patients with Parkinson’s disease not stabilized on levodopa: A review of the current clinical evidence. Ther. Clin. Risk Manag. 2018, 14, 1737–1745. [Google Scholar] [CrossRef] [PubMed]
  2. Perez-Lloret, S.; Rascol, O. The safety and efficacy of safinamide mesylate for the treatment of Parkinson’s disease. Expert Rev. Neurother. 2016, 16, 245–258. [Google Scholar] [CrossRef] [PubMed]
  3. Teixeira, F.G.; Gago, M.F.; Marques, P.; Moreira, P.S.; Magalhães, R.; Sousa, N.; Salgado, A.J. Safinamide: A new hope for Parkinson’s disease? Drug Discov. Today 2018, 23, 736–744. [Google Scholar] [CrossRef] [PubMed]
  4. Morari, M.; Brugnoli, A.; Pisanò, C.A.; Novello, S.; Caccia, C.; Melloni, E.; Padoani, G.; Vailati, S.; Sardina, M. Safinamide Differentially Modulates In Vivo Glutamate and GABA Release in the Rat Hippocampus and Basal Ganglia. J. Pharmacol. Exp. Ther. 2018, 364, 198–206. [Google Scholar] [CrossRef]
  5. Gardoni, F.; Morari, M.; Kulisevsky, J.; Brugnoli, A.; Novello, S.; Pisanò, C.A.; Caccia, C.; Mellone, M.; Melloni, E.; Padoani, G.; et al. Safinamide Modulates Striatal Glutamatergic Signaling in a Rat Model of Levodopa-Induced Dyskinesia. J. Pharmacol. Exp. Ther. 2018, 367, 442–451. [Google Scholar] [CrossRef]
  6. Bianchi, M.; Riboldazzi, G.; Mauri, M.; Versino, M. Efficacy of safinamide on non-motor symptoms in a cohort of patients affected by idiopathic Parkinson’s disease. Neurol. Sci. Off. J. Ital. Neurol. Soc. Ital. Soc. Clin. Neurophysiol. 2019, 40, 275–279. [Google Scholar] [CrossRef]
  7. Fabbri, M.; Rosa, M.M.; Abreu, D.; Ferreira, J.J. Clinical pharmacology review of safinamide for the treatment of Parkinson’s disease. Neurodegener. Dis. Manag. 2015, 5, 481–496. [Google Scholar] [CrossRef]
  8. Fariello, R.G.; McArthur, R.A.; Bonsignori, A.; Cervini, M.A.; Maj, R.; Marrari, P.; Pevarello, P.; Wolf, H.H.; Woodhead, J.W.; White, H.S.; et al. Preclinical evaluation of PNU-151774E as a novel anticonvulsant. J. Pharmacol. Exp. Ther. 1998, 285, 397–403. [Google Scholar]
  9. Rana, A.Q.; Saleh, M.; Yousuf, M.S.; Mansoor, W.; Hussaini, S.; Rahman, M.; Iqbal, Z. DOPA-sparing strategy in the treatment of young onset Parkinson’s disease. J. Neurosci. Rural. Pract. 2016, 7, 67–69. [Google Scholar] [CrossRef]
  10. Singer, C. Managing the patient with newly diagnosed Parkinson disease. Clevel. Clin. J. Med. 2012, 79 (Suppl. 2), S3–S7. [Google Scholar] [CrossRef]
  11. Tan, Y.Y.; Jenner, P.; Chen, S.D. Monoamine Oxidase-B Inhibitors for the Treatment of Parkinson’s Disease: Past, Present, and Future. J. Park. Dis. 2022, 12, 477–493. [Google Scholar] [CrossRef] [PubMed]
  12. Grégoire, L.; Jourdain, V.A.; Townsend, M.; Roach, A.; Di Paolo, T. Safinamide reduces dyskinesias and prolongs L-DOPA antiparkinsonian effect in parkinsonian monkeys. Park. Relat. Disord. 2013, 19, 508–514. [Google Scholar] [CrossRef]
  13. Borgohain, R.; Szasz, J.; Stanzione, P.; Meshram, C.; Bhatt, M.; Chirilineau, D.; Stocchi, F.; Lucini, V.; Giuliani, R.; Forrest, E.; et al. Study 016 Investigators Randomized trial of safinamide add-on to levodopa in Parkinson’s disease with motor fluctuations. Mov. Disord. Off. J. Mov. Disord. Soc. 2014, 29, 229–237. [Google Scholar] [CrossRef] [PubMed]
  14. Schapira, A.H.; Fox, S.H.; Hauser, R.A.; Jankovic, J.; Jost, W.H.; Kenney, C.; Kulisevsky, J.; Pahwa, R.; Poewe, W.; Anand, R. Assessment of Safety and Efficacy of Safinamide as a Levodopa Adjunct in Patients with Parkinson Disease and Motor Fluctuations: A Randomized Clinical Trial. JAMA Neurol. 2017, 74, 216–224. [Google Scholar] [CrossRef]
  15. Cattaneo, C.; Ferla, R.L.; Bonizzoni, E.; Sardina, M. Long-Term Effects of Safinamide on Dyskinesia in Mid- to Late-Stage Parkinson’s Disease: A Post-Hoc Analysis. J. Park. Dis. 2015, 5, 475–481. [Google Scholar] [CrossRef] [PubMed]
  16. Müller, T. Pharmacokinetic drug evaluation of safinamide mesylate for the treatment of mid-to-late stage Parkinson’s disease. Expert Opin. Drug Metab. Toxicol. 2017, 13, 693–699. [Google Scholar] [CrossRef]
  17. Marzo, A.; Dal Bo, L.; Monti, N.C.; Crivelli, F.; Ismaili, S.; Caccia, C.; Cattaneo, C.; Fariello, R.G. Pharmacokinetics and pharmacodynamics of safinamide, a neuroprotectant with antiparkinsonian and anticonvulsant activity. Pharmacol. Res. 2004, 50, 77–85. [Google Scholar] [CrossRef]
  18. Alborghetti, M.; Nicoletti, F. Different Generations of Type-B Monoamine Oxidase Inhibitors in Parkinson’s Disease: From Bench to Bedside. Curr. Neuropharmacol. 2019, 17, 861–873. [Google Scholar] [CrossRef]
  19. Marquet, A.; Kupas, K.; Johne, A.; Astruc, B.; Patat, A.; Krösser, S.; Kovar, A. The effect of safinamide, a novel drug for Parkinson’s disease, on pressor response to oral tyramine: A randomized, double-blind, clinical trial. Clin. Pharmacol. Ther. 2012, 92, 450–457. [Google Scholar] [CrossRef]
  20. Cattaneo, C.; Barone, P.; Bonizzoni, E.; Sardina, M. Effects of Safinamide on Pain in Fluctuating Parkinson’s Disease Patients: A Post-Hoc Analysis. J. Park. Dis. 2017, 7, 95–101. [Google Scholar] [CrossRef]
  21. Ermer, J.; Aguiar, D.; Boden, A.; Ding, B.; Obeng, D.; Rose, M.; Vokrot, J. Lifecycle management in pharmaceutical analysis: How to establish an efficient and relevant continued performance monitoring program. J. Pharm. Biomed. Anal. 2020, 181, 113051. [Google Scholar] [CrossRef]
  22. Tsuboi, T.; Satake, Y.; Hiraga, K.; Yokoi, K.; Hattori, M.; Suzuki, M.; Hara, K.; Ramirez-Zamora, A.; Okun, M.S.; Katsuno, M. Effects of MAO-B inhibitors on non-motor symptoms and quality of life in Parkinson’s disease: A systematic review. NPJ Park. Dis. 2022, 8, 75. [Google Scholar] [CrossRef] [PubMed]
  23. Rukavina, K.; Leta, V.; Sportelli, C.; Buhidma, Y.; Duty, S.; Malcangio, M.; Ray Chaudhuri, K. Pain in Parkinson’s disease: New concepts in pathogenesis and treatment. Curr. Opin. Neurol. 2019, 32, 579–588. [Google Scholar] [CrossRef]
  24. Peraman, R.; Bhadraya, K.; Padmanabha Reddy, Y. Analytical quality by design: A tool for regulatory flexibility and robust analytics. Int. J. Anal. Chem. 2015, 2015, 868727. [Google Scholar] [CrossRef] [PubMed]
  25. Schweitzer, M.; Pohl, M.; Hanna-Brown, M.; Nethercote, P.; Borman, P.; Hansen, G.; Smith, K.; Larew, J. Implications and opportunities of applying QbD principles to analytical measurements. Pharm. Technol. 2010, 34, 52–59. [Google Scholar]
  26. Elder, D.P.; Borman, P. Improving analytical method reliability across the entire product lifecycle using QbD approaches. Pharm. Outsourcing 2013, 14, 14–19. [Google Scholar]
  27. Borman, P.; Chatfield, M.; Nethercote, P.; Thompson, D.; Truman, K. The application of quality by design to analytical methods. Pharm. Technol. 2007, 31, 142–152. [Google Scholar]
  28. Schmidt, A.H.; Wess, C. A Qbd with Design-Of-Experiments Approach for Development of a State-Of-The-Art Uplc Purity Method for Carbamazepine. J. Liq. Chromatogr. Rel. Technol. 2014, 37, 2653–2666. [Google Scholar] [CrossRef]
  29. European Medicines Agency. ICH Guideline Q14 on Analytical Procedure Development Step 2b. 2022. Available online: https://www.ema.europa.eu/en/documents/scientific-guideline/ich-guideline-q14-analytical-procedure-development-step-2b_en.pdf (accessed on 5 February 2023).
  30. Dal Bo, L.; Mazzucchelli, P.; Fibbioli, M.; Marzo, A. Bioassay of safinamide in biological fluids of humans and various animal species. Arzneimittelforschung 2006, 56, 814–819. [Google Scholar] [CrossRef]
  31. Leardi, R. Experimental design in chemistry: A tutorial. Anal. Chim. Acta. 2009, 652, 161–172. [Google Scholar] [CrossRef]
  32. Guidance for Industry on Bioanalytical Method Validation, Center for Drug Evaluation and Research, US Food and Drug Administration, Rockville, MD. 2001. Available online: https://www.fda.gov/downloads/Drugs/Guidance/ucm070107.pdf (accessed on 1 March 2018).
  33. International Council for Harmonisation of Technical Requirements for Pharmaceuticals for Human Use (ICH). Bioanalytical Method Validation. 2019. Available online: https://database.ich.org/sites/default/files/M10_Step4_Guideline_2019_1204.pdf (accessed on 14 April 2023).
  34. Chao, P.; Uss, A.S.; Cheng, K.C. Use of intrinsic clearance for prediction of human hepatic clearance. Expert Opin. Drug Metab. Toxicol. 2010, 6, 189–198. [Google Scholar] [CrossRef] [PubMed]
  35. Obach, R.S. The prediction of human clearance from hepatic microsomal metabolism data. Curr. Opin. Drug Discov. Dev. 2001, 4, 36–44. [Google Scholar]
  36. Yang, Y.; Lamm, L.J.; He, P.; Kondo, T. Temperature effect on peak width and column efficiency in subcritical water chromatography. J. Chromatogr. Sci. 2002, 40, 107–112. [Google Scholar] [CrossRef] [PubMed]
Figure 1. Typical representation of precursor to product ion spectra of safinamide in ESI positive ionization mode.
Separations 10 00474 g001
Figure 2. Effects of independent factors on peak area of safinamide chromatogram retention time (the blue vertical line indicates the significance border).
Separations 10 00474 g002
Figure 3. A plot of the 3D response surface for the temperature (A) and buffer concentration ratio (B) on safinamide chromatogram retention time.
Separations 10 00474 g003
Figure 4. Effects of independent factors on peak area of safinamide chromatogram peak area (the blue vertical line indicates the significance border).
Separations 10 00474 g004
Figure 5. The plot of the 3D response surface for the temperature (A) and buffer concentration ratio (B) on the safinamide chromatogram peak area.
Separations 10 00474 g005
Figure 6. Plot showing the optimization of UPLC conditions for the separation of the analyte.
Separations 10 00474 g006
Figure 7. MRM chromatograms of blank plasma spiked with safinamide at LLOQ (A) and internal standard (B).
Separations 10 00474 g007
Figure 8. The percentage remaining of safinamide (A) and the logarithmic percentage remaining (B) of safinamide versus incubation time profile.
Separations 10 00474 g008
Table 1. Design for the analytical procedure of safinamide using UPLC-MS/MS.
Independent FactorsDependent Factors (Response)
Acetonitrile
% (A)
Ammonium Acetate
mM (B)
Temperature °C
901540Peak area (mAU/min)
801030Retention time (min)
70520
Table 2. ANOVA for the effects of independent analytical parameters on safinamide chromatogram retention time.
SourceSum of SquareDfMean SquareR-Ratiop-Value
A: Acetonitrile0.0022222210.0222221.470.2423
B: Acetate buffer Con.0.5555555610.005555560.370.5527
C: Temperature0.008888910.008888895.870.0265
AA0.0029629610.002962961.960.1798
AB0.010.00.001.000
AC0.0008333310.0008333330.550.4683
BB0.00018518510.0001851850.120.7308
BC0.007510.00754.950.0399
CC0.0029629610.002962961.960.1798
Total error0.25747170.00151416
Table 3. ANOVA for the effects of independent analytical parameters on safinamide chromatogram peak area.
SourceSum of SquareDfMean SquareR-Ratiop-Value
A: Acetonitrile2.6295 × 10812.62995 × 1080.020.8803
B: Acetate buffer Con.2.63246 × 101012.63246 × 10102.340.1446
C: Temperature2.59232 × 101112.59232 × 101123.030.0002
AA6.49689 × 10916.49689 × 1080.060.8130
AB9.16371 × 10919.16371 × 1090.810.3795
AC1.21055 × 101011.21055 × 10101.080.3142
BB1.34664 × 101011.34664 × 10101.200.2893
BC1.91826 × 101011.91826 × 10101.702091
CC1.17761 × 10111.17761 × 10101.050.2207
Total error1.9133 × 1011171.12547 × 1010
Table 4. Extraction recovery and matrix effects of three quality control (QC) samples of safinamide in rat plasma.
CompoundNominal Conc.Extraction RecoveryMatrix Effect
MeanCVMeanCV
(ng/mL)(%)(%)(%)(%)
SAFINAMIDE0.393.335.3586.665.20
1578.1812.1290.9012.61
30091.989.8281.2210.34
75077.9612.3685.477.49
IS10081.267.491.267.46
Table 5. Intra-day and inter-day precision and accuracy of safinamide in rat plasma.
NominalInter-DayIntra-Day
ActualPrecisionAccuracyActualPrecisionAccuracy
Con. (ng/mL)Con. (ng/mL)(%)(%)Con. (ng/mL)(%)(%)
0.10.08 ± 0.0045.6087.250.08 ± 0.0045.5082.50
0.30.27 ± 0.0155.5089.160.25 ± 0.0145.4086.66
1513.03 ± 1.5712.1086.8713.60 ± 3.762.7486.26
300272.34 ± 18.49.7890.20259.22 ±1.676.3586.4
750649.67 ± 80.3112.2686.62652.87 ± 86.2113.2087.05
Table 6. Stability data of safinamide in rat plasma and aqueous solutions (n = 6).
ParametersNominal ConMeasured Con.PrecisionAccuracy
(%)(%)(%)(%)
Short-term1513.03 ±1.289.8286.86
750643.50 ± 41.796.4985.8
Long-term1513.6 ± 1.5111.1690.66
750640.95 ± 82.1012.8085.46
Thaw and freeze1512.77 ± 1.179.1585.16
750652.75 ± 51.627.9087.03
Auto-sampler (24 h)1512.83 ± 1.259.7185.53
750673.07 ± 69.9210.3889.74
Table 7. A comparison of current and previous methods.
Method
[Reference No.]
LLOQ (ng/mL)Range (ng/mL)Retention Time (min)Instrument of Analysis
Marzo et al. [17]0.5--LC-MS/MS
Dal Bo et al. [30]0.50.5–205.5LC-MS/MS
Dal Bo et al. [30]2020–100016.0LC-MS/MS
Dal Bo et al. [30]2020–60005.5HPLC
Disclaimer/Publisher’s Note: The statements, opinions and data contained in all publications are solely those of the individual author(s) and contributor(s) and not of MDPI and/or the editor(s). MDPI and/or the editor(s) disclaim responsibility for any injury to people or property resulting from any ideas, methods, instructions or products referred to in the content.

