Abstract
Sunscreens are topical preparations containing one or more compounds that protect humans from ultraviolet (UV) light. This review focuses on analytical methods, particularly liquid chromatography, with the aim of identifying and determining UV filters (UVFs) in environmental and marine biota matrices. A literature review was conducted using NIH (PubMed and Medline), FDA and EPA databases, Google Scholar, and federal regulations. This retrospective literature review is focused on the last five years. UVF quantification in environmental and biological matrices showed a wide array of methods where liquid chromatography is predominant. The scientific literature identified a large variety of analytical methodologies that are compared in this review to evaluate the better results in terms of limits of quantification and the possibility to identify as many analytes as possible simultaneously.
1. Introduction
UV filters (UVFs) are a group of chemicals characterized by their capacity to absorb UV radiation, like UVA (280–315 nm), UVB (315–400 nm), or both of them (UVA and UVB) [1].
They can also be distinguished into organic and inorganic ones: organic filters are compounds with single or multiple aromatic structures capable only of absorbing the UV radiation, while inorganic filters can reflect and scatter it [2,3].
Due to their ability to absorb UV radiation, they are frequently used in sunscreens and personal care products to prevent solar-induced human skin damage [4].
Moreover, they are not only used in cosmetics but also in adhesives, rubber, and materials for food containers in order to reduce UV degradation [5]. In fact, they can efficiently prolong the service life of materials, delaying UV degradation and oxidative processes [6]. Recent studies demonstrated that the direct contact between these materials and food allows for the migration of UVFs into the food and, in turn, into the human body via food intake [7,8,9]. In fact, it is well known that the principal route of human exposure to UVFs present in sunscreen products is direct dermal contact via skin permeation (direct way), but humans can also be exposed to these chemicals by ingesting fish and seafood or beverages in contact with packaging materials containing UVFs as stabilizers (indirect way) [7,8].
Given their varied use, in recent decades, the safety of UVFs for humans and the environment has raised concern in the scientific community.
Experimental evidence demonstrates that large quantities of UVFs are released into the environment and can accumulate in environmental and marine biota matrices [10,11,12,13], thus entering the food chain [14,15,16]. Moreover, many studies have confirmed the presence of organic UVFs in several human biological samples [17,18,19].
Because of their hydrophobicity and poor degradation, UVFs are able to accumulate in several matrices, leading to important negative effects, including endocrine-disrupting ones [20]. Different types of UVFs can differently contribute to health toxicity [21].
To avoid their inappropriate or excessive exposure, the Scientific Committee on Consumer Safety approved the margin-of-safety estimation (MoS) to assess the health risk derived from UVFs. This estimation can be determined for a single substance from different exposure routes or for multiple substances to estimate the combined risk [22]. In fact, the combined risk depends both on the concentration of different UVFs in sunscreen products and on human exposure routes [23]. To evaluate their widespread in the environment and potential adverse effects on ecosystems and human health, it is important to quantify UVFs not only in cosmetics and biological samples but also in environmental matrices. Therefore, it is important to develop efficient analytical methods to simultaneously identify and quantify these compounds. To date, most of the publications focus on the study of benzophenone-3 (BP-3) and its metabolites in biological matrices [24]. Among the chromatographic techniques, liquid chromatography is shown to be the technique of choice for the separation and quantification of UVFs [25,26].
The aim of this review is to provide a comprehensive overview of the analytical methods available in the literature over the last five years, focusing on the application of liquid chromatography for the analysis of organic UVFs in environmental and marine biota matrices. A recent review already reported an excursus of analytical methods for the determination of organic UVFs in cosmetics and human samples [26].
Currently, a total of around 45 organic UVFs are globally registered for cosmetic use in the European Union (EU), Canada, USA, China, and Japan. The EU limited the use in of sunscreen products to one inorganic (titanium dioxide) and 26 organic UVFs [27]. In Canada, the UVFs for human use registered by Health Canada include two inorganic chemicals (zinc oxide and titanium dioxide), and 19 organic chemicals [28]. The Food and Drugs Administration (FDA) authorizes in the USA a total of 16 UVFs, including two inorganic compounds [29]. The Chinese regulation permits the use of 26 organic UVFs [30] vs. the 27 ones permitted in Japan [31]. The permitted maximum concentration in cosmetics ranges from 2 to 15%. Recently, the EU have has reduced the allowed limit of BP-3 from 10% to 6% in sunscreens and to 0.5% in cosmetics [32]. Given their toxicity, some countries have recently prohibited the use of some sunscreens, such as BP-3 and octinoxate [33,34].
2. Analytical Methods for the Analysis of Organic UVFs
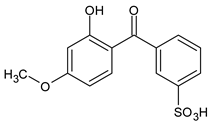
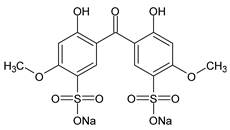
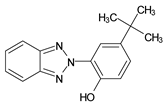
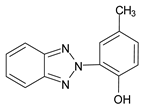
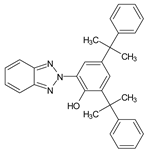
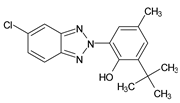
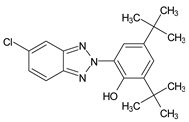
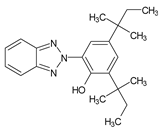
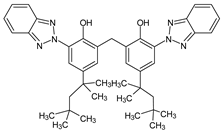
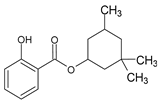
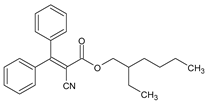
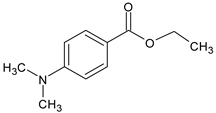
Among synthetic UVFs, we can find different classes of compounds, like benzophenones, dibenzoyl methane derivatives, benzotriazoles, cinnamates, salicylates, crylenes, PABA derivates, camphor, and triazine derivatives (Table 1).

Table 1.
Classification and chemical structures of investigated organic UVFs.
In this review, we want to analyze the most recent liquid chromatographic methods aimed at identifying and quantifying different organic UVFs according to their chemical structural class.
2.1. Benzophenones
Benzophenones (BPs) are one of the most diffused families of UVFs. Chemically, they are dibenzoyl methane derivatives that belong to the aromatic ketone category. The main drawbacks to the use of benzophenones as UVFs are concerns about their safety, as aromatic ketones are more difficult to detoxify than esters, and their solid state, which impairs their solubilization in cosmetic formulations. They are, in fact, usually used in combinations with solubilizers [35].
Given their high lipophilicity, they can easily penetrate the dermis and bio-accumulate in the human body. Numerous studies have confirmed their presence in a variety of biological samples [36,37]. BPs have been shown to act as endocrine disruptors [38,39]. They have also been associated with skin irritation in the form of contact dermatitis and photoallergic reactions [40].
Among BPs, twelve of them, from benzophenone-1 (BP-1) to benzophenone-12 (BP-12), are commercially used as UVFs, as well as some of their photodegradation and metabolization products [41,42]. BP-3 is the most commonly used [43]; after the application of sunscreens, it is transformed into BP-1. For this reason, both BP-3 and BP-1 are considered the main markers of exposure [42,44].
Considering their increasing diffusion, BPs have been the topic of numerous investigations in both environmental and marine biota fields.
2.1.1. Environmental Matrices
Water was shown to be the most investigated matrix among those that could be used to study BPs that are widespread in the environment, including drinking water, freshwater, seawater, and groundwater. Almost all analyzed studies reported the use of a C18 column for chromatographic separation, using water and methanol or acetonitrile as the mobile phase.
In 2019, an on-line solid phase extraction followed by liquid chromatography coupled to tandem mass spectrometry method (SPE-LC-MS/MS) was applied to determine BP-1, BP-2, BP-3, BP-8, 4-HBP, 4,4′-DHBP, and other UVFs in river water and sediments from the Evrotas River in Greece [45]. During this study, samplings were conducted according to the recommended guidelines on chemical monitoring of river water and sediment from Directive 2000/60/EC [46]. Water samples were analyzed following the method by Gago-Ferrero et al. [47]. For sediments, a pressurized liquid extraction (PLE) was performed according to the method of Gago-Ferrero [48]. The separation was achieved using a mobile phase consisting of water and acetonitrile (ACN), both with 0.1% formic acid. Positive ionization (PI) mode was selected for the MS/MS detection. Under the optimized chromatographic conditions, the method showed low limits of quantification (LOQs) for river water and sediments. BP-3 was the most frequently detected UVF (in 88% of investigated samples), with high concentrations ranging from 0.2 to 2031 ng/L; three of its metabolites (BP-1, 4-HBP, and 4,4′-DHBP) were also detected with an average concentration of 50 ng/L.
In the same year, Força-Lima et al. reported an efficient sampling methodology with a semipermeable membrane device (SPMD) for the extraction and preconcentration of some organic UVFs (includingBP and BP-3) from swimming pool water [49]. The analytical determination was performed using high-performance liquid chromatography with diode array detection (HPLC-DAD). Chromatographic separation was carried out in isocratic elution mode (ACN and phosphate-buffered solution 0.01 M, pH = 3.5). BP and BP-3 were monitored at 204 nm. Analysis via ultraviolet–diode array detection (UV-DAD) showed higher limits of detection (LODs) than tandem mass spectrometry for both analytes. The extraction performance of the extraction device was also verified via the BP determination in swimming pool water and obtaining recovery percentages in the range of 74.9–98.5%. The main breakthrough of this work was the use of an SPMD prepared with a low-density polyethylene membrane for the sampling of organic substances belonging to different classes of UVFs simultaneously. The advantages of this methodology are the simplicity and the fact that it is not necessary a cleanup pretreatment.
A liquid chromatography–mass spectrometry (LC-MS) analysis was optimized by Horricks et al. [50] for the determination of BP-3 widespread in seawater of Grenada, West Indies, using water and methanol with 0.1% formic acid as the mobile phase. Seawater samples were extracted with methylene chloride, and the extracts were evaporated until dry and re-suspended in methanol for LC-MS analysis. LODs and LOQs of this method were not reported. Percent recovery was reported between 107 and 121%. BP-3 was detected in 60% of seawater samples with a mean concentration of 0.046 μg/L.
In analytical fields, significant efforts are continually being carried out to develop new methodologies that improve the performance of extraction methods from environmental matrices. The main goal in sample preparation is to design stationary phases for dealing with the retention of polar and apolar analytes simultaneously. An attempt to improve the selectivity or specificity toward target analytes was developed by Kharbouche et al. using a solid phase extraction (SPE) with silica-based mesoporous, functionalized with cyanopropyl groups for the determination of BP-1, 4-HBP, and 4,4′-DHBP in river and swimming pool water [51]. The quantification of these emerging contaminants in water was carried out using LC-MS/MS in both PI and negative ionization (NI) modes. For the chromatographic separation, a C8 column with 0.1% formic acid (PI) or 5 mM ammonium formate (NI) and methanol as mobile phase were used. The recoveries for 4,4′-DHBP and BP-1 were between 61.9 and 66.8%, while for 4-HBP, they were higher than 85.8%. The low recovery values observed for 4,4′-DHBP and BP-1 can be explained by the interactions between these compounds and the salts present in the sample. This could be a disadvantage when it is necessary to preconcentrate salty samples such as seawater. The intraday relative standard deviation (RSD%) values were in the range of 6.0 and 15.5%. All BPs were detected in swimming pool water but at concentrations lower than their LOQs. Conversely, in the river water sample, none of the investigated BPs was detected.
Mallappa Gopal et al. (2020) developed a liquid chromatography linear ion-trap tandem mass spectrometer method (LC-MS/MS) for the investigation and quantification of BP-1, among 11 other pharmaceutical and personal care products in water samples collected from Arkavathi river (India) [52]. The samples were pretreated with SPE. Analytes were resolved in reverse phase (RP) using methanol and ammonium acetate (5 mM, pH 5.8) as the mobile phase. All target analytes were quantified in NI. The results were compared with other studies existing in the literature. The main breakthrough of this method over already existing ones is to permit a rapid determination of pharmaceutical drugs belonging to different classes like antibiotics, non-steroid anti-inflammatory drugs, parabens, UVFs, plasticizers, and antibacterials in a single procedure at low concentrations. Generally, the determination of pharmaceuticals in water by ion trap is scarce due to lack of sensitivity in comparison with triple quadrupole mass spectrometers [53,54]. This LC-MS/MS method proved to be sensitive and reliable. The Oasis HLB sorbent used to preconcentrate water samples proved for BP-1 recoveries ranging from 68.86% to 90.72%. Data for precision were within the satisfactory limit of 15%, according to the adopted guidelines [55].
The study of Cadena-Aizaga et al. analyzed the occurrence of eight organic UVFs (including BP-3) in seawater from three beaches on Gran Canaria Island (Spain) and in three wastewater treatment plants [56]. The UVFs determination was carried out by SPE-LC-MS/MS in PI mode, using methanol/water with 0.1% (v/v) formic acid as the mobile phase. LOD and LOQ values were in order of ng/L for both seawater and wastewater. The extraction recoveries range was 78.9–99.3%. Intraday and interday precision ranged between 0.02% and 13.0%. BP-3 was the most recurrent compound in the seawater samples (frequency detection of 83%), with concentration ranges from 0.16 to 20.5 μg/L. Also, in wastewater, it was present in all samples, with loads ranging from 200 to 903 μg/d/1000 inhabitants.
In 2021, Fisch et al. conducted a study to identify BP-1, BP-2, BP-3, BP-4, and 4,4′-DHBP in the coastal waters of the Delta Pearl River (China) [57]. LC-MS/MS analysis was carried out using chromatographic conditions similar to Cadena-Aizaga [56]. The ionization was instead achieved in both PI and NI modes. LODs and LOQs for the target compounds ranged between 0.01 and 2.4 ng/L. Average recovery percentages were good for all investigated BPs except for BP-3 (33%). The other mean recoveries were 85% (BP-1), 89% (BP-2), 99% (BP-4), and 76% (4,4′-DHBP). The four UVFs were detected with a detection frequency of 40–100% in a concentration range from 1.3 to 24.3 ng/L.
BP-1, BP-2, BP-3, BP-4, BP-8, 4-HBP, and 4,4′-DHBP were also investigated in seawater and sediments along the coast of Mahdia (Tunisia) using an SPE-LC-MS/MS method [58]. The performance of the applied method was previously validated by Gago-Ferrero et al. [47,48]. The chromatographic separation was always achieved on the RP column with methanol and 0.1% formic acid or 5 mM ammonium formate as mobile phases. MS/MS detection was performed in PI mode for all BPs except for BP-4, which, being an aromatic sulfonic acid with a very strong acidic character, can solely be ionized under NI mode [59]. Recoveries were between 70 and 110%, with good reproducibility. BP-3 was present in all water samples with concentrations in the range of 16.4 to 66.9 ng/L. In sediments, neither BPs were found.
Another SPE-LC-MS/MS method for the determination of 18 UVFs in swimming pool water was performed by Mokh et al. in 2022 [60]. The authors reported a SPE extraction followed by two different analytical methods: LC-MS/MS for BP-4 analysis and GC/MS for the determination of BP-3 and BP-8. For LC analysis, a C8 column with gradient elution with pure water/ACN was used. The MS/MS was achieved in PI. Recovery for BP-4 was 68%, and RSD for repeatability values was below 20%. The method has proven to be sensitive enough to detect traces of BP-4.
Recently, Brown et al. tested a unified method to quantify eight UVFs (between them BP-3, BP-4, and BP-8) by SPE-LC-MS/MS in both NI and PI modes using polarity switching [61]. The method was applied to chlorinated outdoor pool waters in Winnipeg, Canada. The chromatographic separation was performed in gradient elution with water and ACN (0.05% formic acid). The validated method resulted in accuracies ranging from 97 to 104%. It is important to note that, in pool waters in comparison to seawater, greater concentrations of oxidative substances, especially chlorine, contribute to the photodegradation and generation of non-target transformation products; this can be responsible for the fluctuations in UVF concentrations during method validation.
Besides the water matrix, several authors investigated soils and sediments to monitor the widespread of BPs in the environment.
Votani et al. presented a new approach, named on-line extraction (OLE), coupled to liquid chromatography for the analysis of BP-3 and other organic UVFs from complex solid samples [62]. Specifically, they replaced the sample loop of a conventional LC injection valve with an extraction vessel consisting of an empty guard column filled with the solid sample. Upon injection, the mobile phase flows through the extraction vessel and accomplishes the dynamic extraction of the analytes assisted by the high pressure developed in the LC system. The eluted analytes are then directly transferred to the LC column for separation and analysis. In this manner, the on-line analysis is accomplished without the need for additional sample pretreatment; steps such as cleaning, solvent exchange, filtration, and drying of the extracts are no longer required [63]. The extraction and LC analysis were performed in an LC system equipped with a UV/Vis detector. The peak area was monitored at 285 nm for all analytes. The chromatographic separation was performed in a thermostated (40 °C) column using methanol/water (75/25) as the mobile phase. The method was optimized for the extraction of hydrophobic UV filters from spiked soil and sediment samples, yielding recoveries between 59 and 117%, which are comparable to those reported from more advanced sample preparation methods.
2.1.2. Biota Marine Matrices
The already cited study of Díaz-Cruz et al. reported an SPE-LC-MS/MS method for the investigation of BP-1, BP-2, BP-3, BP-8, 4-HBP, and 4,4′-DHBP in fish collected from the Evrotas River in Greece [45]. Biota samplings were conducted following the recommended guidelines on chemical monitoring from Directive 2000/60/EC [46]. Fish samples, previously lyophilized and homogenized, were extracted using a PLE instrument for sediment analysis. Compared to the purification of water samples, where an online SPE is enough, for fish samples, additional purifications were required to better remove fats and proteins. Biota samples were analyzed according to the method by Gago-Ferrero et al. [47]. BP-2 was detected in all fish samples, ranging from 11.8 to 41.9 ng/g dw. BP3 was detected in 50% of the fish samples at low concentrations (from <LOQ to 1.8 ng/g dw).
The HPLC-MS analysis in Horricks et al.’s study investigated BP-3 presence in the invasive Pacific lionfish (Pterois volitans) collected in the nearshore waters of Grenada, West Indies [49]. LODs and LOQs of the method were not reported. Percent recovery was reported between 107 and 121%. Residues of BP-3 were detected in 24% of lionfish muscle at an average concentration of 1.46 μg/kg.
A microwave-assisted extraction (MAE), followed by LC-MS/MS, was applied to the analysis of BP-3 and other UVFs in macrophytes (seaweeds and seagrass) collected from three different beaches on Gran Canaria Island (Spain) [64]. Determination was performed by a UHPLC system equipped with a C18 column (50 × 2.1 mm, 1.7 μm) and an MS/MS detector in PI. The extraction recoveries range was 51.8–65.4%. Intraday and interday precision ranged between 2.66% and 10.44%. BP-3 presented the lowest frequencies (16–25%) between the investigated UVFs.
2.2. Dibenzoyl Methane Derivatives
Dibenzoyl methane derivatives are substituted diketones with characteristics of UVA filters (enol form). The keto form is responsible for high photoisomerization, resulting in a significant loss of protective power. These compounds have exceptionally high molar extinction coefficients but low photostability [35]. Structurally like BPs, the avobenzone (AVO) is a long-wave UVF, which easily dissociates into oxygen-free radicals and derivatives and may damage proteins and DNA. Due to its high Log Kow (4.51), AVO could affect aquatic organisms at lower concentrations [65]. Its allowed concentration is limited to 5% by the EU legislation [32]. In sunscreen formulations, AVO is used in the enol form, with excellent UVA absorption, but easily isomerizes to the di-keto form, losing effectiveness [66].
Environmental and Biota Marine Matrices
In two distinguished studies by Cadena-Aizaga et al., the presence of AVO in seawater [56] and in macrophytes (seaweeds and seagrass) [64] was investigated from three different beaches on Gran Canaria Island (Spain). Analytical methods have already been described in Section 2.1.1 and Section 2.1.2. The average recoveries were 85% and 60% in seawater and macrophytes, respectively. Intraday and interday precision were always below 15%. The detection frequency of AVO in the summer period in seawater was of 56%, with a maximum concentration of 88.9 µg/L [56]. In macrophytes, AVO was detected in 85% of samples (maximum concentration of 3663 ng/g dw) [64].
AVO was also investigated in seawater and sediments along the coast of Mahdia (Tunisia) by Fenni et al. [58]. The SPE-LC-MS/MS method is reported in Section 2.1.1. MS/MS detection was performed in PI mode. Over a period of 6 months, AVO was detected both in seawater and in sediment samples, showing its widespread occurrence in all investigated locations and seasons. Average concentrations in seawater and sediments were 16.3 ng/L and 17.6 ng/g dw, respectively.
Mokh et al. reported a SPE-LC-MS/MS method for the determination of AVO in swimming pool water (see Section 2.1.1 for detailed description) [60]. Satisfactory method performance for AVO was reported with high recovery (98%) and RSD for repeatability values below 15%. The method showed a LOD suitable for environmental assessment studies.
More recently, Brown et al. tested an SPE-LC-MS/MS for AVO analysis in pool water. MS/MS detection was performed in PI [61]. The performance of the validated method resulted in excellent accuracy (97%), with good LOD and LOQ.
Seyer et al. investigated the interaction of two plant species (Lemna gibba and Cyperus alternifolius), commonly found near lakes, with three UVFs widely used in sunscreens, including AVO [67]. The parent compound and its transformation products found within the plant tissue were characterized by employing HPLC coupled to a quadrupole time-of-flight mass spectrometer (QTOF-MS). Chromatographic separation was carried out on the C18 column (50 × 4.6 mm, 2.7 μm) with a mobile phase consisting of water and ACN with 0.1% formic acid. For AVO, several transformation products resulting from hydroxylation, demethylation, and oxidation of the parent molecule have been investigated. Furthermore, a kinetic study on the uptake and biotransformation of UVFs was conducted over a period of 216 h, revealing that they were mostly present in their parent form and only, to a smaller part, converted into transformation products.
2.3. Benzotriazoles
Benzotriazoles (BTs) are a class of compounds characterized by a phenolic group attached to the benzotriazole structure. They absorb the full spectrum of UV light and are widely used in personal care and plastic products. Like BPs, in recent decades, BTs have also been accused of being endocrine disruptors and, due to their potentially hazardous effects, they caught more attention from the scientific community.
Although their toxicological effects are still poorly understood, many countries have set limits on the consumption of BTs. For example, the Japanese Government has banned the production, use, and import of UV-320 since 2007 [68].
2.3.1. Environmental Matrices
Wang et al. (2018) proposed an SPE-HPLC-UV method for the determination of six BT UVFs in water and cosmetic samples [69]. The six BTs (UV-P, UV-234, UV-326, UV-327, UV-328, and UV-329) were separated with a C18 column (150 × 4.6 mm, 5 μm) in isocratic elution with a mobile phase comprising methanol/water (95/5). The UV detector was set at 340 nm. Under the optimized conditions, the method showed a wide linear range from 20.0 to 1000 μg/L for all compounds with good correlation coefficients and acceptable reproducibility (RSDs < 6.5% for intra-day, RSDs < 8.1% for inter-day). Satisfactory recoveries ranged from 89 to 105%.
Díaz-Cruz et al. (2019) investigated the presence of 1HBT, UV-P, MeBT, DMeBT, TBHPBT, UV-326, UV-327, UV-328, and UV-329 using SPE-LC-MS/MS in river water and sediments from the Evrotas River in Greece [45]. The method has already been described in detail in Section 2.1.1. In river water, MeBT was the most frequently detected BT (in 88% of the samples), with a maximum concentration of 784.7 ng/L. In sediments, no BT compound was determined.
The study of Cadena-Aizaga et al. (2022) analyzed the occurrence of two BTs (DTS, UV-360) in seawater and wastewater [56]. The SPE-LC-MS/MS method has already been described in detail in Section 2.1.1. The extraction recovery range was 56.5–91.3% for DTS, while for UV-360, it was very low (20.0–43.8%). Intraday and interday precision were below 15%. DTS was detected with different detection frequencies on seawater (28%) and wastewater samples (67–100%). In seawater samples, UV-360 showed a low frequency of detection (6%), which was much more variable in wastewater (17–83%), depending on the sampling date, and an input load range of 1207–2637 μg/d/1000 inhabitants.
MeBT and UV-P were investigated, among others UVFs, in seawater and sediment along the coasts of center East Tunisia by Fenni et al. [58]. The used SPE-LC-MS/MS method was previously validated by Gago-Ferrero et al. [47,48]. MeBT was found at similar concentrations in seawater (15.2–34.6 ng/L) and in sediment samples (8.7–24.9 ng/g dw). UVP was detected in nearly all analyzed water samples at similar levels as MeBT, but it was not detected in sediment samples. The highest detected concentrations for MeBT and UVP in seawater were 34.6 ng/L and 50.9 ng/L, respectively.
Five BTs (UV-P, UV-234, UV-327, UV-328, and UV-329) were investigated by Yu et al. in environmental specimens, including sediment and river water samples [70]. A core–shell magnetic material, beta-cyclodextrin-based, was first synthesized for the extraction by SPE from complex environmental matrices. The chromatographic separation process was accomplished by using a C18 column (150 × 4.6 mm, 5 μm) with a mobile phase consisting of water and ACN. The organic UVFs were detected by a UV detector at the wavelength of 210 nm. Under the optimized conditions, the linear ranges were 5.0–500 ng/mL for all BTs with regression coefficients > 0.9984. Precision and accuracy were satisfactory, with RSD values below 10% and recoveries in the range of 84.2–109%.
2.3.2. Biota Marine Matrices
The already cited study of Díaz-Cruz et al. also reported the monitoring of 1HBT, UV-P, MeBT, DMeBT, TBHPBT, UV-326, UV-327, UV-328, and UV-329 in fish collected from the Evrotas River in Greece [45]. Fish sampling was conducted following the recommended guidelines on chemical monitoring from the Directive 2000/60/EC [46]. The analytical SPE-LC-MS/MS method is that reported by Gago-Ferrero et al. [47]. An interesting outcome regards the ubiquitous accumulation of MeBT in all analyzed fish samples, with a range concentration from 3.5 to 6.2 ng/g dw. Although this compound is polar enough (log Kow 1.89), its high acidic dissociation constant (pKa 8.7) prevents its anionic form at the river water pH (7–8.2), and thus, it can be adsorbed and bioaccumulated.
A recent study by Cadena-Aizaga et al. reported a MAE-LC-MS/MS method for the analysis of different organic UVFs, including DTS and UV-360, in seaweed and seagrass collected from Gran Canaria Island (Spain) [64]. The chromatographic conditions have already been described in detail in Section 2.1.2. The average extraction recoveries for DTS and UV-360 were 49.2% and 95.5%, respectively. Satisfactory intraday and interday precision were reported in a range from 2.78% and 8.39%. DTS concentrations measured in macrophytes samples ranged from 4.63 to 663 ng/g dw (detection frequency 57%) versus UV-360 concentrations between 9.46 and 969 ng/g dw (detection frequency 37%).
2.4. Cinnamates
Cinnamates possess high molar absorption coefficients and are heavily used sunscreen ingredients, present in over 90% of sun care products. Ethylhexyl methoxycinnamate (EMC) is currently the most popular organic UVF, with good UV absorption, safety, solubility in oils, and insolubility in water, so it is suitable for its use in most waterproof sunscreen formulations [35].
Environmental and Biota Marine Matrices
Díaz-Cruz et al. investigated the presence of EMC in river water, sediments, and fish from the Evrotas River in Greece [45]. The SPE-LC-MS/MS method has already been described in detail in Section 2.1.1. The LOQ range for EMC were 0.2–6 ng/L in river water, 0.02–0.2 ng/g dw in sediments, and 0.33–5.91 ng/g dw in fish. The EMC was not found in either water, sediment, or fish samples.
EMC was also monitored in seawater and lionfish (Pterois volitans) samples from the nearshore waters of Grenada, West Indies [49]. LODs and LOQs of the method were not shown, whereas a percent recovery between 107 and 121% was reported. Horricks et al. found EMC residues in 20% of seawater samples at an average concentration of 0.008 μg/L. No EMC was detected in any lionfish samples.
Força-Lima et al. reported an HPLC-DAD method for the determination of EMC in swimming pool waters [49]. The analytical method has already been described in Section 2.1.1. The extraction recovery percentages ranged from 90.4% to 116.0%.
The HPLC-UV method of Votani et al. also included, among various UVFs, the determination of EMC and IMC from soils and sediments [62]. The on-line extraction exhibited recovery lower than 40% for EMC and around 60% for IMC.
IMC was also investigated by Cadena-Aizaga et al. in two different studies, in seawater [56] and in macrophytes [64], collected from Gran Canaria Island (Spain). Analytical methods have already been described in Section 2.1.1 and Section 2.1.2. The average recoveries were 97.3% and 63.0% in seawater and macrophytes, respectively. Intraday and interday precision were always below 15%. The detected maximum concentration was 4.27 µg/L in seawater [56] and 186 ng/g dw in macrophytes [64].
In 2021, Fisch et al. investigated EMC in the coastal waters of the Delta Pearl River (China) [57]. The LC-MS/MS method (described in detail in Section 2.1.1 paragraph) showed satisfactory LOD and LOQ values. The mean recovery percentage for EMC was not determined. No EMC residue was found in any samples.
In the study of Fenni et al., EMC was monitored in seawater and sediments along the coast of Mahdia (Tunisia) [58]. A detailed description of the SPE-LC-MS/MS method was reported in Section 2.1.1. Over a period of 6 months, AVO was detected both in seawater and in sediment samples, showing its widespread occurrence in all investigated locations and seasons. Between the UVFs investigated in this study, EMC was the compound with the highest average concentrations in both seawater (296 ng/L) and sediment (4.8 ng/g dw).
Brown et al. investigated the presence of EMC in pool water by the SPE-LC-MS/MS method, using PI mode detection [61]. The method performances resulted in good accuracy (86%), with satisfactory LOD and LOQ values.
2.5. Salicylates
Salicylate esters such as ethylhexyl (EHS) and homosalate (HMS) are among the most common UVFs currently used in sunscreen preparations. They are ortho-disubstituted compounds, which allow for the formation of internal hydrogen bonds and therefore decrease the ability of electrons to interact with other ingredients or biological substrates [35]. Therefore, they have excellent safety characteristics, and although they are relatively weak UV absorbers, they are often incorporated into cosmetic formulations. They are often found in association with benzophenones, of which they favor solubilization in cosmetic formulations.
Environmental and Biota Marine Matrices
Two distinguished HPLC-UV methods for the analysis of EHS and HMS in swimming pool water and in sediments were reported by Força-Lima et al. [49] and Votani et al. [62], respectively. Two different wavelengths were used: 204 nm [49] and 285 nm [62]. LODs and LOQs in water were in the format of µg/L for both analytes; in sediments, only a linearity range (0.25–25 μg/g) was reported. Average recoveries from pool water were 105.4% (EHS) and 103.5% (HMS).
Another HPLC-UV method for EHS analysis from sediment and river water samples is that reported by Yu et al. [70]. The UV detector was set at the wavelength of 210 nm. Under the optimized conditions, low LODs and LOQs were reported. Precision and accuracy were very satisfactory, with RSDs below 10% and an average recovery of 99.9%.
HMS was instead monitored by Cadena-Aizaga et al. in seawater [56] and in macrophytes [64] using the SPE-LC-MS/MS method. The average recoveries were 95.0% and 42.7% in seawater and macrophytes, respectively. Intraday and interday precision were always below 13.5%. The detected maximum concentration was 39.8 µg/L in seawater [56] and 8128 ng/g dw in macrophytes [64].
Finally, Brown et al. investigated the presence of EHS, and HMS in pool water by SPE-LC-MS/MS method, using PI mode detection [61]. The method performances resulted in good accuracy (recovery range 80–112%), with valuable LODs and LOQs.
The presence of EHS was also studied in two aquatic plant species, Lemna gibba and Cyperus alternifolius, by Seyer et al. [67]. In this study, parent drug and eventual biotransformation products found within the plant tissue were characterized by employing the LC-QTOF-MS method. It was demonstrated that only a smaller part of EHS was converted into transformation products. The maximum concentration found in the plant material was 2 μg/g.
2.6. Crylenes
Octocrylene (OCR) is the main representative of this class of UVFs. It mainly absorbs UVB radiation and short UVA wavelengths, and it is used to either provide an appropriate sun protection factor in sunscreen products or to protect cosmetic formulations from UV radiation. Like other chemical UVFs, OCR was also incriminated to potentially induce adverse effects on the endocrine system in addition to having allergic and/or photoallergic potential. Its safety profile is constantly under assessment by the European Chemical Agency (ECHA). The available data show that octocrylene can be considered as safe when used at a concentration of up to 10%.
Environmental and Biota Marine Matrices
From the examined literature, it emerges that the predominant analytical technology used for the analysis of OCR is LC-MS/MS. Only an HPLC-UV method for its determination from soils and sediments was reported [62]. The OLE extraction permitted recovery higher than 85%. LOD and LOQ values were not reported, while the linearity range was 0.25–25 μg/g. Details of all analytical methods are reported in previous paragraphs.
A total of five LC-MS-MS methods for OCR detection in environmental and biota marine matrices were found.
Diaz-Cruz et al. [45] analyzed it in river water, sediments, and fish. In sediment samples, OCR was ubiquitous, with a concentration of 0.1–0.7 ng/g dw. It was not detected in any water and fish samples.
The widespread of OCR was also studied in two aquatic plant species, Lemna gibba and Cyperus alternifolius, by Seyer et al. [67]. In this study, parent drug and eventual biotransformation products found within the plant tissue were characterized employing the LC-QTOF-MS method. It was demonstrated that only a smaller part of OCR was converted into hydroxylated transformation products.
The SPE-LC-MS/MS method of Cadena-Aizaga et al. was used to monitor OCR in seawater [56] and macrophytes [64]. The average recoveries in seawater and macrophytes were 86.7% and 69.2%, respectively. Intraday and interday precision were always below 15%. The detected maximum concentration was 171.0 µg/L in seawater [56] and 19,369 ng/g dw in macrophytes [64].
Fisch et al. used the SPE-LC-MS-MS method for investigating the presence of OCR in the coastal waters of the Delta Pearl River (China) [57]. Under the optimized conditions, the method showed good LOD and LOQ values but a very low recovery percentage (16%). The OCR was detected with a detection frequency of 100% at a mean concentration of 33.9 ng/L.
Finally, the LC-MS/MS method of Brown et al. for the determination of OCR in swimming pool water showed satisfactory method performances with good recovery (75%) and valuable LOD and LOQ [61].
2.7. p-Aminobenzoic Acid (PABA) Derivatives
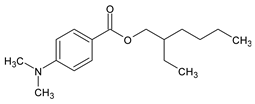
PABA was introduced in the 1970s as a UVB filter. It has been shown to cause allergic dermatitis and photosensitivity. For these reasons, it is less used nowadays. Another concern is related to a probable thyroid-disrupting activity related to its long-term effect. Its derivatives are thus used as alternatives, but their safety is still debated [71]. The most commonly used Padimate O (ODPABA) is an efficient UVB filter PABA derivative that seems to cause fewer hypersensitivity reactions than its congener [71]. However, ODPABA seems to act as a weak endocrine disruptor [72]. This endocrine disruptive potential is also reported for EtPABA, which is another PABA derivative [73]. Due to its hazardous potential, PABA use is actually banned in both Canada and the European Union [27,28], while the FDA limited its use to a maximum concentration of 15%. The FDA also limited ODPABA use to a maximum concentration of 8% [29].
Environmental and Biota Marine Matrices
EtPABA and ODPABA were investigated in river water, sediments, and fish from the Evrotas River (Greece) by Diaz-Cruz et al. [45]. The validated SPE-LC-MS/MS method (described in detail in Section 2.1.1) provided very good LOQ ranges for all three different matrices. In sediment and fish samples, EtPABA and ODPABA concentrations were either below their respective limits of quantification or were not detected. In water, EtPABA was one of the most frequently detected (in 88% of the collected samples), with a maximum concentration of 955.8 ng/L, whereas ODPABA was measured (38%) at lower concentrations, with a maximum value of 25.1 ng/L.
Fenni et al. monitored EtPABA in seawater and sediments along the coast of Mahdia (Tunisia) [58]. The SPE-LC-MS/MS method was described in detail in Section 2.1.1. EtPABA was detected in all water samples with concentrations in the range 7.3–37.7 ng/L, but it was absent in the respective sediment samples.
Two HPLC-UV methods for the determination of ODPABA in sediments [62], and in river water samples [70] were reported. The method of Votani et al. exhibited extraction recoveries from 59 to 117% [62]. LOD and LOQ values were not reported, while the linearity range was 0.25–25 μg/g. Yu et al. reported LOD and LOQ of 1.3 and 4.0 ng/mL, respectively. Precision and accuracy were very satisfactory, with RSDs below 10% and an average recovery of 98%.
2.8. Camphor Derivatives
Camphor derivatives are bicyclic compounds with high extinction coefficients. The 4-Methylbenzylidene camphor (4-MBC) is the most used agent of this class. It protects in the UVB range (290–320 nm) with a peak absorbance of 301 nm. It is legally approved both in the EU and Australia up to 4%. However, it is not approved in the US [35] and in Japan. Because of information on potential genotoxicity as an endocrine disruptor, a re-evaluation of the maximum permitted concentration of 4-MBC by the EU is underway.
Environmental and Biota Marine Matrices
Several authors used the LC-MS/MS method for 4-MBC detection in environmental and biota marine specimens. Details of analytical methods have already been described in Section 2.1.1 and Section 2.1.2.
Diaz-Cruz et al. [45] monitored 4-MBC in river water, sediments, and fish, obtaining the highest concentration of 4MBC in sediment samples (1400.4 ng/g dw). In more than half of the water samples (56%) 4-MBC was present with a concentration of 63.7 ng/L, whereas in fish, it was determined to a lower extent in all the analyzed species.
Additionally, 4-MBC was monitored in seawater and lionfish (Pterois volitans) samples from the nearshore waters of Grenada, West Indies [50]. LODs and LOQs of the method were not shown, whereas a percent recovery between 107 and 121% was reported. Horricks et al. found it in 12% of lionfish samples at an average concentration of 2.11 μg/kg, whereas no 4-MBC was detected in seawater.
Cadena-Aizaga et al. investigated its presence in seawater [56] and in macrophytes [64]. The average recoveries were 97.9% and 87.4% in seawater and macrophytes, respectively. Intraday and interday precision were always below 15%. The detected maximum concentration was 17.5 µg/L in seawater [56] and 237 ng/g dw in macrophytes [64].
Fisch et al. used the SPE-LC-MS-MS method for the investigation of the presence of 4-MBC in the coastal waters of the Delta Pearl River (China) [57]. Under the optimized conditions, the method showed good LOD and LOQ values but a very low recovery percentage (26%). The 4-MBC was not detected in any investigated samples.
The LC-MS/MS method of Fenni et al. for the determination of 4-MBC in seawater and sediments reported valuable LOD and LOQ values [58]; 4-MBC was absent in seawater samples but present in sediments, ranging from <LOQ to 17.10 ng/g dw.
Instead, only two HPLC-UV methods for the analysis of 4-MBC were reported for swimming pool water [49] and sediments [62]. LODs and LOQs in water were in the format of µg/L, and they were not reported for sediments. The extraction recovery percentages from water ranged from 79.3 to 98.4%.
2.9. Triazine Derivatives
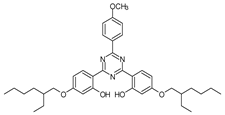
Triazines are an important class of UVFs whose occurrence in the environment and human exposure still needs to be investigated. The basic structure of this class of UVFs consists of a heterocyclic 1,3,5-triazine group, which gives high photostability, absorption efficiency, and broad-spectrum UV protection. The most representative compounds of triazine UVFs include ethylhexyl triazone (EHT), bis-ethylhexyloxyphenol methoxyphenyl triazine (BEMT), and diethylhexyl butamido triazone (DBT).
Environmental and Biota Marine Matrices
EHT, BEMT, and BDT were monitored in swimming pool water using the SPE-LC-MS/MS method (see Section 2.1.1 for detailed description) [60]. Satisfactory method performances were reported for all three UVFs with high recoveries (81–97%), good LODs, and RSD values below 20%.
3. Results and Discussion
In this review, we summarized recent reports on liquid chromatographic methods used to analyze organic UVFs in environmental and marine biota matrices (Table 2).

Table 2.
Chromatographic methods for the analysis of organic UVFs.
Nowadays, their accurate determination is a high topic of concern in the Scientific Community. In fact, UVF contamination may derive from different sources, considering their wide use in personal care products, plastics, paints, and textile industries, as well as preventing agents in many industrial, commercial, and food products [74,75].
According to the different compositions of the matrices, several extraction procedures were developed to isolate the analyte of interest that can be, in this way, determined with a high sensitivity.
Most of the studies reported in this review used the SPE procedure, sometimes modified according to the chemical structure of the UVF to be determined [45,51,52,56,60,61,69,70]. Other authors developed alternative extraction techniques using a semipermeable membrane device for the simultaneous extraction of different UVF classes [49]. Another innovative extraction method consisted of an on-line extraction that allowed for the extraction of the analytes from sediments without additional sample pretreatment [62]. A microwave-assisted extraction was instead used for the investigation of several UVFs in macrophytes (seaweed and seagrass) [64].
Most of the studies reported in this review quantified UVFs using liquid chromatography coupled with a MS/MS detector; alternatively, the UV detector is used by several authors (Table 2). Generally, LC-MS/MS methods showed limits of sensitivity better than UV detection (ng/L vs. µg/L) for the same analytes. The majority of authors calculated LOD and LOQ as 3 and 10 times the signal-to-noise (S/N) ratio, respectively.
MS/MS detection was generally performed in PI mode with few exceptions; for instance, between BPs, solely the aromatic sulfonic acid BP-4, being a very strong acid, was ionized under NI mode by all authors [57,58,61], except for Mokh et al. [60]. In this case, the PI mode resulted in worse detection limits, as can be seen in Table 2.
The most used mobile phase for compounds analyzed in PI mode has been found to be water and methanol (both with 0.1% formic acid). Several authors preferred the mixture of water/ACN that, having a lower viscosity than water/methanol, reduces the pressure problems mostly frequent in LC [45,49,60,61,67,70]. Usually, mobile phase additives like formic and acetic acids, ammonium formate, and ammonium acetate are used in LC-MS methods, where they can improve analyte ionization. Nevertheless, Mokh et al. reported that the signal intensities were better without additives for all tested compounds [60]. Comparing the literature data in Table 2, LOD values reported by Mokh et al. are slightly higher than other methods for the same matrix, except for AVO, where, instead, it seems more sensitive.
In conclusion, the high number of studies reported in the last five years employing different chromatographic techniques for the determination of UVFs in environmental and marine biota matrices shows that there is a constant effort of the scientific community to develop increasingly sensitive methods. This trend is certainly related to the high concern for their ubiquitous presence, which poses a serious threat to the entire ecosystem.
Often, the complexity of the matrix makes it difficult to develop multi-residue methods able to identify and quantify several analytes with the minimum sample manipulation, and in a reduced time without compromising separation and resolution efficiency [76].
For the determination of organic UVFs in investigated matrices, chromatographic separation was generally performed on reverse phase C18 columns, except for two studies that used a C8 column [51,60].
4. Conclusions
This review gave particular attention to the analytical performances, e.g., detection limits, accuracy, and repeatability of reported analytical methods for the determination of UVFs in environmental and biota marine matrices.
Bibliographic data analysis showed that water samples were the main testing substrate to confirm the presence of UVFs in aquatic environments. For a reliable risk estimation, it is important to consider the concentration of contaminants in the different environmental compartments. However, only a few research studies considered organisms living in sediments/soils; thus, this aspect would need a deeper evaluation to study the effect of the UVFs on them. Moreover, the use of potential sentinel animals as environmental indicators could be advantageous, also considering that the costs of LC-MS analysis would be lower than screening in large sample sizes, such as seawater.
Another critical point is that most studies focus on analyzing only parent compounds; this would highly underestimate exposure levels to these contaminants. Although several metabolites have been studied for many organic UVFs, they would need to be further investigated for bioaccumulation, toxicological, and environmental studies. For this purpose, a non-targeted analysis could be useful.
Author Contributions
Conceptualization, M.N.; writing—original draft preparation, M.N. and E.B.; writing—review and editing, E.B. and V.P.; funding acquisition, M.P.D. All authors have read and agreed to the published version of the manuscript.
Funding
This research was partially funded by “FONDO DI ATENEO PER LA RICERCA 2020—University of Sassari”.
Data Availability Statement
No new data were created in this study. Data sharing is not applicable to this article.
Conflicts of Interest
The authors declare no conflicts of interest.
References
- Jesus, A.; Sousa, E.; Cruz, M.T.; Cidade, H.; Lobo, J.M.S.; Almeida, I.F. UV Filters: Challenges and Prospects. Pharmaceuticals 2022, 15, 263. [Google Scholar] [CrossRef]
- Chen, L.L.; Wang, S.Q. Nanotechnology in Photoprotection. In Nanoscience in Dermatology; Academic Press: Cambridge, MA, USA, 2016; ISBN 9780128029459. [Google Scholar]
- Richardson, S.D.; Ternes, T.A. Water Analysis: Emerging Contaminants and Current Issues. Anal. Chem. 2022, 94, 382–416. [Google Scholar] [CrossRef]
- Hiller, J.; Klotz, K.; Meyer, S.; Uter, W.; Hof, K.; Greiner, A.; Göen, T.; Drexler, H. Systemic Availability of Lipophilic Organic UV Filters through Dermal Sunscreen Exposure. Environ. Int. 2019, 132, 105068. [Google Scholar] [CrossRef]
- Ramos, S.; Homem, V.; Alves, A.; Santos, L. Advances in Analytical Methods and Occurrence of Organic UV-Filters in the Environment-A Review. Sci. Total Environ. 2015, 526, 278–311. [Google Scholar] [CrossRef]
- Wang, J.; Xiao, X.; Chen, T.; Liu, T.; Tao, H.; He, J. High-Performance Liquid Chromatography-Ultraviolet Method for the Determination of Total Specific Migration of Nine Ultraviolet Absorbers in Food Simulants Based on 1,1,3,3-Tetramethylguanidine and Organic Phase Anion Exchange Solid Phase Extraction to Remove Glyceride. J. Chromatogr. A 2016, 1451, 58–66. [Google Scholar] [CrossRef]
- Hu, L.; Tian, M.; Feng, W.; He, H.; Wang, Y.; Yang, L. Sensitive Detection of Benzophenone-Type Ultraviolet Filters in Plastic Food Packaging Materials by Sheathless Capillary Electrophoresis–Electrospray Ionization–Tandem Mass Spectrometry. J. Chromatogr. A 2019, 1604, 460469. [Google Scholar] [CrossRef]
- Wu, H.; Wu, L.H.; Wang, F.; Gao, C.J.; Chen, D.; Guo, Y. Several Environmental Endocrine Disruptors in Beverages from South China: Occurrence and Human Exposure. Environ. Sci. Pollut. Res. 2019, 26, 5873–5884. [Google Scholar] [CrossRef]
- Liu, Y.; Ling, Y.; Zhang, Y.; Feng, X.; Zhang, F. Synthesis of a Magnetic Covalent Organic Framework for Extraction and Separation of Ultraviolet Filters in Beverage Samples. Food Chem. 2023, 410, 135323. [Google Scholar] [CrossRef]
- Bachelot, M.; Li, Z.; Munaron, D.; Le Gall, P.; Casellas, C.; Fenet, H.; Gomez, E. Organic UV Filter Concentrations in Marine Mussels from French Coastal Regions. Sci. Total Environ. 2012, 420, 273–279. [Google Scholar] [CrossRef]
- Giraldo, A.; Montes, R.; Rodil, R.; Quintana, J.B.; Vidal-Liñán, L.; Beiras, R. Ecotoxicological Evaluation of the UV Filters Ethylhexyl Dimethyl P-Aminobenzoic Acid and Octocrylene Using Marine Organisms Isochrysis Galbana, Mytilus Galloprovincialis and Paracentrotus Lividus. Arch. Environ. Contam. Toxicol. 2017, 72, 606–611. [Google Scholar] [CrossRef]
- Caloni, S.; Durazzano, T.; Franci, G.; Marsili, L. Sunscreens’ Uv Filters Risk for Coastal Marine Environment Biodiversity: A Review. Diversity 2021, 13, 374. [Google Scholar] [CrossRef]
- Lozano, C.; Givens, J.; Stien, D.; Matallana-Surget, S.; Lebaron, P. Bioaccumulation and Toxicological Effects of Uv-Filters on Marine Species. In Handbook of Environmental Chemistry; Springer: Berlin/Heidelberg, Germany, 2020. [Google Scholar]
- Cunha, S.C.; Trabalón, L.; Jacobs, S.; Castro, M.; Fernandez-Tejedor, M.; Granby, K.; Verbeke, W.; Kwadijk, C.; Ferrari, F.; Robbens, J.; et al. UV-Filters and Musk Fragrances in Seafood Commercialized in Europe Union: Occurrence, Risk and Exposure Assessment. Environ. Res. 2018, 161, 399–408. [Google Scholar] [CrossRef]
- Gago-Ferrero, P.; Díaz-Cruz, M.S.; Barceló, D. UV Filters Bioaccumulation in Fish from Iberian River Basins. Sci. Total Environ. 2015, 518–519, 518–525. [Google Scholar] [CrossRef]
- Martín, J.; Zafra-Gómez, A.; Hidalgo, F.; Ibáñez-Yuste, A.J.; Alonso, E.; Vilchez, J.L. Multi-Residue Analysis of 36 Priority and Emerging Pollutants in Marine Echinoderms (Holothuria tubulosa) and Marine Sediments by Solid-Liquid Extraction Followed by Dispersive Solid Phase Extraction and Liquid Chromatography–Tandem Mass Spectrometry Anal. Talanta 2017, 166, 336–348. [Google Scholar] [CrossRef] [PubMed]
- Pawlowski, S.; Petersen-Thiery, M. Sustainable Sunscreens: A Challenge between Performance, Animal Testing Ban, and Human and Environmental Safety. In Handbook of Environmental Chemistry; Springer: Berlin/Heidelberg, Germany, 2020. [Google Scholar]
- Valle-Sistac, J.; Molins-Delgado, D.; Díaz, M.; Ibáñez, L.; Barceló, D.; Silvia Díaz-Cruz, M. Determination of Parabens and Benzophenone-Type UV Filters in Human Placenta: First Description of the Existence of Benzyl Paraben and Benzophenone-4. Environ. Int. 2016, 88, 243–249. [Google Scholar] [CrossRef]
- Rehfeld, A.; Egeberg, D.L.; Almstrup, K.; Petersen, J.H.; Dissing, S.; Skakkebæk, N.E. EDC IMPACT: Chemical UV Filters Can Affect Human Sperm Function in a Progesterone-like Manner. Endocr. Connect. 2018, 7, 16–25. [Google Scholar] [CrossRef]
- Díaz-Cruz, M.S.; Barceló, D. Chemical Analysis and Ecotoxicological Effects of Organic UV-Absorbing Compounds in Aquatic Ecosystems. TrAC Trends Anal. Chem. 2009, 28, 708–717. [Google Scholar] [CrossRef]
- Lukić, J.; Đurkić, T.; Onjia, A. Dispersive Liquid–Liquid Microextraction and Monte Carlo Simulation of Margin of Safety for Octocrylene, EHMC, 2ES, and Homosalate in Sunscreens. Biomed. Chromatogr. 2023, 37, e5590. [Google Scholar] [CrossRef]
- The SCCS Notes of Guidance for the Testing of Cosmetic Ingredients and Their Safety Evaluation, 11th Revision, 30–31 March 2021, SCCS/1628/21. Regul. Toxicol. Pharmacol. 2021, 127, 105052. [CrossRef]
- Raslan, R.; Hassim, M.H.; Chemmangattuvalappil, N.G.; Ng, D.K.S.; Ten, J.Y. Safety and Health Risk Assessment Methodology of Dermal and Inhalation Exposure to Formulated Products Ingredients. Regul. Toxicol. Pharmacol. 2020, 116, 104753. [Google Scholar] [CrossRef] [PubMed]
- Chisvert, A.; Benedé, J.L.; Salvador, A. Current Trends on the Determination of Organic UV Filters in Environmental Water Samples Based on Microextraction Techniques—A Review. Anal. Chim. Acta 2018, 1034, 22–38. [Google Scholar] [CrossRef]
- Adoamnei, E.; Mendiola, J.; Moñino-García, M.; Vela-Soria, F.; Iribarne-Durán, L.M.; Fernández, M.F.; Olea, N.; Jørgensen, N.; Swan, S.H.; Torres-Cantero, A.M. Urinary Concentrations of Benzophenone-Type Ultra Violet Light Filters and Reproductive Parameters in Young Men. Int. J. Hyg. Environ. Health 2018, 221, 531–540. [Google Scholar] [CrossRef]
- Narloch, I.; Wejnerowska, G. An Overview of the Analytical Methods for the Determination of Organic Ultraviolet Filters in Cosmetic Products and Human Samples. Molecules 2021, 26, 4780. [Google Scholar] [CrossRef]
- Official Journal of the European Union. European Commission Regulation (EC) No 1223/2009; Official Journal of the European Union: Luxembourg, 2009. [Google Scholar]
- Health Products and Food Branch. Primary Sunscreen Monograph. Health Canada. 2022. Available online: https://webprod.hc-sc.gc.ca/nhpid-bdipsn/atReq.do?atid=sunscreen-ecransolaire (accessed on 7 January 2024).
- U.S. Department of Health and Human Services. US Food and Drug Administration Sunscreen Drug Products for Over-the-Counter Human Use; Proposal to Amend and Lift Stay on Monograph; U.S. Department of Health and Human Services: Washington, DC, USA, 2019.
- China Food and Drug Administration Safety and Technical Standards for Cosmetics 2022. 2022.
- Ministry of Health, L. and W. Standards for Cosmetics; Ministry of Health and Welfare Notification No. 331/2000. 2001. Available online: https://globalregulatorypartners.com/resource-center/regulatory-intelligence-platform/japan-regulatory-intelligence/japan-cosmetic-regulations/ (accessed on 7 January 2024).
- Official Journal of the European Union. European Commission Regulation (EC) No 1176/2022; Official Journal of the European Union: Luxembourg, 2022. [Google Scholar]
- Fivenson, D.; Sabzevari, N.; Qiblawi, S.; Blitz, J.; Norton, B.B.; Norton, S.A. Sunscreens: UV Filters to Protect Us: Part 2-Increasing Awareness of UV Filters and Their Potential Toxicities to Us and Our Environment. Int. J. Women’s Dermatol. 2021, 7, 45–69. [Google Scholar] [CrossRef]
- Raffa, R.B.; Pergolizzi, J.V.; Taylor, R.; Kitzen, J.M. Sunscreen Bans: Coral Reefs and Skin Cancer. J. Clin. Pharm. Ther. 2019, 44, 134–139. [Google Scholar] [CrossRef]
- IARC. Handbooks of Cancer Prevention Volume 5 Sunscreens; International Agency for Research on Cancer: Lyon, France, 2001; Volume 44, pp. 134–139.
- Krause, M.; Frederiksen, H.; Sundberg, K.; Jørgensen, F.S.; Jensen, L.N.; Nørgaard, P.; Jørgensen, C.; Ertberg, P.; Juul, A.; Drzewiecki, K.T.; et al. Presence of Benzophenones Commonly Used as UV Filters and Absorbers in Paired Maternal and Fetal Samples. Environ. Int. 2018, 110, 51–60. [Google Scholar] [CrossRef]
- Klotz, K.; Hof, K.; Hiller, J.; Göen, T.; Drexler, H. Quantification of Prominent Organic UV Filters and Their Metabolites in Human Urine and Plasma Samples. J. Chromatogr. B Anal. Technol. Biomed. Life Sci. 2019, 1125, 121706. [Google Scholar] [CrossRef]
- Huang, Y.; Law, J.C.F.; Lam, T.K.; Leung, K.S.Y. Risks of Organic UV Filters: A Review of Environmental and Human Health Concern Studies. Sci. Total Environ. 2021, 755, 142486. [Google Scholar] [CrossRef]
- Lorigo, M.; Mariana, M.; Cairrao, E. Photoprotection of Ultraviolet-B Filters: Updated Review of Endocrine Disrupting Properties. Steroids 2018, 131, 46–58. [Google Scholar] [CrossRef]
- Ekstein, S.F.; Hylwa, S. Sunscreens: A Review of UV Filters and Their Allergic Potential. Dermatitis 2023, 34, 176–190. [Google Scholar] [CrossRef]
- Vela-Soria, F.; Rodríguez, I.; Ballesteros, O.; Zafra-Gómez, A.; Ballesteros, L.; Cela, R.; Navalón, A. Simplified Matrix Solid Phase Dispersion Procedure for the Determination of Parabens and Benzophenone-Ultraviolet Filters in Human Placental Tissue Samples. J. Chromatogr. A 2014, 1371, 39–47. [Google Scholar] [CrossRef]
- Watanabe, Y.; Kojima, H.; Takeuchi, S.; Uramaru, N.; Sanoh, S.; Sugihara, K.; Kitamura, S.; Ohta, S. Metabolism of UV-Filter Benzophenone-3 by Rat and Human Liver Microsomes and Its Effect on Endocrine-Disrupting Activity. Toxicol. Appl. Pharmacol. 2015, 282, 119–128. [Google Scholar] [CrossRef]
- Zhang, H.; Li, J.; An, Y.; Wang, D.; Zhao, J.; Zhan, M.; Xu, W.; Lu, L.; Gao, Y. Concentrations of Bisphenols, Benzophenone-Type Ultraviolet Filters, Triclosan, and Triclocarban in the Paired Urine and Blood Samples from Young Adults: Partitioning between Urine and Blood. Chemosphere 2022, 288, 132563. [Google Scholar] [CrossRef]
- Wang, L.; Kannan, K. Characteristic Profiles of Benzonphenone-3 and Its Derivatives in Urine of Children and Adults from the United States and China. Environ. Sci. Technol. 2013, 47, 12532–12538. [Google Scholar] [CrossRef]
- Díaz-Cruz, M.S.; Molins-Delgado, D.; Serra-Roig, M.P.; Kalogianni, E.; Skoulikidis, N.T.; Barceló, D. Personal Care Products Reconnaissance in EVROTAS River (Greece): Water-Sediment Partition and Bioaccumulation in Fish. Sci. Total Environ. 2019, 651, 3079–3089. [Google Scholar] [CrossRef]
- Official Journal of the European Communities. European Community Directive 2000/60/EC of the European Parliament and of the Council of 23 October 2000 Establishing a Framework for Community Action in the Field of Water Policy. Off. J. Eur. Parliam. 2000, 4, 65–71. [Google Scholar] [CrossRef]
- Gago-Ferrero, P.; Mastroianni, N.; Díaz-Cruz, M.S.; Barceló, D. Fully Automated Determination of Nine Ultraviolet Filters and Transformation Products in Natural Waters and Wastewaters by On-Line Solid Phase Extraction-Liquid Chromatography-Tandem Mass Spectrometry. J. Chromatogr. A 2013, 1294, 106–116. [Google Scholar] [CrossRef]
- Gago-Ferrero, P.; Díaz-Cruz, M.S.; Barceló, D. Fast Pressurized Liquid Extraction with In-Cell Purification and Analysis by Liquid Chromatography Tandem Mass Spectrometry for the Determination of UV Filters and Their Degradation Products in Sediments. Anal. Bioanal. Chem. 2011, 400, 2195–2204. [Google Scholar] [CrossRef]
- Força-Lima, M.; Pacheco, W.F.; Cassella, R.J. Evaluation of a Semi-Permeable Membrane Device (SPMD) for Passive Sampling of Solar Filters from Swimming Pool Waters and Determination by HPLC-DAD. J. Chromatogr. A 2019, 1600, 23–32. [Google Scholar] [CrossRef]
- Horricks, R.A.; Tabin, S.K.; Edwards, J.J.; Lumsden, J.S.; Marancik, D.P. Organic Ultraviolet Filters in Nearshore Waters and in the Invasive Lionfish (Pterois volitans) in Grenada, West Indies. PLoS ONE 2019, 14, e0220280. [Google Scholar] [CrossRef]
- Kharbouche, L.; Gil García, M.D.; Lozano, A.; Hamaizi, H.; Martínez Galera, M. Determination of Personal Care Products in Water Using UHPLC–MS after Solid Phase Extraction with Mesoporous Silica-Based MCM-41 Functionalized with Cyanopropyl Groups. J. Sep. Sci. 2020, 43, 2142–2153. [Google Scholar] [CrossRef]
- Gopal, C.M.; Bhat, K.; Praveenkumarreddy, Y.; Shailesh; Kumar, V.; Basu, H.; Joshua, D.I.; Singhal, R.K.; Balakrishna, K. Evaluation of Selected Pharmaceuticals and Personal Care Products in Water Matrix Using Ion Trap Mass Spectrometry: A Simple Weighted Calibration Curve Approach. J. Pharm. Biomed. Anal. 2020, 185, 113214. [Google Scholar] [CrossRef]
- Feitosa-Felizzola, J.; Temime, B.; Chiron, S. Evaluating On-Line Solid-Phase Extraction Coupled to Liquid Chromatography-Ion Trap Mass Spectrometry for Reliable Quantification and Confirmation of Several Classes of Antibiotics in Urban Wastewaters. J. Chromatogr. A 2007, 1164, 95–104. [Google Scholar] [CrossRef] [PubMed]
- Batt, A.L.; Aga, D.S. Simultaneous Analysis of Multiple Classes of Antibiotics by Ion Trap LC/MS/MS for Assessing Surface Water and Groundwater Contamination. Anal. Chem. 2005, 77, 2940–2947. [Google Scholar] [CrossRef] [PubMed]
- Harron, D.W.G. ICH Harmonised Tripartite Guideline. In Validation of Analytical Procedures; Somatek Inc.: San Diego, CA, USA, 2013. [Google Scholar]
- Cadena-Aizaga, M.I.; Montesdeoca-Esponda, S.; Sosa-Ferrera, Z.; Santana-Rodríguez, J.J. Occurrence and Environmental Hazard of Organic UV Filters in Seawater and Wastewater from Gran Canaria Island (Canary Islands, Spain). Environ. Pollut. 2022, 300, 118843. [Google Scholar] [CrossRef]
- Fisch, K.; Zhang, R.; Zhou, M.; Schulz-Bull, D.E.; Waniek, J.J. PPCPs-A Human and Veterinary Fingerprint in the Pearl River Delta and Northern South China Sea. Emerg. Contam. 2021, 7, 10–21. [Google Scholar] [CrossRef]
- Fenni, F.; Sunyer-Caldú, A.; Ben Mansour, H.; Diaz-Cruz, M.S. Contaminants of Emerging Concern in Marine Areas: First Evidence of UV Filters and Paraben Preservatives in Seawater and Sediment on the Eastern Coast of Tunisia. Environ. Pollut. 2022, 309, 119749. [Google Scholar] [CrossRef]
- Rodil, R.; Quintana, J.B.; López-Manía, P.; Muniategui-Lorenzo, S.; Prada-Rodríguez, D. Multiclass Determination of Sunscreen Chemicals in Water Samples by Liquid Chromatography-Tandem Mass Spectrometry. Anal. Chem. 2008, 80, 1307–1315. [Google Scholar] [CrossRef]
- Mokh, S.; Nassar, R.; Berry, A.; Khatib, M.E.; Doumiati, S.; Taha, M.; Ezzeddine, R.; Al Iskandarani, M. Chromatographic Methods for the Determination of a Broad Spectrum of UV Filters in Swimming Pool Water. Environ. Sci. Pollut. Res. 2022, 29, 18605–18616. [Google Scholar] [CrossRef]
- Brown, A.K.; Farenhorst, A. Quantitation of Canadian Organic Ultraviolet Filters Using Polarity Switching and Ultra-High Performance Liquid Chromatography-Tandem Mass Spectrometry. J. Chromatogr. A 2023, 1704, 464132. [Google Scholar] [CrossRef]
- Votani, A.; Chisvert, A.; Giokas, D.L. On-Line Extraction Coupled to Liquid Chromatographic Analysis of Hydrophobic Organic Compounds from Complex Solid Samples—Application to the Analysis of UV Filters in Soils and Sediments. J. Chromatogr. A 2020, 1610, 460561. [Google Scholar] [CrossRef]
- Ferreira, V.G.; Leme, G.M.; Cavalheiro, A.J.; Funari, C.S. Online Extraction Coupled to Liquid Chromatography Analysis (OLE-LC): Eliminating Traditional Sample Preparation Steps in the Investigation of Solid Complex Matrices. Anal. Chem. 2016, 88, 8421–8427. [Google Scholar] [CrossRef]
- Cadena-Aizaga, M.I.; Montesdeoca-Esponda, S.; Pino, Á.S.D.; Sosa-Ferrera, Z.; Santana-Rodríguez, J.J. Assessment of Anthropogenic Pollution by UV Filters Using Macrophytes as Bioindicators. Sci. Total Environ. 2022, 832, 155012. [Google Scholar] [CrossRef]
- Sánchez Rodríguez, A.; Rodrigo Sanz, M.; Betancort Rodríguez, J.R. Occurrence of Eight UV Filters in Beaches of Gran Canaria (Canary Islands). An Approach to Environmental Risk Assessment. Chemosphere 2015, 131, 85–90. [Google Scholar] [CrossRef]
- Lebedev, A.T.; Bavcon Kralj, M.; Polyakova, O.V.; Detenchuk, E.A.; Pokryshkin, S.A.; Trebše, P. Identification of Avobenzone By-Products Formed by Various Disinfectants in Different Types of Swimming Pool Waters. Environ. Int. 2020, 137, 105495. [Google Scholar] [CrossRef]
- Seyer, A.; Mlynek, F.; Himmelsbach, M.; Buchberger, W.; Klampfl, C.W. Investigations on the Uptake and Transformation of Sunscreen Ingredients in Duckweed (Lemna gibba) and Cyperus Alternifolius Using High-Performance Liquid Chromatography Drift-Tube Ion-Mobility Quadrupole Time-of-Flight Mass Spectrometry. J. Chromatogr. A 2020, 1613, 460673. [Google Scholar] [CrossRef]
- Parks, N. UV-Stabilizing Chemicals Contaminating Japan’s Marine Environment. Environ. Sci. Technol. 2009, 2009, 6896–6897. [Google Scholar] [CrossRef]
- Wang, X.; Wang, J.; Du, T.; Kou, H.; Du, X.; Lu, X. Determination of Six Benzotriazole Ultraviolet Filters in Water and Cosmetic Samples by Graphene Sponge-Based Solid-Phase Extraction Followed by High-Performance Liquid Chromatography. Anal. Bioanal. Chem. 2018, 410, 6955–6962. [Google Scholar] [CrossRef]
- Yu, H.; Di, S.; Su, X.; Wang, J.; Ning, T.; Yang, H.; Zhu, S. Preparation of Beta-Cyclodextrin Based Nanocomposite for Magnetic Solid-Phase Extraction of Organic Ultraviolet Filters. J. Chromatogr. A 2022, 1663, 462765. [Google Scholar] [CrossRef]
- Mulliken, J.S.; Russak, J.E.; Rigel, D.S. The Effect of Sunscreen on Melanoma Risk. Dermatol. Clin. 2012, 30, 369–376. [Google Scholar] [CrossRef]
- Morohoshi, K.; Yamamoto, H.; Kamata, R.; Shiraishi, F.; Koda, T.; Morita, M. Estrogenic Activity of 37 Components of Commercial Sunscreen Lotions Evaluated by In Vitro Assays. Toxicol. Vitr. 2005, 19, 457–469. [Google Scholar] [CrossRef] [PubMed]
- Kunz, P.Y.; Fent, K. Multiple Hormonal Activities of UV Filters and Comparison of In Vivo and In Vitro Estrogenic Activity of Ethyl-4-Aminobenzoate in Fish. Aquat. Toxicol. 2006, 79, 305–324. [Google Scholar] [CrossRef] [PubMed]
- Molins-Delgado, D.; Mánez, M.; Andreu, A.; Hiraldo, F.; Eljarrat, E.; Barceló, D.; Díaz-Cruz, M.S. A Potential New Threat to Wild Life: Presence of UV Filters in Bird Eggs from a Preserved Area. Environ. Sci. Technol. 2017, 51, 10983–10990. [Google Scholar] [CrossRef] [PubMed]
- Moualek, F.; Babin, M.; Parent, G.J.; Ponton, D.E.; Senay, C.; Amyot, M.; Robert, D.; Lu, Z. Organic UV Absorbents in the Deepwater Redfish (Sebastes mentella) from the St. Lawrence Estuary and Gulf: Distribution and Human Health Risk Assessment. Sci. Total Environ. 2024, 906, 167515. [Google Scholar] [CrossRef]
- Núñez, O.; Gallart-Ayala, H.; Martins, C.P.B.; Lucci, P. New Trends in Fast Liquid Chromatography for Food and Environmental Analysis. J. Chromatogr. A 2012, 1228, 298–323. [Google Scholar] [CrossRef]
Disclaimer/Publisher’s Note: The statements, opinions and data contained in all publications are solely those of the individual author(s) and contributor(s) and not of MDPI and/or the editor(s). MDPI and/or the editor(s) disclaim responsibility for any injury to people or property resulting from any ideas, methods, instructions or products referred to in the content. |
© 2024 by the authors. Licensee MDPI, Basel, Switzerland. This article is an open access article distributed under the terms and conditions of the Creative Commons Attribution (CC BY) license (https://creativecommons.org/licenses/by/4.0/).


