Article

A Robust and Reliable UPLC Method for the Simultaneous Quantification of Rosuvastatin Calcium, Glibenclamide, and Candesartan Cilexetil

Department of Pharmaceutics, College of Pharmacy, King Saud University, Riyadh 11451, Saudi Arabia
*
Author to whom correspondence should be addressed.
Separations 2024, 11(4), 113; https://doi.org/10.3390/separations11040113
Submission received: 8 March 2024 / Revised: 30 March 2024 / Accepted: 5 April 2024 / Published: 7 April 2024
(This article belongs to the Section Analysis of Natural Products and Pharmaceuticals)

Abstract

:
Metabolic syndrome is an associated condition that occurs together and increases the risk of heart disease and diabetes. These conditions include high blood pressure, high blood sugar, and high body mass index (BMI) in terms of cholesterol and triglyceride levels. Most of the elderly population may administer three drugs to control the above conditions. Therefore, this study aims to develop an analytical assay for the precise analysis of three components and to formulate a Self-Nanoemulsifying Drug-Delivery System (SNEDDS) loaded with three drugs: Rosuvastatin Calcium (RC; antilipidemic), Glibenclamide (GB; antidiabetic), and Candesartan Cilexetil (CC; antihypertensive). A design of the experiment was developed at a level of 32, and the influence of column temperature and flow rate was studied in terms of retention time, peak area, peak asymmetry, and resolution. The assay was subjected to several studies to ensure its validation. Under the optimized conditions—column temperature at 50 °C and flow rate at 0.25 mL/min—the three drugs, RC, GB, and CC, are separated. Their retention times are 0.840, 1.800, and 5.803 min, respectively. The assay was valid in terms of linearity, accuracy, and precision. Moreover, the developed assay shows a good tolerance against any change in the condition. The assay was tested also to separate the drugs in a pharmaceutical formulation as SNEDDs. The assay successfully separates the drug with a good resolution.

1. Introduction

Metabolic syndrome is a group of abnormal metabolic disorders that promote the potential of developing cardiovascular disease, type-II diabetes mellitus, and other chronic health issues [1]. It is identified by high blood pressure, insulin resistance, abdominal obesity, and abnormal lipid levels [2]. The prevalence of metabolic syndrome has significantly risen in recent years, remarkably in modern citizens, owing to the widespread consumption of food with high-calorie contents and a reduction in physical activity [3,4]. Therefore, it is crucial to adopt lifestyle changes that involve consuming a diet rich in fiber relative to total calorie intake and increasing physical activity [1,5].
In most patients diagnosed with metabolic syndrome, treatment requires the administration of multiple medications to restore normal metabolic processes [6]. This is achieved through the simultaneous administration of angiotensin receptor blockers, sulfonylurea, and statins [7,8]. Candesartan cilexetil (CC) is an angiotensin II receptor antagonist that blocks its binding to the AT1 receptor. This resulted in vasodilation of blood vessels and a reduction in blood pressure [9]. In addition, Glibenclamide (GB), which belongs to the sulfonylurea agents, exerts antihyperglycemic activity by increasing insulin secretion from the pancreas [10]. Rosuvastatin (RS) inhibits the HMG-CoA reductase enzyme, which promotes the production of cholesterol in the liver [11]. The positive impact of these three drugs on the metabolic effect was inspired by previously published studies in the literature [12,13,14].
One of the major challenges to administering three tablets is the patients’ compliance, which could result in therapeutic failure [15]. To address this issue, combining the aforementioned drugs into a single pharmaceutical dosage form can overcome the limitations of administering multiple pills [16]. Furthermore, this approach simplifies the medication-management process for patients, minimizes the risk of errors, and enhances overall treatment satisfaction [17].
To guarantee the effectiveness and safety of the proposed triple therapy, a validated and efficient analytical method is required for their quantitative analysis [18]. Herein, a validated method was developed using design of experiments (DOE) software, version 11, to select the optimum conditions for drug separations. This design is a statistical design called a factorial experiment, which allows the researcher to study the impact of each factor and the interaction between them on the selected responses [19]. In addition, DOE aligns with the principles of green analytical chemistry by decreasing the solvent consumption, costs, and number of experiments required for optimum drug separation [20]. In addition, the development of environmentally friendly analytical methods using green solvents is required to dismiss potential harmful influences on the environment [21]. This was achieved through avoiding the usage of conventional organic solvents like acetonitrile, which can have a hazardous impact on the environment. Therefore, methanol was used as an organic solvent to optimize UPLC, owing to the reported safety in the environment [22,23].
The novelty of this study is the focus on two purposes. First, it is to develop a simple, sensitive, and valid UPLC analytical method that analyzes Rosuvastatin Calcium (RC; antilipidemic), Glibenclamide (GB; antidiabetic), and Candesartan Cilexetil (CC; antihypertensive) simultaneously in bulk and in the pharmaceutical-dosage form. These APIs are routinely utilized for the same patient separately for the management of metabolic syndrome symptoms (diabetes, hypertension, and hyperlipidemia). Therefore, there is a need to formulate them in one dosage form. So, the simultaneous analysis of these three APIs comes as a prior step.
The second purpose of this study is to determine the applicability of this method. Therefore, a Self-Nanoemulsifying Drug-Delivery System (SNEDDs) dosage form loaded with the three mentioned drugs has been formulated. Therefore, the availability of this dosage form could be beneficial for elderly people and for those patients who administer these drugs concurrently [24].

2. Materials and Methods

2.1. Materials

Glibenclamide (GB) was obtained from SPIMACO (Qassim, KSA) Rosuvastatin calcium (RC) was purchased from Beijing Mesochem Technology Co., Ltd. (Beijing, China). Candesartan cilexetil (CC) was kindly supplied by Riyadh Pharma (Riyadh, Saudi Arabia). HPLC-grade methanol (Riedelde Haën Laboratory Chemicals, Selzer, Germany). Ammonium formate was acquired from Sigma-Aldrich (St. Louis, MO, USA). Surfactant (Kolliphor-EL) and co-surfactant (Kollisolv PEG 400) were acquired from BASF (Ludwigshafen, Germany). Oil (Capmual MCM) was obtained from Abitec Corporation (Janesville, WI, USA).

2.2. Experimental

2.2.1. Design of Experiment (DoE)

A 32 full factorial design was employed, a statistical method that analyzes and optimizes the effects of two independent analytical parameters by evaluating all possible combinations on the concurrent determination of RC, GB, and CC’s analytical characteristics. A 32 means that there are two independent factors involved in this study, each with 3 levels. In this experiment, the impact of two independent factors including column temperature (A) and mobile phase flow rate (B), each available at 3 level, were evaluated on the analytical attributes (responses), which were retention time, peak area, and peak asymmetry for the three APIs, in addition to the resolution between RC-GB and CC-GB peaks, as shown in Table 1. Data analysis was proceeded by using Stat-Ease®360 software, version11. Nine analytical runs were created according to the statistical design, based on varying column temperature and flow rate.

2.2.2. Analytical Procedures and Conditions

The experimental procedures for the concurrent analysis of RC, GB, and CC were used with a very sensitive UPLC system (Ultimate 3000® binary solvent manager), using an Acquity® UHPLC HSS T3 1.8 µm (2.1 × 50 mm) column, which was connected with an automated sampler and a Photodiode Array (PDA) detector. A working solution containing 50 ppm in methanol was prepared. The simultaneous separation procedure of the three APIs was achieved by reverse-phase isocratic elution by using a mobile phase composition as follows: At the first 2 min, for the separation of both RC and GB, a mobile phase (65% methanol:35% aqueous solution containing 10 mM ammonium formate buffer) was run at different column temperatures and different flow rates, as described in the design; Table 1. After that, the mobile-phase composition was changed to 90% methanol–10% aqueous solution containing 10 mM ammonium formate buffer to allow for the separation of CC. The analytical separation of RC, GB, and CC was carried out at wavelengths of 244 nm, 225 nm, and 258 nm, respectively, and the total run time was 10.0 min.

2.2.3. Method Validation

The validation and eligibility of the developed analytical assay for the three components has been examined according to linearity accuracy, precision, limit of detection (LOD), limit of quantification (LOQ), and robustness. All the tests and specifications were conducted based on the international conference of Harmonization guidelines (ICH Q2 R1) [25].

Linearity

A calibration curve was constructed for GB, RC, and CC. The linearity was determined for each API in a range of 0.5 to 50 ppm. The average response of a triple run was carried out and the peak area was plotted against the change in the drug concentration to estimate the line equation using a linear regression analysis [25,26,27].

Accuracy and Precision

The closeness between the measurement values and the standard value is called accuracy. The accuracy was detected by calculating the % recovery. Two levels of precision assay were determined. For intraday precision, 3 levels of concentrations for GB, RC, and CC (low (2), medium (20 ppm), and high levels of 50 ppm) were injected in triplicate at 3 different times on the same day. For inter-day precision determination, the samples were injected on 3 different days. The suitability of the results was determined by calculating the RSD. The RSD should be not more than 2% [27].

Limit of Detection (LOD) and Limit of Quantification (LOQ)

LOD and LOQ were specified using the standard deviation and slope method as per the following equation [28].
L O D = 3.3 × S D s l o p e
L O Q = 10 × S D s l o p e

Robustness

The reliability of the developed analytical assay was demonstrated by studying the impact of some critical and tiny changes in the analytical condition. These changes include changes in column temperature (50 ± 2 °C) and the absorbance wavelength 258 ± 2 °C for CC, 225 ± 2 °C for GB and 244 ± 2 °C for RC. The instrument response was detected in terms of peak area and retention time.

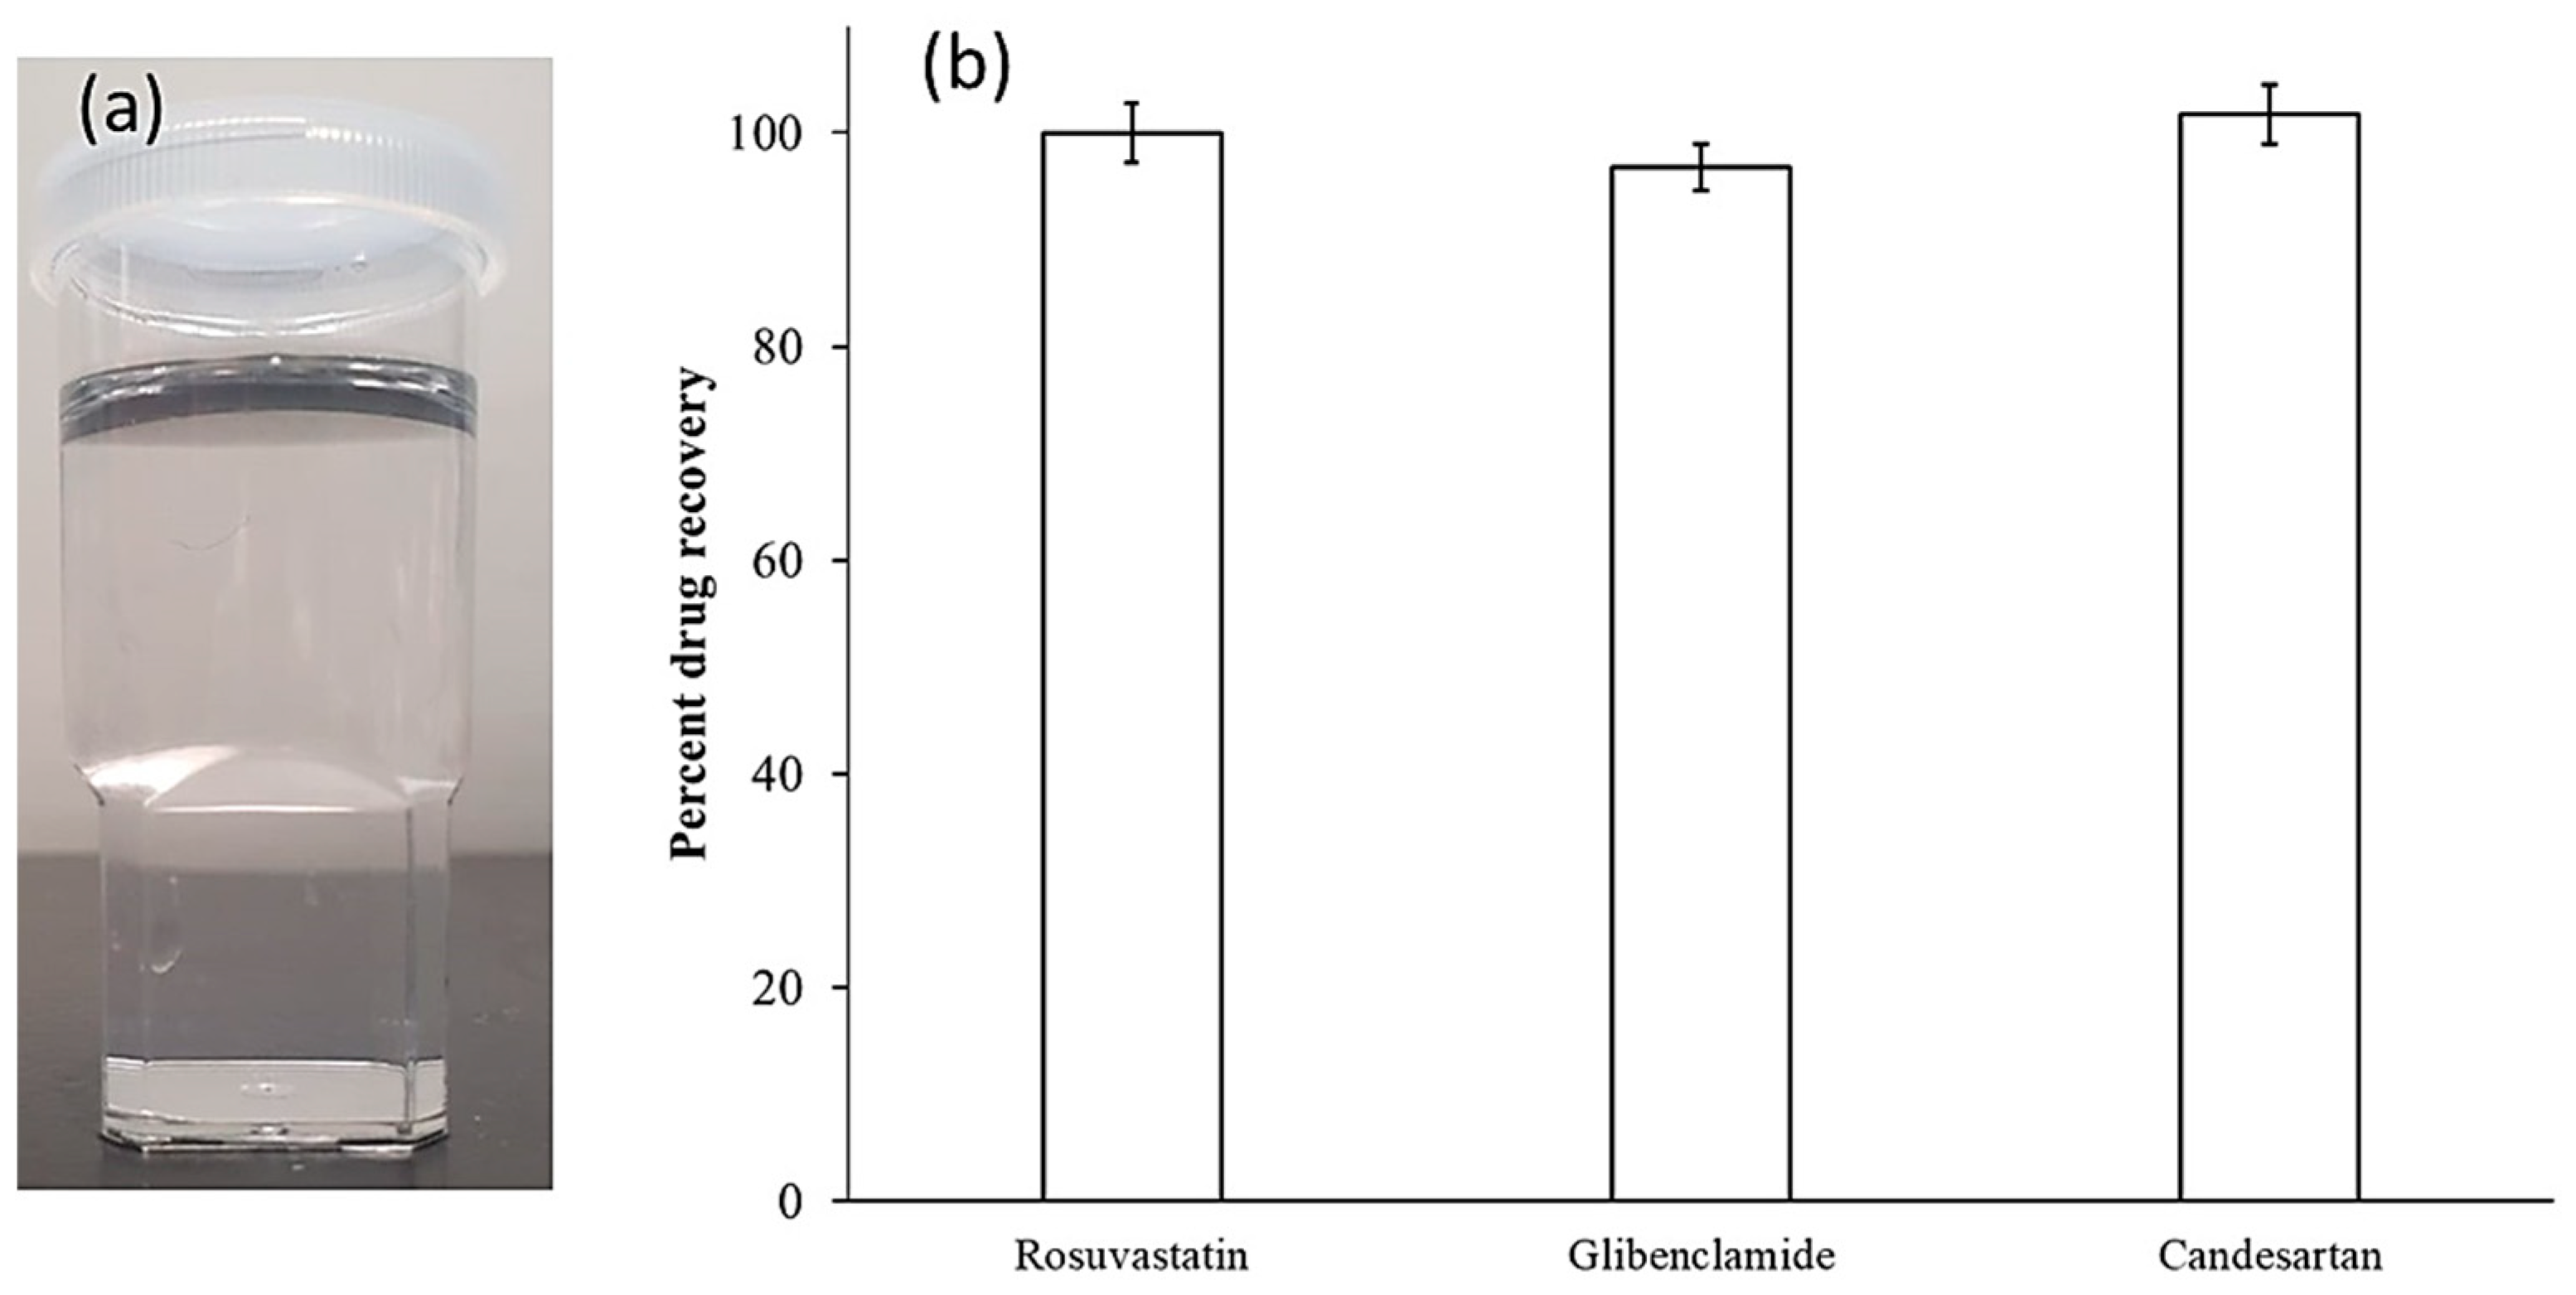
2.2.4. Preparation and Characterization of SNEDDS Formulation

Kolliphor EL, Kollisolv PEG 400, and Capmul MCM were accurately weighed in a ratio of 4:3:3 to prepare the SNEDDS formulation. To ensure uniformity, the formulation was subjected to vortex mixing. To prepare the drug-loaded SNEDDS formulation, candesartan, glibenclamide, and rosuvastatin were loaded based on their therapeutic doses (8 mg, 2.5 mg, and 5 mg, respectively), and mixed using a magnetic stirrer. The prepared formulation was subjected to dilution using distilled water in a ratio of 1:1000 [29].

Application of the Developed UPLC Method

To ensure the accuracy of the developed UPLC method, the drugs content within the prepared formulation was calculated. An accurately weighted amount of drugs-loaded SNEDDS was placed in an epindorph tube, then diluted with acetonitrile and subjected to sonication to ensure complete drug extraction. Following appropriate dilution, drug concentrations were estimated using the developed UPLC method [30]. The accuracy of the method was achieved through the calculation of the percent drug recovery using the following equation:
P e r e n t   d r u g   r e c o v e r y = A c u a l   d r u g   c o n t e n t T h e o r e t i c a l   d r u g   c o n t e n t 100

3. Results

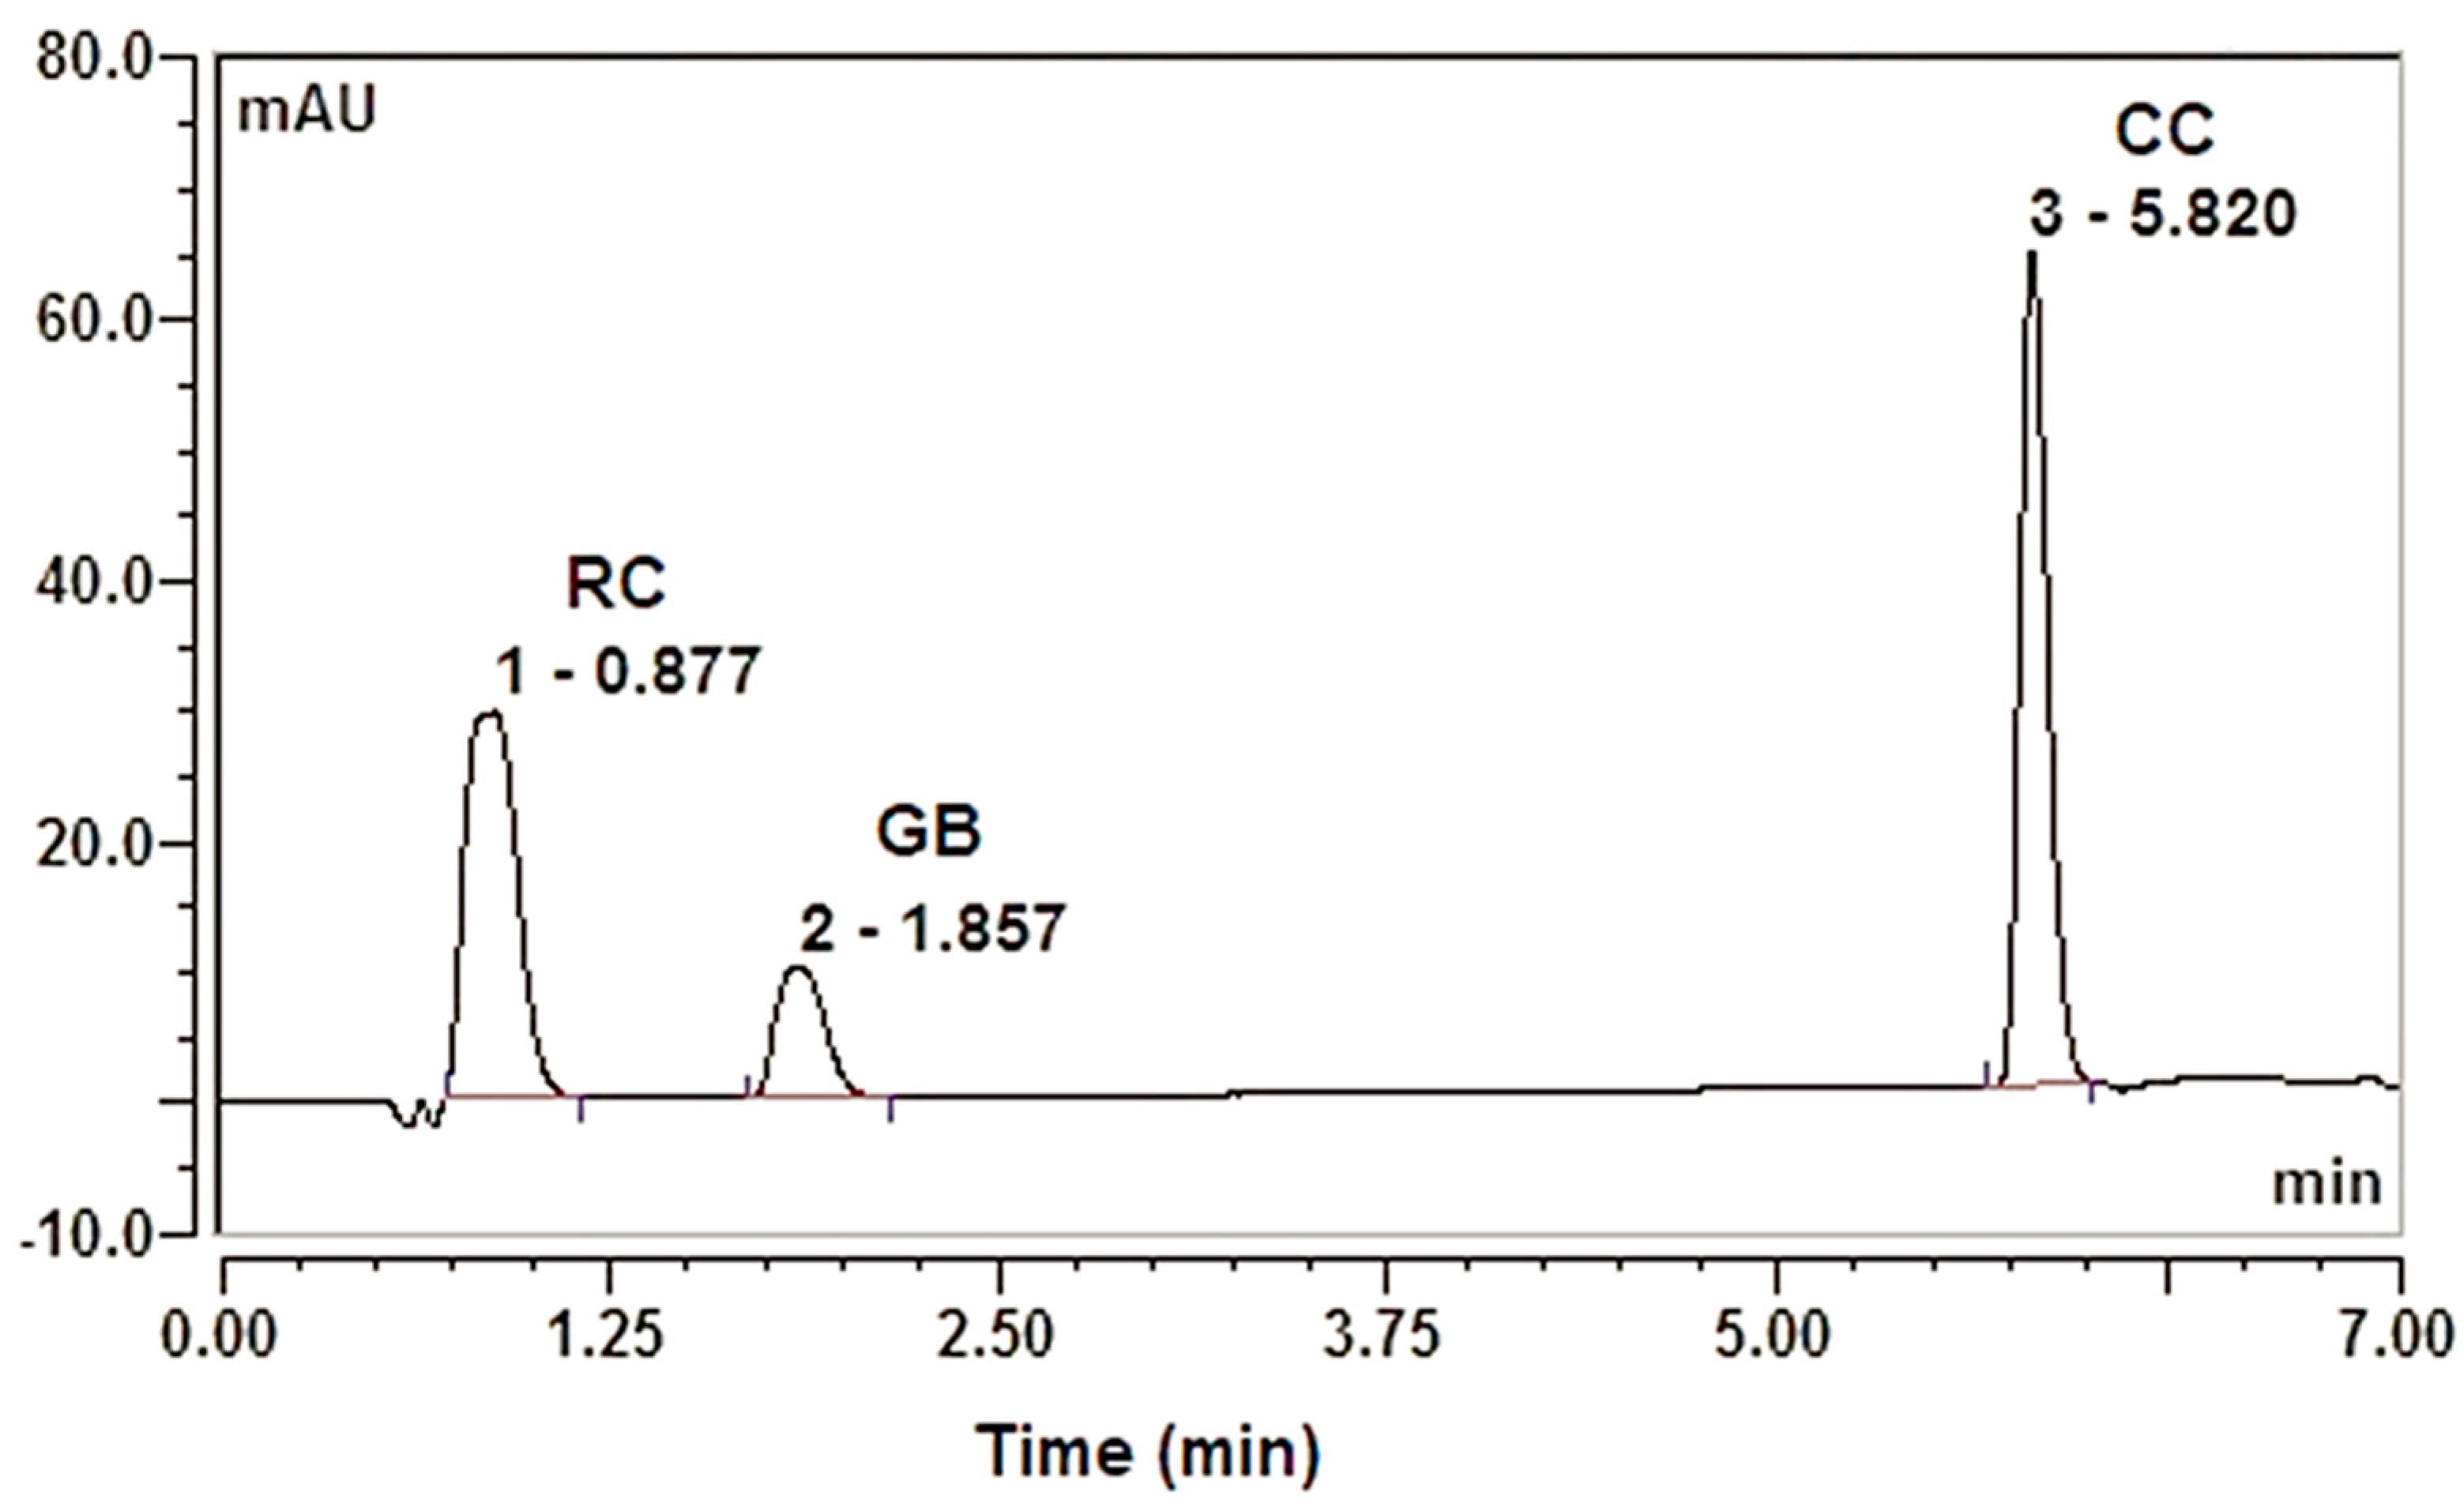
3.1. Effect of Analytical Conditions on the Simultaneous Separation of the Three APIs

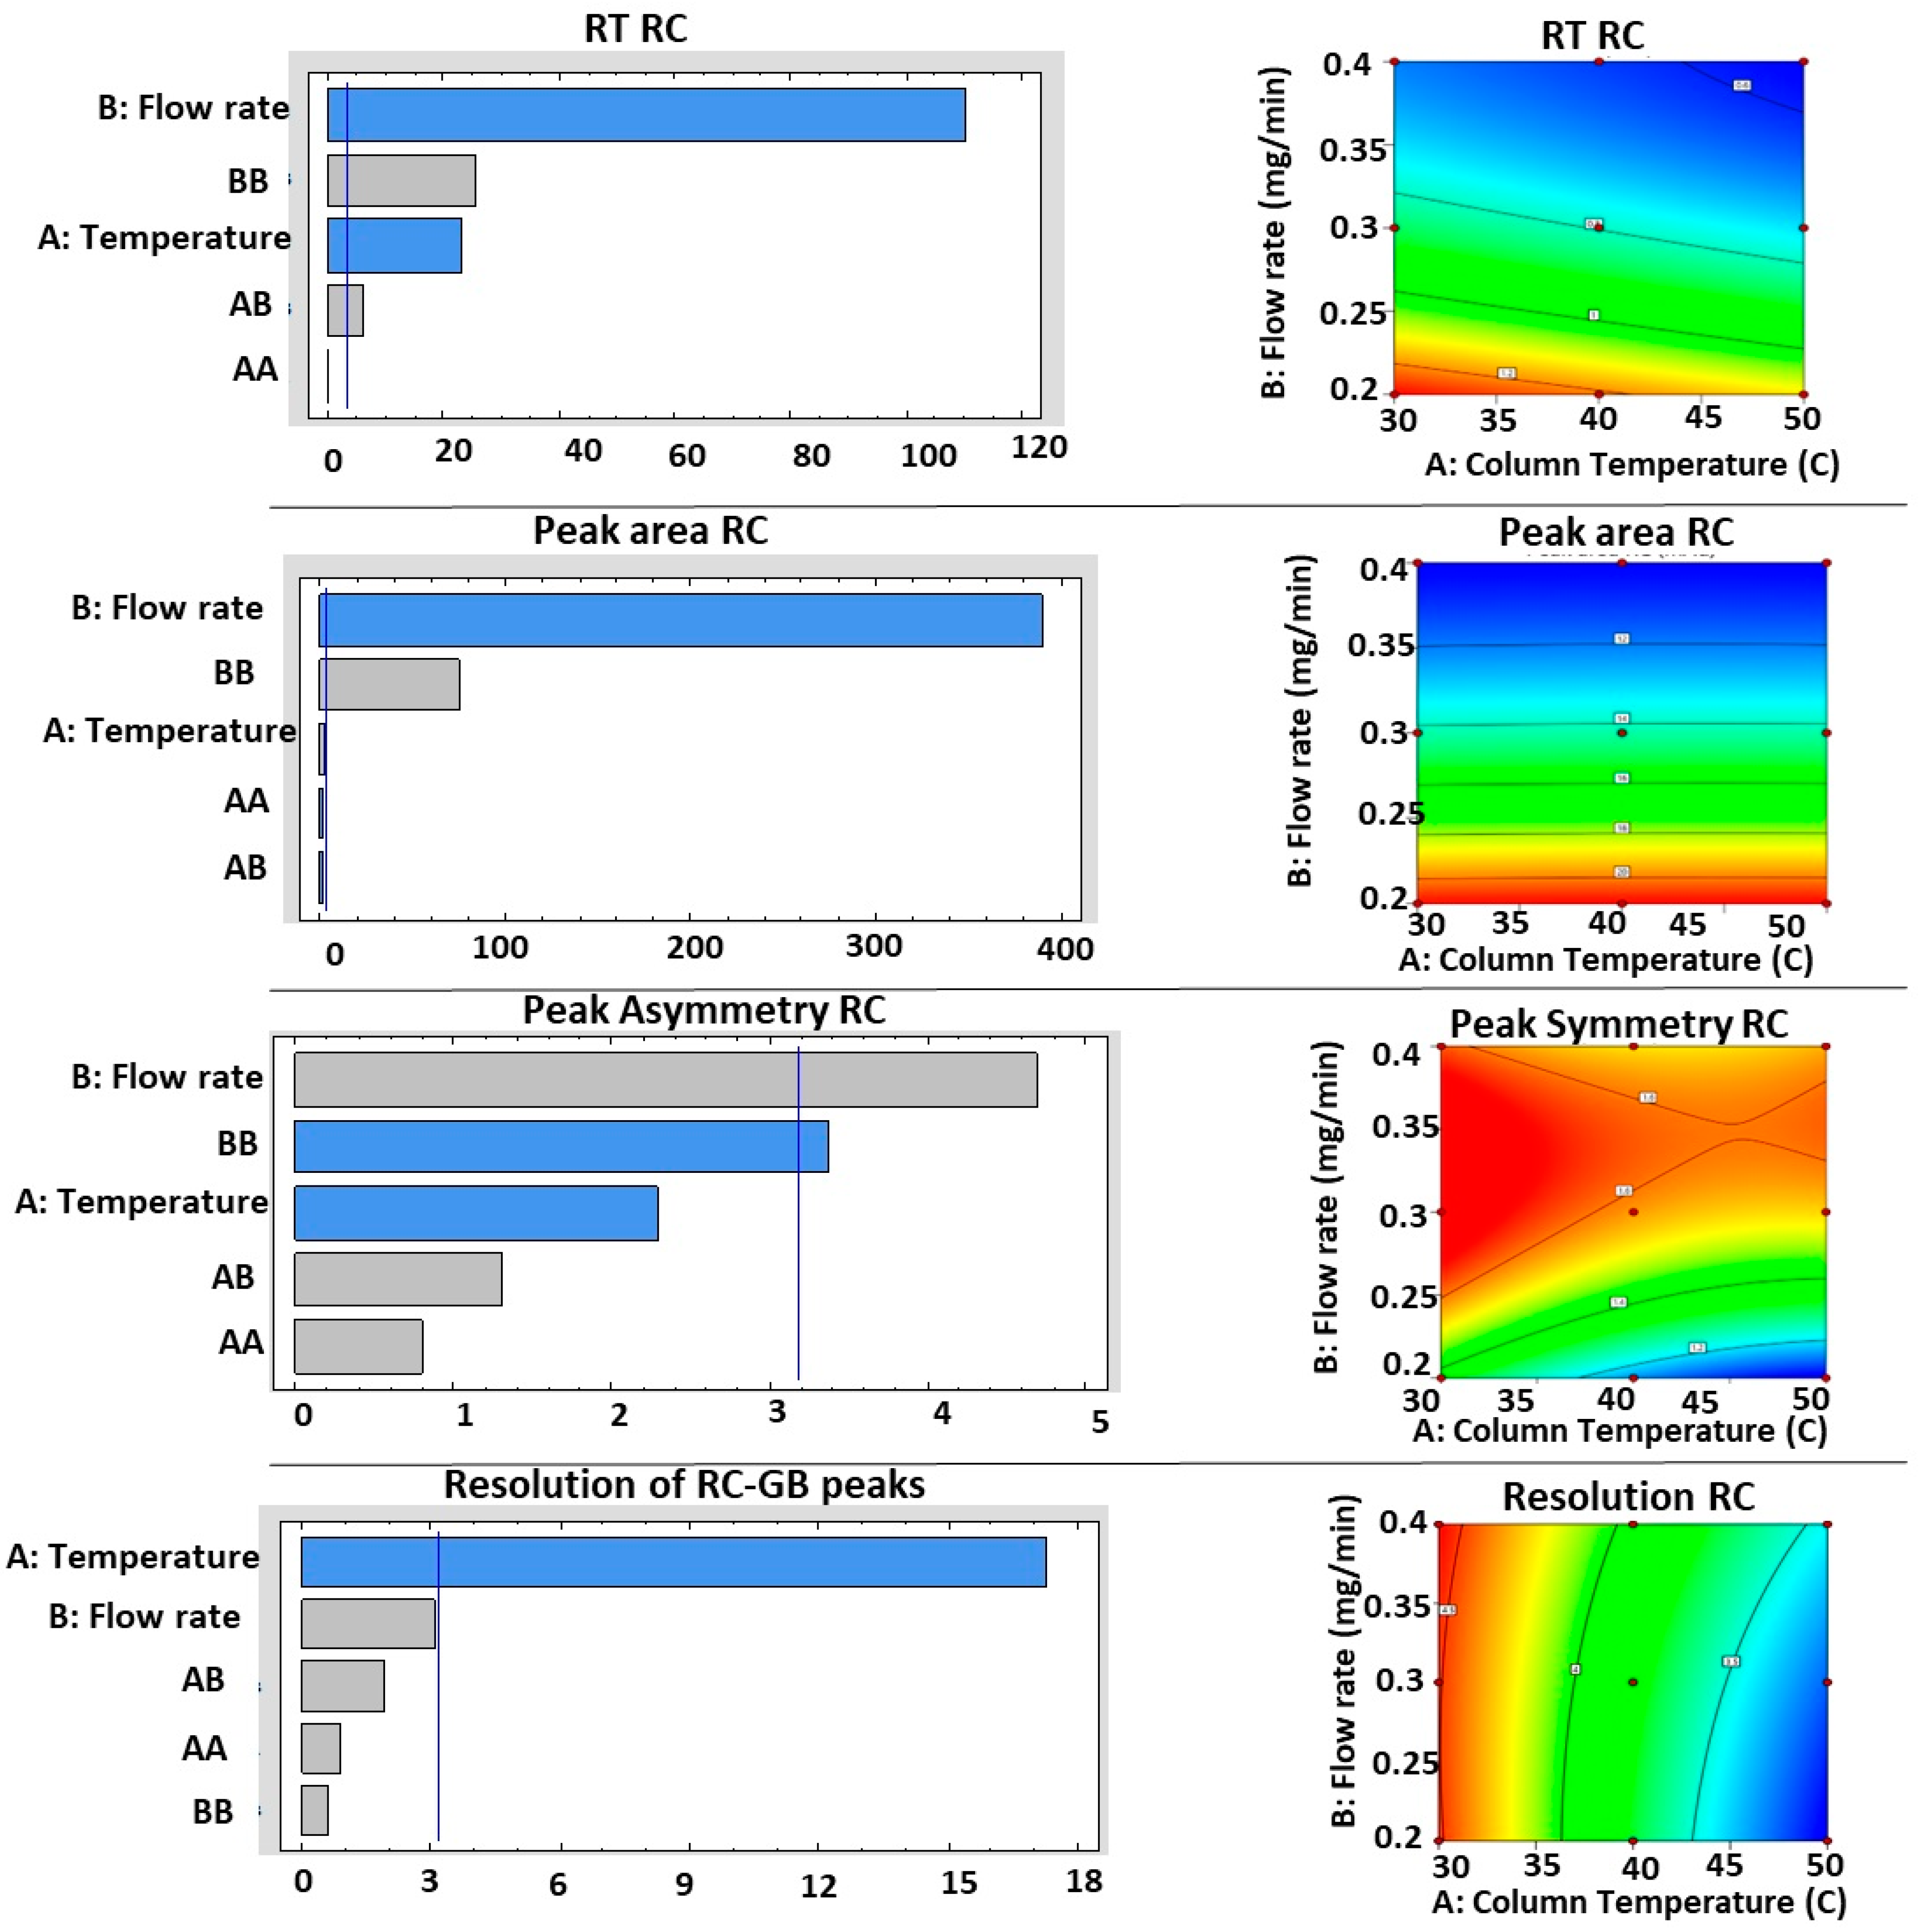
3.1.1. Rosuvastatin Calcium (RC)

Table 2 shows the ANOVA results for the effect of individual parameters (column temperature: A, and mobile phase flow rate: B) and their quadratic effects as well as interactive effect (AB) on the analytical attributes of RC.
Regarding RC-peak retention time, the results revealed that all tested independent parameters showed significant effects (p values were less than 0.001) of RC-peak retention time, except the quadratic effect of column temperature (p = 0.6568). In addition, the standardized Pareto chart presented on the left side of Figure 1 showed that column temperature and flow rate exhibited significant antagonistic effects on the drug peak-retention time, while their quadratic effects exerted agonistic effects on the response. Moreover, the contour plot (Figure 1, right side) and Table 3 indicate that the shortest retention time (0.573 min) was observed upon using the highest column temperature (50 °C) along with the fastest flow rate (0.4 mL/min), while the use of the lowest column temperature (30 °C) with the slowest flow rate (0.2 mL/min) resulted in the prolongation of the drug peak-retention time (1.299 min).
For the RC peak area, as seen from ANOVA Table 2 and the standardized Pareto chart in Figure 1, the individual effect of flow rate showed a significant antagonistic effect (p < 0.0001), while the quadratic flow rate effect showed significant agonistic effect on the response (p < 0.0001). In addition, the contour diagram and Table 3 indicate that the highest values of peak area (21.22, 21.32, and 21.30 mAu) were recorded in case of using the slowest flow rate (0.2 mL/min) along with all tested temperatures, but in case of using the fastest flow rate (0.4 mL/min), a pronounced reduction in RC peak area was exhibited.
Concerning RC peak symmetry, the individual effects (column temperature and mobile phase flow rate) are the only significantly affecting factors on the response by an antagonizing manner (p values were 0.0396 and 0.0017, respectively). From Table 3 and the contour plot (Figure 1 right side), the peak asymmetry factors were in the range of 1.24–1.45. The results showed that the narrow peak asymmetry values were found in the case of applying higher column temperatures with slow flow rates.
The effects of independent factors on the resolution of the RC peak and the adjacent GB peak are displayed in the ANOVA in Table 2 and the standardized Pareto chart in Figure 1. It is evident that the flow rate exhibited a highly significant agonistic effect (p = 0.0004), while the quadratic effect of column temperature (AA) showed a significant antagonistic impact on the response (p = 0.0249). Table 3 and the contour plot (Figure 1 right side) show that the range of resolutions between RC and GB peaks is 3.06–4.5, which could be considered a reasonable value to prevent peak overlap [31].

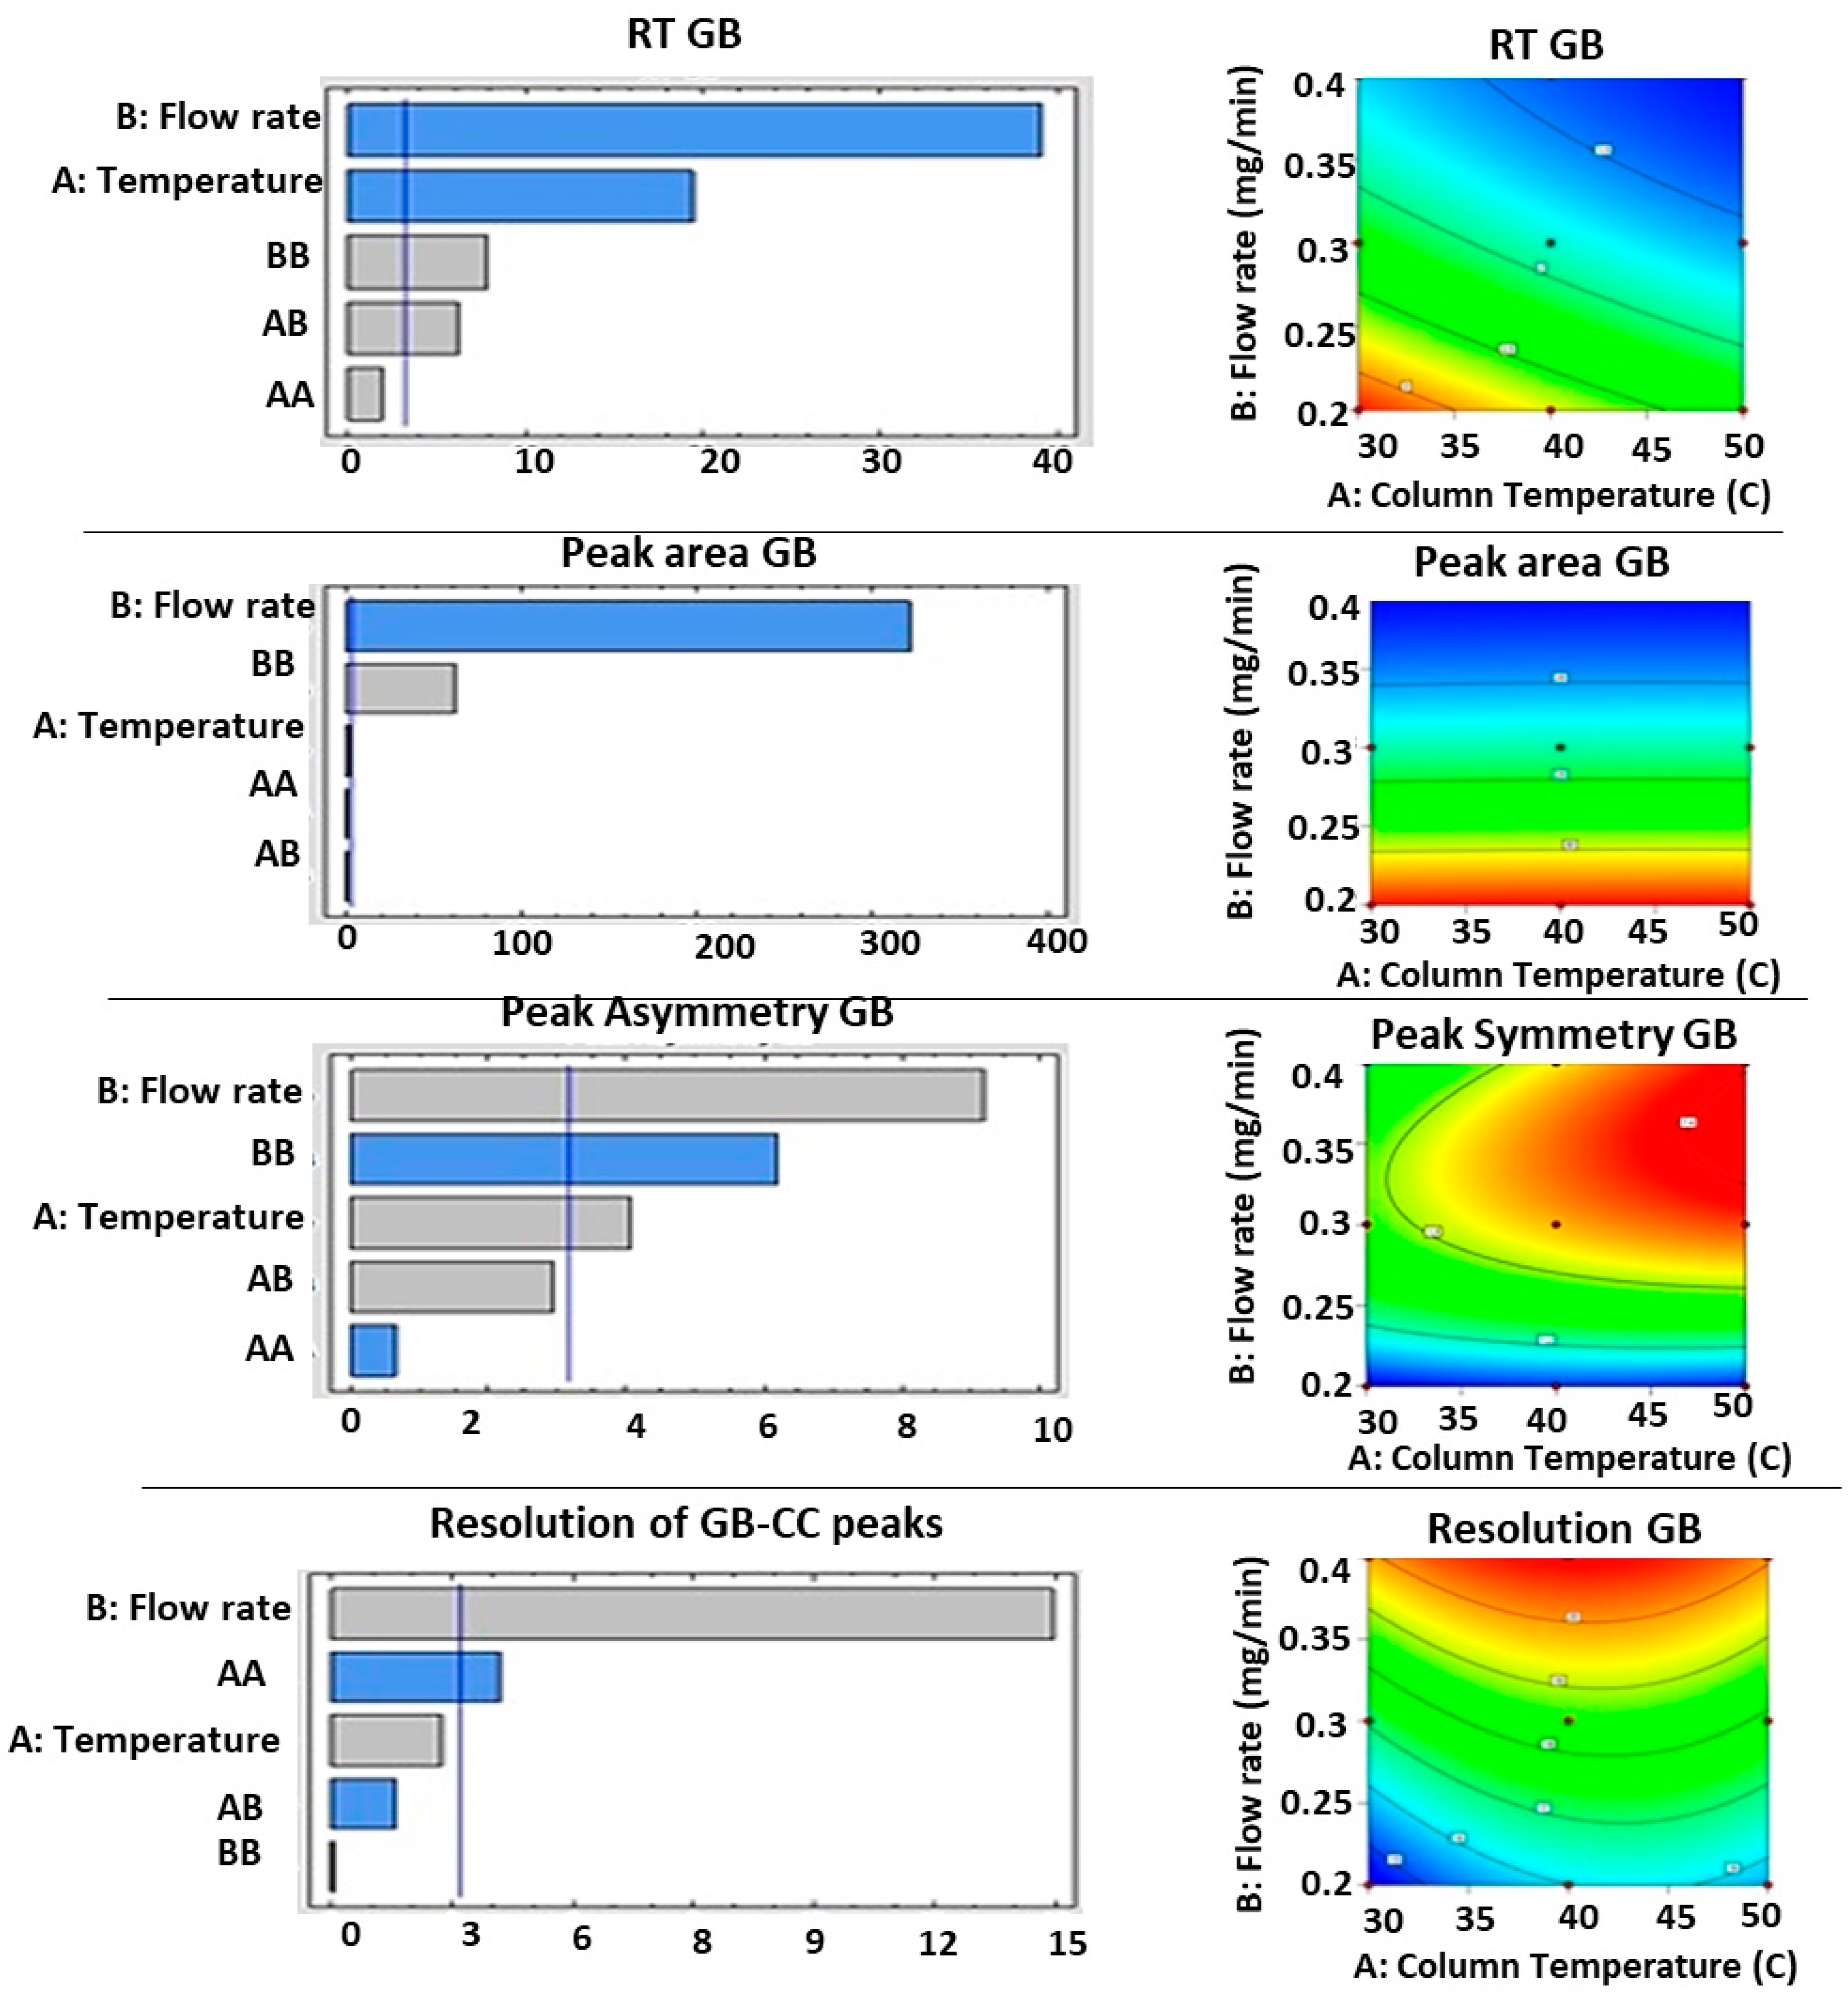
3.1.2. GB Separation

The individual factors (temperature: A and flow rate: B) showed a highly significant antagonistic effect on GB peal retention time (p values were 0.0003 and <0.0001, respectively), as indicated from the ANOVA in Table 2 and the Pareto chart, Figure 2 on the left side. In addition, the quadratic effects of flow rate (BB) and the interactive effect (AB) showed agonistic effects on the response (p values were 0.0043 and 0.0085, respectively). The recorded shortest retention time (1.24 min) was exhibited in the analytical condition based on applying the highest column temperature along with the fastest flow rate, while a long retention time (3.3 min) was observed in the case of the lowest column temperature with the slowest flow rate, as displayed in Table 3 and the contour plot (Figure 2, right side).
Concerning the GB peak area, the results from the ANOVA in Table 2 and the Pareto chart (Figure 2) indicated that the flow rate exerted a highly antagonistic effect, and its quadratic effect showed a highly agonistic effect on the drug peak area (p values in both cases were <0.0001). The highest areas of the GB peak (around 34.5 mAu) were observed in the case of using the slowest flow rate with all levels of column temperature: Table 3 and the contour diagram in Figure 2, right side.
The symmetry of the GB peak was influenced significantly by column temperature and flow rate, which exhibited agonistic effects on the response (p values were 0.027 and 0.003, respectively), while the quadratic effect of the mobile phase flow rate showed a highly significant antagonistic effect on GB peak symmetry (p = 0.0084). Moreover, the peak symmetry value around 1.1 was exhibited in the case of the slowest flow rate with all levels of column temperature: the contour diagram in Figure 2, right side, and Table 3.
The resolution between the GB peak and the next CC peak was found to be significantly agonisted by the mobile phase flow rate (p = 0.0004) and antagonized by the quadratic effect of column temperature (p = 0.0249), as seen from the Pareto chart (Figure 2 left) and the ANOVA in Table 2. In contrast, other parameters did exert significant effects on the response. In addition, from Table 3 and the contour plot (Figure 2 right), high resolution values were detected in the case of using the lowest column temperature (30 C) with all flow rates.

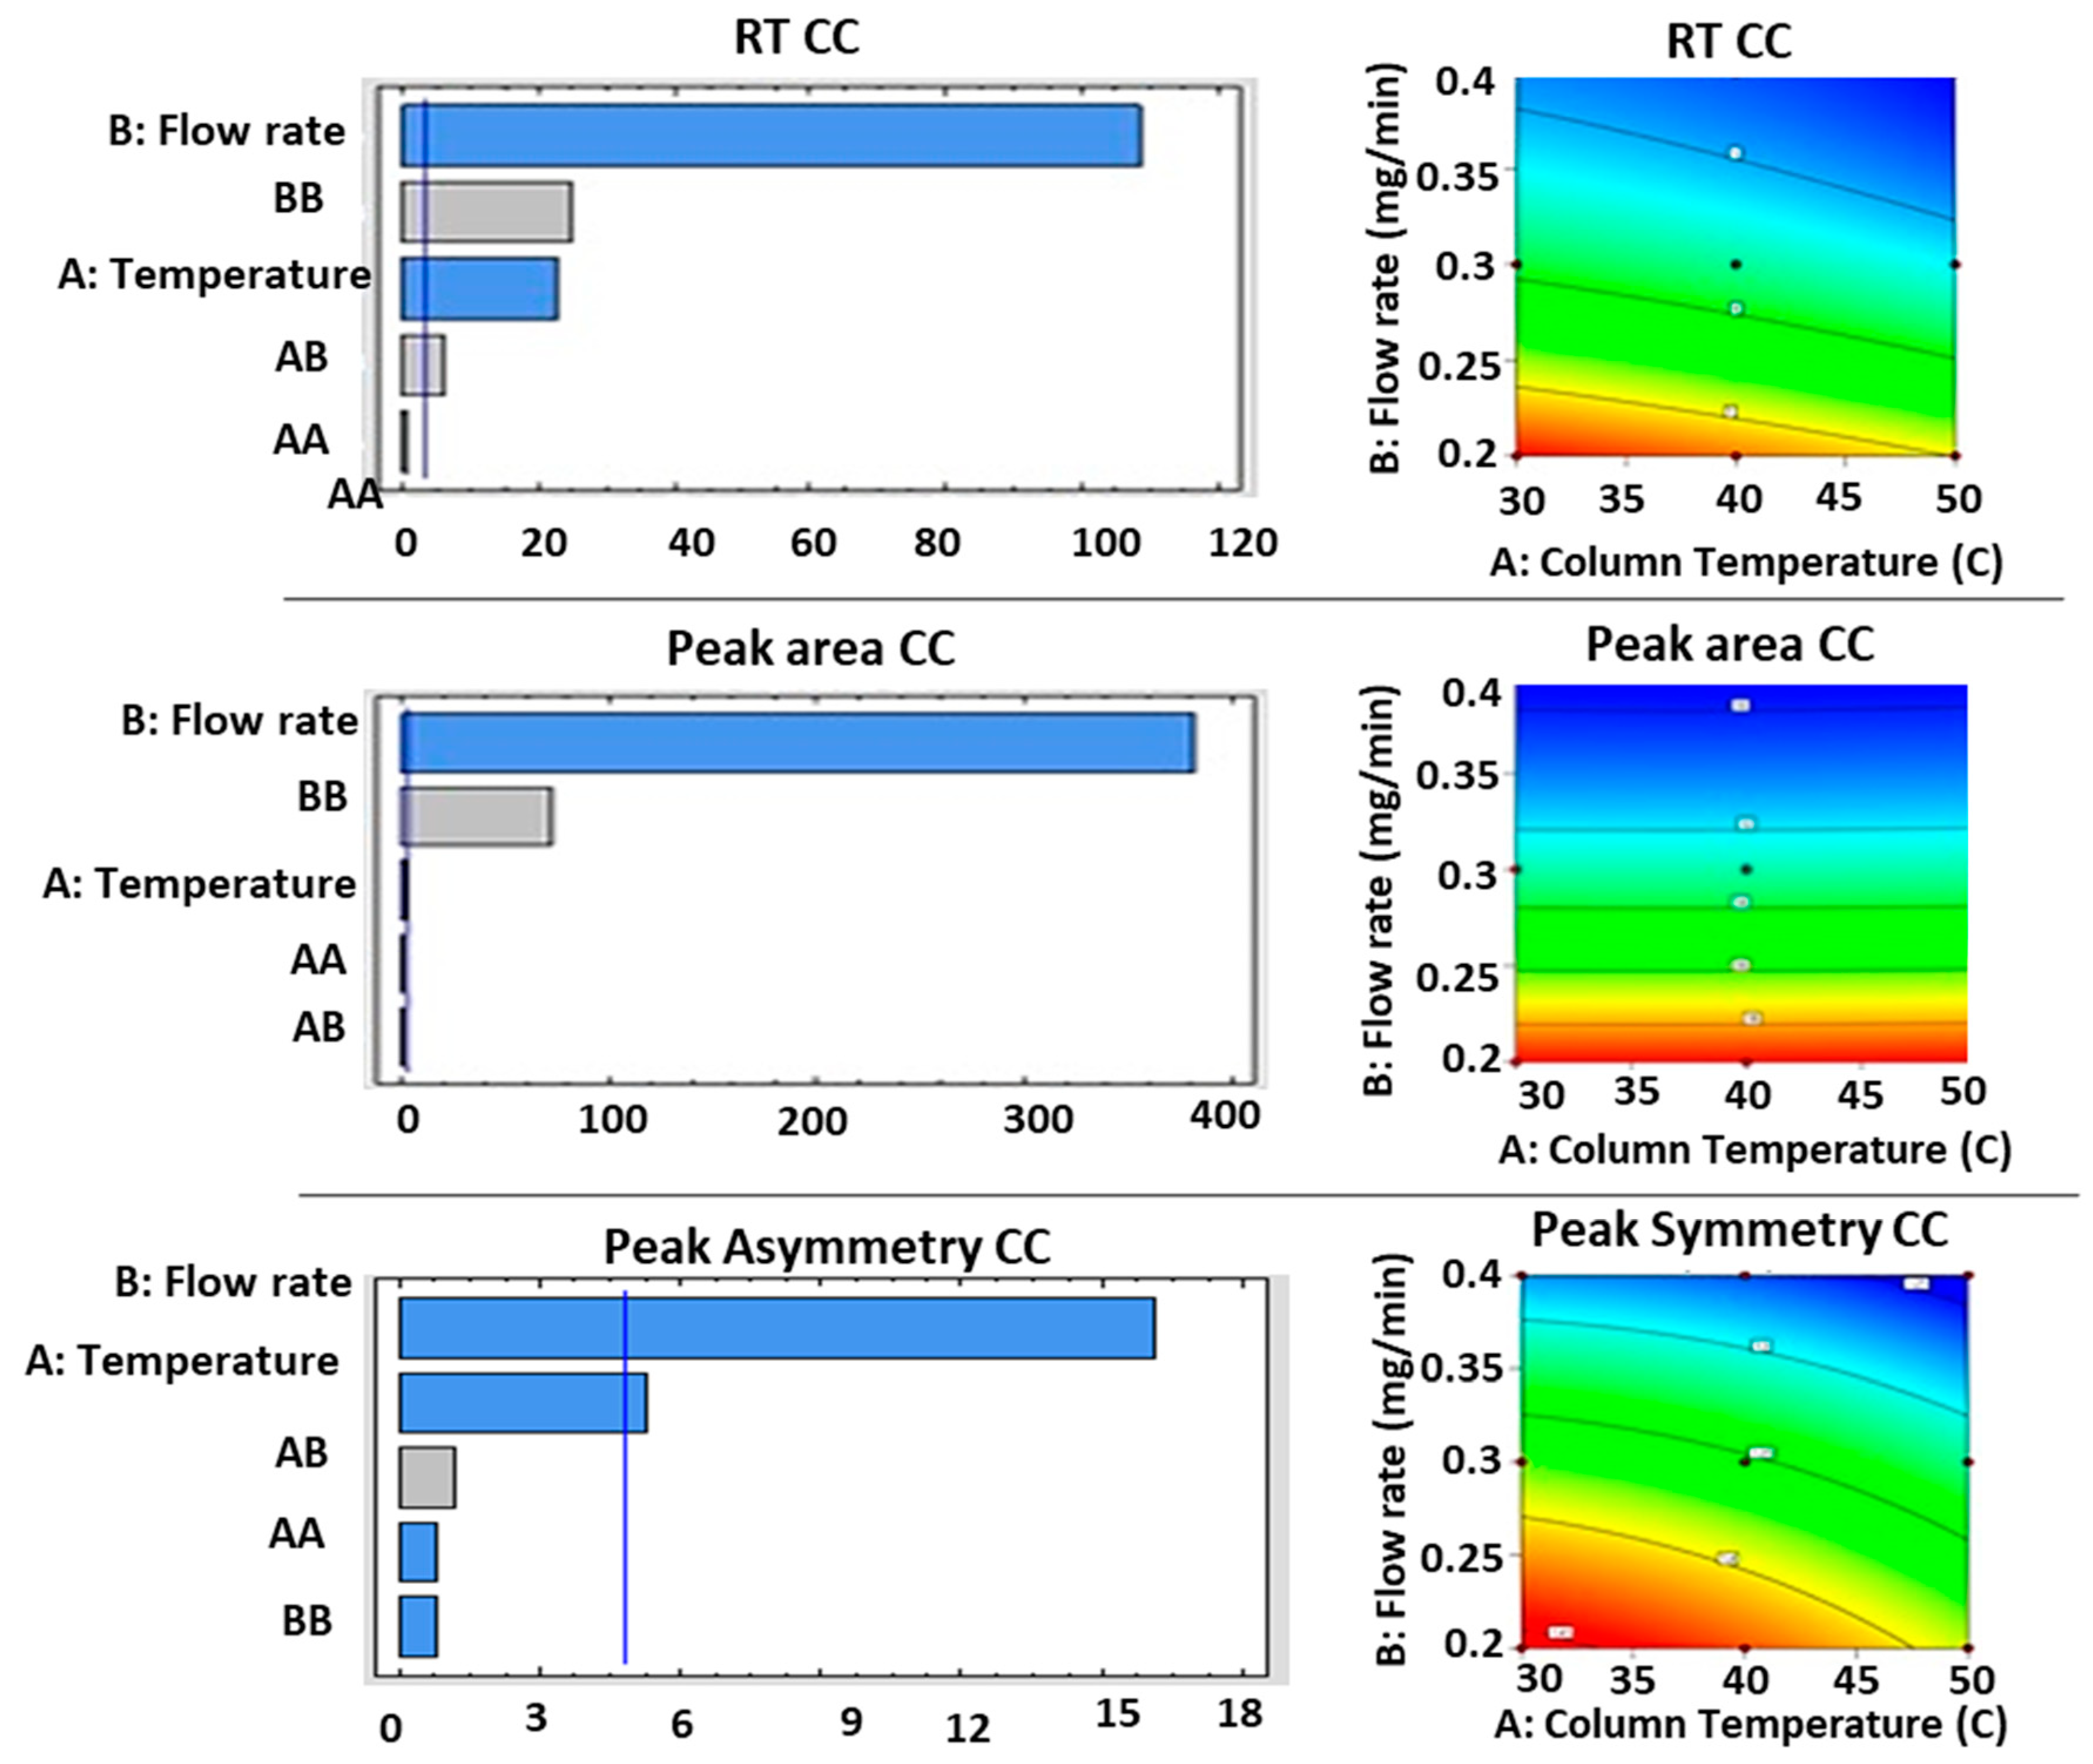
3.1.3. CC Separation

The effects of independent analytical parameters (column temperature: A, flow rate: B, their quadratic effects and interactive effect) on the retention time of CC are displayed in the ANOVA in Table 2 as well as being illustrated in the Pareto chart on the left side of Figure 3. The flow rate and column temperature had highly significant antagonistic effects on the retention time of the CC peak (p values were <0.0001 and 0.0002, respectively), while the quadratic effect of flow rate and interactive effect (AB) exhibited agonistic effects on the response (p values were 0.0003 and 0.013, respectively). From Table 3 and the contour plot (Figure 3 right side), the shortest retention times (4.89, 4.71, and 4.42 min) were attained in the analytical in case of applying the fastest flow rate (0.4 mL/min) along with all column temperatures, while a prolonged retention time (7.8 min) was observed in case of the lowest column temperature with the slowest flow rate.
Concerning the impacts of analytical independent factors on the peak area of CC, the flow rate exerted a greatly antagonistic effect, and its quadratic effect showed a highly agonistic effect on the drug peak area (p values in both cases were <0.0001), as shown in the ANOVA in Table 2 and the Pareto chart (Figure 3). This indicated that the smallest values of CC peak area (around 9.67 mAu) were found in the case of using the fastest mobile phase flow rate (0.4 mL/min) with all studied temperature ranges, while the highest areas of the drug peak (about 19.67 mAu) were noticed in the case of using the slowest flow rate with all levels of column temperature, as displayed in Table 3 and the contour diagram in Figure 3, right side.
The symmetry of the CC peak was controlled significantly by flow rate, which exhibited antagonistic effects on the response (p values were 0.0017). At the same time, column temperature had a significant antagonistic effect on GB peak symmetry (p = 0.04). In addition, the symmetry range of CC peaks was between 1.25 and 1.45.

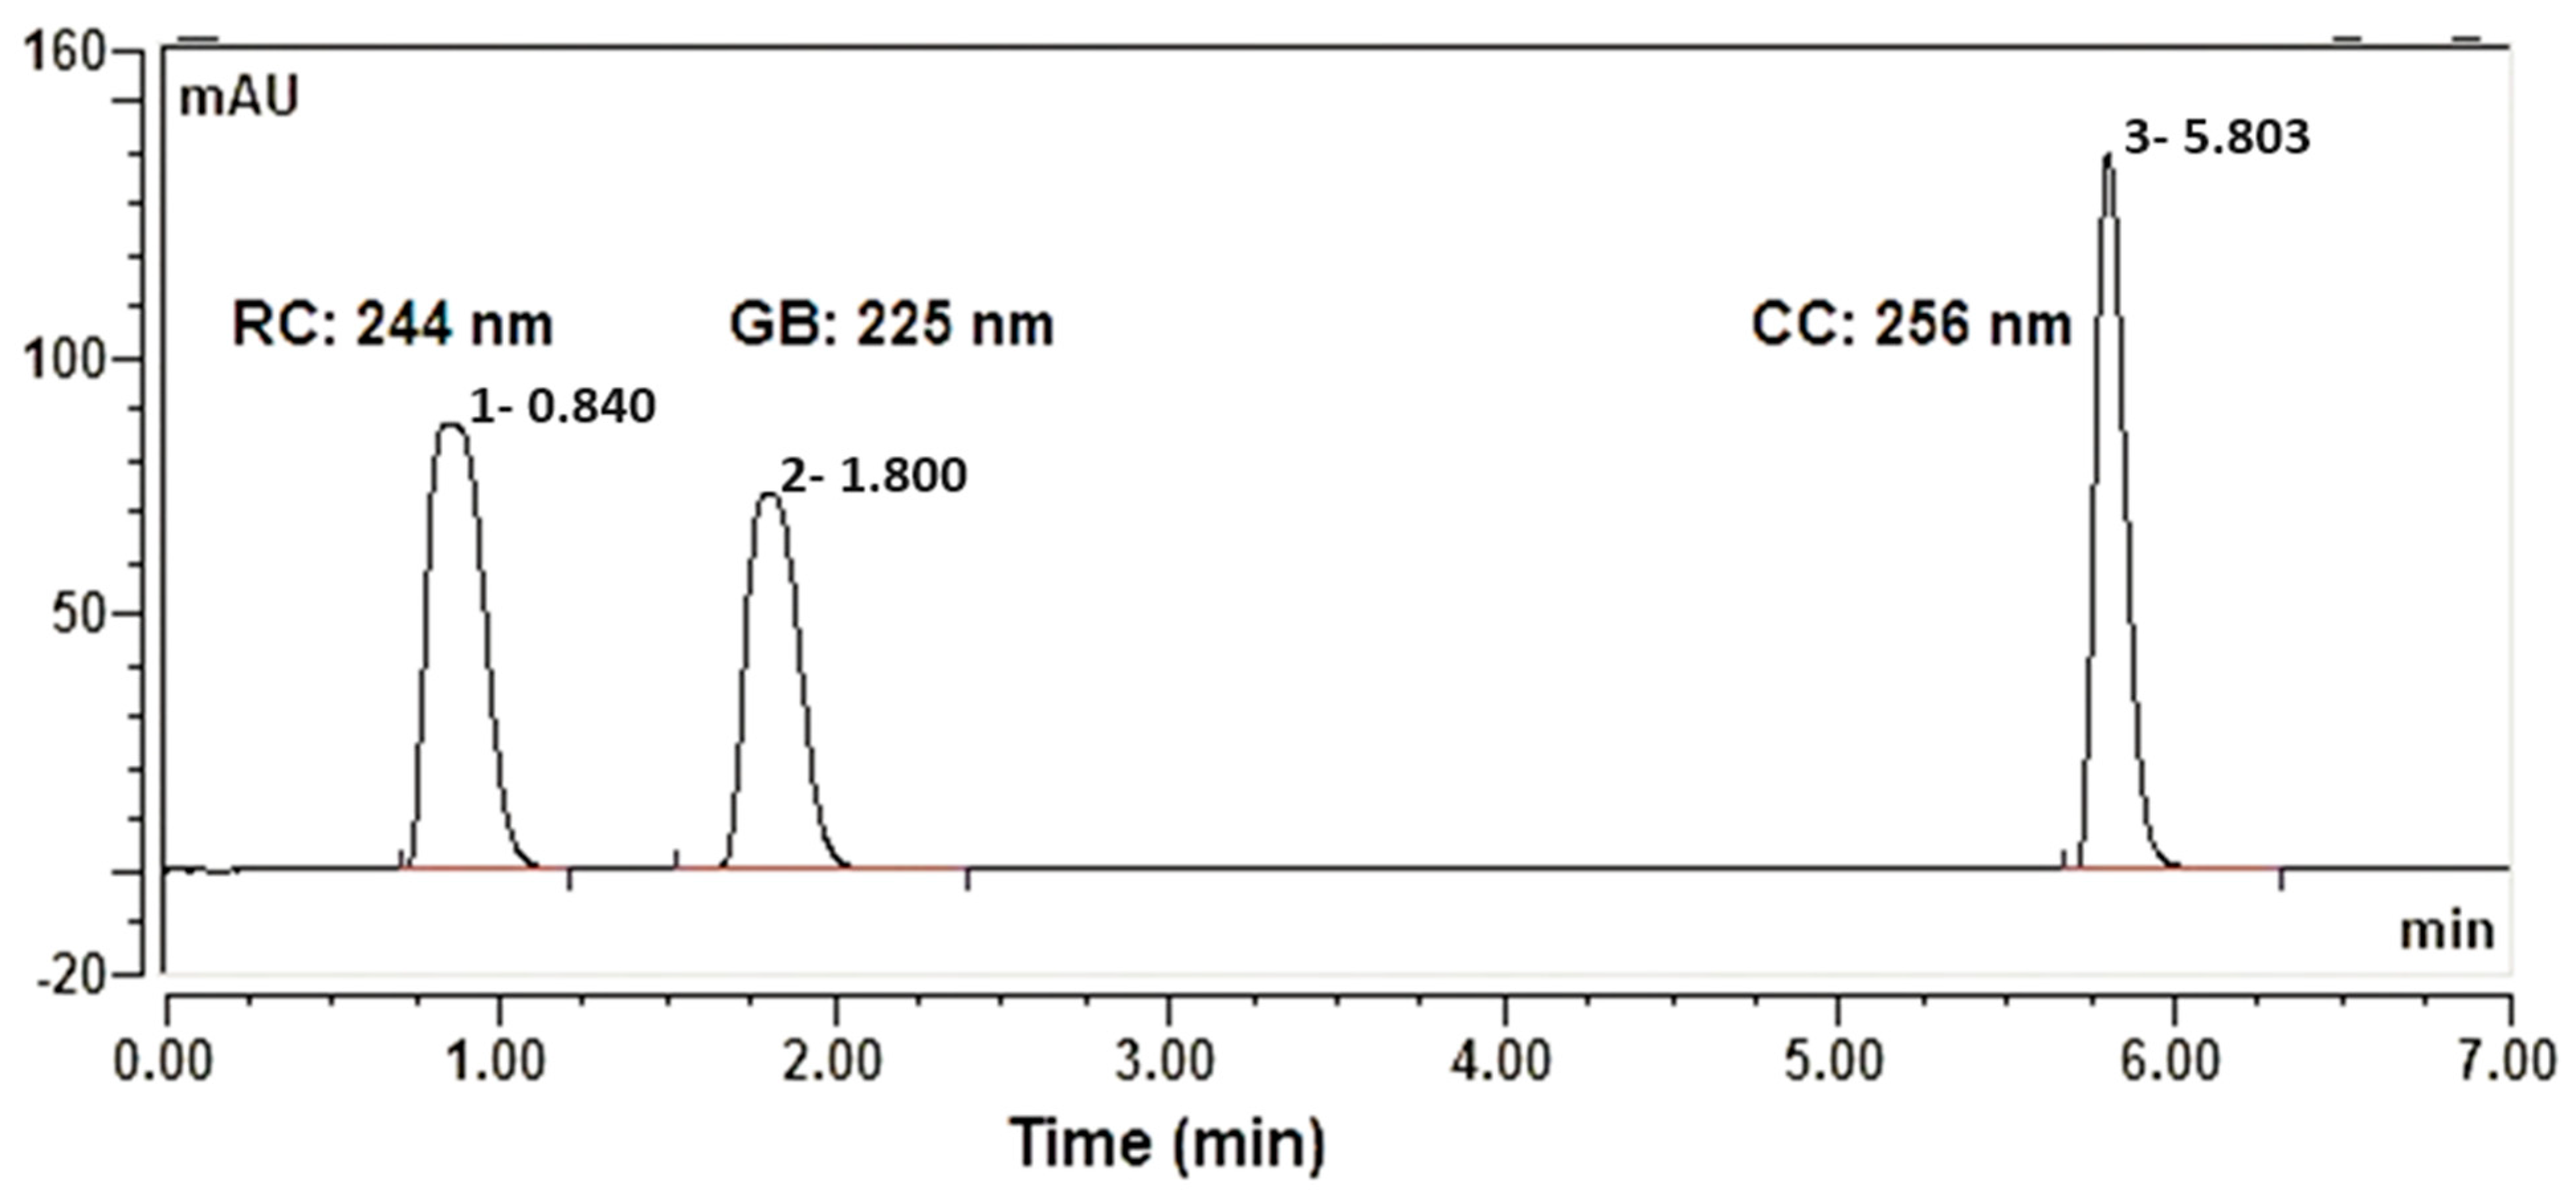
3.2. Optimization of UPLC Conditions for Simultaneous Analysis of RC, GB, and CC

The procedure of optimizing the analytical independent factors (column temperature: A and mobile phase flow rate: B) for the simultaneous separation of the three tested APIs was built on the statistical analysis of all tested responses. This was created in accordance with the following analytical desirability conditions: minimized retention time, maximized peak area, and peak asymmetry in the range of 1–1.4 for all APIs. Also, the resolution between the RC peak and GB peak was selected in the range of 3.06–4.59, while the resolution between GB and CC peaks was in the range of 14.56–20.94. Based on the previous desirability parameters, the statistical program suggested the use of a column temperature of 50 C with a flow rate of 0.26 mL/min as optimized analytical conditions. These optimized conditions were applied for the simultaneous separation of the APIs, and the UPLC chromatogram is presented in Figure 4. In addition, the optimum conditions for the analysis of RC, GB, and CC chromatograms using UPLC comparing the predicted and observed analytical values are listed in Table 4. The results revealed that RC was separated at 0.837 ± 0.013 × 10⁻¹⁴ min with a peak area of 17.003 ± 0.033 mAU/min, a peak asymmetry factor of 1.59 ± 0.006, and a resolution with a GB peak of 3.08 ± 0.01. In addition, the GB peak was separated at 1.8 ± 0.004 min with a peak area of 27.18 ± 0.0.08 mAU/min, a peak asymmetry factor of 1.36 ± 0.012, and a resolution with a GB peak of 17.07 ± 0.044. Moreover, the late peak of CC was detected at 5.80 ± 0.005 min with a peak area of 15.35 ± 0.08 mAU/min and a peak asymmetry factor of 1.32 ± 0.01. These obtained data were found to be closer to the predicted values.

3.3. Method’s Validation

3.3.1. Linearity

The instrument response to different concentrations of the API was determined by constructing a peak area–drug concentration curve. The standard calibration curves for CC, GB, and RC are shown in the figures. The correlation coefficient (r2), calculated from the regression line, was 0.999 which for all indicates the goodness of fit. Table 5 shows the linear regression data for CC, GB, and RC.

3.3.2. Limit of Detection (LOD) and Limit of Quantification (LOQ)

The lowest detected concentration (LOD) by the developed UPLC method was measured based on the slope of the standard curve. The LOD was 0.0067, 0.0069, and 0.0093 ppm for CC, GB, and RC, respectively. The reliably detected quantity (LOQ) for CC, GB, and RC was 0.0205, 0.0209, and 0.0282 ppm, respectively.

3.3.3. Accuracy and Precision

The determination of the % recovery was used as a reflection of the developed assay’s accuracy. The % recovery was determined for low (2 ppm), medium (10 ppm), and high (50 ppm) concentration (Table 6). The % recovery for CC ranged from 99.09 to 107.50 with an RSD% of 0.14 to 0.24%. For GB, the % recovery ranged from 97.4 to 105.34% with a % RSD of 0.23 to 0.54%. In the case of RC, the % recovery ranged from 97.6 to 104.7% with a %RSD of 0.26 to 0.30%.
The precision of the developed assay was estimated using intra-day and inter-day precision analysis (Table 7). Good precision is always predicted by the %RSD. A %RSD less than 2 indicates good precision of the developed assay. The calculated %RSD for all components is less than 2, which indicates that the developed assay is precise.

3.3.4. Robustness

The capability of the analytical procedure to resist any tiny change in the assay parameters was tested by changing the UV wavelength and column temperature. Table 8 shows the influence of changing the assay parameters on the peak area, retention time, peak symmetry, and resolution for the three components. The data were represented as %RSD. The %RSD values for all parameters are less than 2, which complies with the ICH requirements. Moreover, the small values of % RSD values reflect the capability of the developed assay to analyze the triple-therapy components simultaneously with good endurance to change in the wavelength and column temperature.

3.4. Application of the Developed UPLC Method

The dispersed formulation showed good homogeneity with a transparent appearance, as shown in Figure 5a. The particle size of dispersed SNEDDS formulation was in the nanosize with a particle size of 83.31 nm. To validate the accuracy of the developed UPLC method, the drug content was determined. It was found that the actual drug contents for rosuvastatin, glibenclamide, and candesartan were 10.00 ± 0.28, 4.84 ± 0.11, and 16.28 ± 0.43 mg/gm, respectively. The accuracy of the developed method was estimated, and it was found that the percentage of actual to theoretical content was between 96.82 and 101.73, as shown in Figure 5b. This indicates that the developed method is reliable and accurate in estimating the drug content in the proposed formulation. Figure 6 shows the chromatogram of the three drugs extracted from the SNEDDs formulation.

4. Discussion

The analytical procedures designed for the analysis of the three APIs (RC, GB, and CC) were successfully capable of separating the analytes’ peaks efficiently with reasonable retention times, peak areas, peak symmetry, and resolution between adjacent peaks as well.
The peak of RC appeared at short retention times (around 1 min), while the GB peak was detected within 3 min, and the long retention time was observed in the case of the CC peak (about 6.0); Table 3. The variation of retention times for each API during all nine runs is attributed to the effect of independent parameters on the response. At higher levels of color temperatures, the APIs’ retention times were found to be significantly reduced. This might be attributed to the effect of raising column temperature on lowering the viscosity of the mobile [32]. In such a case, the mobile phase diffusion was momentously higher, and therefore, narrower peaks with short retention times would be attained. In addition, accelerating the mobile phase flow rate resulted in reducing the retention times of the peaks for the three tested analytes. This might be due to increasing the column pressure, which in turn results in the fast separation of analytes.
The peak areas of Rc and GB were found to be affected antagonistically by the mobile phase flow rate and its quadratic effect, while the CC peak area was significantly affected by the flow rate quadratic effect. Hossain et al. [33] showed that the peak area of Cr(VI)-MP and Cr(III)-PDC complexes decreased by raising the flow rate of the mobile phase.
The tailing of UPLC peaks takes place when the peak asymmetry factor (As) is higher than 1.2. However, for our case, in which multiple peak separation is targeted, peaks greater than 1.5 up to 2.0 could be acceptable according to the literature [27,34,35].
Peak resolution is an essential indicator of the performance of UPLC. It measures how rapidly and how completely analytes in a sample separate during their passage through the column. A resolution value of 1.5 or higher between two adjacent peaks could confirm acceptable sample separation [36]. The results of the effects of independent parameters on the separation between adjacent peaks (RC-GB and GB-CC) revealed that the flow rate agonistically affected the resolution between the adjacent peaks, while column temperature at its quadratic level retards the response. Kevin et al. [37] showed that the capability to separate different analytes in the chromatographic analytical procedures is controlled significantly by temperature and flow rate.
The validation of the developed UPLC method to analyze the triple therapy simultaneously is the outcome we expected to find. It showed that the method is linear, accurate, and precise. Also, the method showed a good tolerance against condition changes.
The developed method can be categorized as a green analytical method. Methanol is considered one of the greener solvents that can be used. Methanol has been used as a green solvent to analyze metformin [38] and Fluvastatin [39]. Based on the green solvent selection tool (GSST), in which the G value ranges from 1 to 10, and the highest G value is the greenest solvent, the G value of methanol is 5.8 (category score: W = 4.0, H = 4.9, E = 8.4, S = 7.1, where health is H, safety is S, environment is E, and waste disposal is W. This value considers methanol a green solvent [40].

5. Conclusions

Recently, the application of an efficient and fast UPLC analysis in quality control became of great importance. It reduces the solvent, energy, and time consumption. Therefore, a developed UPLC for a triple therapy was performed. This triple therapy is composed of drugs that manage the most common chronic disease, with RC as an antilipidemic agent, GB as an antidiabetic agent, and CC as an antihypertensive agent.
The developed assay efficiently separates the three components and it reduces the analysis time by 7 min. The developed method was tested for validation, and the results’ data showed that it is valid in terms of linearity, accuracy, and precision. The robustness test showed that the analytical assay can tolerate any change in condition and separate the analytes efficiently.

Author Contributions

Conception and design of study, M.A.I. and A.Y.S.; acquisition of data, M.A.I., A.Y.S., D.A. and B.A.; analysis and interpretation of data, M.A.I., A.Y.S. and D.A.; drafting the manuscript, M.A.I., A.Y.S. and D.A.; revising the manuscript, M.A.I., A.Y.S. and D.A. All authors have read and agreed to the published version of the manuscript.

Funding

The authors extend their appreciation to the Researchers Supporting Project number (RSP2024R171), King Saud University, Riyadh, Saudi Arabia.

Data Availability Statement

All data are within the article.

Acknowledgments

The authors extend their appreciation to the Researchers Supporting Project number (RSP2024R171), King Saud University, Riyadh, Saudi Arabia.

Conflicts of Interest

The authors declare no conflicts of interest.

References

  1. Wang, H.H.; Lee, D.K.; Liu, M.; Portincasa, P.; Wang, D.Q.-H. Novel insights into the pathogenesis and management of the metabolic syndrome. Pediatr. Gastroenterol. Hepatol. Nutr. 2020, 23, 189–230. [Google Scholar] [CrossRef]
  2. Ambroselli, D.; Masciulli, F.; Romano, E.; Catanzaro, G.; Besharat, Z.M.; Massari, M.C.; Ferretti, E.; Migliaccio, S.; Izzo, L.; Ritieni, A.; et al. New Advances in Metabolic Syndrome, from Prevention to Treatment: The Role of Diet and Food. Nutrients 2023, 15, 640. [Google Scholar] [CrossRef] [PubMed]
  3. Saklayen, M.G. The global epidemic of the metabolic syndrome. Curr. Hypertens. Rep. 2018, 20, 12. [Google Scholar] [CrossRef] [PubMed]
  4. Lemieux, I.; Després, J.-P. Metabolic syndrome: Past, present and future. Nutrients 2020, 12, 3501. [Google Scholar] [CrossRef] [PubMed]
  5. Castro-Barquero, S.; Ruiz-León, A.M.; Sierra-Pérez, M.; Estruch, R.; Casas, R. Dietary strategies for metabolic syndrome: A comprehensive review. Nutrients 2020, 12, 2983. [Google Scholar] [CrossRef] [PubMed]
  6. National Institutes of Health. Metabolic Syndrome Treatment. Available online: https://www.nhlbi.nih.gov/health/metabolic-syndrome/treatment (accessed on 6 January 2024).
  7. Larsen, J.R.; Dima, L.; Correll, C.U.; Manu, P. The pharmacological management of metabolic syndrome. Expert Rev. Clin. Pharmacol. 2018, 11, 397–410. [Google Scholar] [CrossRef] [PubMed]
  8. Swislocki, A.L.; Siegel, D.; Jialal, I. Pharmacotherapy for the metabolic syndrome. Curr. Vasc. Pharmacol. 2012, 10, 187–205. [Google Scholar] [CrossRef] [PubMed]
  9. Chi, Y.; Xu, W.; Yang, Y.; Yang, Z.; Lv, H.; Yang, S.; Lin, Z.; Li, J.; Gu, J.; Hill, C.L.; et al. Three candesartan salts with enhanced oral bioavailability. Cryst. Growth Des. 2015, 15, 3707–3714. [Google Scholar] [CrossRef]
  10. Khan, S.; Madni, A.; Rahim, M.A.; Shah, H.; Jabar, A.; Khan, M.M.; Khan, A.; Jan, N.; Mahmood, M.A. Enhanced in vitro release and permeability of glibenclamide by proliposomes: Development, characterization and histopathological evaluation. J. Drug Deliv. Sci. Technol. 2021, 63, 102450. [Google Scholar] [CrossRef]
  11. Schelz, Z.; Muddather, H.F.; Zupkó, I. Repositioning of HMG-CoA Reductase Inhibitors as Adjuvants in the Modulation of Efflux Pump-Mediated Bacterial and Tumor Resistance. Antibiotics 2023, 12, 1468. [Google Scholar] [CrossRef]
  12. Badila, E.; Frunza, S.A.; Tirziu, C.M.; Bartos, D.; Dorobantu, M. The effect of candesartan on blood pressure, metabolic profile and renal function in hypertensive patients. Int. J. Cardiol. 2009, 137, S134–S135. [Google Scholar] [CrossRef]
  13. Franco, C.C.S.; Prates, K.V.; Previate, C.; Moraes, A.M.P.; Matiusso, C.C.I.; Miranda, R.A.; de Oliveira, J.C.; Tófolo, L.P.; Martins, I.P.; Barella, L.F.; et al. Glibenclamide treatment blocks metabolic dysfunctions and improves vagal activity in monosodium glutamate-obese male rats. Endocrine 2017, 56, 346–356. [Google Scholar] [CrossRef] [PubMed]
  14. Stalenhoef, A.F.; Ballantyne, C.M.; Sarti, C.; Murin, J.; Tonstad, S.; Rose, H.; Wilpshaar, W. A Comparative study with rosuvastatin in subjects with METabolic Syndrome: Results of the COMETS study. Eur. Hearth J. 2005, 26, 2664–2672. [Google Scholar] [CrossRef]
  15. Asrani, S.; Bacharach, J.; Holland, E.; McKee, H.; Sheng, H.; Lewis, R.A.; Kopczynski, C.C.; Heah, T. Fixed-dose combination of netarsudil and latanoprost in ocular hypertension and open-angle glaucoma: Pooled efficacy/safety analysis of phase 3 MERCURY-1 and -2. Adv. Ther. 2020, 37, 1620–1631. [Google Scholar] [CrossRef] [PubMed]
  16. Moon, C.; Oh, E. Rationale and strategies for formulation development of oral fixed dose combination drug products. J. Pharm. Investig. 2016, 46, 615–631. [Google Scholar] [CrossRef]
  17. Böhm, A.-K.; Schneider, U.; Aberle, J.; Stargardt, T. Regimen simplification and medication adherence: Fixed-dose versus loose-dose combination therapy for type 2 diabetes. PLoS ONE 2021, 16, e0250993. [Google Scholar] [CrossRef] [PubMed]
  18. Alshora, D.H.; Ibrahim, M.A.; Sherif, A.Y. Optimization and Validation of Sensitive UPLC-PDA Method for Simultaneous Determination of Thymoquinone and Glibenclamide in SNEDDs Formulations Using Response Surface Methodology. Separations 2023, 10, 577. [Google Scholar] [CrossRef]
  19. Ibrahim, M.; Alhabib, N.A.; Alshora, D.; Bekhit, M.M.S.; Taha, E.; Mahdi, W.A.; Harthi, A.M. Application of Quality by Design Approach in the Optimization and Development of the UPLC Analytical Method for Determination of Fusidic Acid in Pharmaceutical Products. Separations 2023, 10, 318. [Google Scholar] [CrossRef]
  20. Tarek, M.; Ghoniem, N.S.; Hegazy, M.A.; Wagdy, H.A. Design of Experiment-Based Green UPLC-DAD Method for the Simultaneous Determination of Indacaterol, Glycopyrronium and Mometasone in their Combined Dosage Form and Spiked Human Plasma. J. Chromatogr. Sci. 2023, 61, bmad072. [Google Scholar] [CrossRef] [PubMed]
  21. Elmansi, H.; Belal, F. Development of an Eco-friendly HPLC method for the simultaneous determination of three benzodiazepines using green mobile phase. Microchem. J. 2019, 145, 330–336. [Google Scholar] [CrossRef]
  22. Alghazi, M.; Alanazi, F.; Mohsin, K.; Siddiqui, N.A.; Shakeel, F.; Haq, N. Simultaneous separation of antihyperlipidemic drugs by green ultrahigh-performance liquid chromatography–diode array detector method: Improving the health of liquid chromatography. J. Food Drug Anal. 2017, 25, 430–437. [Google Scholar] [CrossRef]
  23. Cvjetko, B.M.; Vidović, S.; Radojčić, R.I.; Jokić, S. Green solvents for green technologies. J. Chem. Technol. Biotechnol. 2015, 90, 1631–1639. [Google Scholar] [CrossRef]
  24. Ameta, R.K.; Soni, K.; Bhattarai, A. Recent Advances in Improving the Bioavailability of Hydrophobic/Lipophilic Drugs and Their Delivery via Self-Emulsifying Formulations. Colloids Interfaces 2023, 7, 16. [Google Scholar] [CrossRef]
  25. International Federation of Pharmaceutical Manufactures & Associations I. Validation of analytical procedures: Text and methodology, Methodology Q2 (R1). In Proceedings of the International Conference on Harmonization (ICH ’96), Geneva, Switzerland, 6 November 1996. [Google Scholar]
  26. Shamim, A.; Ansari, M.A.; Aodah, A.; Iqbal, M.; Aqil, M.; Mirza, M.A.; Iqbal, Z.; Ali, A. QbD-Engineered Development and Validation of a RP-HPLC Method for Simultaneous Estimation of Rutin and Ciprofloxacin HCl in Bilosoma Nanoformulation. ACS Omega 2023, 8, 21618–21627. [Google Scholar] [CrossRef] [PubMed]
  27. Fouad, M.M. RP-UPLC method development and validation for simultaneous estimation of vildagliptin with metformin hydrochloride and ciprofloxacin hydrochloride with dexamethasone sodium phosphate. World J. Pharm. Sci. 2015, 3, 1755–1762. [Google Scholar]
  28. Ibrahim, M.A.; Alshora, D.A.; Alowayid, M.A.; Alanazi, N.A.; Almutair, R.A. Development and Validation of a Green UPLC Analytical Procedure for Glibenclamide Determination in Pharmaceutical Product Using Response Surface Methodology. Orient. J. Chem. 2022, 38, 865–874. [Google Scholar] [CrossRef]
  29. Sherif, A.Y.; Shahba, A.A.-W. Development of a Multifunctional Oral Dosage Form via Integration of Solid Dispersion Technology with a Black Seed Oil-Based Self-Nanoemulsifying Drug Delivery System. Biomedicines 2023, 11, 2733. [Google Scholar] [CrossRef] [PubMed]
  30. Kazi, T.M.; Dandagi, P.M. A New Stability-Indicating RP-HPLC Method for Simultaneous Quantification of Diacerein and Aceclofenac in Novel Nanoemulgel Formulation and Commercial Tablet Dosage Form in the Presence of their Major Degradation Products Using DoE Approach. J. Chromatogr. Sci. 2023, 61, 918–929. [Google Scholar] [CrossRef]
  31. Ettre, L.S. Nomenclature for chromatography (IUPAC Recommendations 1993). Pure Appl. Chem. 1993, 65, 819–872. [Google Scholar] [CrossRef]
  32. Yang, Y.; Lamm, O.J.; He, P.; Kondo, T. Temperature Effect on PeakWidth and Column Efficiency in Subcritical Water Chromatography. J Chromatog Sci. 2002, 40, 107–112. [Google Scholar] [CrossRef]
  33. Abul Hossain, M.; Kumita, M.; Michigami, Y.; Islam, T.S.A.; Mori, S. Rapid Speciation Analysis of Cr(VI) and Cr(III) by Reversed-Phase High-Performance Liquid Chromatography with UV Detection. J. Chromatogr. Sci. 2005, 43, 98–103. [Google Scholar] [CrossRef] [PubMed]
  34. Crawford Scientific. Peak Tailing in HPLC. Available online: https://www.crawfordscientific.com/chromatography-blog/post/peak-tailing-in-hplc (accessed on 27 March 2024).
  35. Chromatography Today. What Is Peak Tailing? Available online: https://www.chromatographytoday.com/news/autosamplers/36/breaking-news/what-is-peak-tailing/31253 (accessed on 27 March 2024).
  36. Maryutina, T.A.; Savonina, E.Y.; Fedotov, P.S.; Smith, R.M.; Siren, H.; Hibbert, D.R. Terminology of separation methods (IUPAC Recommendations 2017). Pure Appl. Chem. 2018, 90, 181–231. [Google Scholar] [CrossRef]
  37. Kevin, E.; Van Cott, R.D. Whitley and N.-H. Linda Wang. Effects of temperature and flow rate on frontal and elution chro-matography of aggregating systems. Separ Technol. 1991, 1, 142–152. [Google Scholar]
  38. Abdelgawad, M.A.; Elmowafy, M.; Musa, A.; Al-sanea, M.M.; Nayl, A.A.; Ghoneim, M.M.; Ahmed, Y.M.; Hassan, H.M.; AboulMagd, A.M.; Salem, H.F.; et al. Development and Greenness Assessment of HPLC Method for and Papaya Extract. Molecules 2022, 27, 375. [Google Scholar] [CrossRef] [PubMed]
  39. Thurmann, S.; Lotter, C.; Heiland, J.J.; Chankvetadze, B.; Belder, D. Chip-based high-performance liquid chromatography for high-speed enantioseparations. Anal. Chem. 2015, 87, 5568–5576. [Google Scholar] [CrossRef]
  40. Chakraborty, A.; Jayaseelan, K. Environmentally sustainable analytical quality by design aided RP-HPLC method for the estimation of brilliant blue in commercial food samples employing a green-ultrasound-assisted extraction technique. Green Process. Synth. 2023, 12, 20230178. [Google Scholar] [CrossRef]
Figure 1. Standardized Pareto chart (left side) and contour plot for the effects of independent parameters on the analytical responses of RC.
Separations 11 00113 g001
Figure 2. Standardized Pareto chart (left side) and contour plot for the effects of independent parameters on the analytical responses of GB.
Separations 11 00113 g002
Figure 3. Standardized Pareto chart (left side) and contour plot for the effects of independent parameters on the analytical responses of CC.
Separations 11 00113 g003
Figure 4. UPLC chromatograms of RC, GB, and CC according to the optimized analytical conditions.
Separations 11 00113 g004
Figure 5. SNEDDs formulation loaded with the triple therapy (a) and its content (b).
Separations 11 00113 g005
Figure 6. UPLC chromatograms of RC, GB, and CC extracted from the SNEDDS formulation.
Separations 11 00113 g006
Table 1. Design of the experiment (DoE) for simultaneous analysis of RC, GB, and CC using UPLC.
Independent FactorsLevelDependent Factors (Response)
−10+1
A: Temperature (°C)
B: Flow rate (mL/min)
30
0.2
40
0.3
50
0.4
RCY1: Retention time (min)
Y2: Peak area (mAU/min)
Y3: Peak Asymmetry
GBY4: Retention time (min)
Y5: Peak area (mAU/min)
Y6: Peak Asymmetry
Y7: Resolution of RC-GB Peaks
CCY8: Retention time (min)
Y9: Peak area (mAU/min)
Y10: Peak Asymmetry
Y11: Resolution of GB-CC Peaks
Table 2. ANOVA data for the effects of independent analytical factors on the analytical responses of RC, GB, and CC.
ResponseRTPeak AreaPeak Assym.Resolution of
Next Peak
RC
Sourcep ValuesF Valuep ValuesF Valuep ValuesF Valuep Values *F Value
A—Temperature 0.0002528.190.19652.740.03965.080.0730311.48
B—Flow rate<0.000111,826.65<0.00011.461 × 1050.001721.810.000410.06
AB0.009535.490.51750.53500.48901.730.20953.67
0.65680.24150.28901.650.62940.62460.02491.01
0.0001624.66<0.00015314.200.629410.900.96110.3797
GB
Sourcep ValuesF Valuep ValuesF Valuep ValuesF Valuep Values **F Value
A—Temperature0.0003376.670.10615.240.026616.650.07307.36
B—Flow rate<0.00011531.53<0.00011.03 × 1050.002785.230.0004322.28
AB0.008538.410.50700.56460.06078.620.20952.54
0.15313.620.30271.540.56320.41970.024917.49
0.004362.01<0.00013802.920.008438.610.96110.0028
CC
Sourcep ValuesF Valuep ValuesF Valuep ValuesF Value
A—Temperature <0.00012385.740.0589.020.039625.90
B—Flow rate0.0002558.606.507486.210.001712.23
AB<0.000110,937.100.6670.2270.4890116.10
0.21633.420.0777.040.62940.6187
0.00032.44<0.000118,308.960.62940.2868
* Resolution of RC-GB peaks. ** Resolution of GB-CC peaks.
Table 3. Analytical data for the simultaneous separation of Rosuvastatin calcium, Glibencamide, and Candisartan cilextil.
Column TemperatureFlow RateRCGBCC
RT RCPeak Area RCSymmetry RCResolution RC-GB PeaksRT GBPeak Area GBSymmetry GBResolution GB-CC PeaksRT CCPeak Area CCSymmetry CC
300.21.299 ± 0.0621.22 ± 1.231.43 ± 0.00414.557 ± 0.073.3 ± 0.00834.51 ± 0.541.12 ± 0.0024.59 ± 0.027.8 ± 0.2119.55 ± 0.981.44 ± 0.008
400.40.62 ± 0.0310.7093 ± 0.561.533 ± 0.00220.94 ± 0.021.45 ± 0.00717.22 ± 1.211.31 ± 0.0014.03 ± 0.074.71 ± 0.099.67 ± 0.211.25 ± 0.009
300.30.861 ± 0.0414.230 ± 1.121.637 ± 0.00216.713 ± 0.052.22 ± 0.00622.99 ± 0.981.25 ± 0.0074.46 ± 0.075.86 ± 0.2112.94 ± 0.091.39 ± 0.003
500.40.573 ± 0.00810.7494 ± o.981.543 ± 0.00319.987 ± 0.051.24 ± 0.000117.31 ± 1.511.39 ± 0.0013.39 ± 0.014.43 ± 0.099.70 ± 0.211.25 ± 0.007
500.30.743 ± 0.01214.2546 ± 0.871.543 ± 0.00517.967 ± 0.031.61 ± 0.00323.10 ± 0.941.38 ± 0.0043.25 ± 0.035.30 ± 0.2113.00 ± 0.411.31 ± 0.001
400.21.2167 ± 0.01621.32 ± 0.981.06 ± 0.00115.783 ± 0.022.73 ± 0.00234.76 ± 1.521.11 ± 0.0083.67 ± 0.097.42 ± 0.1219.53 ± 0.871.45 ± 0.005
300.40.663 ± 0.00610.718 ± 0.211.643 ± 0.00420.023 ± 0.0091.67 ± 0.00417.22 ± 0.871.24 ± 0.014.57 ± 0.044.89 ± 0.099.67 ± 0.131.27 ± 0.001
400.30.79 ± 0.00314.294 ± 0.871.67 ± 0.00718.73 ± 0.021.84 ± 0.00523.10 ± 1.141.36 ± 0.0093.81 ± 0.095.61 ± 0.1412.951.35 ± 0.007
500.21.129 ± 0.0721.30 ± 0.481.067 ± 0.00115.607 ± 0.082.35 ± 0.00734.70 ± 0.791.11 ± 0.023.06 ± 0.056.98 ± 0.2319.611.39 ± 0.001
Table 4. The optimum conditions for the analysis of RC, GB, and CC chromatograms using UPLC comparing the predicted and observed analytical values.
Optimized Independent ParametersResponse
TypeDesirabilityPredictedObserved
Temperature (A): 50 °C
(B): Flow rate
0.26 mL/min
RCY1: Retention time (min)Minimum0.8660.837 ± 0.013 × 10⁻¹⁴
Y2: Peak area (mAU/min)Maximum16.6717.003 ± 0.033
Y3: Peak AsymmetryIn range 1.41.59 ± 0.006
Y4: RC-GB Peak ResolutionIn range 3.133.08 ± 0.01
GBY5: Retention time (min)Minimum1.831.8 ± 0.004
Y6: Peak area (mAU/min)Maximum27.0727.18 ± 0.0.08
Y7: Peak AsymmetryIn range 1.31.36 ± 0.012
Y8: GB-CC Peak ResolutionIn range 16.9517.07 ± 0.044
CCY9: Retention time (min)Minimum5.855.80 ± 0.005
Y10: Peak area (mAU/min)Maximum15.2515.35 ± 0.08
Y11: Peak AsymmetryIn range 1.351.32 ± 0.01
Table 5. Linear regression data for CC, GB, and RC.
ParametersCCGBRC
Linearity range2–50 ppm2–50 ppm2–50 ppm
Line equationY = 0.342x − 0.1644Y = 0.581x − 0.257Y = 0.459x − 0.203
Regression coefficient (r2)0.999 ± 00.999 ± 00.999 ± 0
Slope0.342 ± 0.00070.581 ± 0.001210.459 ± 0.00129
Standard error of the slope0.000260.000460.00049
Intercept0.1644 ± 0.00270.257 ± 0.004420.257 ± 0.0057
Standard error of the slope0.001300.001670.00218
Table 6. Percentage recovery of the triple-therapy components.
Theoretical Concentration (ppm)RCGBCC
%Recovery%RSD%Recovery%RSD%Recovery%RSD
2104.7610.268105.3470.548107.5070.141
1097.6090.30597.4190.31399.0940.240
50100.8500.301100.6780.231102.7350.222
Table 7. Intra-day and inter-day precision for the triple-therapy components.
AnalytesTheoretical Concentration (ppm)Intra-Day
(Measured Concentration, RSD%)
Inter-Day (Measured Concentration, RSD%)
Day-1Day-2Day-3
RC22.095; 0.2682.095; 0.2682.09; 0.0942.121; 1.457
109.760; 0.3059.760; 0.3059.80; 0.0719.849; 0.483
5050.425; 0.30150.425; 0.30150.78; 0.18551.061; 0.372
GB22.106; 0.5482.106; 0.5482.104; 0.3742.117; 0.274
109.741; 0.3139.741; 0.3139.78; 0.1419.802; 0.157
505.033; 0.2315.033; 0.23150.62; 0.12350.854; 0.284
CC22.15; 0.1412.15; 0.1412.104; 0.1752.115; 0.375
109.909; 0.2409.909; 0.2409.755; 0.1679.779; 0.175
5051.36; 0.22251.36; 0.22250.643; 0.16250.979; 0.248
Table 8. Robustness validation of the developed analytical procedure to analyze the triple-therapy components, represented as RSD%.
ParametersRosuvastatin Calcium
UV Wavelength (nm)Peak AreaRetention TimePeak SymmetryResolution
2420.52300.9110.745
2440.3030.2631.0240
2460.0480.6011.6830.211
Column temperature
480.66101.2740
500.3030.2631.0240
520.40901.2660.439
Glibenclamide
UV Wavelength (nm)Peak AreaRetention TimePeak SymmetryResolution
2230.4950.1231.2020.428
2250.2320.2781.7110.156
2270.2460.2171.0780.321
Column temperature
480.8530.3982.1920.763
500.2320.281.7110.156
520.4510.4201.4181.244
Candesartan
UV Wavelength (nm)Peak AreaRetention TimePeak SymmetryResolution
2560.51601.142
2580.2230.0861.727
2600.5941.9 × 10−141.503
Column temperature
480.87201.545
500.2230.0861.727
520.46100.441
Disclaimer/Publisher’s Note: The statements, opinions and data contained in all publications are solely those of the individual author(s) and contributor(s) and not of MDPI and/or the editor(s). MDPI and/or the editor(s) disclaim responsibility for any injury to people or property resulting from any ideas, methods, instructions or products referred to in the content.

