Article

Isolation and Identification of Bitter Compounds in Ginseng (Panax ginseng C. A. Mey.) Based on Preparative High Performance Liquid Chromatography, UPLC-Q-TOF/MS and Electronic Tongue

1
Hubei Provincial Key Laboratory of Quality and Safety of Traditional Chinese Medicine Health Food, Jing Brand Research Institute, Jing Brand Co., Ltd., Daye 435100, China
2
Hubei Traditional Chinese Medicine Formula Granule Engineering & Technology Research Center, Huangshi 435000, China
*
Author to whom correspondence should be addressed.
Separations 2024, 11(4), 114; https://doi.org/10.3390/separations11040114
Submission received: 28 February 2024 / Revised: 3 April 2024 / Accepted: 6 April 2024 / Published: 7 April 2024

Abstract

:
As a traditional Chinese medicinal herb, ginseng (Panax ginseng C. A. Mey.) is commonly used to treat common diseases, for example, esophageal cancer and myasthenia gravis. Furthermore, ginseng is also processed into a functional food additive that is utilized to improve the freshness of chicken soup and make health wine. Unfortunately, ginseng (Panax ginseng C. A. Mey.) has already shown a noticeable bitterness during its application process. In this research, the bitter substances in ginseng (Panax ginseng C. A. Mey.) after two common preparation processes (water extraction and ethanol extraction) were separated, purified and identified by preparative high performance liquid chromatography (prep-HPLC), high performance liquid chromatography with diode array detector (HPLC-DAD), ultra-performance liquid chromatography coupled with high-resolution quadrupole time-of-flight mass spectrometry (UPLC-Q-TOF/MS) and an electronic tongue. The results indicated that compared with the other four bitter compounds, the ginsenoside Rb1 had the highest bitterness value, followed by 20(S)-ginsenoside Rg2, ginsenoside Rg1, ginsenoside Rf and ginsenoside Rb3. Upon the evaluation of results to reduce the bitterness of ginseng extract, we found that the composite embedding system of chitosan adsorption in the ginseng carrageenan gel microsphere (K/MC/MCG) could effectively reduce the bitterness.

1. Introduction

Ginseng (Panax ginseng C. A. Mey.), considered “The Nine of Immortality”, is a famous perennial herb that belongs to the Araliaceae Panax and has been utilized as a traditional medicine for more than 200 years in China, North Korea and Russia [1]. According to their cultivation methods, ginseng can be divided into three categories: wild ginseng (growth in a forest of mixed coniferous and broad-leaved trees, shrubs and weeds); garden ginseng (artificial planting and growth in an artificial pool bed); understory ginseng (artificial sowing and growth of primitive ginseng in deep mountains and dense forests) [2]. Among these, garden ginseng has the highest yield, accounting for 90% of China’s total yield, and is widely used for processing health products and food [3].
In China, the active substances in ginseng have been extracted and used as functional raw materials to process into traditional medicines for treating chronic diseases, for example, diabetes and tumors [4,5]. Ginseng has also been developed as a cosmetic skincare material and anti-aging agent [6]. In the processing of many foods and beverages, ginseng has been used as an additive to improve the aroma and taste of the product [7,8]. In Southeast Asia, ginseng extract has been dissolved in beverages, being used as a food additive to enhance the body’s immune system [9]. In ginseng chicken soup, a well-known Chinese dish, ginseng was a main condiment with a health care function. Unfortunately, the application of ginseng in food products and health care products has been restricted due to the obvious bitterness [10]. To date, the specific source of this bitterness and the contribution of bitter substances to the bitterness of ginseng were unclear.
Bitter taste is considered as one of the basic tastes, which widely exists in a variety of drugs and food. Compared with other tastes, although the preference and acceptability of a bitter taste is slightly lower, it is more characteristic taste of some food or health products such as citrus [11], green tea [12] and faba bean [13]. Studies have shown that naturally occurring bitter compounds mainly include polyphenolic compounds, such as ester catechins, which are important bitter components in green tea [14]; terpene compounds, for which previous research reports have shown that the bitterness of bitter melon is regulated through the terpenes [15]; flavonoid glycoside compounds, such as the bitter taste of the Forsythia suspense (Thunb.) Vahl herbal which was attributed to phillyrin [16]; and alkaloid compounds, like theobromine in chocolate which is one of the reasons for its bitter taste [17].
In the stems, leaves and roots of ginseng (Panax ginseng C. A. Mey.), saponins are considered as the key functional components. Thus far, researchers have found and identified various ginsenosides in ginseng. Lee et al. [18] identified 58 ginsenosides in ginseng by UPLC-Q-TOF/MS technology, of which 39 ginsenosides were found by quantitative analysis. In total, 803 ginsenosides were identified by off-line three-dimensional liquid chromatography/Q-Orbitrap mass spectrometry [19]. Ginseng has excellent pharmacological effects, and its ginsenosides have been reported to have anti-aging effects on skin through enhancing immune function, resisting melanin formation, inhibiting oxidation, and elevating the concentration of collagen and hyaluronic acid [20]. In addition, saponins in ginseng have antioxidant effects and anti-cancer effects and ameliorate intestinal mucosal damage by enhancing HUR and c-Myc levels [21,22]. Others have shown that saponins in ginseng, such as the ginsenoside Rg1, might have the effect of reducing neuronal apoptosis via ERK/CREB/BDNF signaling to improve learning and memory in epileptic rats [23]. However, there is currently limited literature on the study of ginseng flavor. Thus far, the literature has indicated that total ginsenosides have a bitter taste, but it is not clear which specific type of ginsenoside cause the bitterness.
In this research, the effects of different extraction methods on the bitter value of ginseng extract were studied. Two common methods (water extraction and alcohol extraction) were utilized to obtain experimental samples. The bitterness compounds were analyzed and identified by instrumental analysis. In addition, the method of reducing bitterness in the application process of the condiment was also displayed.

2. Materials and Methods

2.1. Chemicals and Materials

Ginseng was sourced from the local market. The product was harvested in Tieli city, Heilongjiang province, in mid-to-late September 2022. Ginsenoside Rg1, ginsenoside Rf, ginsenoside Rb1, 20(S)-ginsenoside Rg2 and ginsenoside Rb3 of 98.0% purity (HPLC graded) were purchased from National Institutes for Food and Drug Control (Beijing, China). D941 macroporous weak base ion-exchange resin column was purchased from Xi’an Lanxiao Technology Co., Ltd. (Xi’an, China).

2.2. Sample Preparation

Ginseng was crushed through using a Yunbang YB-1000A grinder (Yongkang, China). Based on the use of ginseng in the food industry, two production processes, namely ethanol extraction (for alcoholic beverages) and pure water extraction (for non-alcoholic beverages), were conducted to obtain a bitter taste sample. The ginseng samples extracted with pure water consisted of 200 g of ginseng powder added to 2000 g of distilled water and extracted for 2 h at 80 °C. After standing for 4 h, ginseng samples extracted with pure water were centrifuged for 20 min at 8000 rpm through using a Hettich ROTO SILENTA 630RS centrifuge (Munich, Germany). Afterwards, the supernatant was obtained and fat-soluble pigment impurities were removed by petroleum ether. Finally, the sample was freeze-dried and prepared with pure water at a concentration of 2.5 mg/mL, which was filtered through 0.22 μm pores and stored at −30 °C until analysis.
The ginseng samples extracted with ethanol consisted of 200 g of ginseng powder added to 2000 g of 55% ethanol solution and extracted for 2.5 h at 65 °C. After cooling, the ginseng samples extracted with 55% ethanol solution were then centrifuged for 20 min at 8000 rpm using a Hettich ROTO SILENTA 630RS centrifuge (Munich, Germany) and the supernatant was collected. The fat-soluble pigment in the supernatant was removed by using the D941 macroporous weak base ion-exchange resin column while the permeate was collected. Finally, the sample was freeze-dried and prepared with 55% ethanol solution at a concentration of 2.5 mg/mL, which was filtered through 0.22 μm pores and stored at −30 °C until analysis.

2.3. HPLC-DAD Analysis

The bitter substances in ginseng samples were analyzed by HPLC-DAD (Waters 2695 series, USA). First, the mobile phase and the elution gradient were adjusted and optimized. The HPLC technique was used to detect the chemical composition of ginseng samples after water extraction and ethanol extraction on an Agilent ZORBAX SB-Aq C18 column (4.6 mm × 250 mm, 5 μm). The solvents were acetonitrile (A) and ultra-pure water (B). A total of 10 μL of the sample was injected into the HPLC, and the column temperature was 30 °C. The flow rate was set at 1.0 mL/min, and the detection wavelength was 203 nm. The program of elution was used as follows for pure water extraction and ethanol extraction of the ginseng samples: 0–30 min, 19% Solvent A; 30–40 min, 19–24% Solvent A; 40–43 min, 24–29% Solvent A; 43–50 min, 29–28% Solvent A; 50–60 min, 28% Solvent A; 60–85 min, 28–36% Solvent A; 85–88 min, 36–45% Solvent A; 88–100 min, 45% Solvent A.

2.4. Preparation and Collection of the Fractions

According to the analysis results of HPLC-DAD, each of the fractions in both ginseng samples was obtained by peak-based information through using prep-HPLC (Agilent 1260 Infinity Series, Santa Clara, California, USA) on a Daisogel C18-10 um-120A (20 mm × 250 mm, 7 μm, Agilent Technologies, Santa Clara, California, USA). The solvents were acetonitrile (A) and ultra-pure water (B). 15 mL of the sample were injected into the prep-HPLC, and the column temperature was 30 °C at a flow rate of 20.0 mL/min. The detection wavelength was 203 nm. For pure water extraction and ethanol extraction of ginseng samples: 0–30 min, 19% Solvent A; 30–40 min, 19–24% Solvent A; 40–43 min, 24–29% Solvent A; 43–50 min, 29–28% Solvent A; 50–60 min, 28% Solvent A; 60–85 min, 28–36% Solvent A; 85–88 min, 36–45% Solvent A; 88–100 min, 45% Solvent A. Each of the samples was tested three times.

2.5. Distillate Collection and Treatment

The samples were repeatedly prepared and collected by using prep-HPLC, and the fractions with the same peak time were combined. The collected ingredients were then concentrated by using a N-1300D-W rotary evaporator (Tokyo, Japan) at a temperature of 40 °C. The organic solvent was removed by vacuum treatment combined with rotary evaporation, and the final sample was freeze-dried twice and kept in a dry environment.

2.6. Recognition of the Bitter Fraction

The freeze-dried sample was dissolved in ultra-pure water for recognition of bitter fractions through an electronic tongue system with an initial concentration of 50 μg/mL. The TS-5000Z system (Intelligent Sensor Technology Co., Ltd., Tokyo, Japan) with two reference electrodes and five lipid/membrane electrodes was used to measure taste values, including sourness (CA0), saltiness (CT0), bitterness (C00), astringency (AE1) and umami (AAE), and this was used to verify the taste of different samples [24]. In order to determine whether the sample has a bitter taste, each fraction of the two ginseng samples (water extraction and ethanol extraction) collected using prep-HPLC was determined through an electronic tongue system.

2.7. Qualitative Analysis of Bitter Compounds

Bitter substances were identified via an ultra-performance liquid chromatography-quadrupole-time-of-flight high-resolution mass spectrometry system (Waters Xevo G2 QTof series, Milford, MA, USA) connected to a UPLC system (Waters ACQUITY series, Milford, MA, USA). Before the formal experiment, the mobile phase and the elution gradient were adjusted and optimized by UPLC-Q-TOF/MS. The mobile phase consisted of ultra-pure water containing 0.1% formic acid (A) and acetonitrile containing 0.1% formic acid (B). In total, 0.5 μL of the sample was injected into the UPLC-Q-TOF/MS, and the column temperature was 40 °C. The flow rate was set at 0.4 mL/min. For pure water extraction and ethanol extraction of ginseng samples, the parameters were as follows: 0 min, 100% Solvent A; 5 min, 95% Solvent A; 20 min, 60% Solvent A; 28 min, 10% Solvent A; 30 min, 100% Solvent A; 32 min, 100% Solvent A. Each of the samples was tested three times. The characterization of bitter fractions was carried out on the electro spray ionization source (ESI) in the negative ion mode. The mass spectrometry working parameters were set as follows: source temperature, 40 °C; desolvation gas temperature, 500 °C; flow rates of cone and desolvation gas, 60 L/h and 800 L/h, respectively; capillary voltage, 3.0 kV. The data collection range was m/z 50~1200.

2.8. Quantitation Analysis of Bitter Compounds

According to the results of qualitative analysis, the standard compounds corresponding to each identified bitter compound were dissolved in methanol to prepare a standard compound solution with an initial concentration of 0.5 mg/mL. Then, the initial concentration of the standard solution was diluted in multiples of 2 to obtain a set of standard compound diluted solutions. The regression equations of each standard compound were obtained by evaluating the linear relationship between peak area and concentration under the same chromatographic working parameters used for ginseng samples (water extraction and ethanol extraction). The concentration of bitter substances in ginseng was calculated by a regression equation. Each of the samples was tested three times.

2.9. Bitter Taste Evaluation of Samples Using Electronic Tongue

In order to evaluate the taste characteristics of different samples, the TS-5000Z system (Intelligent Sensor Technology Co., Ltd., Tokyo, Japan) was used for electronic tongue measurement. All electrode sensors were preconditioned in a standard activation solution for more than 24 h, and the sensor check was calibrated before each sample measurement. The output parameters included “umami”, “saltiness”, “sourness”, “bitterness” and “astringency” for the first taste, as well as “richness”, “aftertaste-B (aftertaste of bitterness)” and “aftertaste-A (aftertaste of astringency)” as described by Sora [25]. According to the quantitative results of bitter samples, the original bitter standard solution was obtained by ultrasonic dissolution of the corresponding standard solution of each bitter sample in water. Each bitterness sample was tested by the TS-5000Z system.

2.10. Preparation of Debittered Samples

The composite embedding system of chitosan adsorption in the ginseng (Panax ginseng C. A. Mey.) carrageenan gel microsphere (K/MC/MCG) was built in the following ways. Firstly, 0.5 g of carrageenan powder was dispersed in 100 mL of ultra-pure water and stirred for 4 h at 65 °C to ensure complete dissolution. When the system was cooled to 30 °C, 0.8 g of ginseng extract sample (pure water extraction or ethanol extraction) was added to a carrageenan solution and stirred at 400 rpm/min for 3 h at 30 °C to form the final K/MC transport system, which contained 0.5% (w/v) carrageenan and 0.8% ginseng extract. At room temperature, the ginseng extract/carrageenan mixture was injected into 10% (w/v) calcium chloride solution to form carrageenan gel microspheres. Then, these gel microspheres were filtered with filter paper. During the filtration process, ultra-pure water with pH 4 was used to remove the excess calcium chloride solution on the surface of gel microspheres. The smaller gel microspheres were added to 0.5% chitosan solution. After 30 min mixing at room temperature, 10% w/v calcium chloride solution was injected into the system, and gel microspheres were filtered and collected, which were finally washed with ultra-pure water with pH 7 to remove excess calcium ions on the surface. The washed gel microspheres were freeze-dried and collected, which was the sample after debittering.

2.11. Statistical Analysis

The data collected by UPLC-Q-TOF/MS were processed and analyzed by Agilent Mass Hunter software (Qualification Analysis 10.0). The data were processed using SPSS 26.0 statistical software (p < 0.05), and the experimental data were represented as the mean ± standard deviation.

3. Results and Discussion

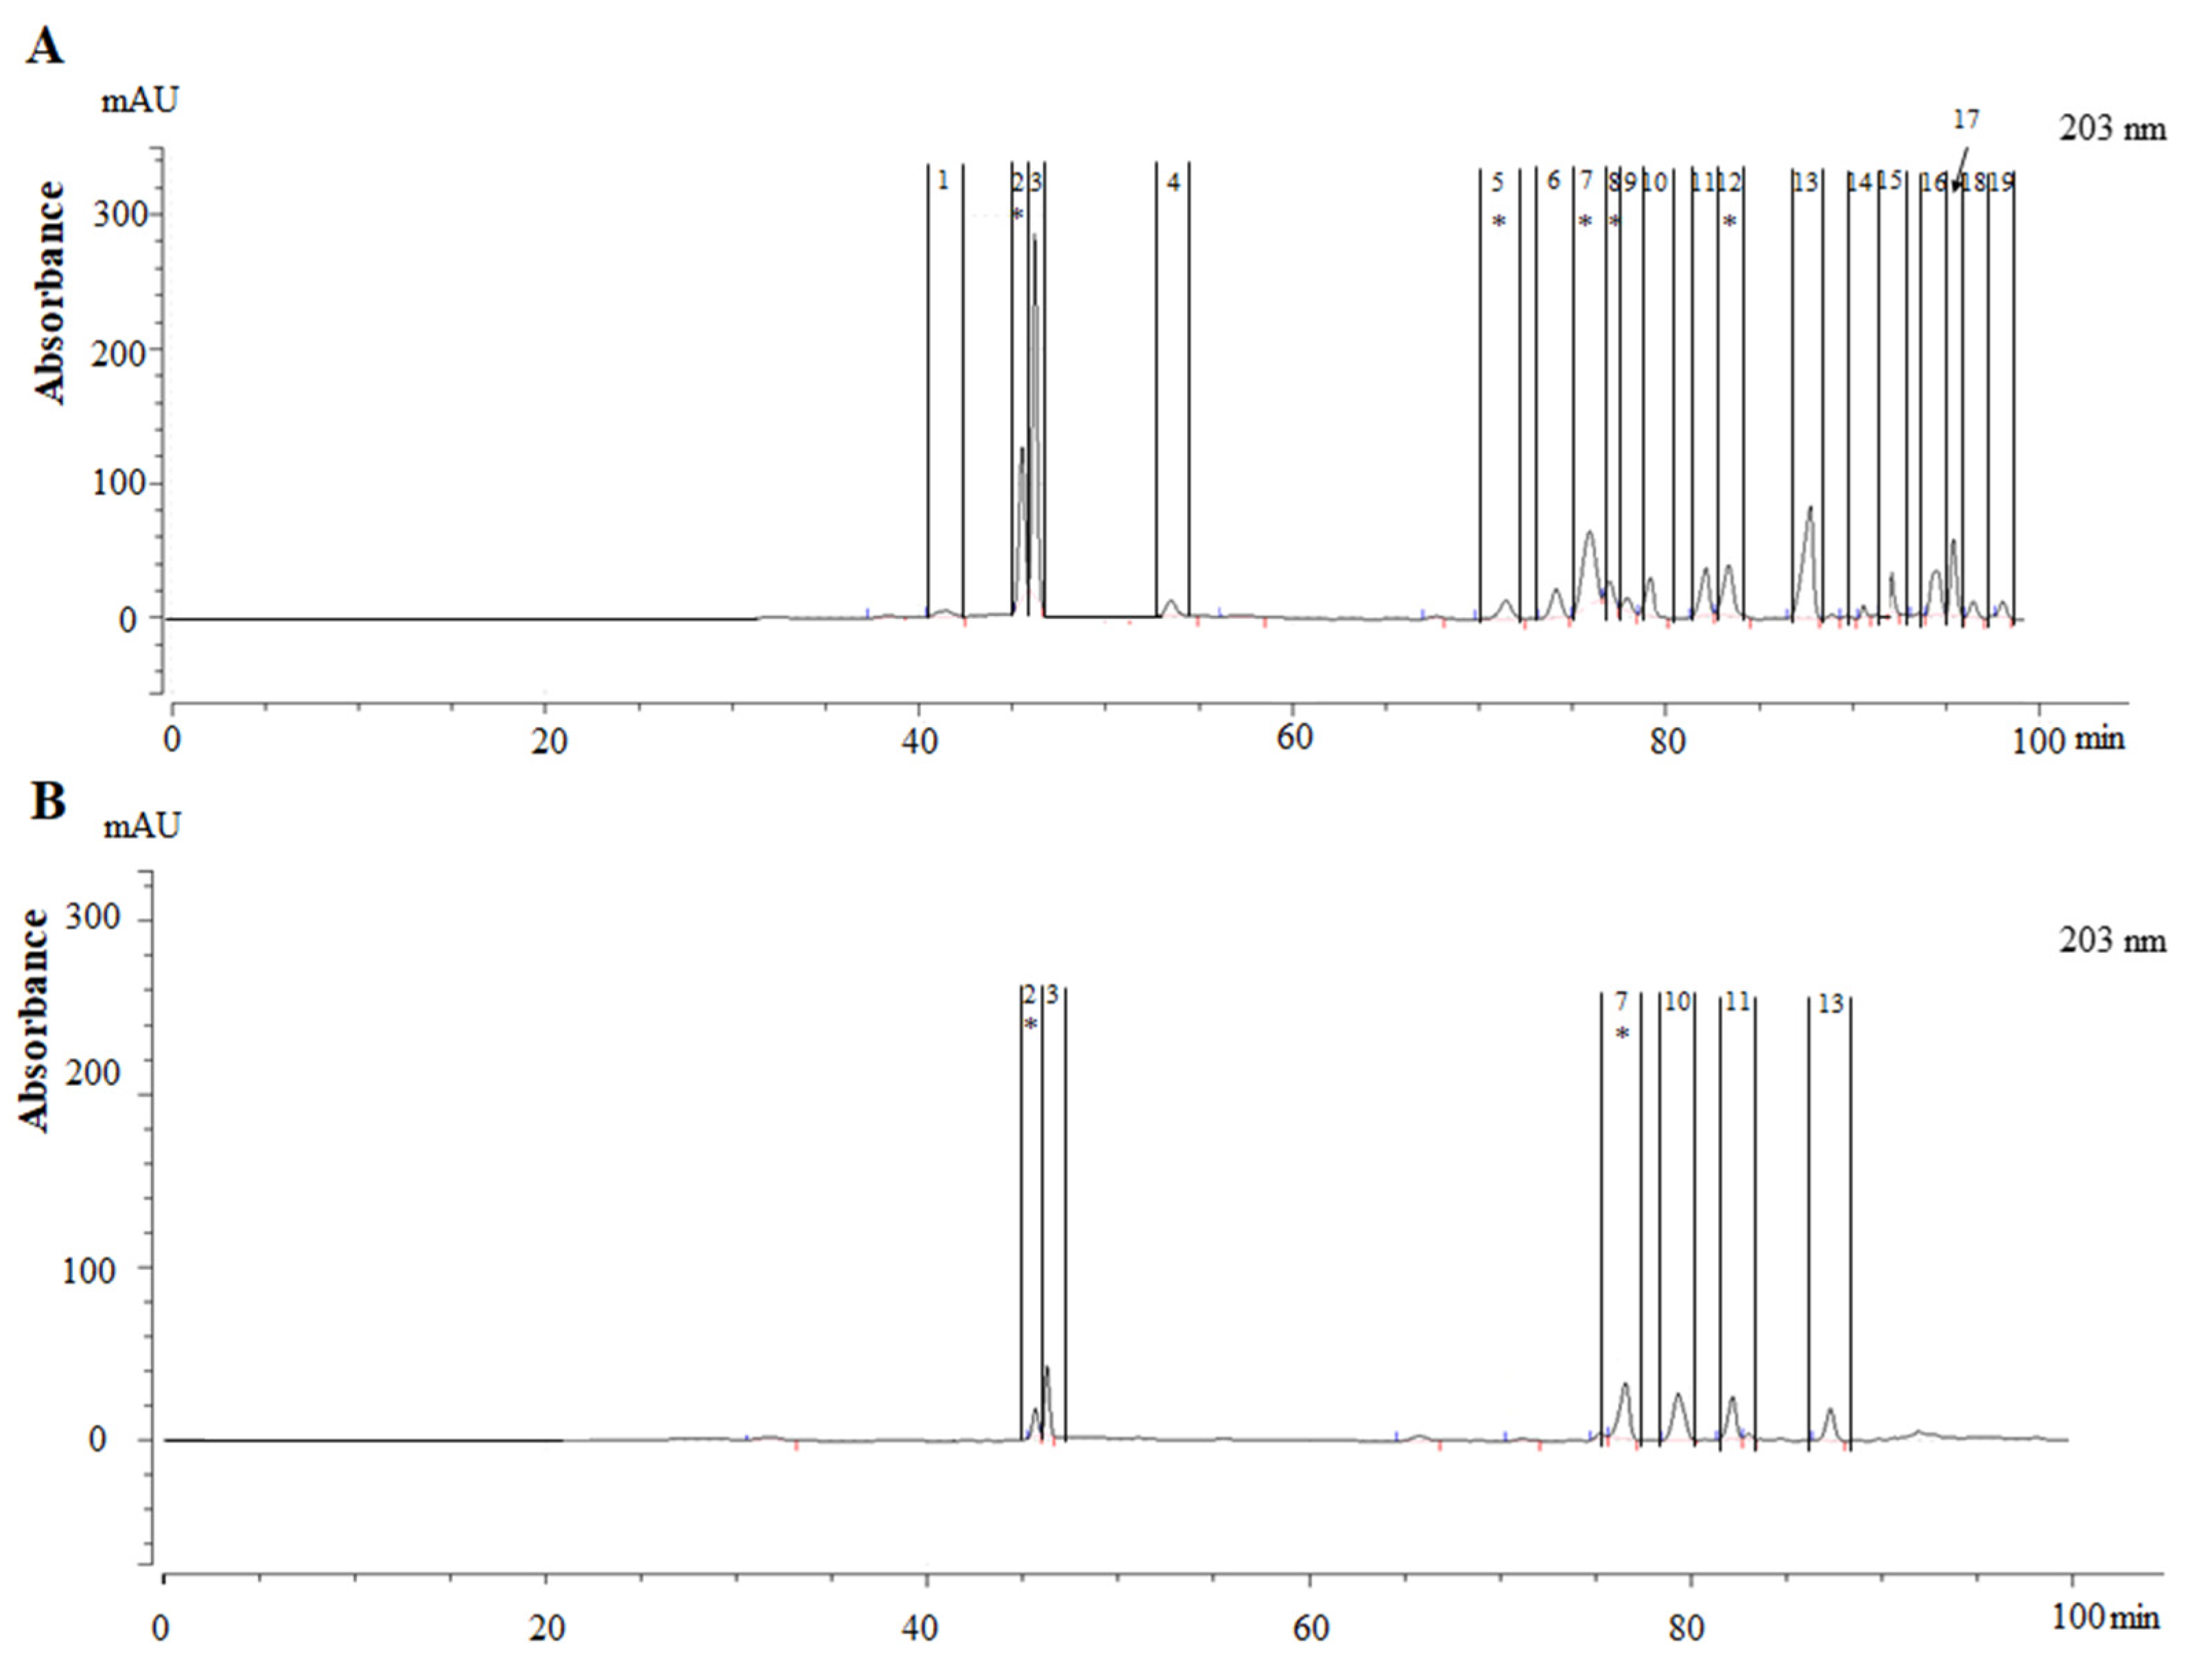
3.1. Separation of the Bitter Compounds from Ginseng

The analysis method of various components in ginseng samples (water extraction and ethanol extraction) was established by using HPLC-DAD. The components in the two samples were separated and obtained using prep-HPLC, and the above operation was repeated 15 times. Then, the same fractions were merged, concentrated, freeze-dried and stored. As shown in Figure 1, 19 fractions from the ethanol-extracted samples and 6 fractions from the pure-water-extracted samples were collected. Each of the components in the both ginseng samples was then evaluated through an electronic tongue system. It was evident that Components 2 and 7 present in the pure-water-extracted ginseng sample had a bitter taste (Table 1 and Figure 1B). In addition, Fractions 2, 5, 7, 8 and 12 present in the ethanol-extracted samples also had high bitterness values (Table 1 and Figure 1A). Compared with pure water extraction of ginseng samples, ethanol extraction of ginseng contained more soluble bitter compounds, indicating that different preparation methods had a significant impact on the basic properties of bitter compounds in ginseng extracts.

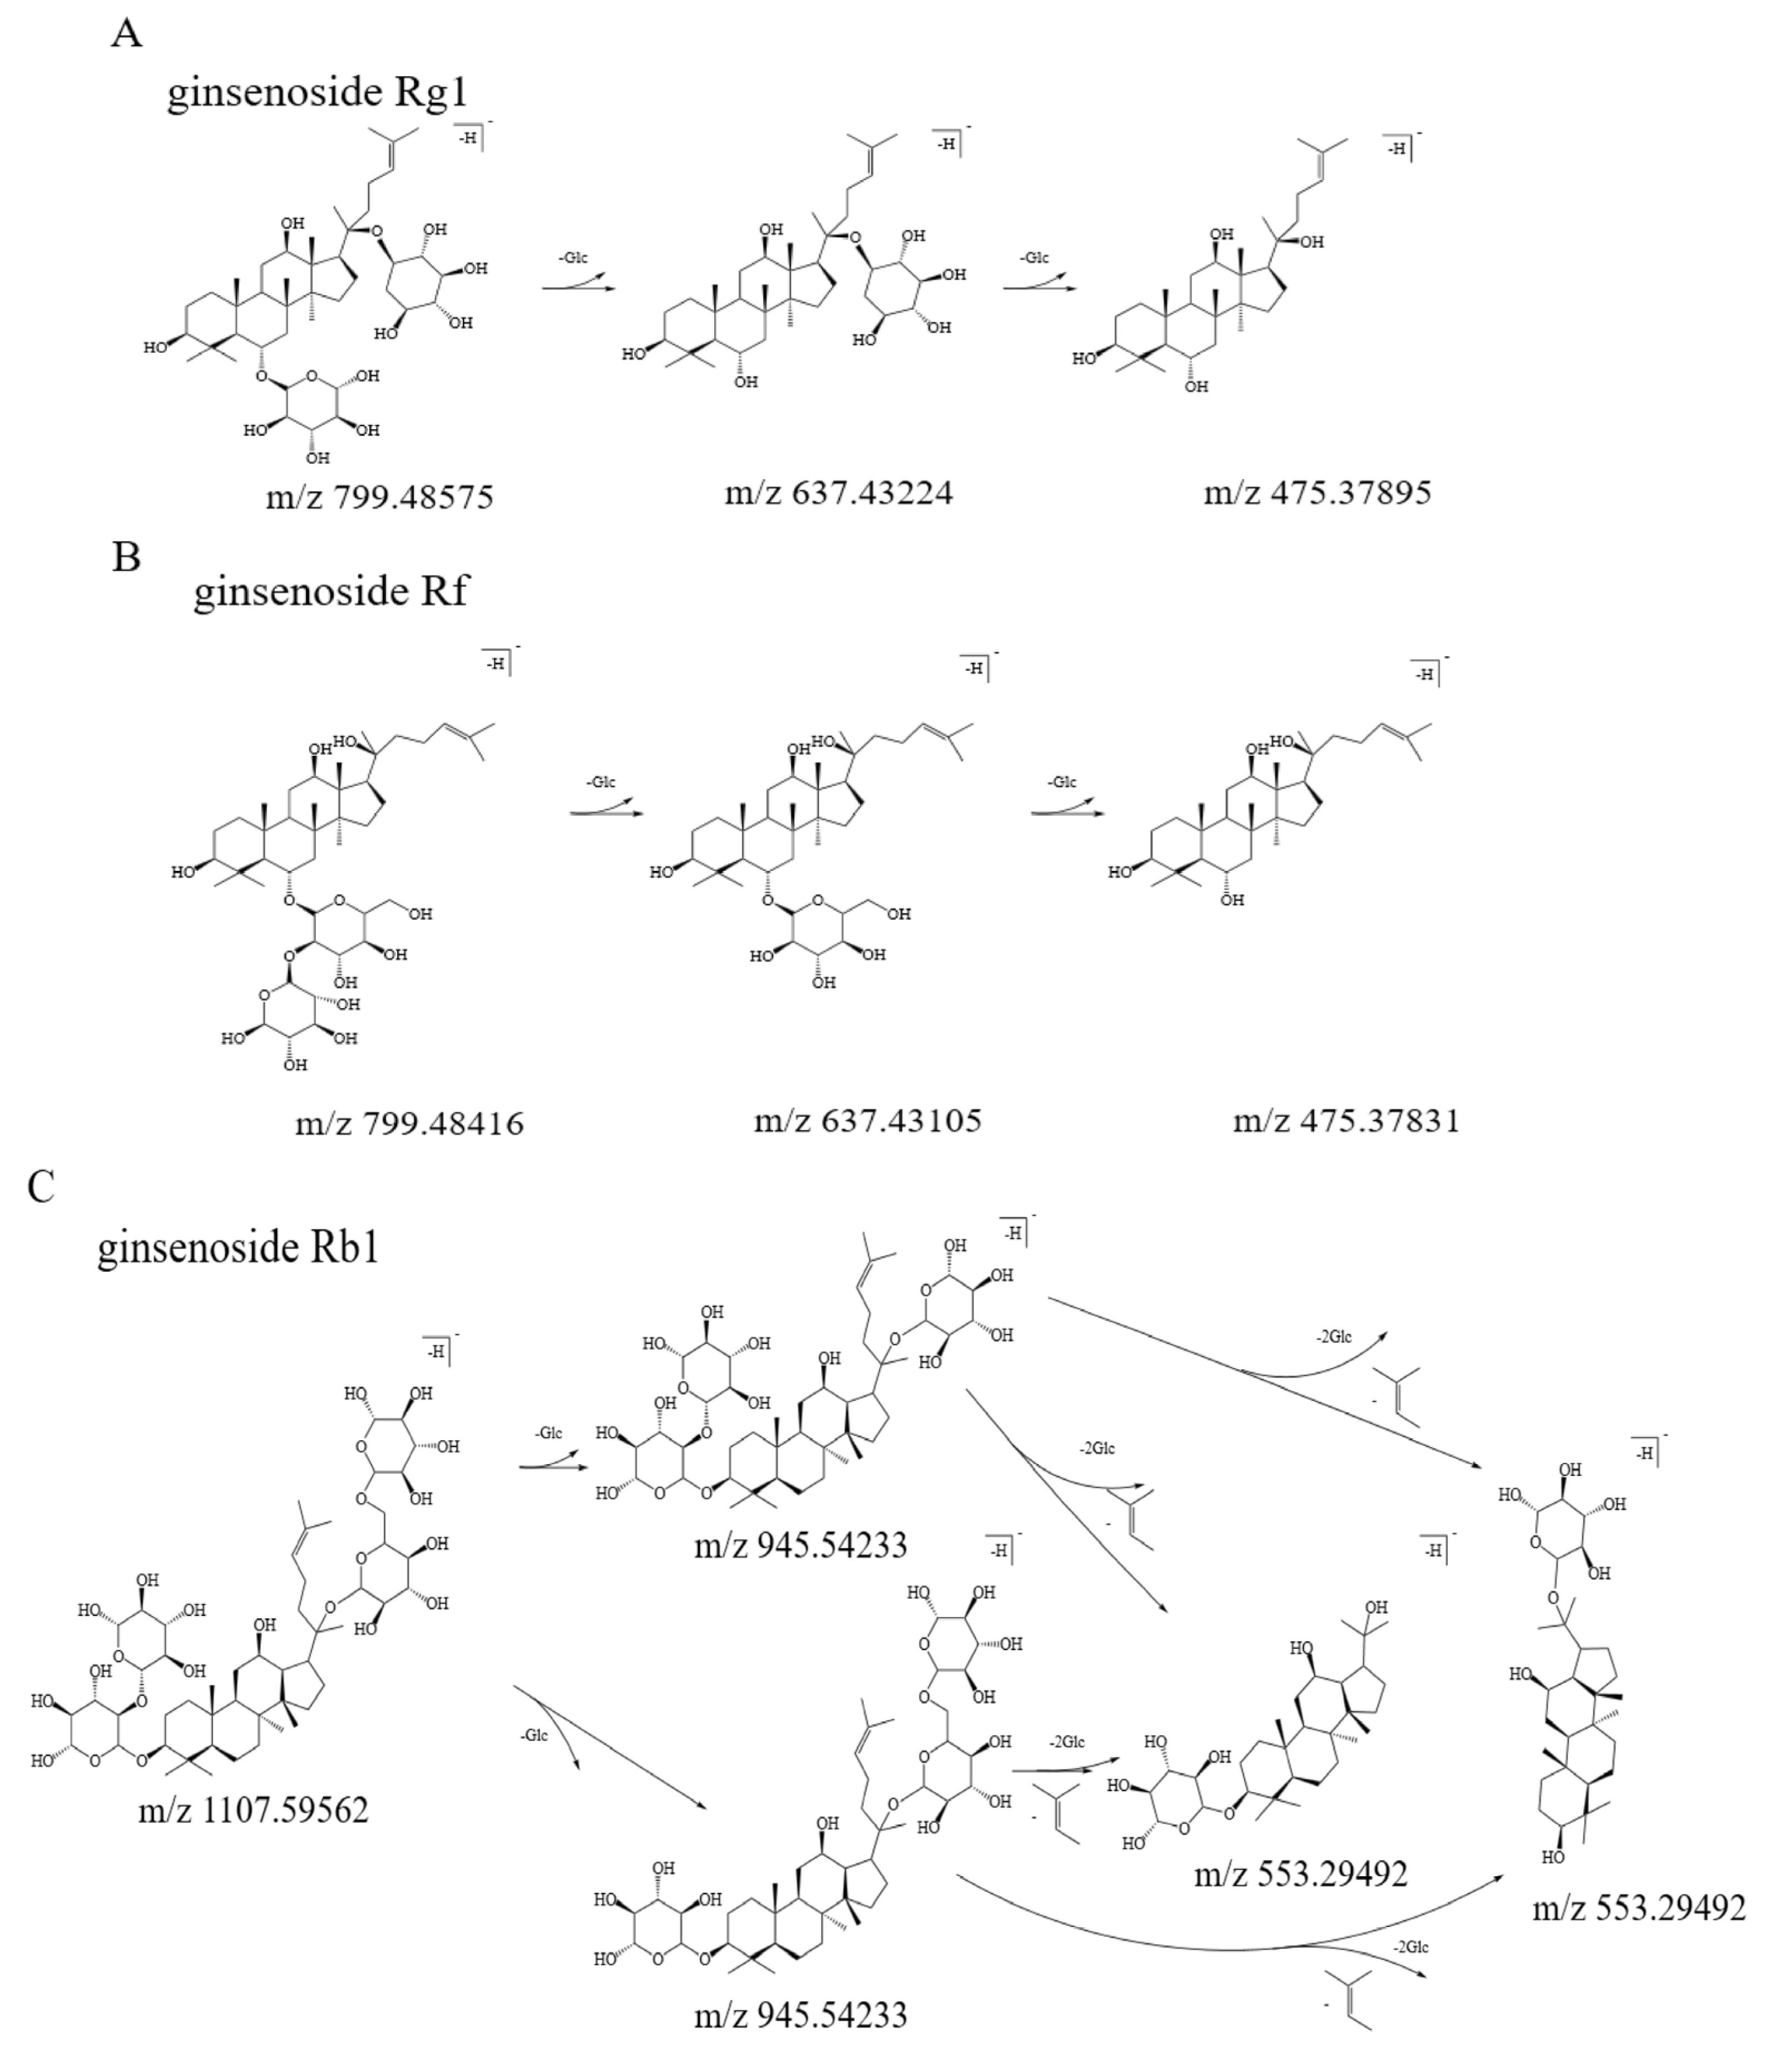
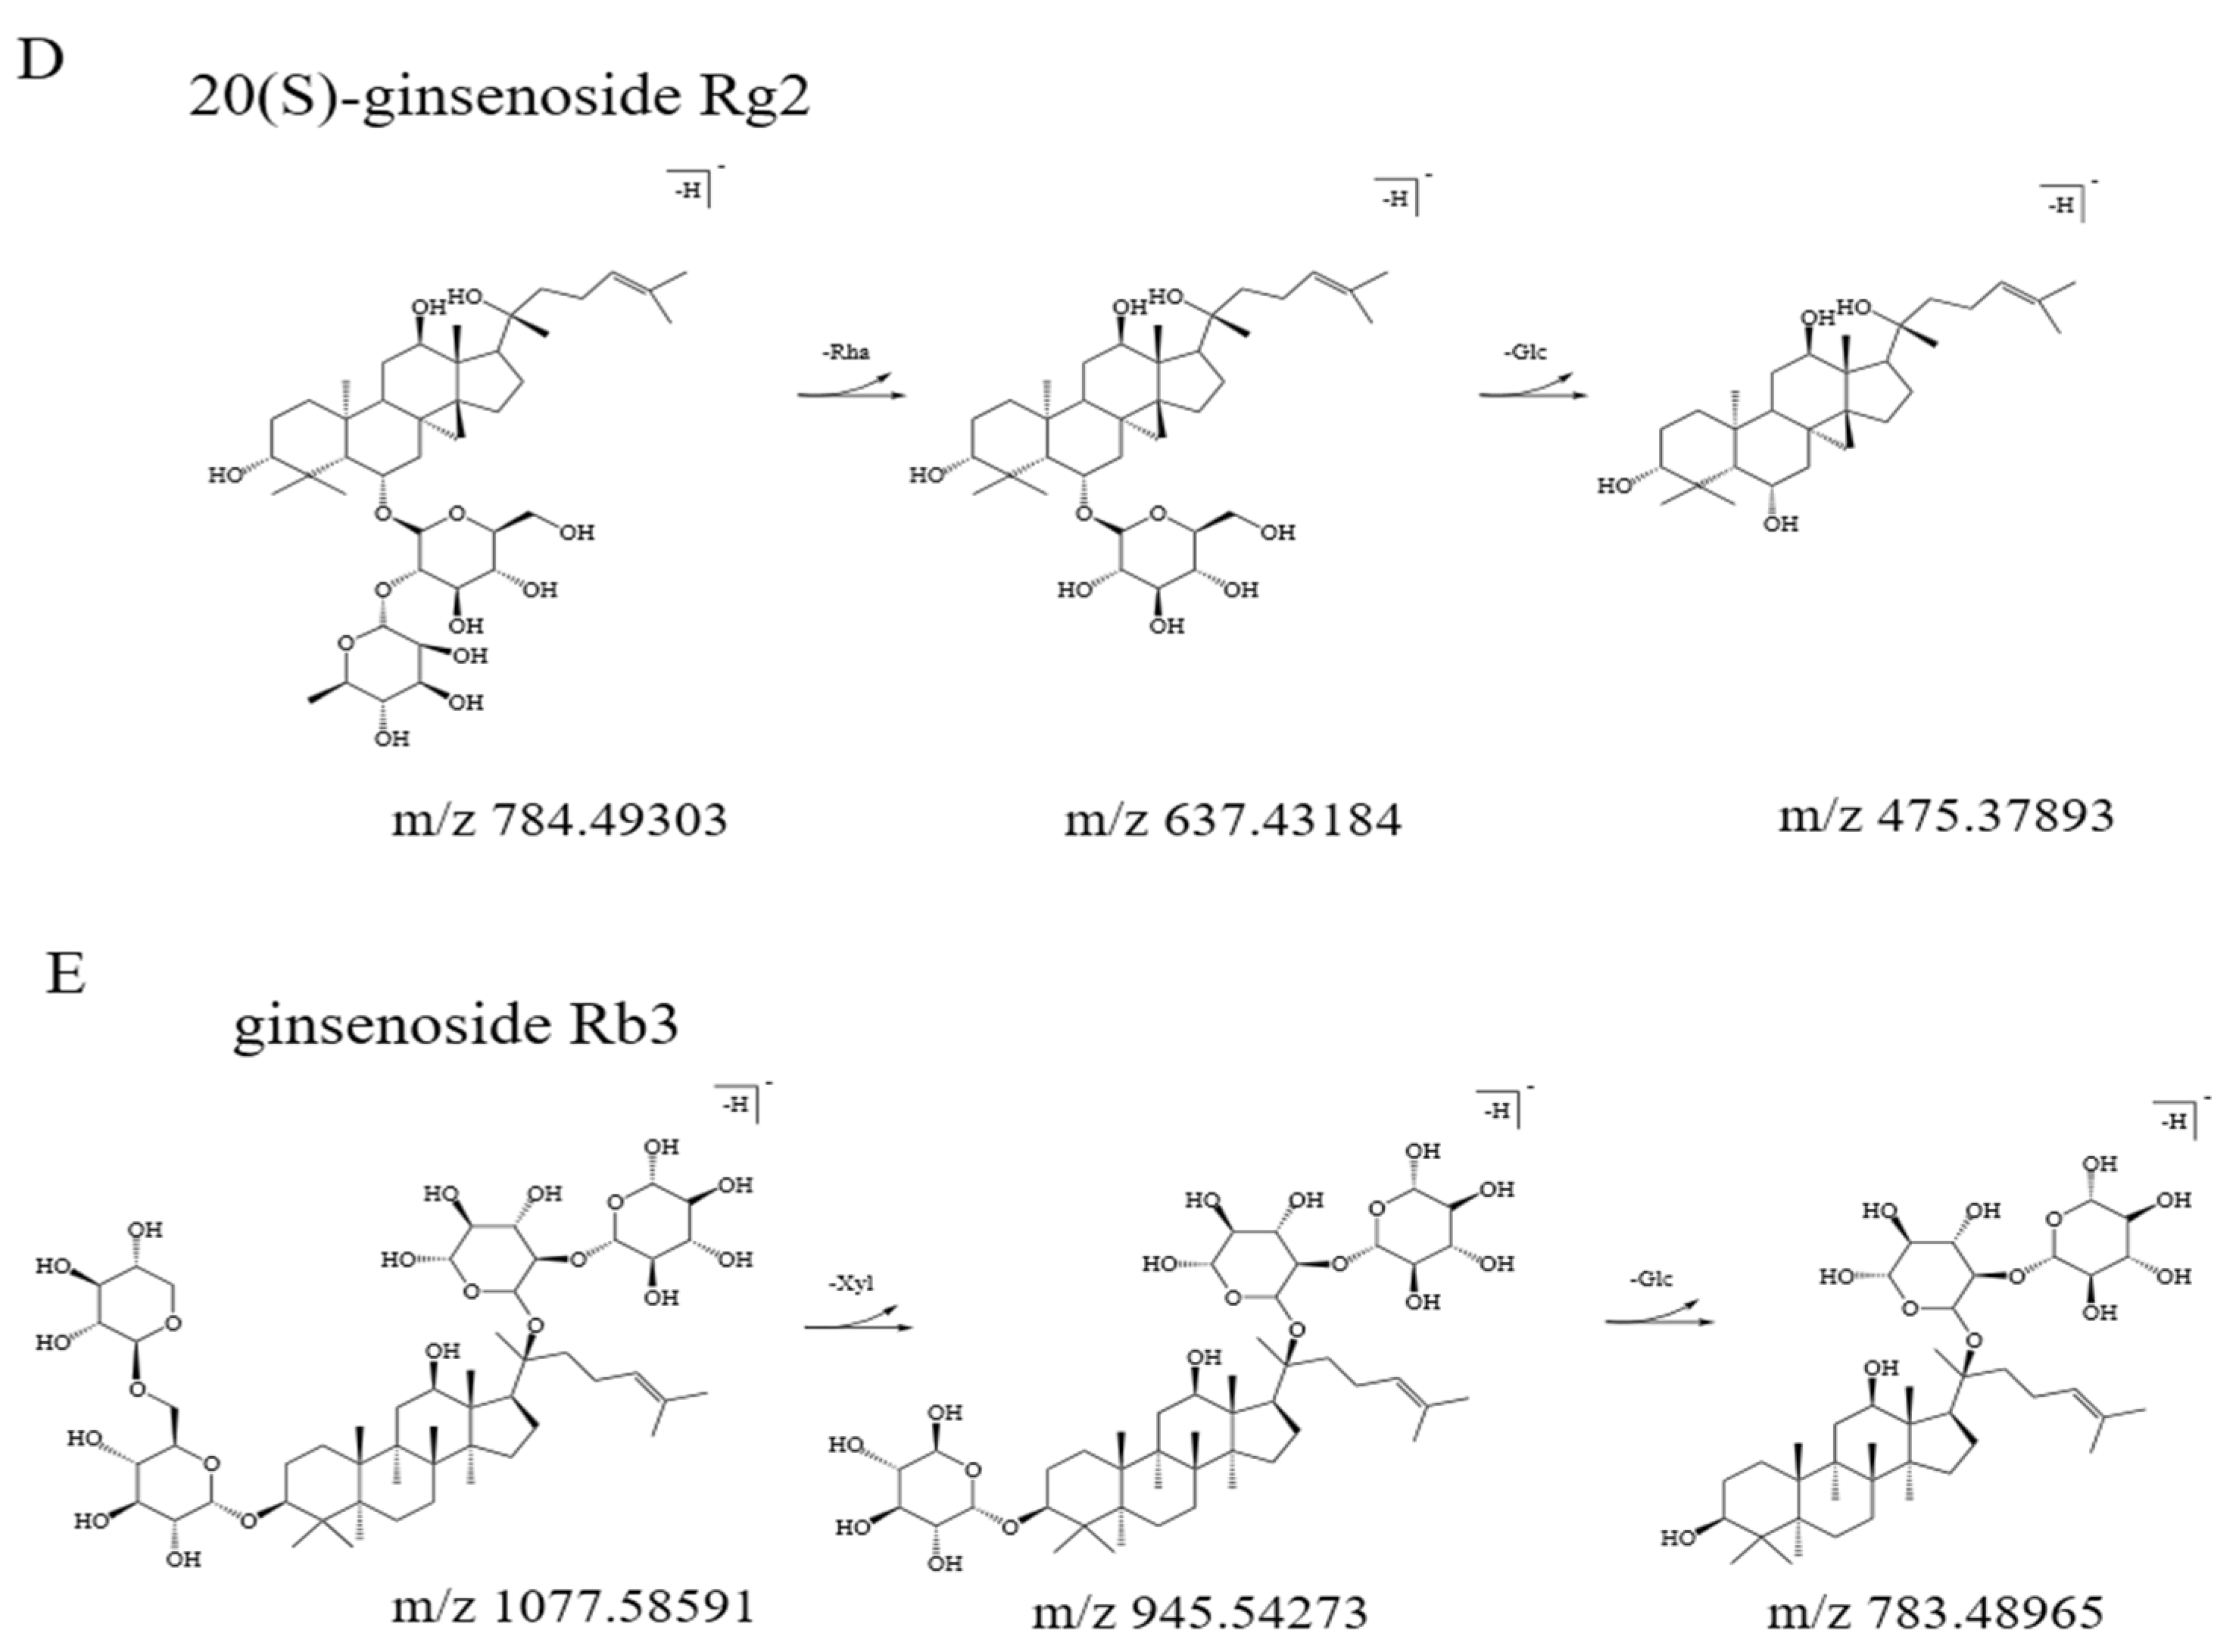
3.2. Qualitative Analysis of Bitter Fractions

The characteristic UV absorption peaks of bitter compounds at 203 nm in the five fractions were detected by HPLC-DAD (Table 2), indicating that all of the bitter compounds were saponin compounds [26]. Saponins were the main active substances in ginseng, which belonged to the secondary metabolites of ginseng cells. This indicated that the bitter substances in ginseng were inherent, rather than generated during the extraction process. The identity of bitter substances in ginseng needs to be further analyzed. UPLC-Q-TOF/MS technology was utilized to analyze the structure of the five components. The precursor ion fragments and major product ions-of each bitter compound are shown in Table 2, respectively. The possible cleavage pathways of bitter compounds in ginseng are shown in Figure 2.
Fraction 2: As shown in Table 2 and Figure 2A, in the negative ion mode of Fraction 2, the [M-H] ion with m/z 799.48575 can be detected. After removing one or two glucose residues (Glc, 162 u), high-abundance ion fragments with m/z 637.43224 ([M-H-Glc]) and m/z 475.37895 ([M-H-2Glc]) were obtained. Therefore, Fraction 2 was identified as the ginsenoside Rg1.
Fraction 5: As shown in Table 2 and Figure 2B, the quasi-molecular ion peak of Fraction 5 was detected at m/z 799.48416 ([M-H]) through UPLC-Q-TOF/MS testing. The high-abundance ion fragment m/z 637.43105 ([M-H-Glc]) was believed to be obtained by the loss of a molecule of glucose residue (Glc, 162 u). When a molecule of glucose residue was lost at m/z 637.43105, the fragment ion ([M-H-2Glc]) was obtained at m/z 475.37831. Based on the above analysis, Fraction 5 was considered as the ginsenoside Rf.
Fraction 7: The mass spectrometry of the m/z 1107.59562 ion showed major product ions with m/z 945.54233 and 553.29492 in Table 2 and Figure 2C. The fragment ion m/z 945.54233 ([M-H-Glc]) was obtained by the loss of a glucose residue (Glc, 162 u) from the excimer ion peak m/z 1107.59562 ([M-H]). It was speculated that the [M-H-3Glc-68u] ion with m/z 553.29492 resulted from the loss of three glucose residues (3Glc, 324 u), followed by the loss of a branch chain (68 u) observed at the position of C-5 after rearrangement. To sum up, Fraction 7 was considered as the ginsenoside Rb1.
Fraction 8: The mass spectrometry of the m/z 784.49303 ion showed major product ions with m/z 637.43184 and 475.37893 in Table 2 and Figure 2D. The [M-H-Rha] ion with m/z 637.43184 resulted from the loss of a rhamnose residue (Rha, 147 u). The [M-H-Rha-Glc] ion with m/z 475.37893 was obtained when the m/z 637.43184 lost a glucose residue (Glc, 162 u). The above results indicated that Fraction 8 was the 20(S)-ginsenoside Rg2.
Fraction 12: According to the negative ion mode of mass spectrometry data in Table 2 and Figure 2E, the quasi-molecular ion peak of Fraction 12 was observed at m/z 1077.58591 ([M-H]), and the ion peak at m/z 945.54273 was a molecular ion peak that lost a xylose residue (Xyl, 132 u). The ion ([M-H-Xyl-Glc]) of m/z 783.48965 was obtained after losing a glucose residue (Glc, 162 u). From this, Fraction 12 was inferred as the ginsenoside Rb3.
To ensure the accuracy of the identification results, standard compounds were subsequently used for revalidation. The standard compounds were analyzed using HPLC-DAD and UPLC-Q-TOF/MS, respectively, under the same HPLC and MS working parameters. The qualitative analysis results showed that the bitter compounds in the ginseng sample had the same retention time and mass spectrometry data as the speculated standard compounds. Therefore, the accuracy of the identification results was further verified.

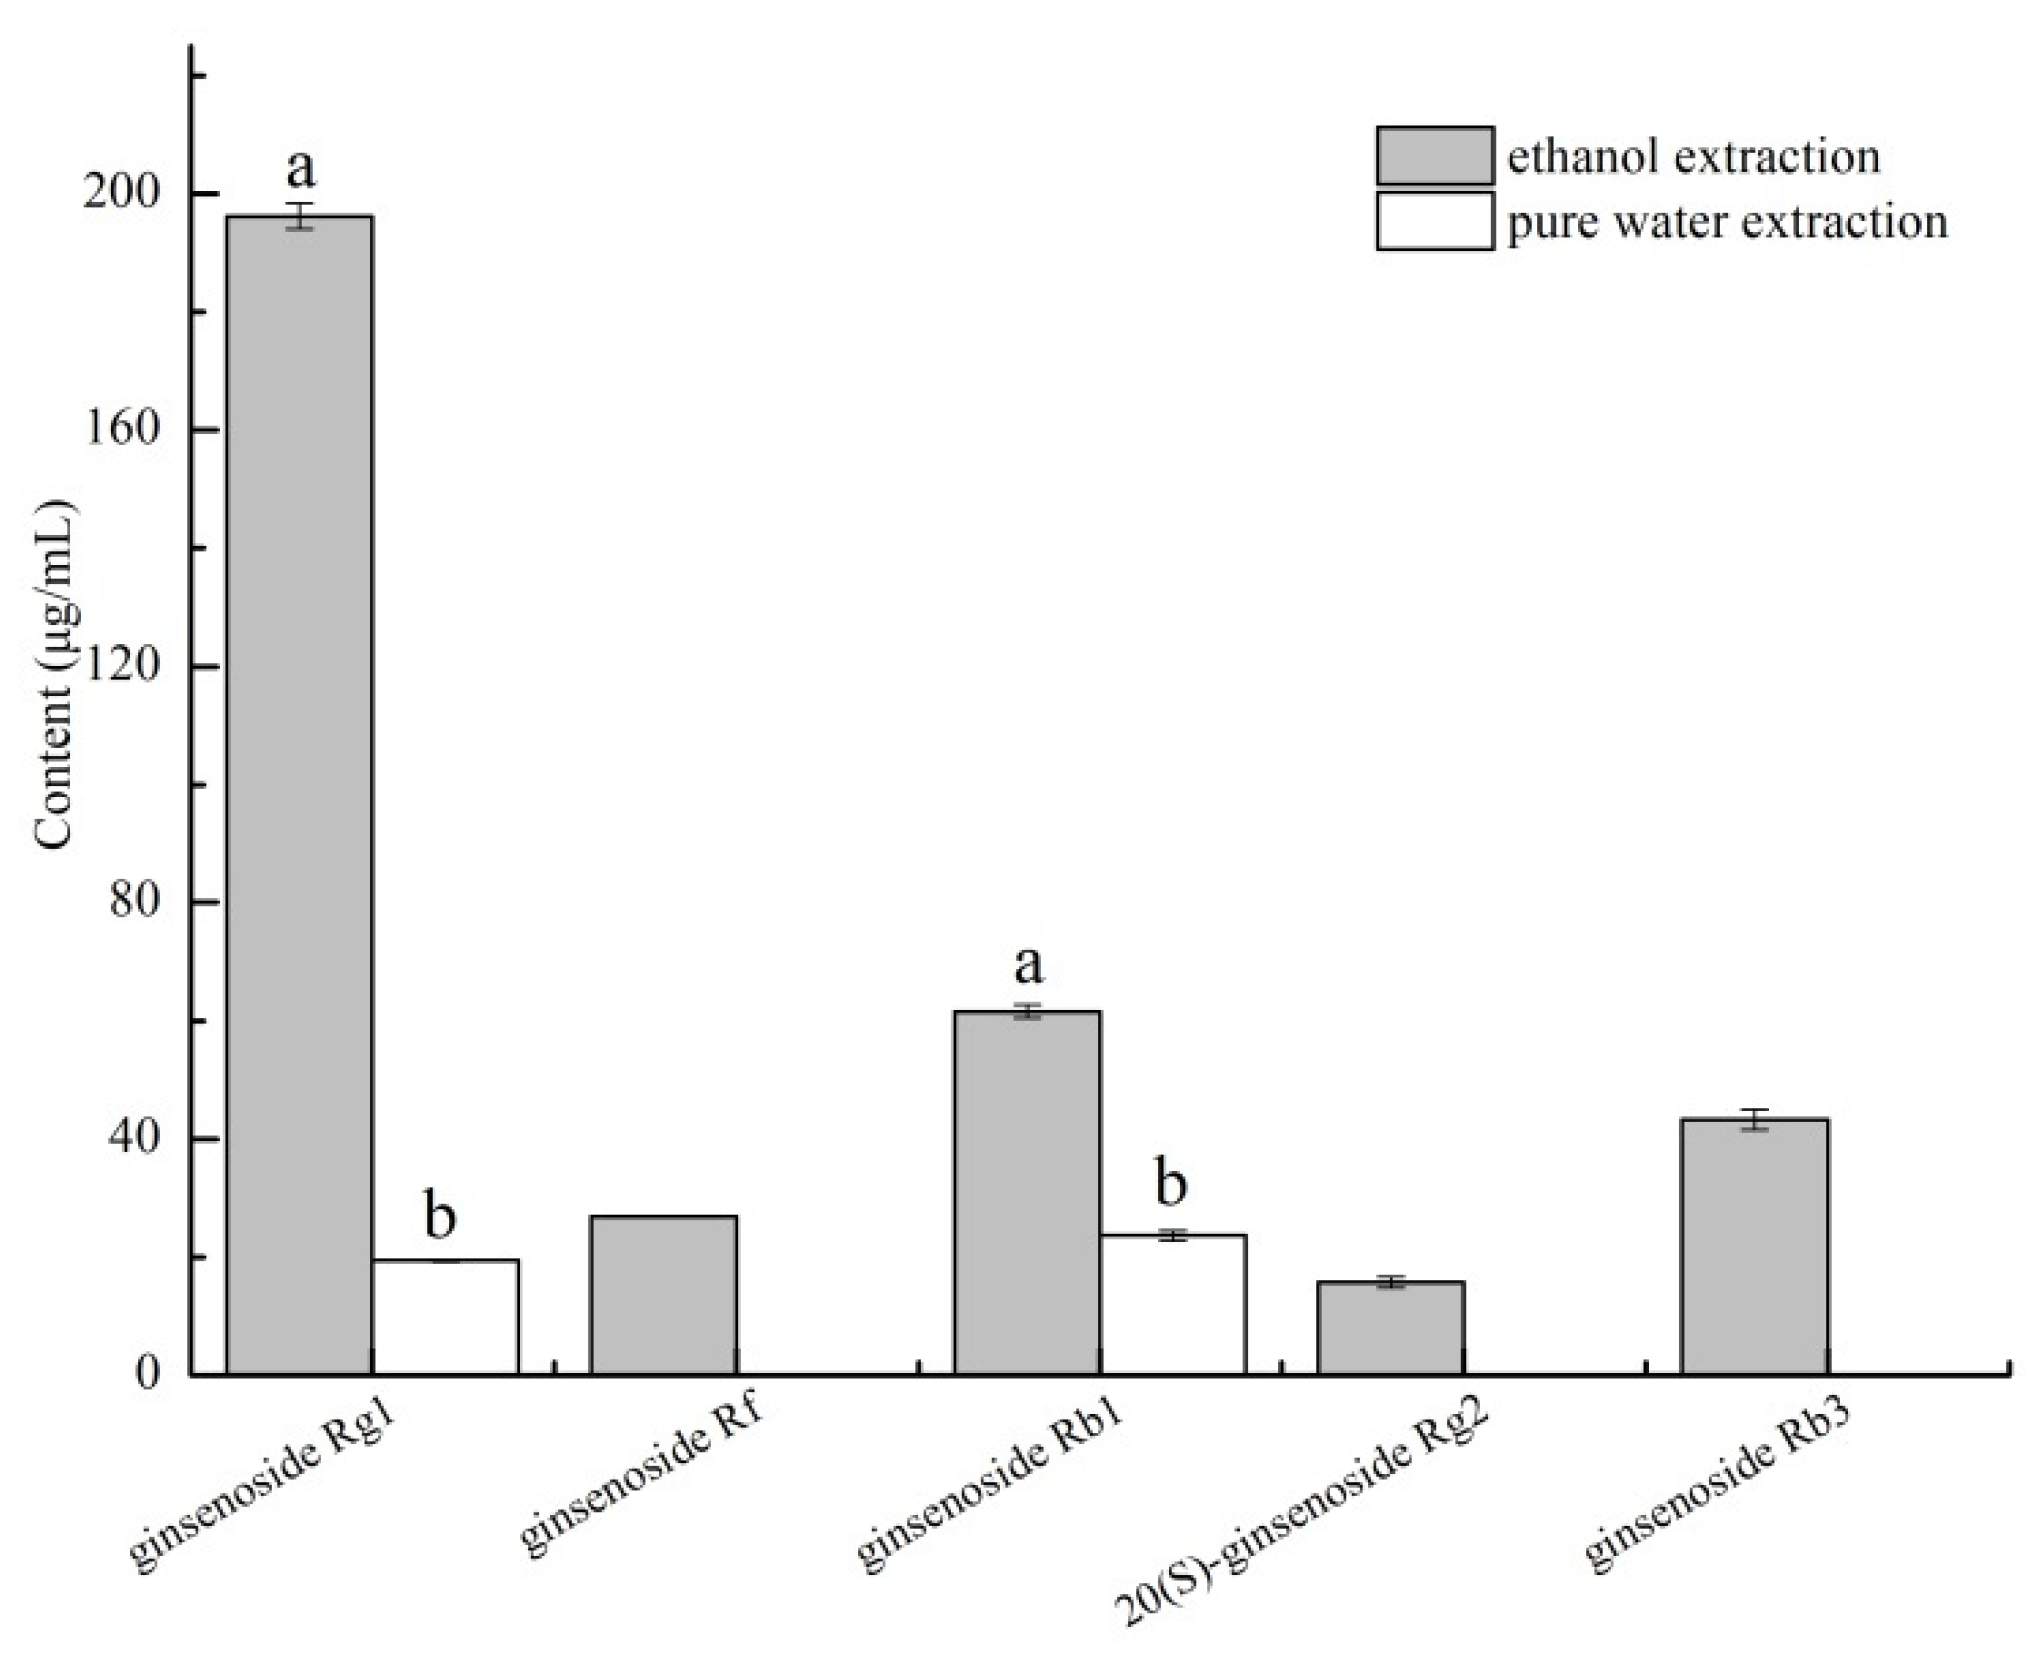
3.3. Quantitation of the Bitter Fractions

The quantitative detection of bitter fractions in ginseng was conducted by using an external standard quantification method (in Table 3). The bitter compounds in the sample (extracted with pure water and ethanol) are shown in Figure 3, respectively. In ethanol-extracted ginseng samples, the levels of the ginsenoside Rg1 were the highest (196.16 ± 2.17 μg/mL). It was clear that the content of the 20(S)-ginsenoside Rg2 were the lowest (15.78 ± 0.92 μg/mL). Interestingly, two bitter compounds were detected in ginseng samples extracted with pure water, where the levels of the ginsenoside Rb1 (23.67 ± 0.17 μg/mL) were higher than that of the ginsenoside Rg1 (19.42 ± 0.15) μg/mL. Compared with ethanol extraction, the level of the ginsenoside Rg1 in ginseng samples extracted with pure water was lower, while the level of the ginsenoside Rb1 was (23.67 ± 0.17) μg/mL. A possible explanation was that the bitter compounds were easily soluble in polar solvents, especially ethanol solutions.

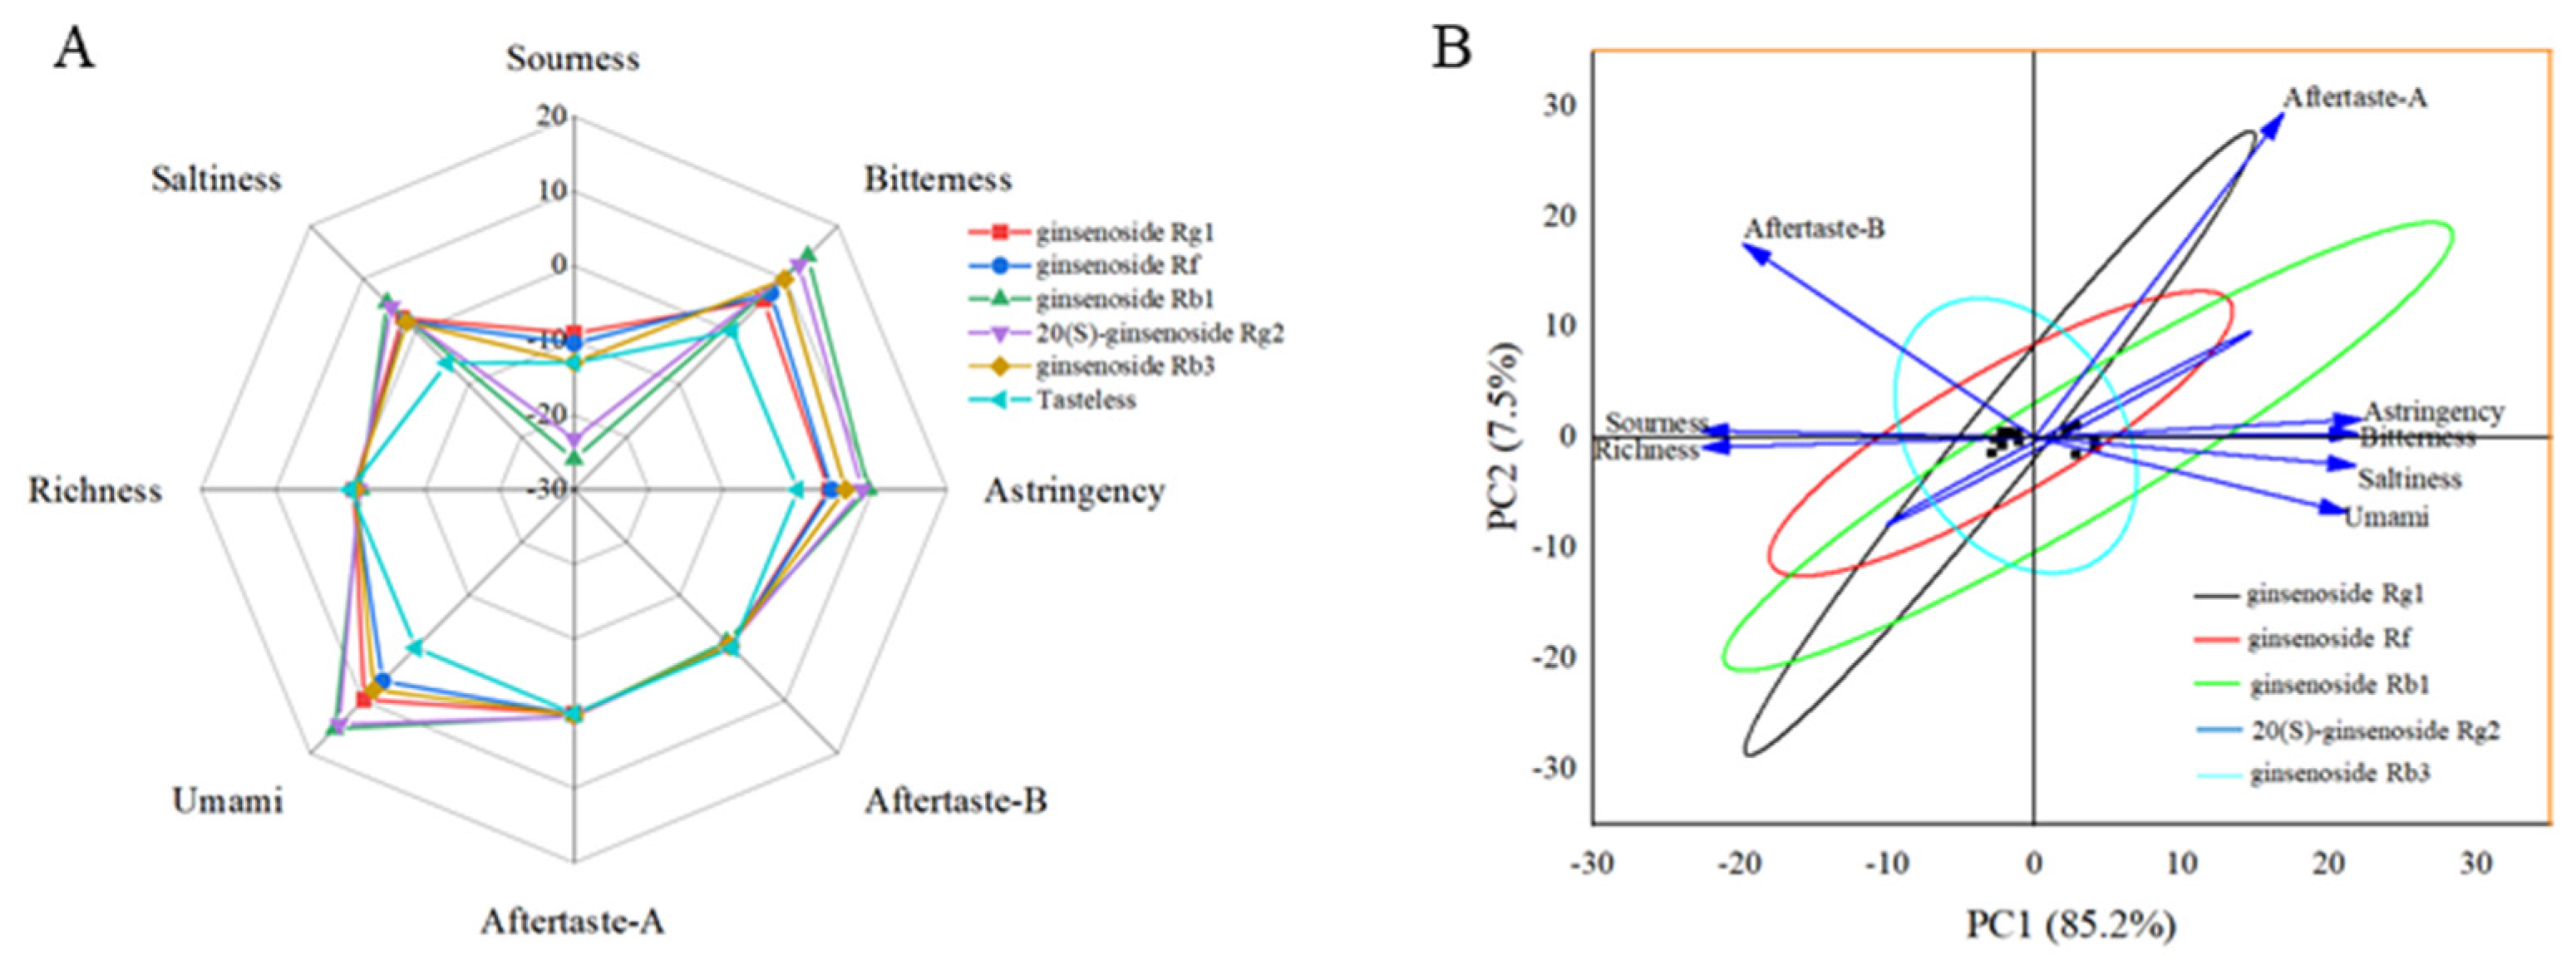
3.4. Bitterness Analysis of Ginsenoside Rg1, Ginsenoside Rf, Ginsenoside Rb1, 20(S)-Ginsenoside Rg2 and Ginsenoside Rb3 by Electronic Tongue

The experimental reference solution was composed of potassium chloride and tartaric acid. Tasteless represented the output of the reference solution (odorless point), which was −13 for a sour taste and −6 for a salty taste. Based on this, when the taste value of the sample was lower than tasteless, it indicated that the sample had no taste, and vice versa. Based on the quantitative results of the five bitter compounds in ginseng samples, the corresponding standard samples of each bitter compound were dissolved in ultra-pure water and diluted to the corresponding concentration. Then, five bitter compounds were detected through an electronic tongue system at this concentration, and the results indicated that the five bitter substances exhibited different bitterness values. The content level of the bitter compounds in ginseng cannot represent their contribution to the total bitterness of ginseng samples. Electronic tongue analysis was an excellent method for comparing their contribution to the bitterness. The bitterness values of the ginsenoside Rg1, ginsenoside Rf, ginsenoside Rb1, 20(S)-ginsenoside Rg2 and ginsenoside Rb3 were 5.91 ± 0.23, 7.26 ± 0.31, 14.29 ± 0.25, 12.63 ± 0.12 and 9.88 ± 0.17, respectively (in Figure 4A). This indicated that among all bitter compounds, the ginsenoside Rb1 had the strongest bitterness, followed by ginsenoside Rb3, 20(S)-ginsenoside Rg2, ginsenoside Rf and ginsenoside Rg1. The astringency values were 4.09 ± 0.17, 4.52 ± 0.15, 9.45 ± 0.13, 8.61 ± 0.11 and 6.38 ± 0.12, respectively. The aftertaste-B values were 0.13 ± 0.08, 0.11 ± 0.11, 0.14 ± 0.01, 0.09 ± 0.02 and 0.08 ± 0.01, respectively, and aftertaste-B was the bitter taste that was perceived after the food or drug had been swallowed or spit out. As shown in Figure 4A, the five ginsenosides also exhibited salty and umami tastes, which could be related to the fresh amino acids or inorganic salts extracted during the extraction process [27,28,29]. Although ginsenosides contain umami and salty tastes, the bitterness was not affected. Thus, the ginsenoside Rg1, ginsenoside Rf, ginsenoside Rb1, 20(S)-ginsenoside Rg2, and ginsenoside Rb3 could be considered as bitter substances in ginseng.
Principal component analysis (PCA) is the most widely used data dimensionality reduction algorithm, which could be used to analyze the main taste indicators detected by the electronic tongue [30]. The PCA score plots indicated the relationship between variables using the variable information based on PC1 and PC2. As shown in Figure 4B, the main taste indicators belonging to PC1 and PC2 had a clear separation trend in spatial layout. The bitterness, astringency, umami and saltiness indicators were distributed on the positive half axis of the X-axis, while sour indicators were distributed on the negative half axis of the X-axis, indicating that the main taste indicators of the five samples were bitterness, astringency, umami and saltiness. The variance contribution rates of PC1 and PC2 were 85.2% and 7.5%, respectively, with a cumulative variance contribution rate of 92.7%, which could effectively reflect the overall taste information of the different bitter taste samples. Additionally, the five samples were distributed in four quadrants, and they were close to each other with overlapping areas, indicating that there was no significant difference in the taste characteristics of the five substances and they all presented typical bitterness.

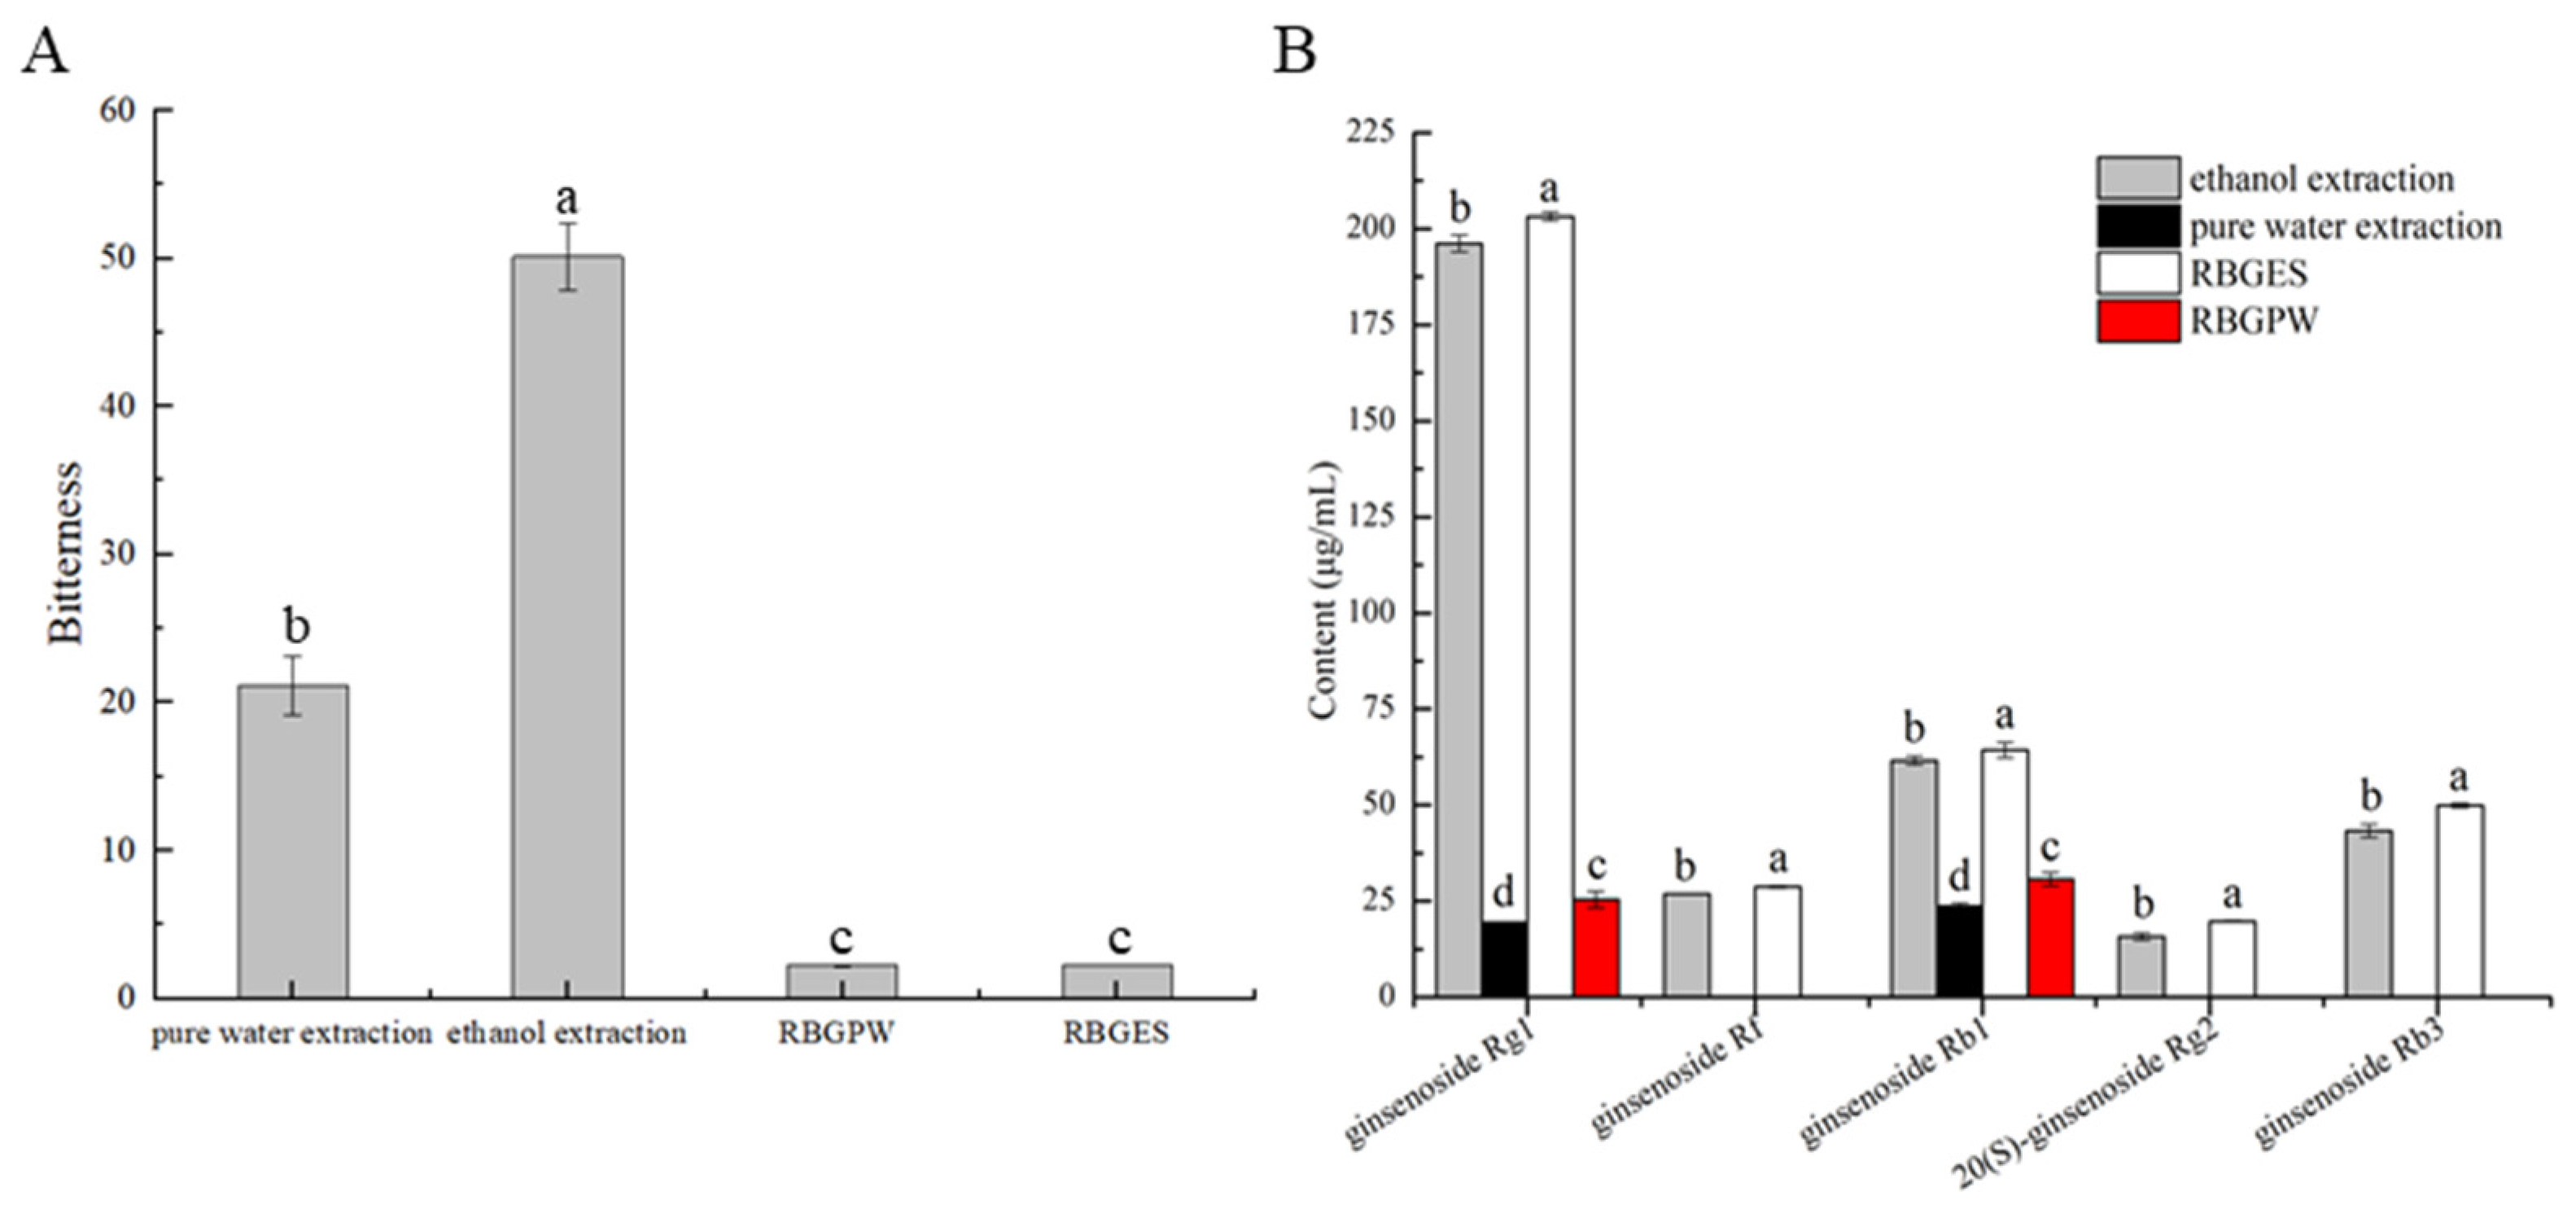
3.5. Analysis of Bitterness Elimination Effect

Thus far, many studies have shown that embedding is an effective way to remove bitterness. For example, in order to improve the sensory quality of a product, the mixture of gelatin and soy protein isolate can be used as a carrier to weaken or mask the bitterness of casein hydrolysate by spray drying [31]. Similarly, studies have shown that a two-phase gel lotion embedding system could significantly reduce the bitterness value of bitter peptides. The principle of this process is to use two edible materials to gradually embed bitter peptides, so as to increase the stability of the product and reduce the bitterness [32]. Embedding is also a commonly used method for removing bitterness in industry. Therefore, we adopt this method to reduce or eliminate the bitterness of ginseng. The bitterness value of four ginseng extracts (pure water extraction, ethanol extraction, removing bitterness from ginseng samples (extracted with pure water) (RBGPW) and removing bitterness from ginseng samples (extracted with ethanol solution) (RBGES)) were determined through an electronic tongue system in order to effectively demonstrate the bitterness removal effect of the embedding process in this experiment. It was worth mentioning that compared with ginseng samples extracted with pure water and ethanol, RBGPW and RBGES had higher concentrations of bitter compounds. Then, UPLC-Q-TOF/MS and HPLC methods were used to analyze and quantify the content of bitter compounds in the four ginseng extracts mentioned above. After embedding treatment, the bitterness value of the ginseng samples (pure water extraction and ethanol extraction) significantly decreased (Figure 5A). For instance, for ginseng samples of pure water extraction, the bitterness value decreased from 21.13 to 2.24, while ethanol-extracted ginseng samples showed a higher degree of reduction. At this point, as shown in Figure 5A,B, in the electronic tongue experiment, the concentration of bitter compounds in the ginseng sample after embedding treatment was higher than that of the ginseng sample without embedding, but the ginseng sample after embedding treatment had a lower bitterness value. This indicated that embedding treatment could significantly reduce the bitterness of ginseng and improve the taste of the product. Interestingly, as shown in Figure 5A, the bitterness values of ginseng samples obtained by the two extraction methods were significantly reduced after embedding, indicating that the effect of embedding on reducing bitterness was not affected by the sample extraction method.

4. Conclusions

In this research, the bitter compounds ginsenoside Rg1, ginsenoside Rf, ginsenoside Rb1, 20(S)-ginsenoside Rg2 and ginsenoside Rb3 in the ginseng samples (after water extraction and ethanol extraction) were characterized, separated and purified by HPLC-DAD, prep-HPLC, subjected to bitterness value determination through using an electronic tongue and identified by UPLC-Q-TOF/MS. The electronic tongue analysis results indicated that all five ginsenosides had a strong bitterness. Additionally, the research results indicated that the bitter substances in ginseng samples are actually produced during their own secondary metabolism process, rather than appearing during the extraction process, as their content was influenced by the extraction method. In addition, electronic tongue analysis indicated that compared with the other four bitter compounds, the ginsenoside Rb1 had the highest bitterness value, followed by 20(S)-ginsenoside Rg2, ginsenoside Rg1, ginsenoside Rf and ginsenoside Rb3. Simultaneously, the bitterness of ginseng samples was significantly reduced through the embedding method, and the effect was not affected by the extraction method. This research achievement is beneficial for improving the taste of ginseng in food and expanding its application pathways.

Author Contributions

Conceptualization, Y.C., Z.L. and J.X.; methodology, Y.C. and Z.W.; validation, Y.C. and W.S.; formal analysis, W.S.; investigation, Z.L.; resources, Z.W. and J.X.; data curation, Y.C.; writing—original draft preparation, Y.C. and J.X.; writing—review and editing, Y.C. and W.S.; visualization, Y.C. and J.X.; supervision, Y.C. and J.X.; project administration, Y.C. and Z.W.; funding acquisition, J.X. and Z.W. All authors have read and agreed to the published version of the manuscript.

Funding

This work was supported by the National Key Research and Development Program of China (2020ACA007-03).

Data Availability Statement

Data are contained within the article.

Acknowledgments

The authors express their gratitude to Kaijin Pan and Hongjun Li from Hubei Key Laboratory of Quality and Safety of Traditional Chinese Medicine Health Food (Jing Brand Co., Ltd.) for investigation and validation of the ginseng samples.

Conflicts of Interest

All authors were employed by the company Jing Brand Co., Ltd. The authors declare that the research was conducted in the absence of any commercial or financial relationships that could be construed as a potential conflict of interest.

References

  1. Wang, Z.; Zhang, Z.; Liu, J.; Guo, M.; Li, H. Panax Ginseng in the treatment of Alzheimer’s disease and vascular dementia. J. Ginseng Res. 2023, 47, 506–514. [Google Scholar] [CrossRef] [PubMed]
  2. Zhang, H.; Abid, S.; Ahn, J.C.; Mathiyalagan, R.; Kim, Y.-J.; Yang, D.-C.; Wang, Y.; Cho, I.-H. Characteristics of Panax ginseng Cultivars in Korea and China. Molecules 2020, 25, 2635. [Google Scholar] [CrossRef] [PubMed]
  3. Cui, L.; Xu, L.; Yu, H.; Feng, Q.; Yan, H.; Shahid, A.; Chen, Q.; Jibo, R.; Gao, X.; Wang, D. An efficient isolation and purification of broad partition coefficient range ginsenosides from roots of Panax quinquefolium L. by linear gradient counter-current chromatography coupled with preparative HPLC. J. Sep. Sci. 2023, 46, 2300046. [Google Scholar] [CrossRef] [PubMed]
  4. Liu, P.; Zhang, Z.; Cai, Y.; Yang, Y.; Yuan, J.; Chen, Q. Inhibition of the pyroptosis-associated inflammasome pathway: The important potential mechanism of ginsenosides in ameliorating diabetes and its complications. Eur. J. Med. Chem. 2023, 253, 115336. [Google Scholar] [CrossRef]
  5. Xie, N.; Wu, C.; Ge, Q.; Zhou, J.; Long, F.; Mao, Q.; Li, S.; Shen, H. Structure-specific antitumor effects and potential gut microbiota-involved mechanisms of ginseng polysaccharides on B16F10 melanoma-bearing mice. Food Funct. 2023, 14, 796–809. [Google Scholar] [CrossRef]
  6. Park, N.J.; Bong, S.K.; Lee, S.; Jung, Y.; Jegal, H.; Kim, J.; Kim, S.K.; Kim, Y.K.; Kim, S.N. Compound K improves skin barrier function by increasing SPINK5 expression. J. Ginseng Res. 2020, 44, 799–807. [Google Scholar] [CrossRef]
  7. Li, K.; Wang, L.; Zhou, R.; Fan, H.; Sui, J. Amelioration of alcohol-induced liver injury in mice by ginsenosides in ginseng wine. J. Funct. Foods. 2019, 54, 281–288. [Google Scholar] [CrossRef]
  8. Cui, S.; Wang, J.; Yang, L.; Wu, J.; Wang, X. Qualitative and quantitative analysis on aroma characteristics of ginseng at different ages using E-nose and GC–MS combined with chemometrics. J. Pharm. Biomed. Anal. 2015, 102, 64–77. [Google Scholar] [CrossRef]
  9. Xu, X.; Sanjeevram, D.; Mi, X.; Hye-Ryung, P.; Yeon-Ju, K. Immune-enhancing efficacy of Curtobacterium proimmune K3 lysates isolated from Panax ginseng beverages in cyclophosphamide-induced immunosuppressed mice. J. Funct. Foods. 2022, 92, 105020. [Google Scholar] [CrossRef]
  10. Hee, S.C.; Soo-Yeun, L. Modification of ginseng flavors by bitter compounds found in chocolate and coffee. J. Food Sci. 2012, 77, S202–S210. [Google Scholar]
  11. Gupta, A.K.; Dhua, S.; Kumar, V.; Naik, B.; Magwaza, L.S.; Ncama, K.; Opara, U.L.; McClements, D.J.; Mishra, P. Current and emerging applications in detection and removal of bitter compounds in citrus fruit juice: A critical review. Food Biosci. 2023, 55, 102995. [Google Scholar] [CrossRef]
  12. Yu, Y.; Zhu, X.; Ouyang, W.; Chen, M.; Jiang, Y.; Wang, J.; Hua, J.; Yuan, H. Effects of electromagnetic roller-hot-air–steam triple-coupled fixation on reducing the bitterness and astringency and improving the flavor quality of green tea. Food Chem. X 2023, 19, 100844. [Google Scholar] [CrossRef]
  13. Karolkowski, A.; Meudec, E.; Bruguière, A.; Offer, A.C.M.; Bouzidi, E.; Levavasseur, L.; Sommerer, N.; Briand, L.; Salles, C. Faba Bean (Vicia faba L. minor) Bitterness: An Untargeted Metabolomic Approach to Highlight the Impact of the Non-Volatile Fraction. Metabolites. 2023, 13, 964. [Google Scholar] [CrossRef] [PubMed]
  14. Deng, S.; Zhang, G.; Oluwaseun, O.A.; Mo, Z.; Mao, J.; Zhang, H.; Liu, X.; Ma, M.; Wang, Q.; Liu, H. Bitter and astringent substances in green tea: Composition, human perception mechanisms, evaluation methods and factors influencing their formation. Food Res. Int. 2022, 157, 111262. [Google Scholar] [CrossRef] [PubMed]
  15. Deng, Y.; Ma, Y.; Liu, H.; Zhang, Y.; Wei, Z.; Liu, G.; Tang, X.; Jia, X. Structure determination, bitterness evaluation and hepatic gluconeogenesis inhibitory activity of triterpenoids from the Momordica charantia fruit. Food Chem. 2022, 372, 131224. [Google Scholar] [CrossRef] [PubMed]
  16. Xu, Y.; Sun, Q.; Chen, W.; Han, Y.; Gao, Y.; Ye, J.; Wang, H.; Gao, L.; Liu, Y.; Yang, Y. The Taste-Masking Mechanism of Chitosan at the Molecular Level on Bitter Drugs of Alkaloids and Flavonoid Glycosides from Traditional Chinese Medicine. Molecules 2022, 27, 7455. [Google Scholar] [CrossRef] [PubMed]
  17. Drewnowski, A. The science and complexity of bitter taste. Nutr. Rev. 2001, 59, 163–169. [Google Scholar] [CrossRef] [PubMed]
  18. Lee, J.; Choi, B.-R.; Kim, Y.-C.; Choi, D.; Lee, Y.-S.; Kim, G.-S.; Baek, N.-I.; Kim, S.-Y.; Lee, D. Comprehensive Profiling and Quantification of Ginsenosides in the Root, Stem, Leaf, and Berry of Panax ginseng by UPLC-QTOF/MS. Molecules 2017, 22, 2147. [Google Scholar] [CrossRef] [PubMed]
  19. Li, J.; Wang, H.; Xu, X.; Wang, H.; Li, X.; Hu, Y.; Chen, B.; Liu, M.; Gao, X.; LI, H.; et al. An off-line three-dimensional liquid chromatography/Q-Orbitrap mass spectrometry approach enabling the discovery of 1561 potentially unknown ginsenosides from the flower buds of Panax ginseng, Panax quinquefolius and Panax notoginseng. J. Chromatogr. A 2022, 1675, 463177. [Google Scholar]
  20. Cong, L.; Ma, J.; Zhang, Y.; Zhou, Y.; Cong, X.; Hao, M. Effect of anti-skin disorders of ginsenosides—A Systematic Review. J. Ginseng Res. 2023, 47, 605–614. [Google Scholar] [CrossRef]
  21. Li, X.; Cao, D.; Sun, S.; Wang, Y. Anticancer therapeutic effect of ginsenosides through mediating reactive oxygen species. Front. Pharmacol. 2023, 14, 1215020. [Google Scholar] [CrossRef] [PubMed]
  22. Wang, A.; Liang, X.; Chen, W.; Liu, Y.; Zhu, Y.; Zhang, D.; Hu, L.; Li, R. Total ginsenosides promotes intestinal epithelial proliferation via affecting polyamine-mediated HuR on post-transcriptional control. Food Biosci. 2023, 55, 102970. [Google Scholar] [CrossRef]
  23. Zhang, J.; Zhu, C.; Jin, Y.; Shen, W.; Pan, Y.; Shen, Y. Ginsenoside Rg1 improved learning and memory ability and reduces neuronal apoptosis in epileptic rats through ERK/CREB/BDNF signal pathway. Biochem. Biophys. Res. Commun. 2023, 675, 26–32. [Google Scholar] [CrossRef] [PubMed]
  24. Zhao, W.; He, J.; Yu, Z.; Wu, S.; Li, J.; Liu, J.; Liao, X. In silico identification of novel small molecule umami peptide from ovotransferrin. Int. J. Food Sci Tech. 2022, 57, 2628–2635. [Google Scholar] [CrossRef]
  25. Sora, H.; Tatsuro, H.; Miho, K.; Kenlchi, K.; Hideyuki, O.; Satoru, T.; Satoshi, S.; Hideyuki, Y.; Kaoru, S.; Takayuki, M. Comparison of taste characteristics between koji mold-ripened cheese and Camembert cheese using an electronic tongue system. J. Dairy Sci. 2023, 106, 6701–6709. [Google Scholar]
  26. Hsu, B.-Y.; Jen, C.-T.; Inbaraj, B.S.; Chen, B.-H. A comparative study on analysis of ginsenosides in American ginseng root residue by HPLC-DAD-ESI-MS and UPLC-HRMS-MS/MS. Molecules 2022, 27, 3071. [Google Scholar] [CrossRef] [PubMed]
  27. Zhu, L.; Xu, L.; Huang, Y.; Xie, C.; Dou, D.; Xu, J. Correlations between ecological factors and the chemical compositions of mountainous forest cultivated ginseng. J. Food Compos. Anal. 2022, 114, 104867. [Google Scholar] [CrossRef]
  28. Zhang, Z.; Chen, W.; Tao, L.; Wei, X.; Gao, L.; Gao, Y.; Suo, J.; Yu, W.; Hu, Y.; Yang, B. Ethylene treatment promotes umami taste-active amino acids accumulation of Torreya grandis nuts post-harvest by comparative chemical and transcript analyses. Food Chem. 2023, 408, 135214. [Google Scholar] [CrossRef] [PubMed]
  29. Iiyama, S.; Ezaki, S.; Toko, K. Analysis of saltiness and bitterness of inorganic salts using taste sensors. Sens. Mater. 2001, 13, 137–144. [Google Scholar]
  30. Fraga, C.G.; Clowers, B.H.; Moore, R.J.; Zink, E.M. Signature-discovery approach for sample matching of a nerve-agent precursor using liquid chromatography−mass spectrometry, XCMS, and chemometrics. Anal. Chem. 2010, 82, 4165–4173. [Google Scholar] [CrossRef]
  31. Fávaro-Trindade, C.S.; Santana, A.d.S.; Monterrey-Quintero, E.S.; Trindade, M.A.; Netto, F.M. The use of spray drying technology to reduce bitter taste of casein hydrolysate. Food Hydrocolloids 2010, 24, 336–340. [Google Scholar] [CrossRef]
  32. Gao, Y.; Li, X.; Xie, Y.; Huang, X.; Cheng, C.; McClements, D.J.; Zhang, L.; Chen, X.; Zou, L.; Wei, L. Encapsulation of bitter peptides in diphasic gel double emulsions: Bitterness masking, sustained release and digestion stability. Food Res. Int. 2022, 162, 112205. [Google Scholar] [CrossRef] [PubMed]
Figure 1. (A) Prep-HPLC chromatogram of ginseng extracted with ethanol solution; (B) prep-HPLC chromatogram of ginseng extracted with pure water; *: fraction with a bitter taste.
Separations 11 00114 g001
Figure 2. The possible cleavage pathways of bitter compounds in ginseng.
Separations 11 00114 g002aSeparations 11 00114 g002b
Figure 3. The content of bitter compounds in ginseng (pure water extraction and ethanol extraction). (The letters a and b above the peak indicate significant differences between different extraction methods (p < 0.05)).
Separations 11 00114 g003
Figure 4. (A) Electronic tongue taste properties of five samples; (B) the biplot of PCA for the electronic tongue.
Separations 11 00114 g004
Figure 5. (A) The bitterness value of four kinds of ginseng samples; (B) the concentration of bitter compounds in four kinds of ginseng samples; RBGPW: removing bitterness from ginseng samples (extracted with pure water); RBGES: removing bitterness from ginseng samples (extracted with ethanol solution). The different lowercase letters (a, b, c and d) represent significant differences between different extraction and deodorization methods (p < 0.05).
Separations 11 00114 g005
Table 1. Recognition of bitterness fractions in ginseng samples a through an electronic tongue system.
TastelessCode bBitternessCode cBitterness
01−0.21 ± 0.02
021.62 ± 0.0321.60 ± 0.03
03−0.27 ± 0.013−0.26 ± 0.02
04−0.31 ± 0.03
0513.72 ± 0.37
06−0.34 ± 0.04
0711.21 ± 0.32711.24 ± 0.21
086.69 ± 0.51
09−0.32 ± 0.02
010−0.36 ± 0.0310−0.38 ± 0.04
011−0.33 ± 0.0411−0.35 ± 0.04
0127.21 ± 0.45
013−0.41 ± 0.0313−0.39 ± 0.04
014−0.29 ± 0.04
015−0.31 ± 0.02
016−0.36 ± 0.04
017−0.35 ± 0.02
018−0.29 ± 0.02
019−0.34 ± 0.03
a: the bitter taste samples of ginseng were obtained through pure water extraction and ethanol extraction, respectively; b: a total of 19 fractions from the ethanol-extracted ginseng samples were detected through an electronic tongue system; c: a total of 6 fractions from the pure-water-extracted samples were detected through an electronic tongue system.
Table 2. Identification of bitterness fractions in ginseng samples a.
Code bRT (min) cTMUAW (nm) d[M-H]Major Product IonsIdentification
215.83202.31799.48575637.43224; 475.37895ginsenoside Rg1
518.93203.79; 234.68799.48416637.43105; 475.37831ginsenoside Rf
720.01201.76; 276.931107.59562945.54233; 553.29492ginsenoside Rb1
819.79205.53; 263.95; 385.40784.49303637.43184; 475.3789320(S)-ginsenoside Rg2
1221.03198.10; 275.71; 365.451077.58591945.54273; 783.48965ginsenoside Rb3
a: the bitter taste samples of ginseng were obtained through pure water extraction and ethanol extraction, respectively; b: corresponding to the serial numbers of bitter substances in Figure 1A,B; c: retention time; d: the maximum ultraviolet absorption wavelengths.
Table 3. Parameters of analytical methods of bitter compounds a.
Bitter CompoundLinear Regression EquationR2Linearity Range (mg/L)LOD (μg/mL)LOQ (μg/mL)
ginsenoside Rg1Y = 0.0525X − 0.12641.0006.72~537.571.07233.4532
ginsenoside RfY = 0.0516X + 0.01051.0005.39~431.540.45651.6671
ginsenoside Rb1Y = 0.0374X + 0.00891.0007.32~585.611.09313.2864
20(S)-ginsenoside Rg2Y = 0.0544X + 0.40950.9994.20~671.520.35041.0857
ginsenoside Rb3Y = 0.0370X − 0.00511.00012.97~518.792.78417.9123
a: the bitter taste samples of ginseng were obtained through pure water extraction and ethanol extraction, respectively.
Disclaimer/Publisher’s Note: The statements, opinions and data contained in all publications are solely those of the individual author(s) and contributor(s) and not of MDPI and/or the editor(s). MDPI and/or the editor(s) disclaim responsibility for any injury to people or property resulting from any ideas, methods, instructions or products referred to in the content.

