Article

Optimizing Operational Parameters for Lithium Hydroxide Production via Bipolar Membrane Electrodialysis

1
School of Materials Science and Chemical Engineering, Ningbo University, Ningbo 315211, China
2
Ningbo Institute of Materials Technology and Engineering, Chinese Academy of Sciences, Ningbo 315201, China
3
College of New Energy, Ningbo University of Technology, Ningbo 315336, China
4
Lithium Resources and Lithium Materials Key Laboratory of Sichuan Province, Tianqi Lithium Corporation, Chengdu 610200, China
*
Author to whom correspondence should be addressed.
Separations 2024, 11(5), 146; https://doi.org/10.3390/separations11050146
Submission received: 18 April 2024 / Revised: 4 May 2024 / Accepted: 6 May 2024 / Published: 9 May 2024
(This article belongs to the Section Purification Technology)

Abstract

:
Traditional lithium hydroxide production techniques, like lithium sulfate and lithium carbonate causticizing methods, suffer from drawbacks including high specific energy consumption, time-consuming processes, and low recovery rates. The conversion of lithium chloride to lithium hydroxide using bipolar membrane electrodialysis is straightforward; however, the influence of operational parameters on bipolar membrane electrodialysis performance have not been investigated. Herein, the impact of the current density (20 mA/cm2~80 mA/cm2), feed concentration (0.5 M~2.5 M), initial feed pH (2.5, 3.5 and 4.5), and the volume ratio of the feed and base solution (1:1, 2:1 and 3:1) on the current efficiency and specific energy consumption in the bipolar membrane electrodialysis was systematically investigated. The bipolar membrane electrodialysis process showed promising results under optimal conditions with a current density of 50 mA/cm2 and an initial lithium chloride concentration of 1.5 M. This process achieved a current efficiency of 75.86% with a specific energy consumption of 3.65 kwh/kg lithium hydroxide while also demonstrating a lithium hydroxide recovery rate exceeding 90% with a purity of about 95%. This work will provide valuable guidance for hands on implementation of bipolar membrane electrodialysis technology in the production of LiOH.

1. Introduction

Ternary lithium-ion batteries have been developing rapidly because of their high energy density, portability, and environmental security [1,2,3,4]. The demand for lithium hydroxide (LiOH), as an important raw material for the production of ternary lithium-ion battery cathodes, is also growing rapidly [5,6]. Lithium hydroxide is often produced through the causticizing of lithium sulfate and lithium carbonate [7,8]. The lithium sulfate process produces sodium sulfate as a by-product, which necessitates the separation of sodium sulfate decahydrate [9,10] under cryogenic freezing conditions, thus making the method more energy-intensive. Additionally, an excess of sodium hydroxide can have a detrimental impact on the quality of the lithium hydroxide. Also, the low solubility of the lithium carbonate leads to a low lithium hydroxide recovery rate and environmentally harmful calcium carbonate waste [11]. Therefore, there is an urgent need for a new technological route to produce lithium hydroxide.
The ion exchange membrane is a type of membrane-like ion exchange resin [12,13], which can be categorized into a cation exchange membrane, anion exchange membrane, and special ion exchange membrane. Its main characteristic is the selective permeation of specific ions, and the underlying principle can be explained by theories such as Donnan equilibrium [14,15,16,17]. The bipolar membrane is a special ion exchange membrane with a sandwich-like structure, and it can dissociate water at low potentials. Bipolar membrane electrodialysis (BMED), which combines conventional electrodialysis technology and bipolar membranes [18,19,20,21], is an electrochemical method developed by utilizing the features of ion exchange membranes and the hydrolysis dissociation characteristics of bipolar membranes to achieve the separation and purification of salt solutions, and to generate the corresponding acids and bases. In recent years, with advances in membrane materials, there has been growing interest in utilizing BMED technology for producing lithium hydroxide [22,23,24,25,26]. The preparation of LiOH via BMED offers outstanding advantages over other technologies: it eliminates the need for additional reagents, prevents the generation of by-products, simplifies the process, and promotes environmental friendliness, with a specific energy consumption of only about 7 kwh/kg LiOH and a cost of about 2.941 USD/kg LiOH [16,27,28]. Jiang et al. [11,29] demonstrated the production of LiOH by treating lithium carbonate in brine from a salt lake using BMED. However, since lithium carbonate can only dissolve 0.13 g/mL of water at room temperature, resulting in a lithium hydroxide concentration of less than 0.1 M, optimizing the BMED process parameters becomes necessary. Additionally, the BMED process generates significant amounts of flammable hydrogen gas, leading to high specific energy consumption. Replacing lithium carbonate with lithium chloride as the feed component for lithium hydroxide production may offer a solution. Qiu et al. [30] observed that CIMS/ACS-type monovalent anion and cation exchange membranes exhibit superior separation performance for calcium and magnesium ions in a 0.3 M lithium chloride solution, resulting in higher purity lithium hydroxide products at specific current densities. However, the impact of a lithium chloride solution concentration on BMED performance was not separately investigated, and ion leakage due to homonymous ion migration was ignored. Therefore, there is an urgent need to lower the specific energy consumption and optimize operational parameters for lithium hydroxide production via BMED.
Herein, we adopted a better BMED system for lithium hydroxide production (Figure 1), featuring a repeating unit sequence of a bipolar membrane (BPM), anion exchange membrane (AEM), and cation exchange membrane (CEM). The BPM closest to the anode or cathode prevented the electrode reaction of ions, which could reduce specific energy consumption. We chose lithium chloride, with a higher solubility than lithium carbonate from brine, as the feed materials for producing a highly concentrated lithium hydroxide solution. The influences of the current density, feed solution concentration, pH, and feed-to-product volume ratio on the BMED performance, and the variation of the current efficiency and specific energy consumption across different factors were investigated and optimized. Loss of resources and reduced product purity due to homonymous ions migration were monitored and analyzed to reveal material transformation and transfer characteristics during the electrolysis process. This work could lay the foundation for pilot experiments and technological transformation.

2. Experimental

2.1. Materials

Lithium chloride and sodium hydroxide were of analytical grade and were supplied by Shanghai Aladdin Biochemical Technology Co., Ltd, Shanghai, China. The cation exchange membrane CT-4, anion exchange membrane ATD, and the bipolar membrane BP-2 were bought from Hangzhou Lanran Technology Co., Ltd, Hangzhou, China. The lifetime of these purchased membranes is 2–3 years. Table 1 shows the operating parameters of the membranes supplied by the supplier.

2.2. Measurements of BMED System

The BMED system was composed of ten sets, each consisting of the BPM, AEM, and CEM. Two membranes in each set were separated by a special partition. The dimension of every membrane was 75 × 195 mm and the actual size of the membrane was 55 cm2. The electrode plate was made of nickel, and see Figure 1 for the specific configuration. The membrane stack was composed of ten feed, acid, and base chambers, along with two electrode chambers. The setup included four built-in circulating pumps, with three maintaining a flow rate of 1.2–2.0 L/min to circulate solutions in each compartment, forming four circulating circuits. Glass coils (70 × 180 mm) in the feed chamber connected to the cryostat tank for cooling. During experiments, circulating cooling water was applied, maintaining the electrodialysis system at a controlled temperature of 25 ± 2 °C to prevent excessive heating.
The electrolysis experiment was conducted in batch process. Initially, membrane stacks were installed correctly. Then, 800 mL of feed solution (deionization of water) was filled into the feed cup, acid and base cup, and electrode cup. The outlet tube from each tank was placed into the corresponding tanks. Next, the low-temperature constant temperature cooling water circulating pump and the circulating pumps for each compartment were activated for 20 min to remove air bubbles. After this preparation, the power was turned on. During the experiment, measurements for voltage, current, conductivity, water temperature, and tank level were taken every 10 min from the unit’s display panel, along with a 2 mL sample extracted from the acid–base chamber for further analysis.
For the electrodialysis experiments, 1 M lithium chloride solution (pH = 3.5) was added to the feed tank to explore the impact of current density (from 20 to 80 mA/cm2) on ion migration rate, current efficiency, specific energy consumption, and so on during the BMED experiments. After obtaining the optimized current density of 50 mA/cm2, the experiments were carried out with varying initial lithium chloride concentration (0.5~2.5 M) in the same pH environment to analyze the capability of BMED. The effects on current efficiency, specific energy consumption, and so on were analyzed. Finally, to determine the effect of initial feed pH on the capability of BMED, the solution was adjusted to different values (2.5, 3.5 and 4.5) using hydrochloric acid under the optimized conditions of 50 mA/cm2 and 1.5 M.

2.3. Analyses and Calculations

The HCl concentration in acid room and LiOH concentration in base room were measured by acid–base titration, employing NaOH and HCl at 0.1 M standard solution, respectively. Phenolphthalein and methyl red-bromocresol green served as indicators for each titration. The lithium-ion content was determined using inductively coupled plasma emission spectroscopy (ICP-OES). The equation for calculating the concentration of LiOH or HCl is provided below [31]:
c t   = c c · v c v t
where ct (mol/L) represents the concentration of hydrochloric acid or lithium hydroxide at t (min); cc (mL) is the concentration of the standard titration solution, mol/L; vc denotes the used volume of the standard titration solution; and vt (mL) is the volume of HCl or LiOH samples at a certain time.
Specific energy consumption for the production of LiOH during the experiment has been computed according to the given equation [32]:
E = 0 t UIdt ( c t v t c 0 v 0 ) M
where E (kwh/kg) is the specific energy consumption of the experimental process; U (V) is the given voltage; I (A) is the current through the membranes; c0 (mol/L) is the initial concentration of the LiOH sample in the base chamber; v0 (L) is the initial volume of the LiOH sample solution in the base chamber; and the molar mass of LiOH is M = 24 g/mol.
The current efficiency for LiOH production in the experimental procedure was calculated using the equation as follows [33]:
η = z ( c t v t c 0 v 0 ) F N Idt
where η is the current efficiency of the experimental procedure; z represents the valence (z = 1 for LiOH); F means Faraday’s constant (F = 96500 C/mol); and N represents the number of groups in the membrane stack (N = 10).
The recovery rate of LiOH was obtained by the following equation (4):
R = c t v t c i v i
where ci (mol/L) is the initial LiCl concentration; vi (L) is the initial lithium chloride solution volume.
The migration rate of Li+ is calculated using the following equation [28]:
M r   = c t v t c 0 v 0 A × t × 60
where Mr (mmol/(m2·s)) is the ion migration rate; A indicates the actual working area of each membrane (A = 0.0055 m2).

3. Results and Discussion

3.1. Effect of Current Density

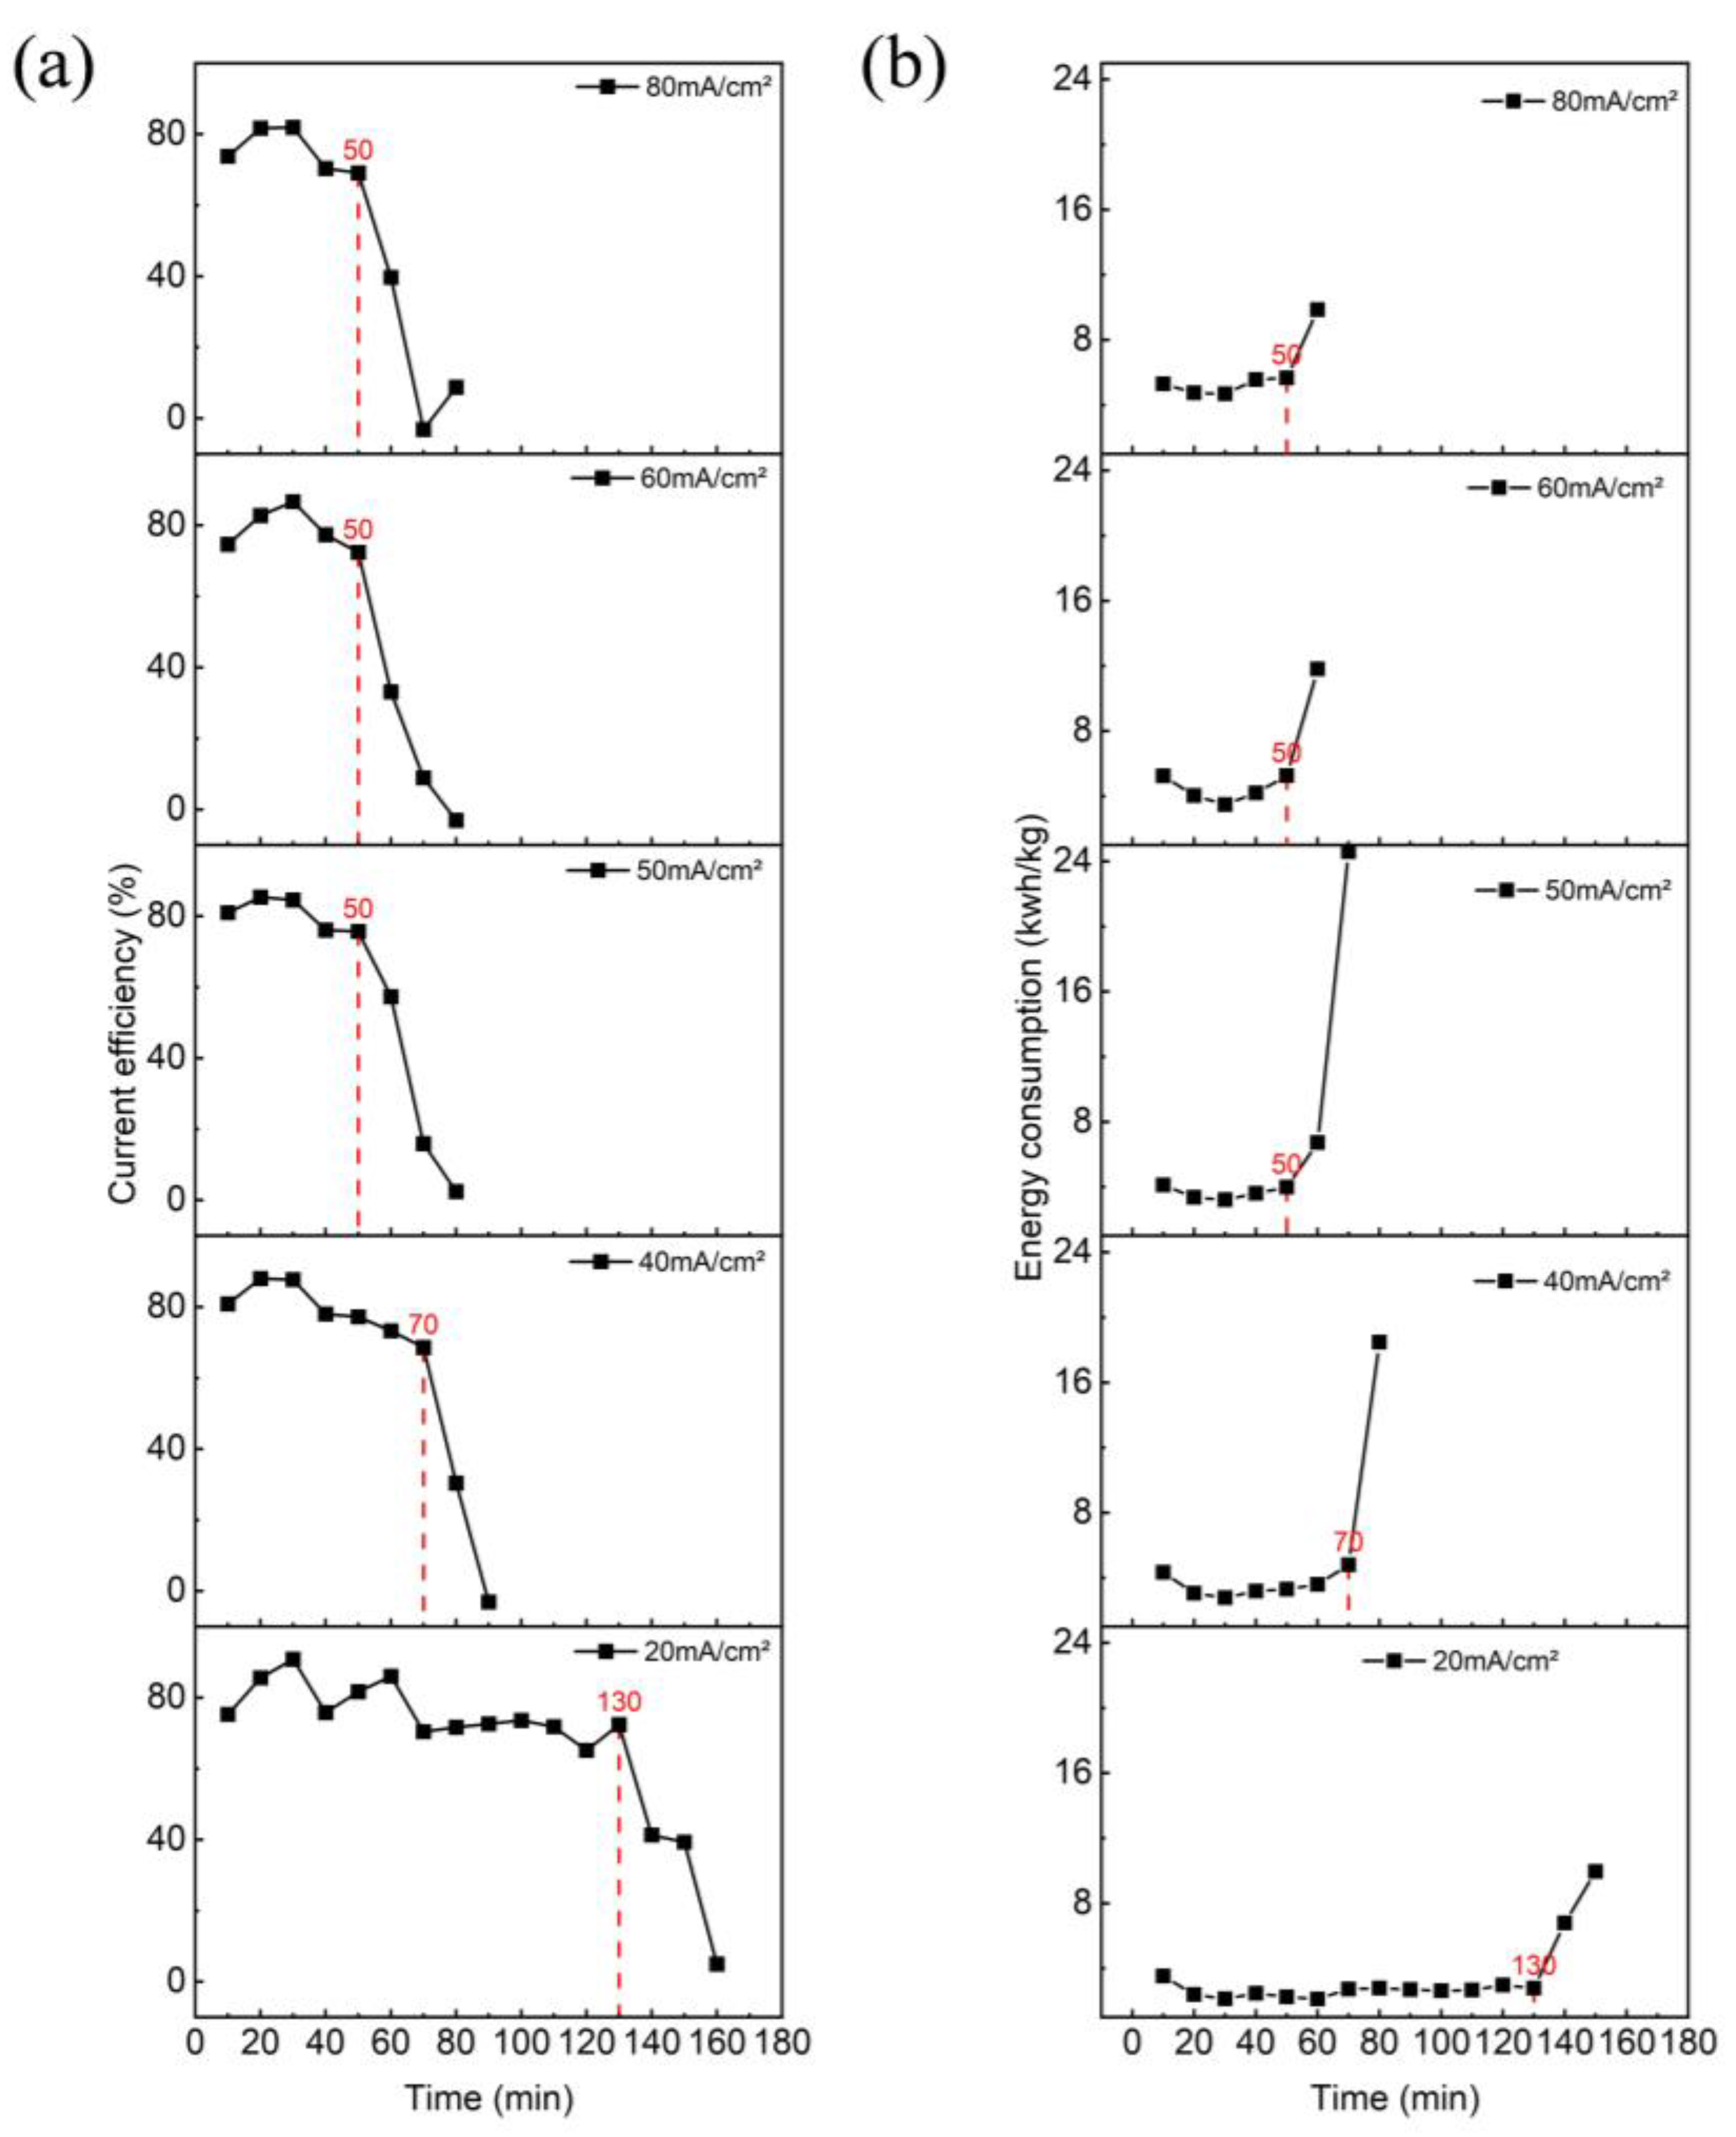
In the experiment, we monitored the conductivity changes in the feed chamber and continued supplying power to the membrane stack until it reached its lowest point. Then, throughout the electrodialysis process, we analyzed the variations in the current efficiency and specific energy consumption at the monitoring points to identify the locations of their sudden changes, as depicted in Figure 2a,b. By identifying the specific time points corresponding to each current density (20, 40, 50, 60, 80 mA/cm2) at 130 min, 70 min, 50 min, 50 min, and 50 min, respectively, we selected a “reference point” to evaluate the lithium-ion migration rate, LiOH recovery rate, specific energy consumption, and current efficiency during the BMED technique. Furthermore, the influence of varying current densities on the performance of the BMED was determined.
As depicted in Figure 3a–d, the potential difference gradient in the membrane stack increased with the rise in the current density, leading to an enhanced driving force for ions migration. Consequently, the average migration rate of the Li+ was significantly accelerated as the current density increased. Specifically, it rose from 15.79 mmol/m2/s at 20 mA/cm2 to 43.9 mmol/m2/s at 80 mA/cm2. Moreover, the final recovery rate of the LiOH also improved, reaching 90.5% at 80 mA/cm2. The improvement can be attributed to the higher potential difference, resulting in a more complete conversion of the feed lithium chloride. When at 50 mA/cm2, the recovery rate of the LiOH at the next monitoring point also exceeded 90%. Current efficiency and specific energy consumption were essential indicators for assessing how the BMED performed. As depicted in Figure 3c, the specific energy consumption of the BMED progressively increased with the rise of the current density. This is because higher current densities demand more energy to remove the stacking resistance of the BMED, resulting in an increase in the specific energy consumption during the experiment. The current efficiency initially rose with an increase in the current density and then slightly decreased. While, with low current densities, the feed conversion of the electrodialysis took longer, resulting in an increased quantity of the electric charge and relatively low current efficiency in the BMED procedure. However, when the current density exceeded 50 mA/cm2, further increases determined the increase in the quantity of the electric charge. Later in the experiment, because of the low content of ions within the feed room, there was a delayed migration of ions which led to “barren” conditions and ultimately a decrease in the current efficiency once again.
Figure 3e indicates that due to the incomplete selective permeability of the cation and anion exchange membranes, some homonymous ion migration or diffusion of the Li+ into the acid chamber occurred, driven by concentration differences. The results show that when the current density was lower, the lithium chloride conversion time was prolonged, and under the influence of decreasing potential difference as well as concentration difference, more Li+ leakage into the acid chamber, and the loss rate (in 20 mA/cm2) was as high as 2%. Similarly, Figure 3f reveals that more Cl underwent homonymous ion migration and concentration diffusion into the base compartment at a lower current density, reducing the purity of the lithium hydroxide product. In summary, it is concluded that high current densities raise energy costs but lower BMED stack equipment costs, whereas low current density can lead to poor product quality. Therefore, it is necessary to balance the energy and equipment cost by selecting a current density of 50 mA/cm2. This choice helps reduce the membrane stack price while controlling the leakage of ions, thereby improving the recovery rate and purity of the lithium hydroxide.
The conductivity of the feed solution is a crucial factor for the function of the BMED. At the beginning of the BMED, the lithium ions and chloride ions migrated into the base and acid chambers, respectively. Meanwhile, the conversion of the lithium chloride into LiOH and HCl could decrease the conductivity of the feed solution. As a result, the gradual generation of LiOH and HCl leads to a diminishment in the resistance within the system, causing a rise in the current and corresponding power. Figure 4 illustrates how the feed solution conductivity affects power, voltage, resistance and specific energy consumption during BMED at 50 mA/cm2. When the conductivity dropped to 73.9 mS/cm, the power reached its maximum value of 91.8 W, as the current reached its set value. Subsequently, the concentration of the LiOH and HCl increased until the system resistance stabilized at approximately 8.8 ± 0.1 Ω. This stabilization caused the membrane stack voltage to drop to its minimum value; therefore, the power fell back and the specific energy consumption decreased, remaining within 3.5~4 kwh/kg LiOH. However, when the conductivity of the feed solution decreased by about 30 mS/cm, it led to increased system resistance, membrane stack voltage, and power. If the conductivity of the feed solution was reduced to 9.25 mS/cm, the resistance of the system increased rapidly. As a result, the voltage rose to the upper limit of 35 V, causing a current limiting phenomenon in the system. The current rapidly decreased, resulting in a quick decrease in the power. This led to a limited lithium chloride conversion and a rapid increase in the specific energy consumption. That is why we recommend that you stop the experiment when power starts to increase rapidly before reaching the current limit, in order to ensure optimal electrodialysis performance.

3.2. Effect of Initial Lithium Chloride Concentration

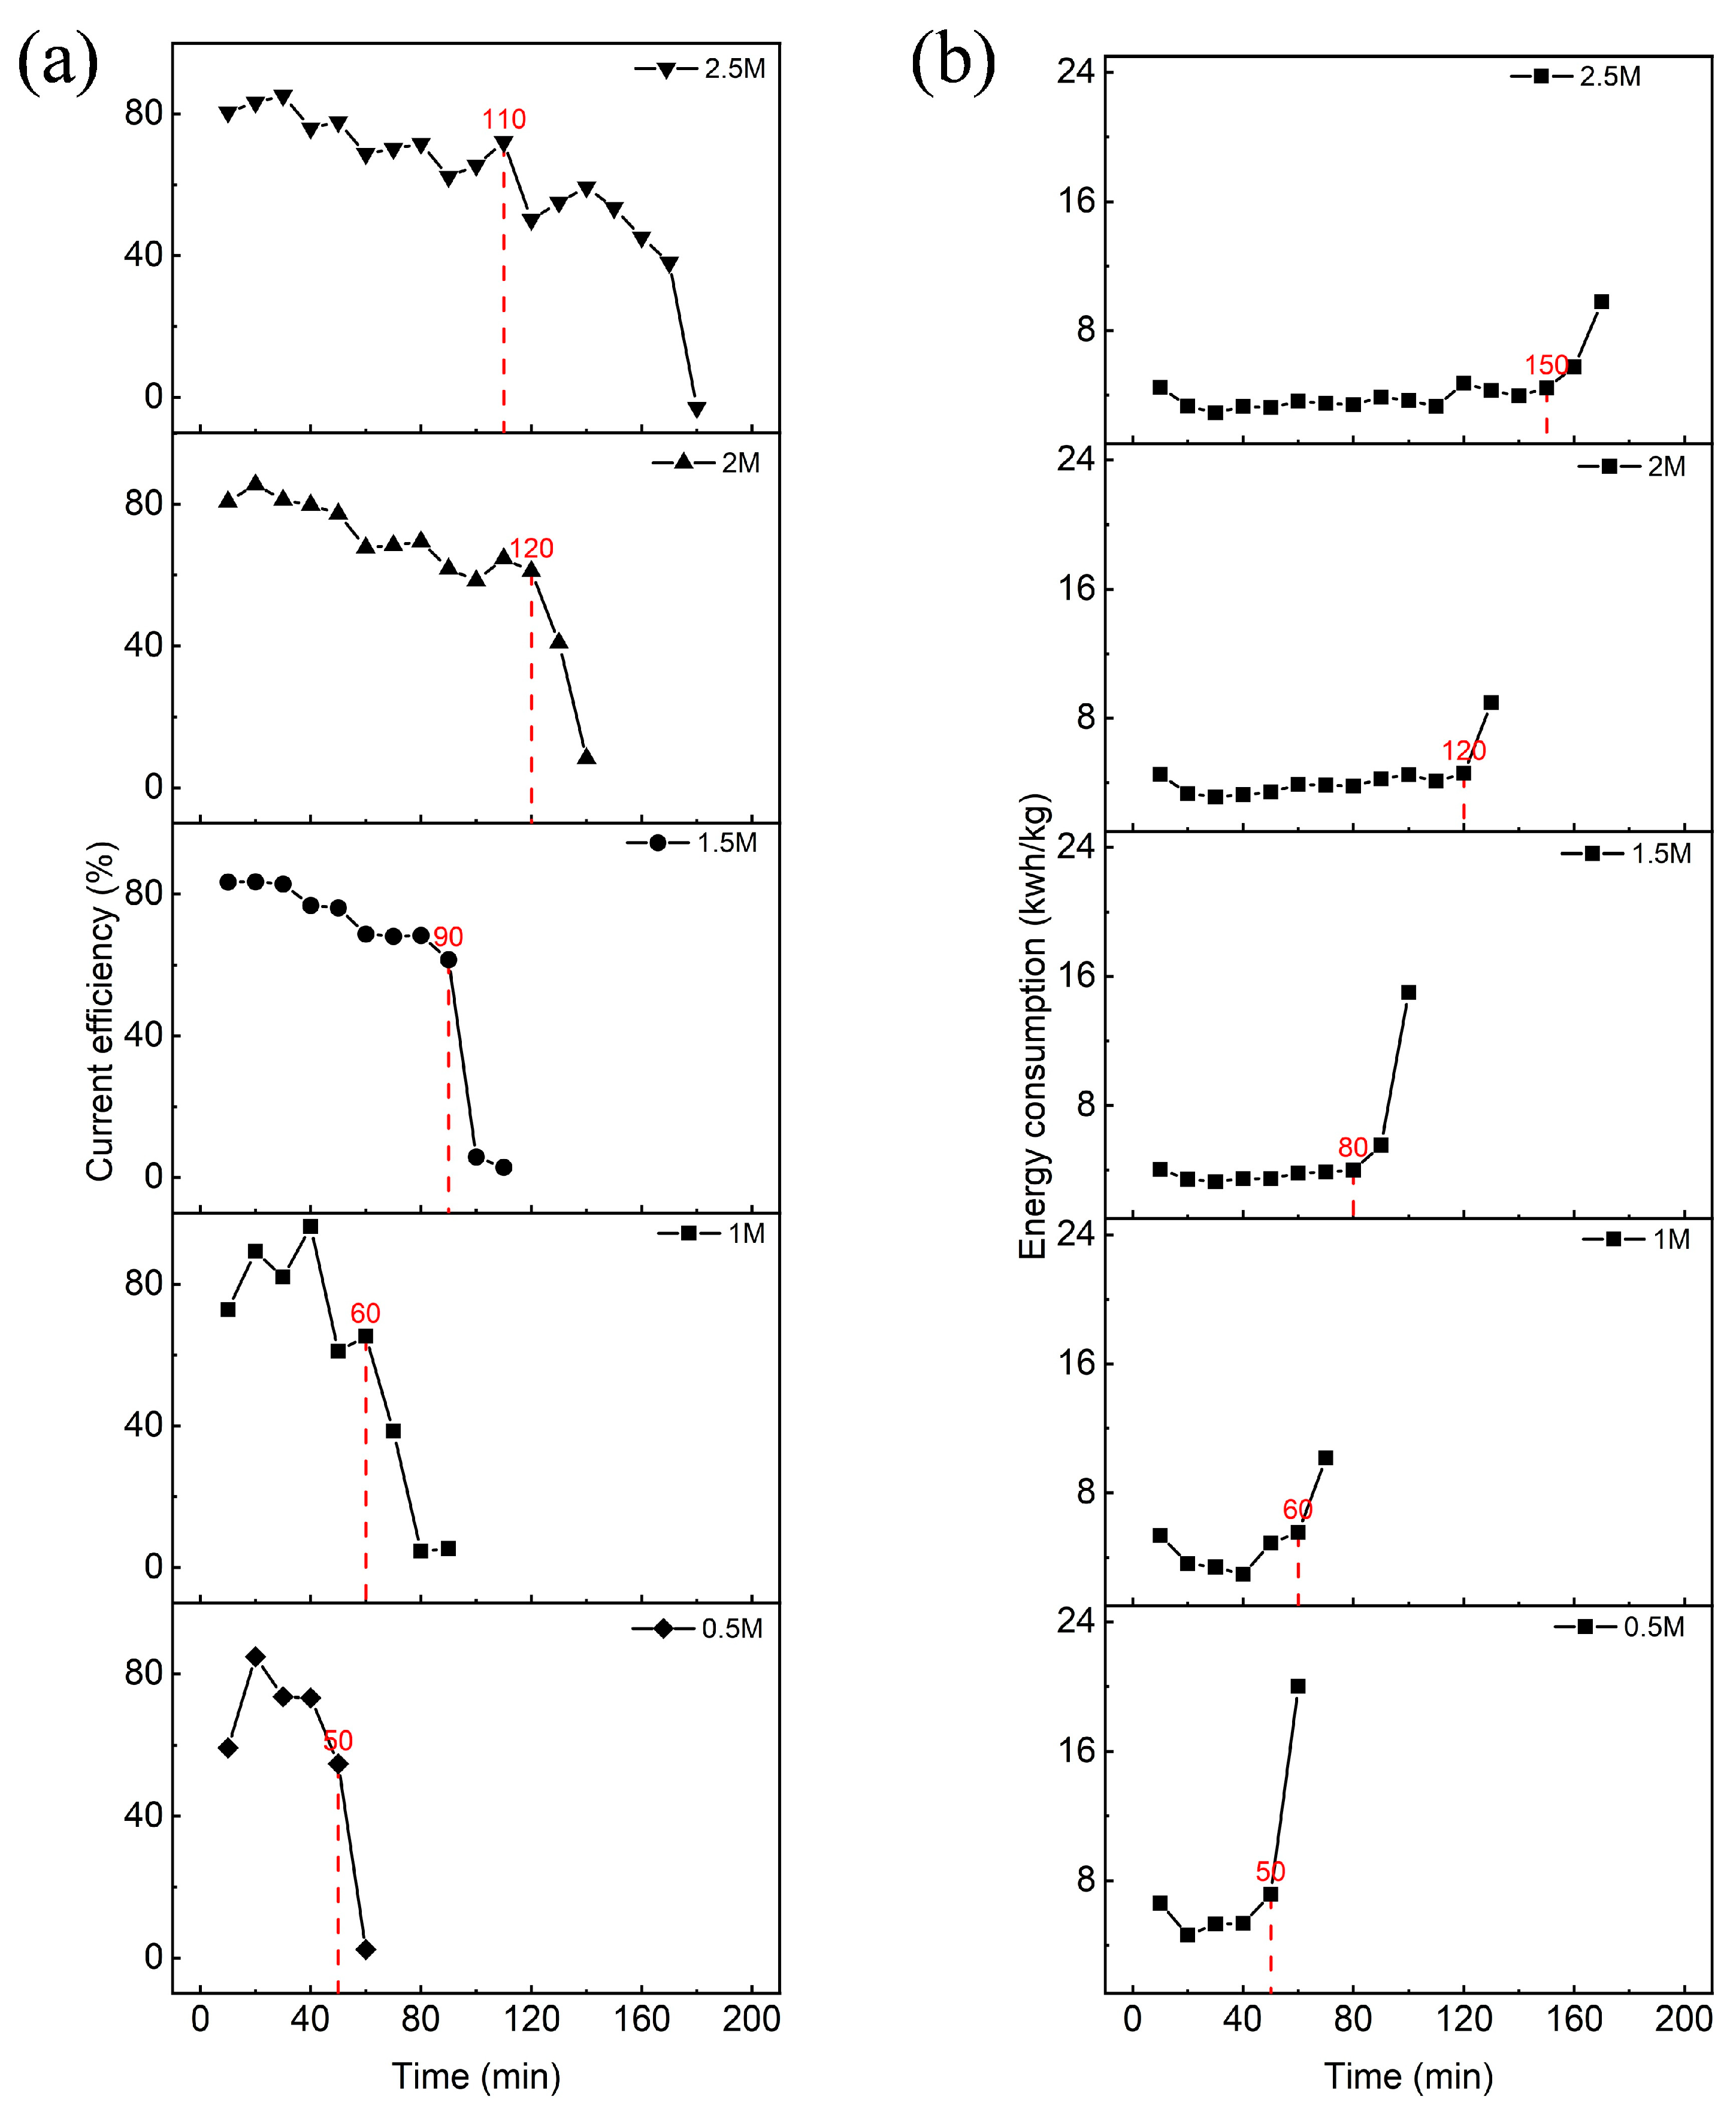
The concentration of the lithium chloride solution is a significant indicator that affects the performance of the BMED. A greater concentration of lithium chloride results in a longer conversion time. With BMED, the current efficiency and specific energy consumption are calculated and analyzed using different concentrations of the lithium chloride between monitoring points. A “reference point” was selected, but the reference points selected from the trend of growths in the current efficiency and specific energy consumption were not exactly the same (Figure 5a,b). After comparative analysis, it was determined that the sudden change in the specific energy consumption showed more significant fluctuations, making it a more appropriate choice for the reference point. As a result, conditions with concentrations of 0.5 M, 1 M, 1.5 M, 2 M, and 2.5 M correspond to evaluation times of 50 min, 60 min, 80 min, 120 min, and 150 min, respectively. The migration rate of the Li+, recovery rate of LiOH, specific energy consumption, and current efficiency were analyzed and compared from the power supply moment to the reference point to evaluate the effect of the lithium chloride concentration on the BMED performance.
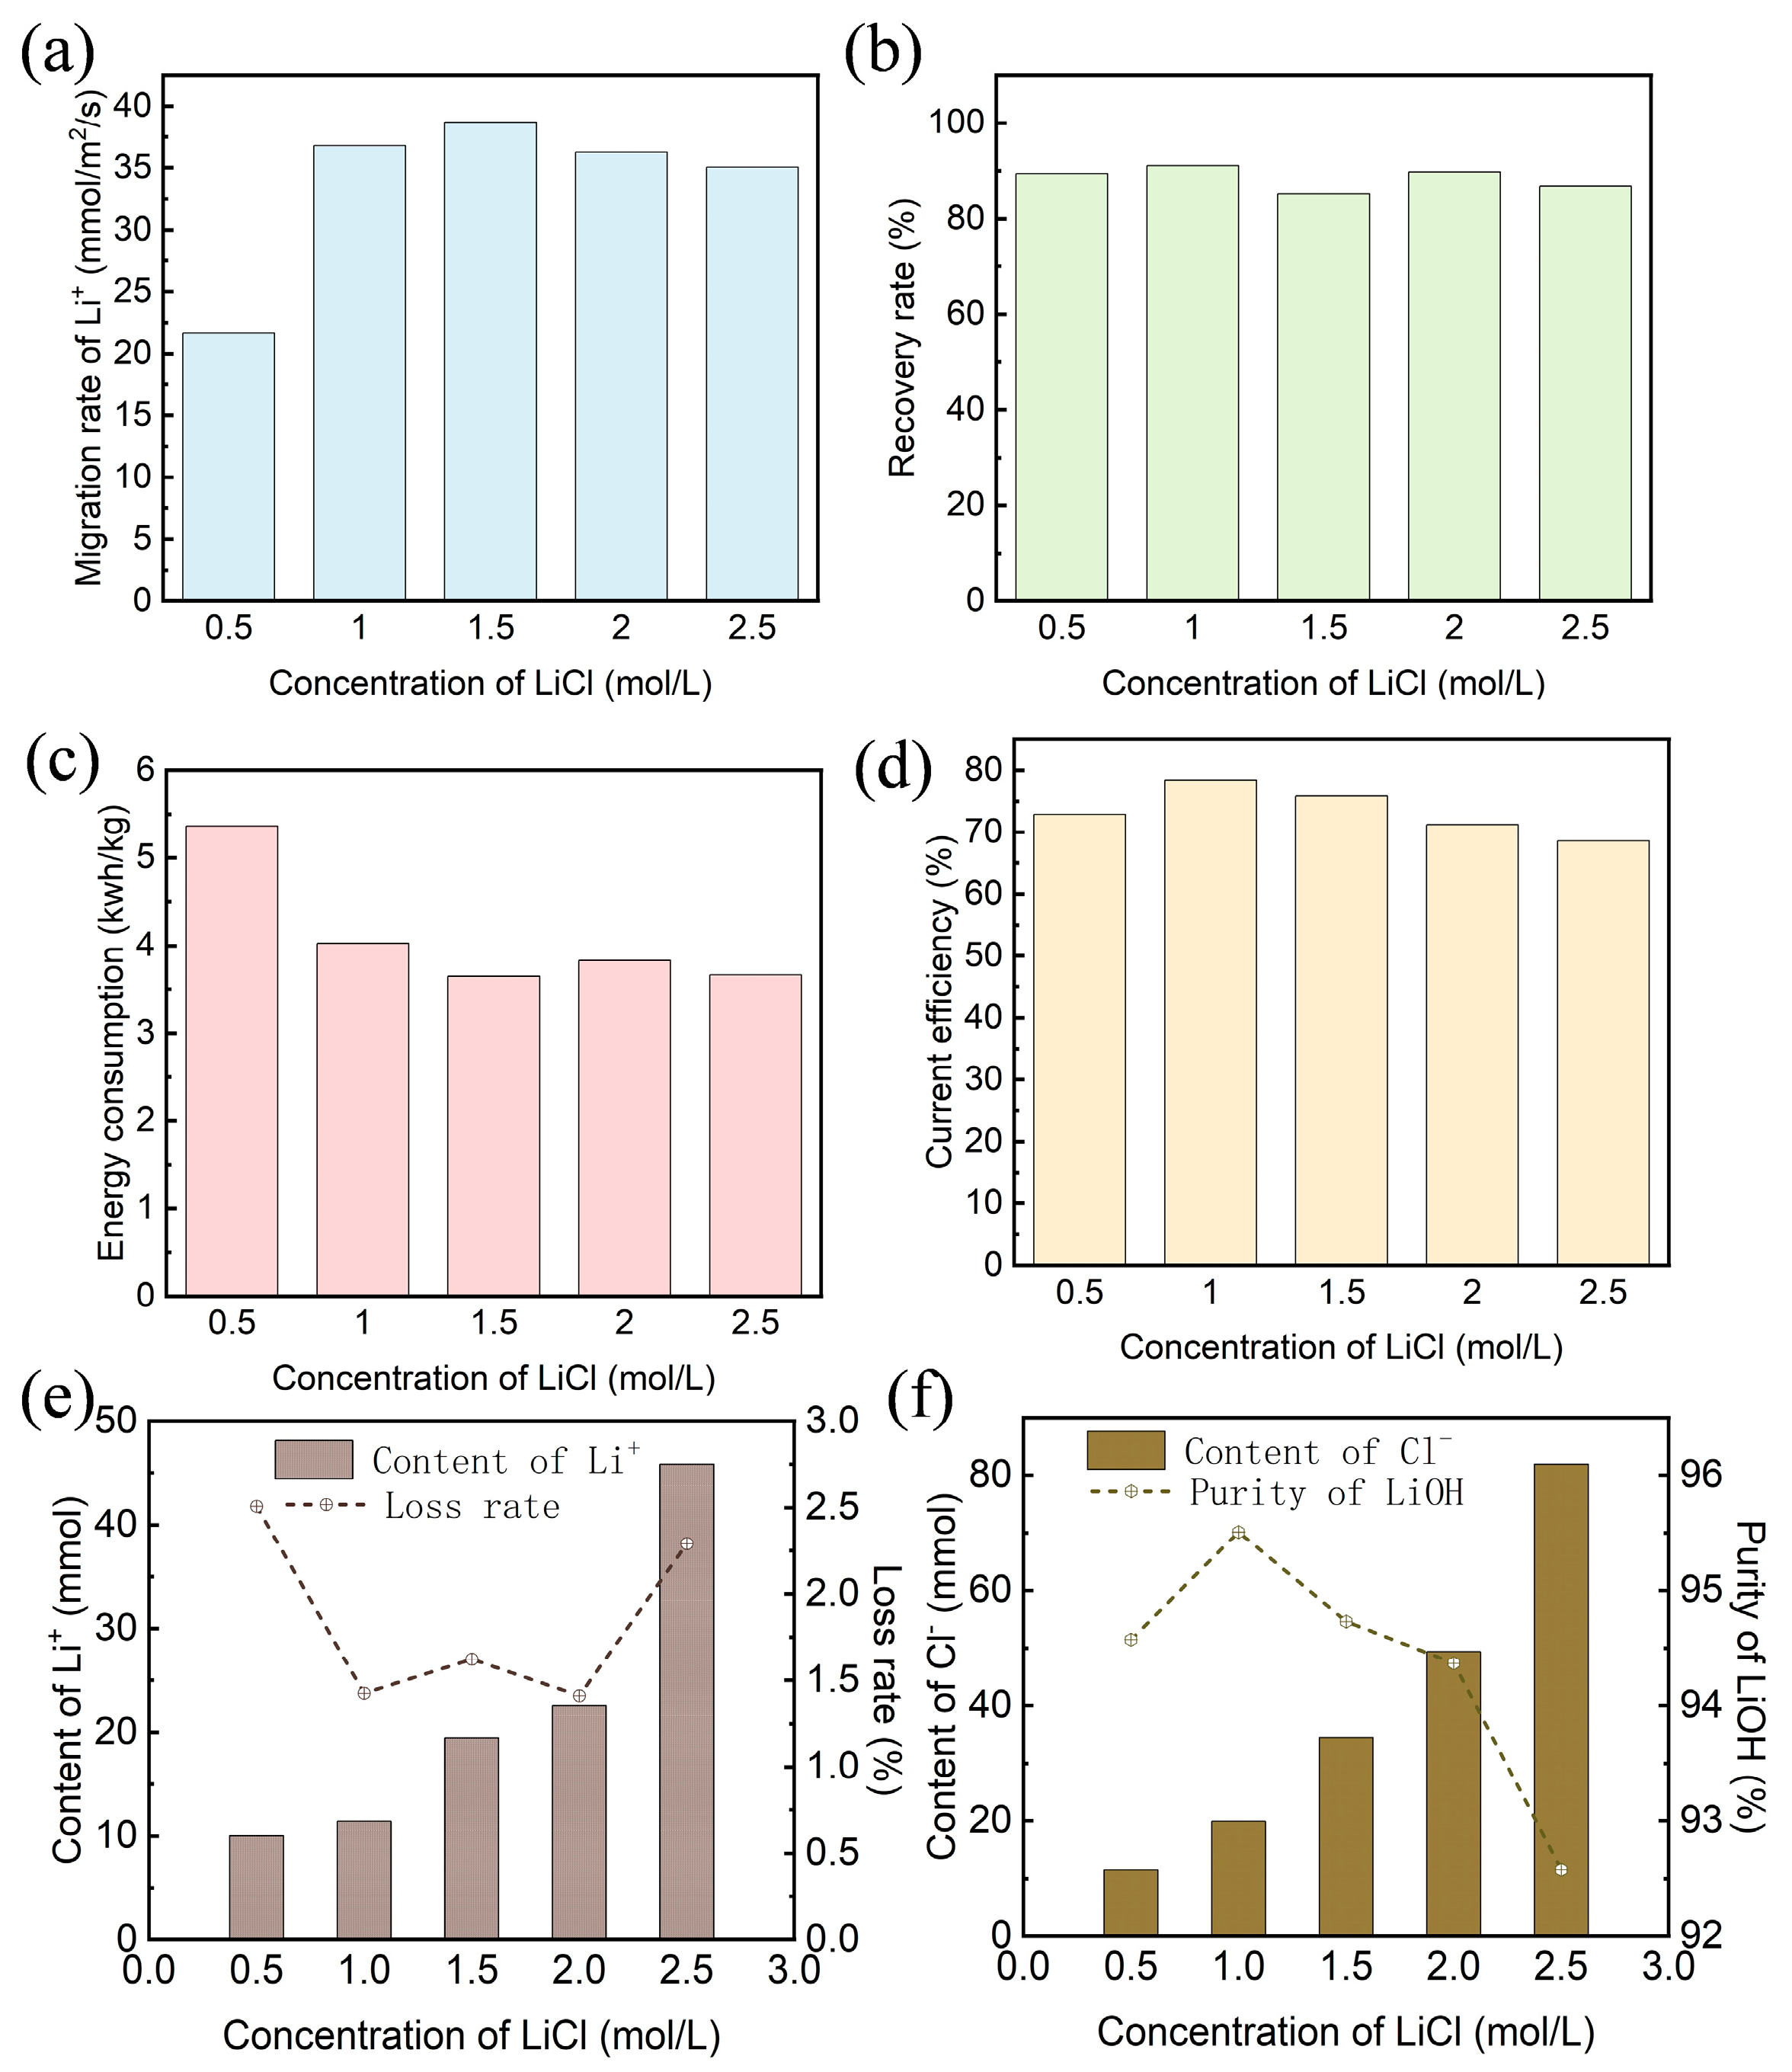
As depicted in Figure 6a–d, the average migration rate of the Li+ increased with the rise in the lithium chloride concentration during the experiment. However, when the lithium chloride concentration exceeded 1.5 M, a decrease in the average migration rate was seen. This phenomenon may be the result of the heightened ionic force in the feed solution and the greater concentration difference between the feed and product chambers. Ultimately, due to the increased concentration of the lithium chloride at a constant current density, complete conversion of the lithium chloride into LiOH became challenging, leading to a decreasing trend in the recovery rate of the LiOH, which stood at 86.7% at 2.5 M. The specific energy consumption during the experimental process decreased with the increase of the lithium chloride concentration and then stabilized at approximately 3.7 kwh/kg LiOH. This reduction was attributed to having created a low-resistance environment for the BMED experiments, thereby reducing the specific energy consumption required to overcome the resistance. The current efficiency depended on the amount of LiOH and the quantity of electric charge in the experiment. As the concentration of the lithium chloride increased, the concentration of LiOH obtained in the base chamber increased, while the resistance to ion migration in the feed chamber also increased. Consequently, a longer conversion time is required. This led to a decrease in process current efficiency from 78.44% at a feed lithium chloride concentration of 1 M to 68.56% at 2.5 M. In conclusion, it is not advisable to increase the feed lithium chloride concentration as a means of reducing the processes’ specific energy consumption.
Figure 6e shows that a higher concentration of lithium chloride caused the Li+ to diffuse along the concentration gradient towards the acid chamber in a long conversion time, ultimately making it harder to extract the Li+, and numerous lithium ions were lost in the acid room. Similarly, Figure 6f illustrates that the increase in the lithium chloride concentration caused more Cl to leak into the base solution, resulting in more chloride impurities in the LiOH product, significantly reducing its purity to 93.3% (in 2.5 M). In summary, increasing the concentration of the lithium chloride solution reduced the specific energy consumption while causing severe ion leakage. It is recommended to maintain the initial lithium chloride concentration between 1 and 1.5 M for optimal results.
Under the current density of 50 mA/cm2 and lithium chloride concentration of 1.5 M, the influence of the feed chamber conductivity on the specific energy consumption during the electrodialysis process was analyzed. As depicted in Figure 7, when the lithium chloride begins to convert and the conductivity drops to 102.6 mS/cm, the decrease in system resistance caused the BMED stack voltage and current to reach their set values, resulting in a power of 92.47 W. Subsequently, as the conductivity continued to decrease, more ions migrated out of the feed solution to generate additional LiOH and HCl, causing the system resistance to drop to a minimum of 8.6 ± 0.05 Ω. This maintained the BMED stack voltage at 23.6 ± 0.1 V with a power of 64.7 ± 0.1 W. When the conductivity decreased to approximately 20 mS/cm, there was an increase in the system resistance and stack voltage, leading to a chain reaction that increased both the power and specific energy consumption. Finally, when the conductivity reached 7.l mS/cm, the resistance increased linearly, leading to current limiting in the system and the specific energy consumption also rapidly increased. It is evident that higher concentrations of lithium chloride (compared to those mentioned above) result in higher product concentrations, with current limiting occurring later in the process.

3.3. Effect of Initial Feed pH

Based on the supplier’s parameters, the anion exchange membrane operated within a pH range of 0 to 4. Therefore, prior to electrodialysis, hydrochloric acid was added to lower the pH of the feed solution to approximately “4”. It is essential to ensure that the pH represents the concentration of H+ in the solution, which can impact the migration of the Li+ during electrodialysis. To investigate the effect of the initial feed pH, a 1.5 M lithium chloride solution was added to control the pH levels at 2.5, 3.5, and 4.5 for the BMED experiments with a current density set at 50 mA/cm2. The variations in the current efficiency and specific energy consumption between monitoring points were initially analyzed across different pH levels. It was found that the trend of different pH values in the graph was consistent, as shown in Figure 8, leading to the selection of 80 min as the reference point for subsequent analysis.
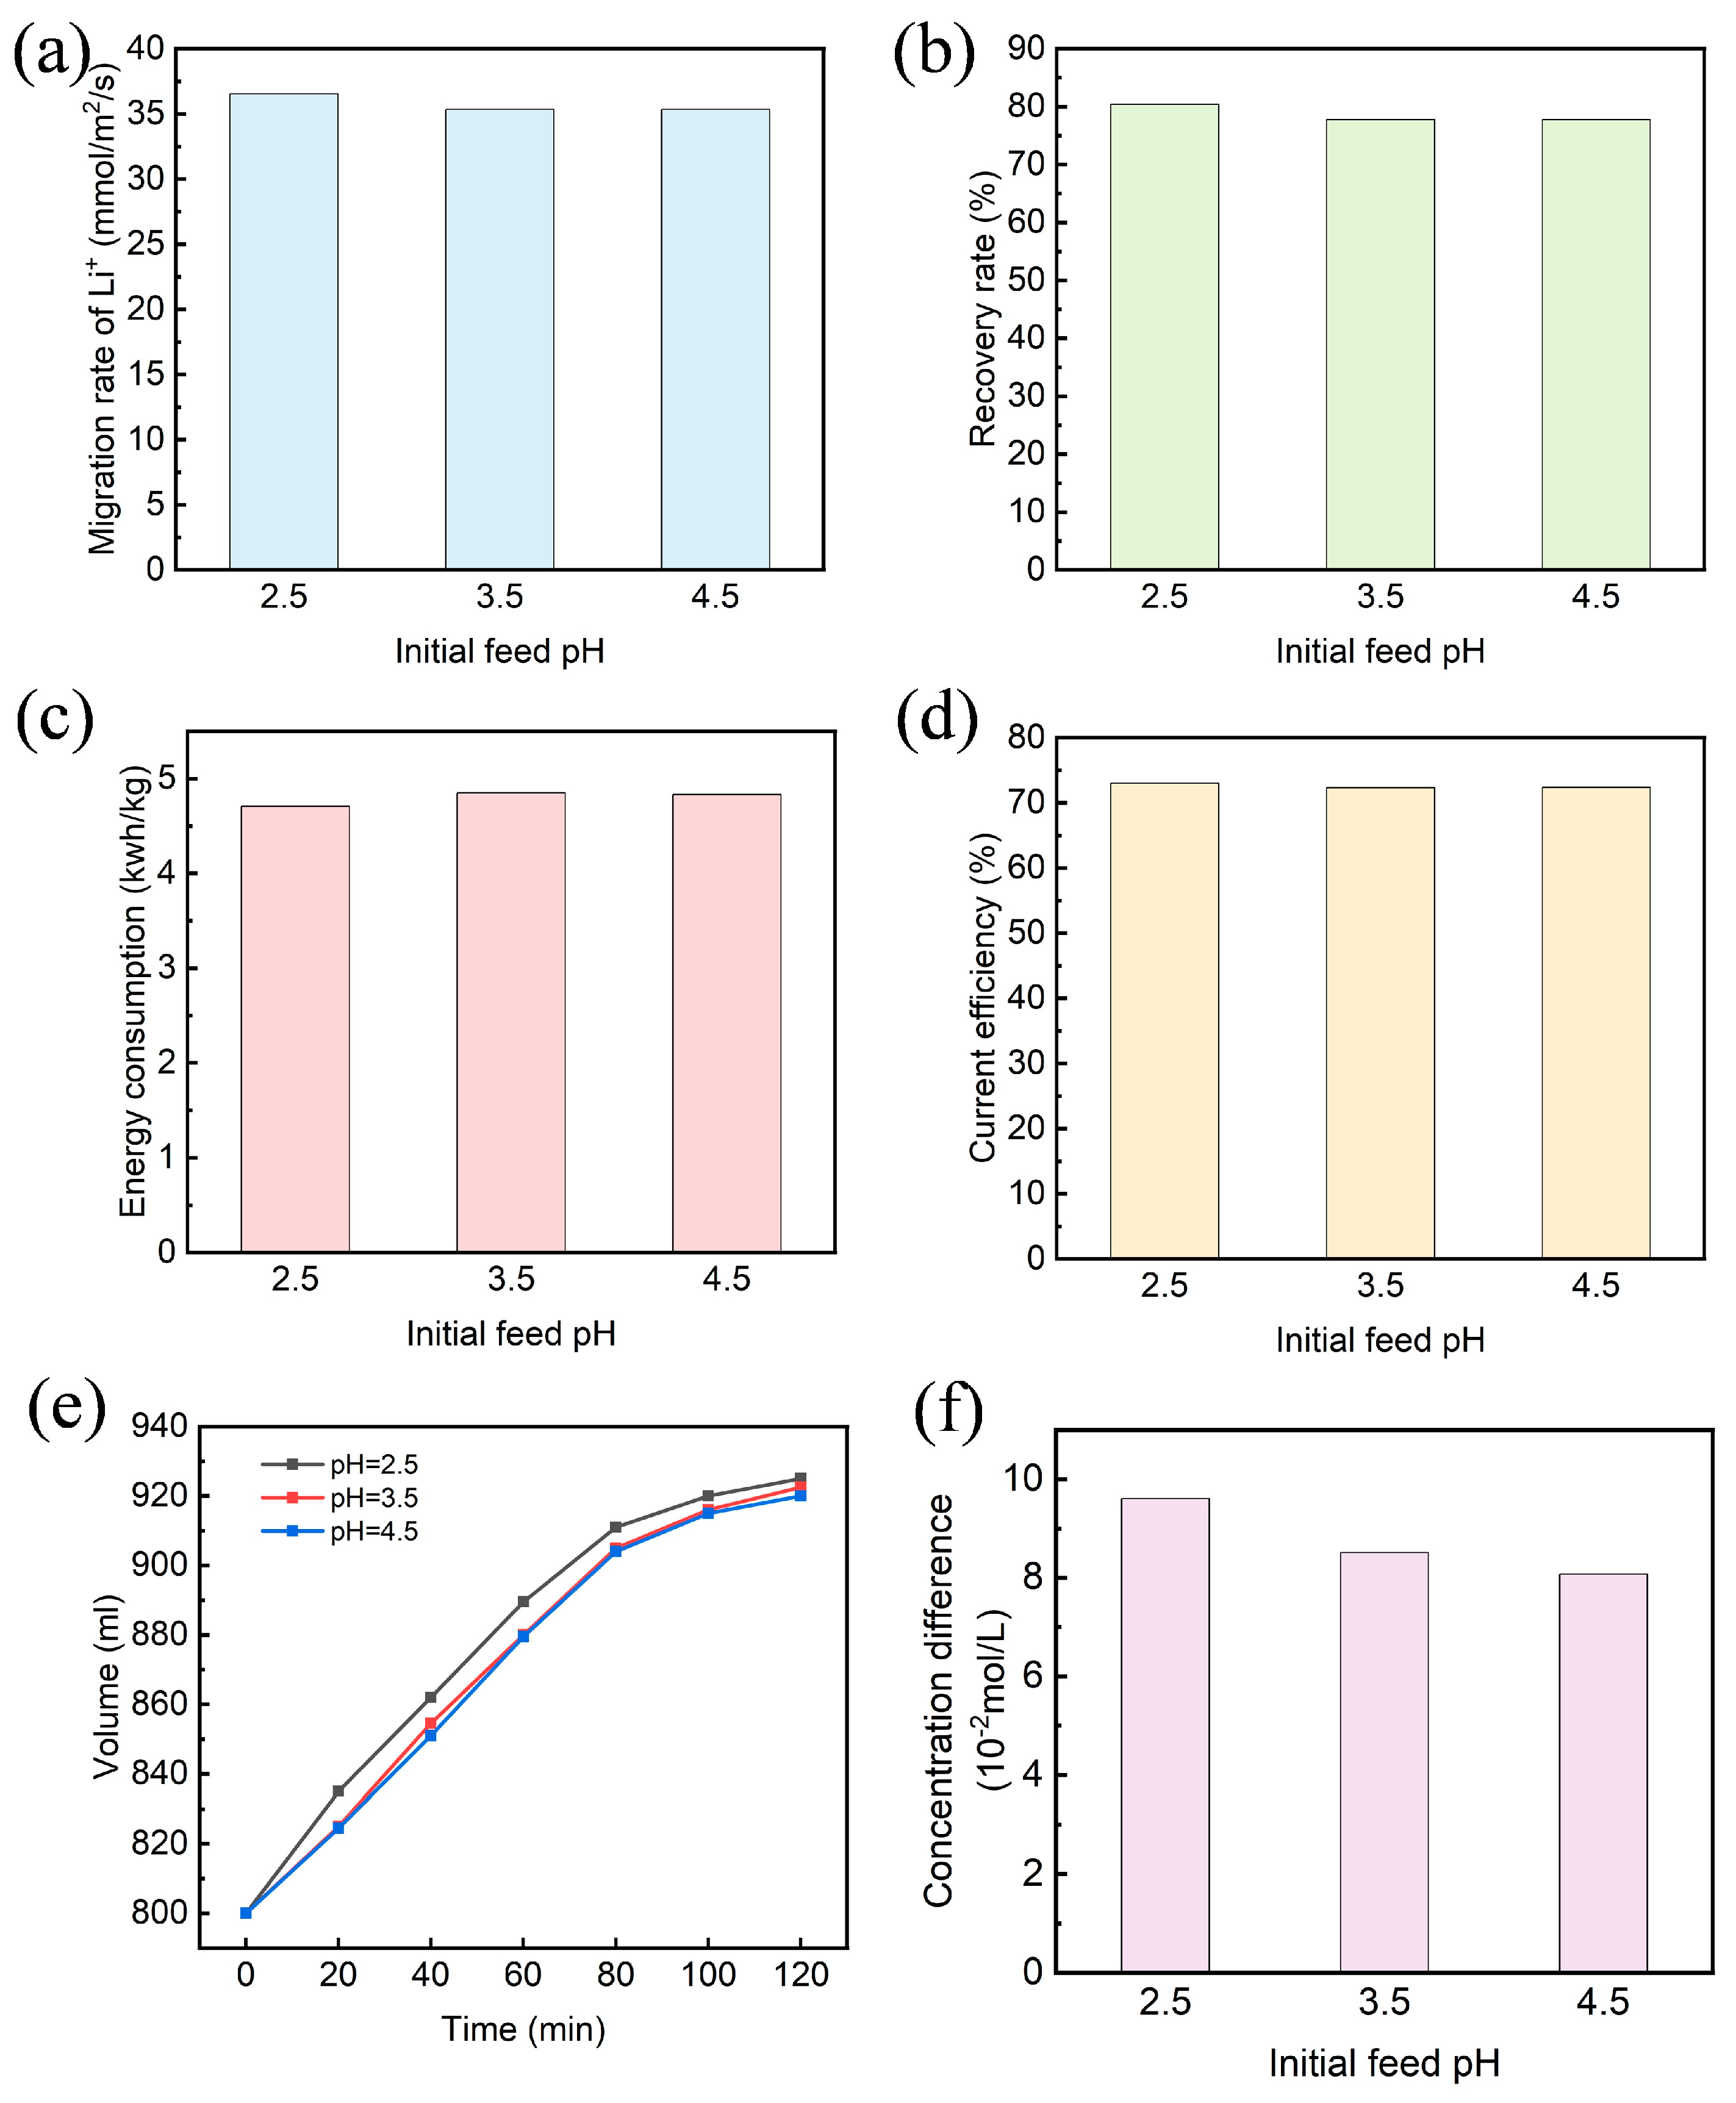
As illustrated in Figure 9, the excellent conductivity at pH 2.5 provides an optimal ion migration environment, resulting in the highest average migration rate of the Li+ at pH 2.5, reaching 36.55 mmol/m2/s. However, as the pH increased to 3.5 or 4.5, the migration rate slightly decreased. This may be attributed to the favorable migration environment at pH 2.5. It was observed that the LiOH recovery rate was highest at pH 2.5, reaching a maximum of 80.4% compared to the other two pH levels. It is noted that a decrease in pH lower than 2.5 could increase the concentration of H+, which will migrate to the base chamber during electrodialysis and reduce the purity of the lithium hydroxide production. Additionally, under the condition, the electrodialysis system demonstrated a smaller specific energy consumption of 4.7 kwh/kg LiOH and greater current utilization with a current efficiency of 72.99%.
Hydrogen ions can form chains with neighboring water molecules and move faster than other ions, leading to the rapid migration of hydrogen ions to the base chamber where they coexist with hydroxide ions in the form of water. Figure 9e demonstrates the increase in the volume of the base room, with the most noticeable change occurring at a pH of 2.5, which can be attributed to two factors. On the one hand, there was the migration of hydrated lithium ions into the base chamber (a hydration number of Li+ is 6 [34]). On the other hand, hydrogen ions also moved into the same chamber, where they reacted with hydroxide ions to produce water. The lower pH produced a greater concentration difference between the HCl in the acid room and the LiOH in the base room. Specially, at a pH of 2.5, the HCl concentration exceeded the LiOH concentration by 0.096 M, a difference that decreased to 0.081 M at a pH of 4.5. In summary, the selection of pH 2.5 as the experimental condition was conducive to reducing the specific energy consumption and improving the current efficiency, but it will also lead to a slight reduction in the LiOH concentration.

3.4. Effect of the Volume Ratio of the Feed and Base Solution

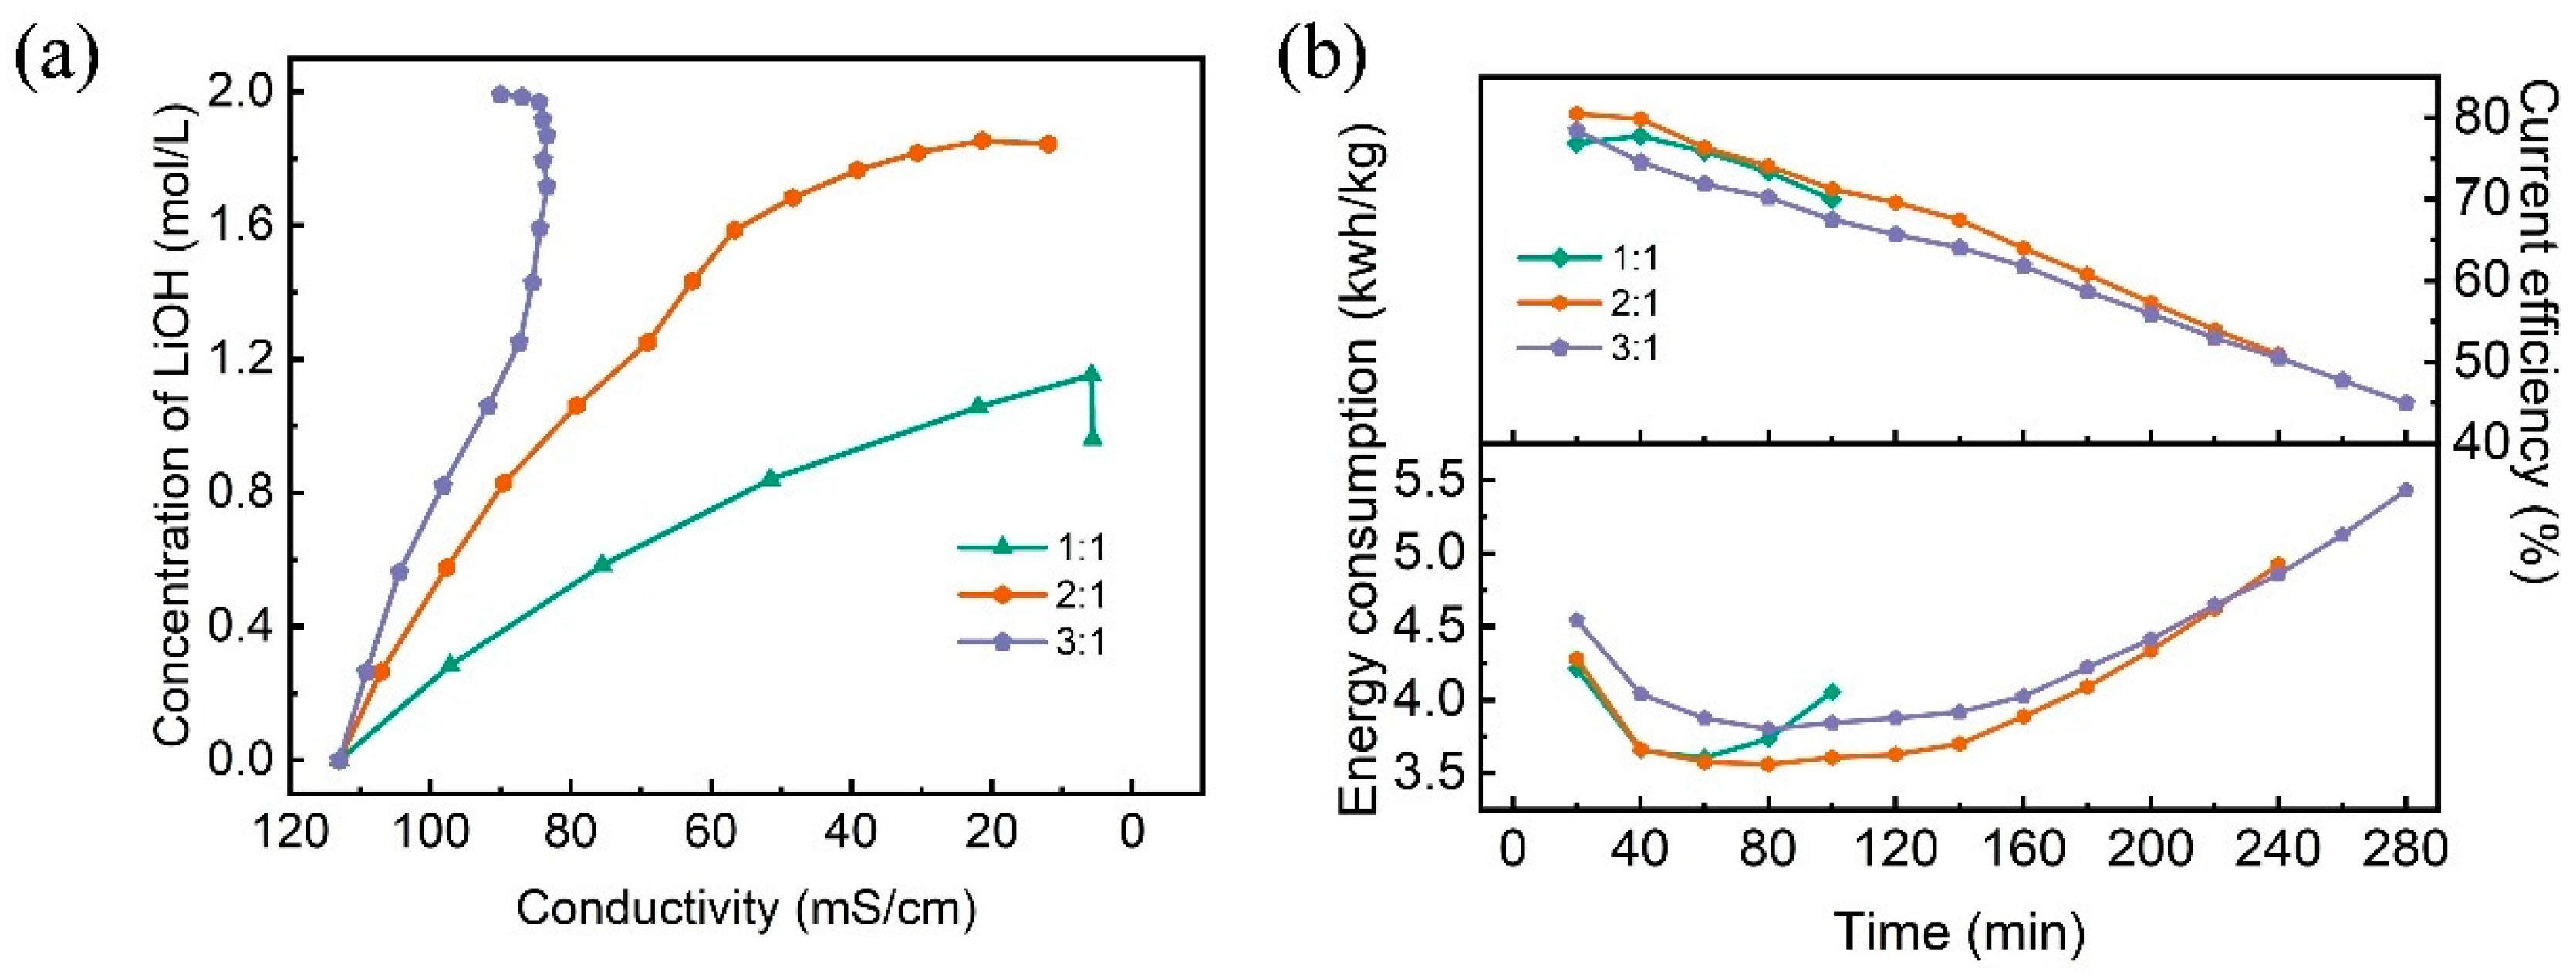
The impact of the amounts of lithium chloride on the concentration of the LiOH is shown in Figure 10. The volume ratios of the initial lithium chloride solution (1.5 M) to product solution in the base room were set to be 1:1, 2:1, and 3:1. Figure 10a shows the effect of the feed conductivity on the LiOH concentration under different volume ratios. The concentration increased from 1.152 M in a 1:1 ratio to 1.991 M in a 3:1 ratio, representing an increase of 72.8%. This enhancement is attributed to a sustained lithium-ion migration rate result from the larger volume ratio of the feed and base solution, in contrast to the rapid concentration drop and decreased migration rate observed in a smaller volume ratio. Figure 10b shows that a corresponding increase in the volumetric ratio improves the current efficiency and reduces specific energy consumption. However, at a volume ratio of 3:1, the concentration of the lithium chloride solution decreased more slowly, and increased inter-ionic force hindered the migration of lithium-ion. Consequently, lower current efficiency and rapidly increasing specific energy consumption occurred in the later stages. To minimize the specific energy consumption in the mid-test experiments, as suggested by our results, a graded electrodialysis system can be designed. This system could involve removing some products, reducing concentration difference, and mitigating ion migration resistance when electrolysis reaches a certain stage.

3.5. Ion Migration

After obtaining the optimized conditions through preceding experiments, BMED was conducted using 800 mL of 1.5 mol/L lithium chloride solution with pH = 3.5 at 50 mA/cm2. The focus was on analyzing the migration process of the lithium ions separating from chlorine ions at each monitoring point. The ionic mobility rate of each segment was calculated, visualizing the ionic trans-membrane process, as shown in Figure 11. The ion migration process in the experiment can be divided into three segments. In the first segment (0–20 min), following the establishment of a potential difference, ions migrate to the interface of the ion exchange membrane and then are attracted to fixed groups within the membrane through electrostatic forces. When supplying power, ions move, generating ionic currents, producing a conductive effect, and facilitating ionic mass transfer as they jump from one fixed group to another. In the second section (20–100 min), after the formation of an “ionic mass transfer channel”, more anions and cations migrate across the membrane into the acid-base chamber, driven by the potential difference and higher ionic concentration per unit time. However, as the experiment progresses, the ionic concentration in the feed material liquid gradually reduces, leading to a widening difference in reverse concentration, slowing down ion migration speed, and gradually reducing the number of ions migrated per unit time. In the final section (100–120 min) of the experiment, with low ion content in the feed material liquid and a significant reverse concentration difference, ions undergoing forward migration also experience simultaneous reverse diffusion. This leads to substantial reduction in the current utilization, increasing the process of specific energy consumption. Thus, it is advisable to promptly terminate the experiment at this stage.

3.6. Economic Analysis

The mainstream lithium sulphate causticizing method for lithium hydroxide production not only consumes a large amount of auxiliary materials, such as sodium hydroxide, but also requires an energy-intensive environment with low-temperature refrigeration. However, our study found that the specific energy consumption of the BMED technology for treating 1.5 M LiCl at 50 mA/cm2 is only 3.65 kwh/kg LiOH. Calculation results revealed that the processing cost of lithium sulphate causticizing is about 995 USD/t LiOH, while the cost for the preparation of lithium hydroxide via BMED processing is 367.5 USD/t LiOH. Therefore, it can be seen that the BMED offers significant economic superiority, as shown in Table 2 [35].

4. Conclusions

BMED technology has great potential for producing lithium hydroxide from a salt-lake. This paper investigated the impact of the current density, concentration of LiCl, pH, and feed-to-product volume ratio on BMED functioning. Increasing the current density or decreasing the initial lithium chloride concentration in the BMED process can effectively improve the purity of the lithium hydroxide. However, a higher current density also increased the specific energy consumption. Considering both equipment and energy costs, a current density of 50 mA/cm2 is recommended. The initial lithium chloride concentration significantly impacted the recovery rate, specific energy consumption, and current efficiency of the BMED process. Greater LiCl concentration increased the resulting lithium hydroxide concentration, reduced resistance, and lowered the specific energy consumption. However, this also led to ion diffusion, decreasing the current efficiency. Therefore, an initial LiCl concentration of 1.5 M is recommended for optimal synthesis. The acidic environment in the feed solution ensures the service life of the ion exchange membrane, but the lower pH can cause a crazy increase in the volume of the base solvent, leading to a decline in the product content. It is essential to find a balanced pH, with 2.5 or 3.5 recommended. The optimal condition parameters are shown in Table 3. Based on our exploration of the volume ratio in small-scale experiments, continuous (or mid-test) electrodialysis experiments should be timely designed with graded electrodialysis to reduce the specific energy consumption. It is noted that the feed material lithium chloride solution will contain interfering ions such as carbonate ions, sulfate ions, and sodium and potassium ions, which can have a harmful effect on the purity of the lithium hydroxide. Such that carbonate ions could form lithium carbonate precipitate and cause membrane pore blockage during the BMED process. Therefore, they must be thoroughly removed prior to electrodialysis and we will address these issues in future work. The effect of the lithium hydroxide concentration and electrode solution concentration on the electrodialysis performance of the bipolar membrane should be considered in the scale-up experiments. Additionally, to prolong the lifetime of the applied membrane in scale-up experiments, thicker membranes are suggested.

Author Contributions

Conceptualization, M.W.; data curation, G.W.; formal analysis, G.W. and J.G.; funding acquisition, J.G.; investigation, G.W.; methodology, M.W., C.L. and C.X.; project administration, X. C.; software, G.W.; resources, G.W.; supervision, J.G.; validation, G.W.; visualization, M.W., C.L. and C.X.; writing-original draft, G.W.; writing-review& editing, C.L. and J.G. All authors have read and agreed to the published version of the manuscript.

Funding

This research was funded by the Natural Science Foundation of China (U21A20305); the Key R&D Program of Zhejiang (2022C03074); the Ningbo 2025 Major Science and Technology Tasks Tackling (2021z061), the Lithium Resources and Lithium Materials Key Laboratory of Sichuan Province (LRMKF202201).

Data Availability Statement

Data is contained within the article.

Conflicts of Interest

Author Chuan Xu was employed by the company Tianqi Lithium Corporation. The remaining authors declare that the research was conducted in the absence of any commercial or financial relationships that could be construed as a potential conflict of interest.

References

  1. Yoshino, A. The Birth of the Lithium-Ion Battery. Angew. Chem. Int. Ed. 2012, 51, 5798–5800. [Google Scholar] [CrossRef] [PubMed]
  2. Goodenough, J.B.; Kim, Y. Challenges for Rechargeable Li Batteries. Chem. Mater. 2010, 22, 587–603. [Google Scholar] [CrossRef]
  3. Sun, X.; Si, W.; Liu, X.; Deng, J.; Xi, L.; Liu, L.; Yan, C.; Schmidt, O.G. Multifunctional Ni/NiO hybrid nanomembranes as anode materials for high-rate Li-ion batteries. Nano Energy 2014, 9, 168–175. [Google Scholar] [CrossRef]
  4. Fang, G.; Zhou, J.; Liang, C.; Pan, A.; Zhang, C.; Tang, Y.; Tan, X.; Liu, J.; Liang, S. MOFs nanosheets derived porous metal oxide-coated three-dimensional substrates for lithium-ion battery applications. Nano Energy 2016, 26, 57–65. [Google Scholar] [CrossRef]
  5. Fitch, B.; Yakovleva, M. Study of the Effect of Lithium Precursor Choice on Performance of Nickel-Rich NMC. In ECS Meeting Abstracts; The Electrochemical Society, Inc.: Pennington, NJ, USA, 2017. [Google Scholar]
  6. Yang, S.; Wang, X.; Yang, X.; Liu, L.; Liu, Z.; Bai, Y.; Wang, Y. Influence of Li source on tap density and high rate cycling performance of spherical Li[Ni1/3Co1/3Mn1/3]O2 for advanced lithium-ion batteries. J. Solid State Electrochem. 2011, 16, 1229–1237. [Google Scholar] [CrossRef]
  7. Li, Y.; Wang, M.; Zhao, Y.; Wang, H.; Zhu, Z.; Peng, Z. Technology and development of lithium extraction from salt lake brine. J. Salt Lake Res. 2023, 31, 71–80. [Google Scholar]
  8. Deng, S.; Sun, H.; Qin, J.; Yu, M.; Su, J.; Li, L.; Zeng, Y. The Advances in Preparation of Lithium Hydroxide. J. Salt Lake Res. 2019, 27, 77–81. [Google Scholar]
  9. Liu, H.; Azimi, G. Production of Battery Grade Lithium Hydroxide Monohydrate Using Barium Hydroxide Causticizing Agent. Resour. Conserv. Recycl. 2022, 179, 106115. [Google Scholar] [CrossRef]
  10. Xia, G.; Yao, K.; Tu, M.; Dong, H.; Jin, P.; Huo, L.; Huang, C. Method for Preparing Battery-Stage Monohydrate Lithium Hydroxide. CN Patent CN200710051016.5, 9 July 2008. [Google Scholar]
  11. Jiang, C.; Wang, Y.; Wang, Q.; Feng, H.; Xu, T. Production of Lithium Hydroxide from Lake Brines through Electro–Electrodialysis with Bipolar Membranes (EEDBM). Ind. Eng. Chem. Res. 2014, 53, 6103–6112. [Google Scholar] [CrossRef]
  12. Qiu, Y.; Ruan, H.; Tang, C.; Yao, L.; Shen, J.; Sotto, A. Study on Recovering High-Concentration Lithium Salt from Lithium-Containing Wastewater Using a Hybrid Reverse Osmosis (RO)–Electrodialysis (ED) Process. ACS Sustain. Chem. Eng. 2019, 7, 13481–13490. [Google Scholar] [CrossRef]
  13. Gao, W.; Zhao, H.; Wei, X.; Meng, X.; Wu, K.; Liu, Y. A Green and Economical Method for Preparing Potassium Glutamate through Electrodialysis Metathesis. Ind. Eng. Chem. Res. 2022, 61, 1486–1493. [Google Scholar] [CrossRef]
  14. Donnan, F.G. The Theory of Membrane Equilibria. Chem. Rev. 1924, 1, 73–90. [Google Scholar] [CrossRef]
  15. Kreuer, K.-D. Ion Conducting Membranes for Fuel Cells and other Electrochemical Devices. Chem. Mater. 2013, 26, 361–380. [Google Scholar] [CrossRef]
  16. Chen, X.; Ruan, X.; Kentish, S.E.; Li, G.; Xu, T.; Chen, G.Q. Production of lithium hydroxide by electrodialysis with bipolar membranes. Sep. Purif. Technol. 2021, 274, 119026. [Google Scholar] [CrossRef]
  17. Miao, M.; Qiu, Y.; Yao, L.; Wu, Q.; Ruan, H.; Van der Bruggen, B.; Shen, J. Preparation of N,N,N-trimethyl-1-adamantylammonium hydroxide with high purity via bipolar membrane electrodialysis. Sep. Purif. Technol. 2018, 205, 241–250. [Google Scholar] [CrossRef]
  18. Tongwen, X. Electrodialysis processes with bipolar membranes (EDBM) in environmental protection—A review. Resour. Conserv. Recycl. 2002, 37, 1–22. [Google Scholar] [CrossRef]
  19. Jaime-Ferrer, J.S.; Couallier, E.; Viers, P.; Rakib, M. Two-compartment bipolar membrane electrodialysis for splitting of sodium formate into formic acid and sodium hydroxide: Modelling. J. Membr. Sci. 2009, 328, 75–80. [Google Scholar] [CrossRef]
  20. Wei, Y.; Li, C.; Wang, Y.; Zhang, X.; Li, Q.; Xu, T. Regenerating sodium hydroxide from the spent caustic by bipolar membrane electrodialysis (BMED). Sep. Purif. Technol. 2012, 86, 49–54. [Google Scholar] [CrossRef]
  21. Du, C.; Du, J.R.; Zhao, X.; Cheng, F.; Ali, M.E.A.; Feng, X. Treatment of Brackish Water RO Brine via Bipolar Membrane Electrodialysis. Ind. Eng. Chem. Res. 2021, 60, 3115–3129. [Google Scholar] [CrossRef]
  22. Gao, W.; Wei, X.; Chen, J.; Jin, J.; Wu, K.; Meng, W.; Wang, K. Recycling Lithium from Waste Lithium Bromide to Produce Lithium Hydroxide. Membranes 2021, 11, 759. [Google Scholar] [CrossRef]
  23. Tian, H.; Yan, X.; Zhou, F.; Xu, C.; Li, C.; Chen, X.; He, X. Effect of process conditions on generation of hydrochloric acid and lithium hydroxide from simulated lithium chloride solution using bipolar membrane electrodialysis. SN Appl. Sci. 2022, 4, 47. [Google Scholar] [CrossRef]
  24. Song, Y.; Zhao, Z. Recovery of lithium from spent lithium-ion batteries using precipitation and electrodialysis techniques. Sep. Purif. Technol. 2018, 206, 335–342. [Google Scholar] [CrossRef]
  25. Zhu, M.; Tian, B.; Luo, S.; Chi, Y.; Aishajiang, D.; Zhang, Y.; Yang, M. High-value conversion of waste Na2SO4 by a bipolar membrane electrodialysis metathesis system. Resour. Conserv. Recycl. 2022, 186, 106556. [Google Scholar] [CrossRef]
  26. Lin, X.; Pan, J.; Zhou, M.; Xu, Y.; Lin, J.; Shen, J.; Gao, C.; Van der Bruggen, B. Extraction of Amphoteric Amino Acid by Bipolar Membrane Electrodialysis: Methionine Acid as a Case Study. Ind. Eng. Chem. Res. 2016, 55, 2813–2820. [Google Scholar] [CrossRef]
  27. Wei, X.; Gao, W.; Wang, Y.; Wu, K.; Xu, T. A green and economical method for preparing lithium hydroxide from lithium phosphate. Sep. Purif. Technol. 2022, 280, 119909. [Google Scholar] [CrossRef]
  28. Zhao, Y.; Xiang, X.; Wang, M.; Wang, H.; Li, Y.; Li, J.; Yang, H. Preparation of LiOH through BMED process from lithium-containing solutions: Effects of coexisting ions and competition between Na+ and Li+. Desalination 2021, 512, 115126. [Google Scholar] [CrossRef]
  29. Strathmann, H.; Krol, J.J.; Rapp, H.J.; Eigenberger, G. Limiting current density and water dissociation in bipolar membranes. J. Membr. Sci. 1997, 125, 123–142. [Google Scholar] [CrossRef]
  30. Qiu, Y.; Yao, L.; Tang, C.; Zhao, Y.; Zhu, J.; Shen, J. Integration of selectrodialysis and selectrodialysis with bipolar membrane to salt lake treatment for the production of lithium hydroxide. Desalination 2019, 465, 1–12. [Google Scholar] [CrossRef]
  31. Gao, W.; Fang, Q.; Yan, H.; Wei, X.; Wu, K. Recovery of Acid and Base from Sodium Sulfate Containing Lithium Carbonate Using Bipolar Membrane Electrodialysis. Membranes 2021, 11, 152. [Google Scholar] [CrossRef]
  32. Wei, X.; Wang, Y.; Yan, H.; Jiang, C.; Xu, T. A sustainable valorization of neopentyl glycol salt waste containing sodium formate via bipolar membrane electrodialysis. Sep. Purif. Technol. 2020, 254, 117563. [Google Scholar] [CrossRef]
  33. Jiang, C.; Zhang, Y.; Feng, H.; Wang, Q.; Wang, Y.; Xu, T. Simultaneous CO2 capture and amino acid production using bipolar membrane electrodialysis (BMED). J. Membr. Sci. 2017, 542, 264–271. [Google Scholar] [CrossRef]
  34. Wilson; Elizabeth, K. Gearing up for Genomics Protein Avalanche. (cover story). Chem. Eng. News 2000, 78, 41. [Google Scholar] [CrossRef]
  35. Chen, G.; Wang, Z.; Luo, N. Domestic production process and cost analysis of lithium hydroxide. China Met. Bull. 2020, 5, 9–10. [Google Scholar]
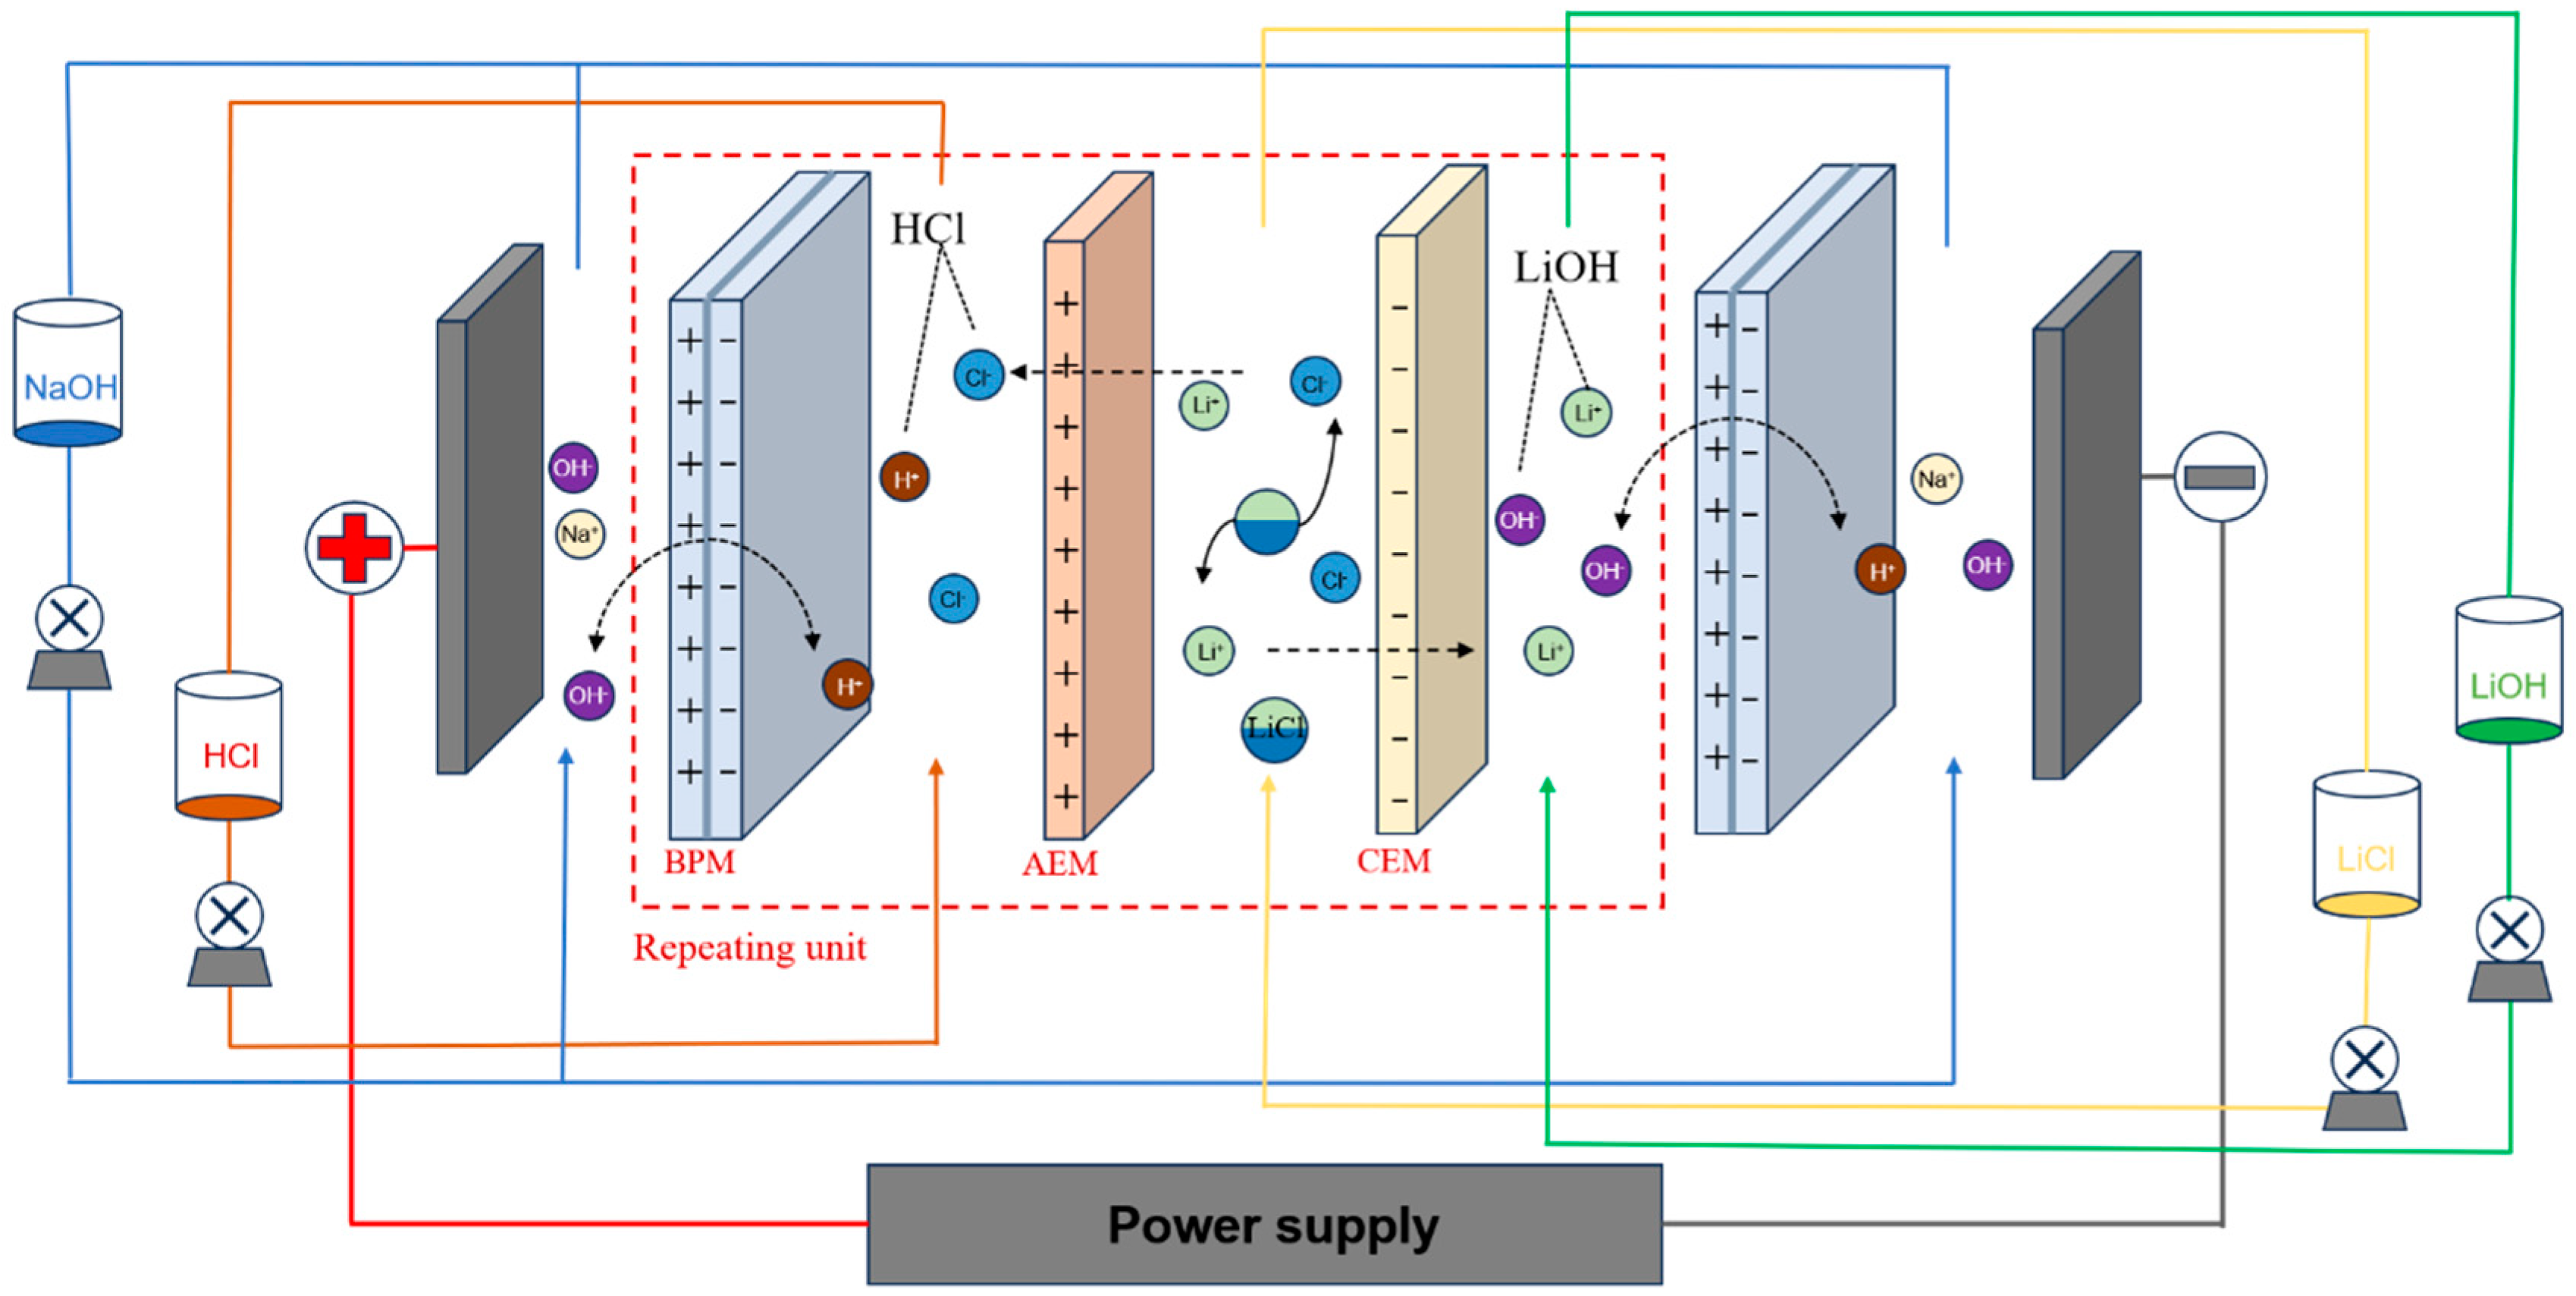
Figure 1. Experimental principle graph of BMED with three compartments.
Separations 11 00146 g001
Figure 2. (a) Changes of current efficiency; (b) Changes of specific energy consumption in the current density condition experiment.
Separations 11 00146 g002
Figure 3. The impact of current density on the electrodialysis performance of bipolar membranes: (a) migration rate of Li+; (b) lithium hydroxide recovery rate; (c) specific energy consumption; (d) current efficiency; (e) content of Li+ in the acid room; and (f) content of Cl in the base room.
Separations 11 00146 g003
Figure 4. Effect of conductivity of lithium chloride solution during electrodialysis at 50 mA/cm2 of 1 M lithium chloride solution: (a) resistance; (b) voltage; (c) power; and (d) specific energy consumption.
Separations 11 00146 g004
Figure 5. Changes in (a) current efficiency; (b) specific energy consumption in the experiment at various lithium chloride concentrations.
Separations 11 00146 g005
Figure 6. Effect of lithium chloride concentration on (a) migration rate of Li+; (b) lithium hydroxide recovery rate; (c) specific energy consumption; (d) current efficiency; (e) content of Li+ in acid room and (f) content of Cl in base room for BMED process.
Separations 11 00146 g006
Figure 7. Effect of conductivity of lithium chloride solution during electrodialysis at 50 mA/cm2 in 1.5 M lithium chloride solution: (a) resistance; (b) voltage; (c) power; and (d) specific energy consumption.
Separations 11 00146 g007
Figure 8. Changes in (a) current efficiency; (b) specific energy consumption in the pH condition experiment of lithium chloride solution.
Separations 11 00146 g008
Figure 9. Effect of pH of lithium chloride solution on the electrodialysis performance of bipolar membranes: (a) lithium-ion migration rate; (b) Lithium hydroxide recovery rate; (c) specific energy consumption; (d) current efficiency; (e) the change in volume of the solution in the base room; and (f) the concentration difference between the solution in the acid room and the solution in the base room.
Separations 11 00146 g009
Figure 10. Effect of volume ratio of the feed and base solution on BMED function: (a) Lithium hydroxide concentration in the base room; (b) Specific energy consumption and current efficiency.
Separations 11 00146 g010
Figure 11. Schematic diagram of ion migration process during BMED process. B: bipolar membrane; A: anion-exchange membrane; C: cation-exchange membrane.
Separations 11 00146 g011
Table 1. Parameters of ion exchange membranes.
CharacteristicsCT-4ATDBP-2
Thickness (mm)0.100.160.28
Bursting intensity (MPa)>0.5>1.0>0.5
Resistance (0.5 N HCl) (Ω·cm2)3.64.3\
Operating temperature (°C)25–4025–4025–40
Water dissociation voltage (V)\\0.9–1.3
Operating pH0–140–40–14
Table 2. Economic feasibility of BMED compared to lithium sulphate causticizing technology.
\Unit Consumption of Auxiliary Materials (t/t LiOH)Unit Price of Auxiliary Materials (USD/t LiOH)Total (USD/t LiOH)
Sulfuric acid1.5234.5852.56
Sodium Carbonate0.025193.644.841
Sodium hydroxide1.18262.79310.1
Calcium carbonate0.689.953.94
\Unit specific energy consumptionUnit price of energyTotal (USD/t LiOH)
Electrical3500 (KWh/t LiOH)0.1007 (USD/KWh)352.45
Coal3.15 (t/t LiOH)6.92 (USD/t LiOH)21.798
Table 3. Optimal conditions.
Current DensityConcentration of LiCl Feed pH
50 mA/cm21.5 M2.5 or 3.5
Disclaimer/Publisher’s Note: The statements, opinions and data contained in all publications are solely those of the individual author(s) and contributor(s) and not of MDPI and/or the editor(s). MDPI and/or the editor(s) disclaim responsibility for any injury to people or property resulting from any ideas, methods, instructions or products referred to in the content.