Abstract
The cultivation of microalgae from municipal wastewater, while simultaneously removing nutrients from the water column, has the potential to aid biodiesel production and carbon dioxide fixation, thereby alleviating the pressure of energy shortages. In this research, different ratios of sodium bicarbonate and glucose were used to prepare simulated municipal wastewater. The results demonstrated that microalgae were most effectively treated under one-stage direct treatment conditions. During direct culture, the most effective treatment was observed for IAA-3, which exhibited a dry weight of 1.4363 g/L and a lipid content of 25.05% after stimulation with 0.0005 M NaHCO3. In contrast, NaHCO3-2 demonstrated optimal performance during the secondary culture, with a dry weight of 1.6844 g/L and a lipid content of 18.05%. Finally, the economic, social and environmental benefits of direct treatment (IAA-3) and secondary treatment NaHCO3-2 were analyzed. The benefits of direct treatment were found to be USD 0.50989/L, while those of secondary treatment were USD 0.43172/L. For each tonne of municipal wastewater treated, the carbon sequestration benefits of IAA-3 during direct treatment and NaHCO3-2 during secondary treatment were USD 0.45645 and USD 0.85725, respectively.
1. Introduction
Contemporary human society has been confronted with a multitude of environmental crises, including water pollution, energy scarcity and air pollution [1]. Fossil fuels are non-renewable and over-exploitation has depleted their stocks [2]. One direct consequence of the utilization of fossil fuels is the concomitant increase in carbon emissions and the intensification of global warming. Furthermore, the contamination of urban waterways is becoming increasingly severe as the level of economic development and the rate of urbanization increase [3,4,5]. In light of the challenges posed by these crises, it is imperative to address pollution issues and identify new renewable, clean energy sources. Due to the distinctive capacity of microalgae to remove pollutants, microbial methods are regarded as among of the most efficacious, cost-effective, energy-saving and promising water treatment technologies. This biological method is attracting increasing attention [6,7,8]. Microalgae can be cultivated using urban sewage as a substrate, and can also absorb nitrogen (N) and phosphorus (P), remove organic pollutants and produce biolipids, thereby alleviating energy shortages [9,10]. In addition, microalgae can perform bioremediation and are able to sequester carbon, with the production of 1 kg of microalgal biomass estimated to fix 1.8 kg of CO2 [11,12]. Scenedesmus obliquus (S. obliquus) is a particularly suitable species of algae for the production of biofuels and the sequestration of CO2 [13]. In the field of wastewater treatment, the quality of the biolipids produced by microalgae is typically regarded as equivalent to that of petrochemical diesel [14,15].
Many researchers have conducted studies on the utilization of microalgae for the removal of nutrients, the fixation of CO2 and the production of biolipids [16,17]. Wang et al. used mycelial pellets as a biomass material that could adsorb pollutants as a biosorbent or combine other substances and organisms to form a self-immobilized biomixture (SIB) to remove pollutants from wastewater [18]. However, they only considered the potential for enhancing microalgae performance by incorporating stimulants (e.g., adjusting the CO2 input concentration and introducing varying stimulant concentrations) without evaluating the practical and economic benefits that could be derived from integrating distinct culture methods. Regarding the culture methods employed, the current microalgae culture systems could be divided into one-stage and two-stage cultures. In the course of the comparison of the respective performance, however, only one-stage culture systems were used for each of the aforementioned systems. Furthermore, the economic and technical investment required for the implementation of different cultural methods varies. When a technology is introduced to the market, it is important to consider the resource consumption throughout its entire life cycle. The environmental impact of microalgae-based biofuels might not be as beneficial as initially anticipated, and the net energy gained from the biofuel production process might even be negative [19]. Consequently, the mass balance of carbon is necessary to quantify the recovery rates, consumption yields and efficiency of biomass production systems and to identify opportunities for operational optimization. Kishi et al. studied the cultivation of Arthrospira sp. by carbon mass balance and found that dissolved organic carbon accounted for 16–24% of the total photosynthetic carbon, while the final concentration of assimilated carbon reached 260–367 mg/L [20]. Once technology has been successfully marketed, the economic and technical benefits, the technical cost of the wastewater treatment, the cost of obtaining the biolipid, the final sale price, the fixed cost of the CO2 and the social benefits are all taken into account. Judd et al. conducted an economic and technical analysis which demonstrated that the integrated use of nutrients and carbon dioxide from wastewater by microalgae was 35–86% less costly than previously published studies. Furthermore, the cost of avoiding the purchase of fertilizers through the use of wastewater nutrients was found to be 12–27% [21]. However, the majority of articles that discuss biolipid production, decontamination and carbon sequestration focus on how to improve lipid production and nutrient removal efficiency at the single or two-part level and the few articles that do consider all three parts only consider external additive stimuli, mainly using input CO2 as the stimulus condition for these performance analyses. However, this pathway is still limited by the high cost of carbon capture and transportation, as well as a series of challenges in algae cultivation technology. In previous studies, a process has been envisioned that uses bicarbonate produced from carbon capture as feedstock for algae culture. This system was latterly named the bicarbonate-based integrated carbon capture and algae production system (BICCAPS) [22]. In addition, there is a paucity of articles that explore economic and technical analysis.
In this context, this paper studies the biomass concentration, decontamination and biolipid production efficiency of S. obliquus under different proportions of NaHCO3 and glucose with the addition of plant growth hormones (IAA, 2,4-D, 6-BA) in varying orders. Furthermore, the mass balance calculations, economic and technical analyses of one- and two-stage cultures were conducted to ascertain the quantity of carbon fixed by distinct culture methods for microalgae and to quantify the recovery rate, consumption yield and efficiency of the biomass production system. The objective was to propose innovative solutions for the treatment and reuse of wastewater.
2. Methods and Materials
2.1. Microorganism and Medium Composition
The study employed the use of Scenedesmus obliquus, which was sourced from the algal collection of the Institute of College of Life Science and Technology, Harbin Normal University, Harbin 150020, China. The S. obliquus used in the laboratory was cultivated in BG-11 medium for 7 days at 25 °C with 100 rpm shaking under a light intensity of 2000–4000 Lx after which they were transferred to an urban simulated domestic sewage environment under different sodium bicarbonate (NaHCO3) ratio conditions [23]. The simulated domestic sewage water was manually deployed with the following characteristics: Chemical Oxygen Demand (COD): 280 mg/L; Total Nitrogen (TN): 40 mg/L; Total Phosphorus (TP): 6 mg/L; and pH:7.5 ± 0.5. All experiments were performed with a working volume of 100 mL in a 250 mL conical bottle (Fisherbrand, MA, USA). Microalgae cells were grown in the different types of wastewater described above. The basal medium is presented in Table 1.

Table 1.
BG-11 medium main components [24].
2.2. Cultivation Conditions
To prevent any interference from residual inorganic carbon sources in the original medium, the algae were cultured to the logarithmic stage, filtered through filter paper (pore size 0.45 μm, mixed cellulose lipids, aqueous system) and rinsed with water. The algae were diluted with sterilized simulated municipal sewage medium, with varying ratios of NaHCO3 to glucose (3:1, 2:1, 1:1, 1:2, 1:3 and 0) and a COD of 280 mg/L, to achieve an initial algal density (OD680) (GENESYS 10S UV-VIS, Thermo) of 0.1 [25]. The medium was placed in a light incubator with a light-to-dark ratio of 12 h:12 h at a temperature of 25 ± 1 °C. There was no aeration during the culture process. The detailed stages of the cultural development are presented in Table 2.
Table 2.
Detailed training stages.
The culture was categorized into two distinct categories: direct and secondary culture. Both categories had a 14-day period, with the first 7 days representing the initial stage and the subsequent 7 days representing the subsequent stage. The initial stage was conducted with a 1:2 ratio of NaHCO3 to glucose. In contrast to the secondary cultures, the direct culture was based on the preferential selection of phytohormones. The optimal tailwater was then employed for the subsequent stage of secondary stimulation, with different concentrations of NaHCO3. In contrast, the secondary cultures were carried out at a 1:2 ratio of NaHCO3 to glucose in the initial stages. Finally, a comparison test was conducted between different concentrations of NaHCO3 and different plant hormones with the objective of achieving optimal results in promoting lipid production and carbon sequestration with a single stimulation condition. The growth index of microalgae, the water quality index, the carbon fixation efficiency and the lipid production properties were monitored on a daily basis throughout the experimental period.
2.3. Analytical Methods
Regarding the dry weight of cells, the 10 mL of algal solution was collected and centrifuged at 6000 r/min for 15 min, and the supernatant was removed, then washed with distilled water and filtered several times, dried at 60 °C to a constant weight and weighed as dry weight [26,27].
The classic method for the extraction of lipid is the chloroform–methanol extraction method followed by the weighing method for the determination of the lipid content. Dry microalgal cells were crushed in a mortar with liquid nitrogen before being extracted using a 1:1 v/v chloroform/methanol combination. Each extraction stage required the use of 100 mg dry cell and approximately 5 mL of solvent. The samples were stirred, subjected to an ultrasonic treatment for 30 min, allowed to sit for an hour and then centrifuged at 5000 rpm for 10 min. The process was carried out three times in order to completely extract all of the lipids. The solvent phase was pipette transferred and vacuum vaporized at 60 °C in a rotary evaporator. Following that, an analytical balance (MS, METTLER TOLEDO) was used to weigh the total lipids. The rate of organic carbon consumption was determined using a total organic carbon (TOC) analyzer. The concentration of dissolved inorganic carbon in the culture medium was determined by titration with an acid–base indicator [28]. The elemental analyzer analyzed the C of the dry weight algae. The carbon capture was evaluated by the mass of C element in the dry weight.
The main water quality indicators examined in this study were total phosphorus, (TP), total nitrogen (TN), ammonia nitrogen (NH4+-N) and chemical oxygen demand (COD). First, 5 mL samples from each culture were centrifuged at 5000 rpm for 5 min. According to Hach testing procedures, a DR3900 spectrophotometer (Hach Company, Loveland, CO) was then used to quantify the total nitrogen (TN) and total phosphorus (TP) at the start and conclusion of the culture period. According to Equation (1) (Gonçalves et al., 2016), the nutrient removal efficiencies were calculated using the following methodology [29]:
where Si and Sf correspond to the nutrient concentration (mg L−1) at the beginning and at the end of the cultivation time, respectively.
3. Results and Discussion
3.1. Effect of NaHCO3 Addition Ratio on Scenedesmus obliquus
3.1.1. Biomass Production
As illustrated in Figure 1, during the initial phase of incubation, the trends in cell biomass and absorbance were comparable. By day 7, the ratio of NaHCO3 to glucose was 1:2, resulting in a biomass of 0.3072 g/L, which was higher than that observed in the pure glucose culture. A comparison of the 1:2 to 3:1 cultivation ratios revealed a gradual decrease in the biomass concentration as the percentage of glucose decreased. Glucose used as external carbon can improve its accumulation of biomass, as observed in [30,31]. The addition ratio of 1:3 was found to be inferior to 3:1, indicating that the proportion of sodium bicarbonate should not be too small. The ratio of 1:2 was therefore identified as the most suitable. Although glucose is readily available to microalgae through glycolysis and the pentose phosphate pathway [32], adding part of NaHCO3 as a carbon source for photosynthesis has been demonstrated to significantly promote the growth of microalgae [33]. The following experiments were conducted in accordance with the ratio of 1:2.
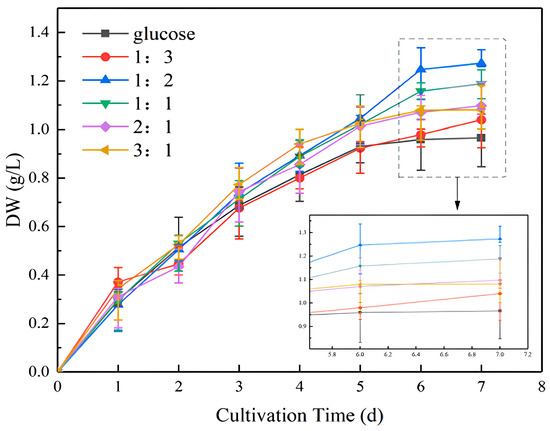
Figure 1.
Dry weight (DW) of microalgal biomass at different NaHCO3 dosing ratios.
3.1.2. Biolipid Productivity
Comparing the lipid production in the six groups of culture conditions (Figure 2), the 1:2 group exhibited the highest lipid production, exceeding 0.25 g/L, which was slightly higher than the 235.13 mg/L observed in the experiment conducted by Zhao et al. [34] and significantly higher than 173.53 mg/L in the experiment of Liu et al. [35]. The lipid content was moderate [36,37]. The lipid yield was in the order of the 1:1, 2:1, 3:1 and 1:3 group, with the lowest yield observed in the pure glucose group, at 0.16 g/L. The maximum difference in lipid content was 2.75%. The discrepancy between the remaining groups was relatively minor, with the difference between the pure glucose group and the 1:3 group being only 0.1%. This was consistent with the optical density values and biomass, which indicated that the 1:2 group continued to perform well.
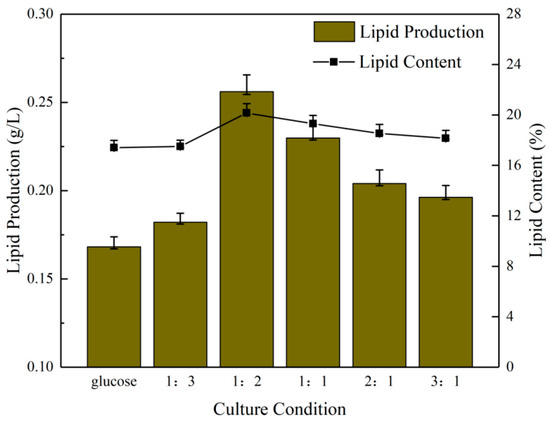
Figure 2.
Lipid production and lipid content of microalgae under different NaHCO3 dosing ratios.
3.1.3. Consumption of Carbon Sources
Table 3 shows the varying rates of total organic carbon (TOC) and inorganic carbon (IC) consumption at different sodium bicarbonate dosing rates in the context of microalgae carbon sequestration. The organic carbon consumption rate presented in Table 3 pertains to the rate of glucose organic carbon consumed by the microalgae, whereas the inorganic carbon consumption rate was heavily influenced by the bicarbonate. The maximum organic carbon consumption rate was 171.85 mg/L, corresponding to a bicarbonate consumption rate of 97.09 mg/L, which was lower than the rate found in study [38]. The disparity in the rate of HCO3− consumption might be attributed to the divergence in the pH of the culture medium resulting from the incorporation of sodium bicarbonate. The discrepancy between the 1:3 and 1:2 groups was minimal, with the 1:3 group exhibiting a higher inorganic carbon consumption. This might be attributed to the fact that organic carbon plays a more pivotal role in facilitating the uptake of inorganic carbon by microalgae [39]. Furthermore, the higher consumption of organic carbon than of inorganic carbon indicated that organic carbon is the preferred carbon source for microalgae in the presence of both organic and inorganic carbon [40].
Table 3.
Total organic carbon (TOC) and inorganic carbon (IC) consumption at different sodium bicarbonate dosing rates.
3.1.4. Nutrient Removal
Figure 3 illustrates the residual indicator content of the microalgae in the cultures under the six aforementioned culture conditions. Firstly, the residual content of ammonia nitrogen was not significantly different among the six culture conditions. The 1:2 group exhibited a slight advantage (1.3 mg/L). A subsequent examination of the residual content of total nitrogen (TN) revealed that the 1:2 group exhibited a marginal advantage over the 1:3 group (0.88 mg/L), while the pure glucose group exhibited the highest residual content of TN, exceeding the optimal group by 9.64 mg/L. S. obliquus displayed a high capacity for the degradation of TN. In the study by Xiong et al., the strain of S. obliquus was observed to degrade 100% of the TN [41].
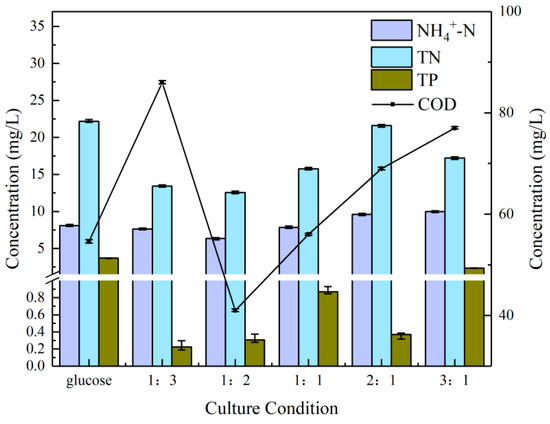
Figure 3.
Nutrient removal effects at different NaHCO3 dosing rates.
The difference in TP was more pronounced, with the 1:3 group exhibiting the greatest advantage (0.08 mg/L). The pure glucose group exhibited the lowest removal efficiency, with a residual content 3.48 mg/L higher than that of the 1:3 group. The low concentrations of CO2 could accelerate the biomass and lipid productivity of S. obliquus, which in turn promotes the degradation of phosphate. This has been achieved in a study with a TP removal efficiency of 95.65% [42]. Finally, a comparison of the remaining COD content revealed a similarly pronounced difference. The 1:2 group demonstrated the greatest absolute advantage (41 mg/L), with an efficiency of COD of 85.35%. The result was significantly higher than the efficiency of 82.80% for COD when S. obliquus was cultivated to treat lipid refinery effluent [43]. The 1:3 group was last (86 mg/L), with a residual content higher than that of the 1:1 group (56 mg/L), 2:1 group (69 mg/L) and 3:1 group (77 mg/L). Therefore, the 1:2 group was again first in the overall comparison.
3.2. Direct Culture
From the initial phase of the experiment, it became evident that the 1:2 ratio was more aligned with the design of the experiment. Consequently, the subsequent phase of the experiment was divided into two sections: the direct treatment and the second treatment.
3.2.1. Biomass, Biolipid Production and Decontamination
The initial stage of raw water (COD = 280, TP = 5, NH4+-N = 30, TN = 40) was treated directly at a ratio of sodium bicarbonate/glucose of 1:2. IAA, 2,4-D and 6-BA were all prepared as 1 g/L master mixes for standby. The initial concentrations of each plant growth regulator in municipal wastewater were set at 0, 0.5, 1, 5, 10, 15 and 20 mg/L. The optimum plant hormones and their corresponding ratios were determined by comparing the growth indicators of microalgae, lipid production, carbon dioxide sequestration and decontamination. This was followed by the secondary stimulation with sodium bicarbonate. The gradients of the sodium bicarbonate were set at 0, 0.0005, 0.001, 0.0005 and 0.001 M. The growth parameters, lipid production, carbon dioxide sequestration and decontamination of the algae were again compared in order to identify the optimal stimulation conditions. The effects of growth, lipid production and nutrient removal during the first seven days are illustrated in Figure 4.
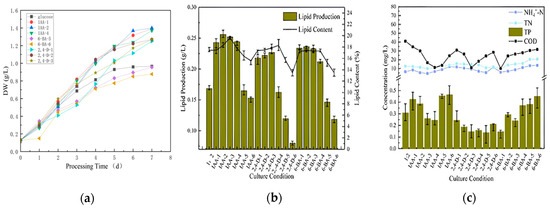
Figure 4.
Dry weight (a), lipid production (b), and decontamination (c) of microalgae cultured directly for the first 7 days.
Figure 4a presents the biomass data, which indicate that IAA had the highest concentration of biomass at 1 mg/L. This was followed in descending order by IAA at 0.5 mg/L and IAA at 10 mg/L. The data for all the concentrations of IAA were superior to those of the blank group (pure glucose group). The 6-BA group exhibited a slight decline in biomass concentration. The high concentration groups (15 mg/L and 20 mg/L) demonstrated a reduction in biomass concentration compared to the blank group. The 2,4-D rationing conditions were the most unfavorable, with the only groups that exhibited higher biomass concentrations than the blank group being the low concentration groups (0.5 mg/L, 1 mg/L and 5 mg/L). The 5 mg/L group exhibited the highest biomass concentration (1.2711 g/L). In general, the low concentration group exhibited greater strength than the high concentration group. The IAA group exhibited superior performance to the 6-BA group and to the 2,4-D group.
A comparison of the lipid content (Figure 4b) revealed that the lowest lipid concentration was observed in 2,4-D-6. This was contrary to the expectation that higher concentrations of plant growth regulators would lead to increased lipid content. This trend was consistent across different regulators, with 2,4-D-6, 6-BA-6 and IAA-6 all exhibiting lower lipid concentrations. It was unexpected that even at the penultimate highest concentration within each group, the lipid content remained relatively low. Consequently, all six ratios contained less lipid than the original group treated with unstimulated sodium bicarbonate and glucose at a 1:2 ratio. The subsequent comparison of decontamination capacity (Figure 4c) revealed minimal disparity in ammonia nitrogen and total nitrogen (TN), with the primary focus on total phosphorus (TP) and chemical oxygen demand (COD). However, there were a few groups where the removal of ammonia, TN, TP and COD was not as effective as in the blank group. This indicates that when using plant growth regulators to decontaminate and clean water with microalgae, it is crucial to maintain a precise concentration range. This also demonstrates the necessity of controlling the appropriate concentration range when using plant growth regulators to clean water with microalgae.
3.2.2. Consumption of Carbon Sources
Table 4 shows that the top five groups in terms of organic carbon consumption rate were 6-BA (0.5 mg/L), 2,4-D (5 mg/L) and IAA (10 mg/L, 15 mg/L, 5 mg/L), with the blank group in last place. The organic carbon consumption rates of all the stimulated groups were higher than before stimulation. Indoleacetic acid exhibited the widest range of concentrations, encompassing three concentration groups in the middle concentration range, which had a low organic carbon consumption rate in the low concentration range. In comparison, the inorganic carbon consumption rates revealed that the IAA group exhibited the greatest efficiency, followed by the 6-BA group and finally the 2,4-D group. The optimal concentration range for the IAA and 2,4-D groups was 5–10 mg/L, while the optimal concentration range for the 6-BA group was 0.5–1 mg/L. Therefore, when determining the application of plant growth regulators to stimulate carbon sequestration in microalgae, it is important to pay attention to the variation of the corresponding concentrations.
Table 4.
Total organic carbon (TOC) and inorganic carbon (IC) consumption during direct culture.
3.2.3. Biomass, Biolipid Production and Decontamination
After a comprehensive evaluation, it was determined that IAA (5 mg/L) would be the optimal choice for the subsequent experiments. The tailwater treated with IAA (5 mg/L) was utilized to continue the stimulation experiment for seven days. During the seven-day period, different gradients of sodium bicarbonate (0, 0.0005 M, 0.001 M, 0.005 M, 0.01 M) were selected for secondary stimulation in order to facilitate a comparison of further growth indicators, lipid production capacity, carbon sequestration effect, detergency and water purification strength between the five groups.
Figure 5a illustrates that the growth indicators of the microalgae were favorable, with a dry weight that exceeded that of the unstimulated blank group at varying rates of sodium bicarbonate. The most notable of these was 0.005 M, which yielded a dry weight of 1.6148 g/L, followed by 0.001 M (1.4819 g/L), 0.0005 M (1.4363 g/L), 0.01 M (1.4263 g/L) and the blank group at 1.3575 g/L. The difference between the 0.0005 M and 0.01 M groups was not statistically significant, with all microalgal biomass that had undergone secondary stimulation with sodium bicarbonate exceeding that of the pure glucose group. The highest group exhibited a suspension difference of 0.2573 g/L in comparison to the blank group, indicating that sodium bicarbonate facilitated the growth of the algae.
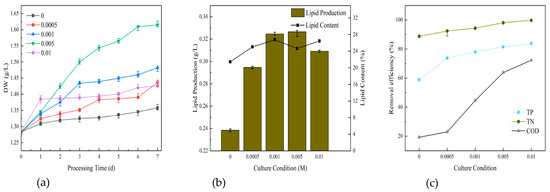
Figure 5.
Dry weight (a), lipid production (b), and removal efficiency (c) of microalgae cultured directly for the post 7 days.
Figure 5b illustrates the lipid production in order of priority. The yields were 0.005 M (0.327 g/L), 0.001 M (0.325 g/L), 0.01 M (0.309 g/L), 0.0005 M (0.295 g/L) and the blank group (0.238 g/L). The lipid content was ranked in order of priority as 0.001 M (26.75%), 0.01 M (26.46%), 0.0005 M (25.05%), 0.005 M (24.67%) and the blank group (21.45%). It was evident that the high content of microalgal lipid and grease production was primarily concentrated in the medium to high concentration of sodium bicarbonate. This suggests that sodium bicarbonate might facilitate the lipid production of algae.
The comparison of the purification effect of the microalgae on water under different concentrations of sodium bicarbonate is presented in Figure 5c. The results indicate that the highest removal efficiency of TN, TP and COD was achieved when sodium bicarbonate was applied at 0.01 M. This was followed by 0.005 M, 0.001 M, 0.0005 M and finally the blank group. As the concentration of sodium bicarbonate increased, the removal of nutrients gradually increased as well. The difference in COD was the greatest, with a difference of more than 40% before and after. However, the difference between the COD removal efficiency and the blank group was not significant when the sodium bicarbonate concentration was 0.0005 M. The difference between the pre-treatment and post-treatment values for TP was in the middle range, approximately 20%. The difference in TN was the smallest, with a difference of less than 10% before and after. Overall, the four sodium bicarbonate dosing concentrations employed in the experiment demonstrated superior efficiency compared to the blank group. The highest removal efficiency for TN was observed, exceeding 90%. TP exhibited moderate efficiency, ranging from 73.83% to 83.83%. In contrast, COD exhibited the lowest efficiency, with a removal efficiency of only 19.28% when sodium bicarbonate was added at 0.0005 M. The highest removal efficiency of 72.29% was achieved at 0.01 M.
3.2.4. Consumption of Carbon Sources
This was followed by a comparison of the carbon sequestration effects in the second stage (Table 5). The rate of inorganic carbon consumption in the different concentrations of sodium bicarbonate was higher than that in the blank group. The organic carbon of the substrate was basically not consumed, and the microalgae were basically in an autotrophic state during this cycle. The inorganic carbon source was fixed for photosynthetic autotrophy. This was corroborated by Aishvarya et al., who demonstrated that the fixation of dissolved carbon dioxide in the form of bicarbonate facilitates increased biomass productivity [44].
Table 5.
Total organic carbon (TOC) and inorganic carbon (IC) consumption in direct culture.
3.3. Secondary Culture
Experiments in secondary cultures were performed on tailwater treated for 7 days at the ratio of sodium bicarbonate to glucose of 1:2. We used different concentrations of sodium bicarbonate (0.0005 M, 0.001 M, 0.005 M and 0.01 M) and different concentrations of phytohormones (IAA (0.5, 1, 5, 10, 15 and 20 mg/L), 2,4-D (0.5, 1, 5, 10, 15 and 20 mg/L) and 6-BA (0.5, 1, 5, 10, 15 and 20 mg/L)) for the stimulation experiments. After testing the water quality of the sewage after the sodium bicarbonate/glucose ratio of 1:2 treatment, the water quality index at this time was obtained. COD was 41 mg/L, TP was 0.3 mg/L and TN was 12 mg/L, which met the water quality requirements of the initial sedimentation tank. We continued to grow inclined grid algae with the tailwater for the secondary culture. After 7 days, the microalgae growth index, decontamination characteristics, lipid production performance and carbon fixation effect were recorded.
3.3.1. Biomass, Biolipid Production and Decontamination
Figure 6a illustrates the dry weight of the microalgae throughout the growth cycle in the secondary culture. The dry weight of the microalgae during this growth cycle differed from that of the previous phase. Over time, the dry weight fluctuated, indicating that the microalgae were approaching saturation. The biomass of most of the plant growth regulator-dosed microalgae exhibited a gradual decline in growth, while the growth indicators remained elevated in the 0.01 M and 0.005 M sodium-bicarbonate-dosed microalgae. The observed decline in microalgal biomass might be attributed to the decomposition of sodium bicarbonate in the culture solution, which resulted in the formation of a certain concentration of CO2 and HCO3− to promote the metabolic function of the algal cells during the initial stage of cultivation [45,46]. However, as the microalgae consumed the inorganic carbon sources, they were unable to carry out photosynthetic autotrophy, but the cells remained in a relatively active physiological state; hence, the consumption of inorganic carbon sources prevented the microalgae from carrying out photosynthetic autotrophy, resulting in a gradual flattening or even a decline in the biomass of the microalgae in the later stages.
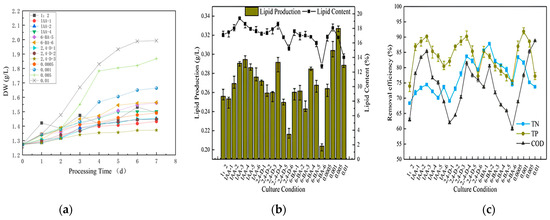
Figure 6.
Dry weight (a), lipid production (b), and removal efficiency (c) of microalgae in secondary cultured for the post 7 days.
The lipid accumulation in the secondary culture conditions is illustrated in Figure 6b, showing varying lipid content and yield of algae under different phytohormones and concentrations. In the majority of instances, the lipid content and lipid yield following stimulation were inferior to the blank group. The lipid yield in the control group was 0.2561 g/L, and the groups lower than the control group were IAA (0.5 mg/L), 2,4-D (15 and 20 mg/L) and 6-BA (5 and 20 mg/L). The three groups with the highest lipid content were those treated with sodium bicarbonate (0.005 M and 0.001 M) and IAA (10 mg/L). Although plant hormones can enhance photosynthesis in microalgae by augmenting the activity of a pivotal enzyme in carbon fixation (Rubisco) and a pivotal enzyme in lipid synthesis (ACCase) and facilitate enhanced photosynthesis [47,48], further research is necessary to ascertain the extent of their impact on microalgal photosynthesis. The incorporation of inorganic carbon markedly augmented the fixed carbon of the microalgae, thereby suggesting that the carbon within the system constituted the principal limiting factor in the lipid production of microalgae in comparison to plant hormones (under hypotrophy conditions). The lipid and grease content of the samples were determined. The three groups with the highest lipid content were IAA (5 and 10 mg/L) and 2,4-D (10 mg/L). Collectively, sodium bicarbonate (0.005 M and 0.001 M) exhibited the highest lipid yield at 0.3271 g/L and 0.3040 g/L, respectively. In contrast, IAA (10 mg/L) exhibited the highest lipid yield at 19.40%. In comparison to other plant growth regulators, the lipid yield and lipid content of all the gradients of IAA were found to be higher than the pure glucose group. The highest lipid yield was observed at 10 mg/L (0.2946 g/L), while the highest lipid content was observed at 5 mg/L (18.60%). The 2,4-D group exhibited the highest lipid yield at 10 mg/L (0.2915 g/L), accompanied by the highest corresponding lipid content. The 6-BA group demonstrated the highest lipid production (0.2846 g/L) at 10 mg/L and the highest lipid content (17.57%) at 0.5 mg/L. However, the lipid content from all the concentration gradients of the plant growth regulators was not as beneficial as that of the sodium bicarbonate at 0.005 M.
The removal efficiencies of the different plant growth regulators exhibited a notable variation with concentration, as illustrated in Figure 6c. IAA exhibited a marginal discrepancy of 5% for TN, a more pronounced discrepancy of over 10% for TP and the most significant discrepancy of nearly 20% for COD. IAA exhibited the highest removal efficiency at a concentration of 5 mg/L, with a TN removal efficiency of 74.45%, which was similar to the TN removal efficiency rate found in prior research [49].
In addition, the removal efficiency of the different plant growth regulators varied significantly with the change in concentration. The difference in TN was not significant, but the difference in TP was slightly larger, exceeding 10%. COD exhibited the largest difference, approaching 20%. The data indicated that IAA exhibited the highest removal efficiency at a concentration of 5 mg/L. At medium and high concentrations, the removal efficiency was the lowest, with TN reaching 70.07% (15 mg/L), TP reaching 80.49% (20 mg/L) and COD reaching 68.78% (20 mg/L). A comparison with 2,4-D revealed that the difference in TN was minimal, with a maximum of 5%, the TP difference was 13% and COD difference was even more pronounced, exceeding 20%. The data indicated that the optimal removal efficiency was achieved at a concentration of 10 mg/L for 2,4-D, with a removal rate of 69.10% for TN, 90.24% for TP and 81.46% for COD. The lowest removal efficiency exhibited no linear trend, with TN achieving a removal rate of 73.24% (1 mg/L), TP achieving a removal rate of 77.24% (20 mg/L) and COD achieving a removal rate of 61.95% (0.5 mg/L), with COD this time being even lower than that in the blank group.
Comparing the different sodium bicarbonate dosages revealed that the maximum TN removal efficiency of 0.0005 M was 83.45%, while the minimum removal efficiency of 0.01 M was 73.73%, representing a difference of approximately 10%. For TP, the highest removal efficiency was observed at 0.001 M (91.87%), while the lowest was observed at 0.01 M (77.98%), reflecting a significant difference of nearly 15%. Lastly, the removal efficiency of COD was compared, showing the highest removal efficiency of 88.78% at 0.01 M and the lowest of 68.78% at 0.0005 M, a difference of nearly 20%.
3.3.2. Consumption of Carbon Sources
The effects of the secondary culture conditions for the microalgae on carbon sequestration are presented in Table 6. The three groups with the highest inorganic carbon consumption rates were IAA (1 and 5 mg/L) and 2,4-D (10 mg/L). The secondary carbon fixation imposed by the addition of different concentrations of plant growth regulators was less than that of the sodium bicarbonate (0.01 M) group, which acted as a source of inorganic carbon. This allowed the microalgae to be photosynthetically autotrophic and subsequently better to fix inorganic carbon [50,51,52,53].
Table 6.
Total organic carbon (TOC) and inorganic carbon (IC) consumption in secondary culture.
3.3.3. Economic and Technical Analysis
At present, there has been a great effort to develop algal-based biolipid for eventual commercial use as an alternative fuel. For bioenergy production from algal biomass, the main obstacle for commercialization was its high capital and operating costs. A comprehensive techno-economic analysis conducted by Davis et al. showed that the cost of lipid production of USD 8.52/gal and USD 18.10/gal were achieved for open pond and photobioreactor (PBR) systems, respectively, by using 25 g/(m2·d) (open pond), 1.25 kg/(m2·d) (PBR) algal biomass productivity and 25% of lipid content as a baseline, bringing the final cost of diesel determined to be USD 9.84/gal for open pond systems and USD 20.53/gal for PBR systems, respectively [54].
One of the main obstacles to the commercialization of microalgae biolipid is the high cost of agent dosing [55,56]. In this culture system, sodium bicarbonate and IAA are employed to facilitate lipid production. Based on the lowest estimates of current market prices, the cost of technical-grade sodium bicarbonate is approximately USD 0.2/kg, while that of IAA is approximately USD 1275.9/kg. In order to ascertain whether the use of sodium bicarbonate and IAA improve the economic viability of the process, it is necessary to evaluate the cost of the drug per tonne of effluent treated for biolipid production from microalgae under different growth conditions.
In studies previously conducted using Nannochloropsis salina and Chlorella vulgaris, it was found that relatively large quantities of sodium bicarbonate (NaHCO3) or carbon dioxide (CO2) were required to maintain optimal carbon concentrations for algal growth. These quantities ranged from 5 to 10 g/L of NaHCO3 or 5 to 15% CO2 [57,58]. In this study, these cultivations were employed to either ensure biolipid productivity in algae through the synergistic effect of IAA and NaHCO3 or to improve algal growth levels by adding only a small amount of NaHCO3 (0.001 M). The use of single NaHCO3 resulted in reduced cultivation costs, while simultaneously increasing biomass and carbon fixation efficiency. In contrast, the combined supplementation of NaHCO3 and other nutrients increased the overall cultivation costs, but led to a higher biofuel content and pollutant removal efficiency.
The results of the calculations indicated that direct treatment consumes 5 g of IAA, 121.37 g of NaHCO3 and 191.72 g of glucose at a cost of USD 6.46 for 1 ton of wastewater, while secondary treatment consumes only 31.8 g of sodium bicarbonate and 123.08 g of glucose (in group NaHCO3-2) at a cost of USD 43.13 × 10⁻³, which should add 97.09 g of NaHCO3 and 171.85 g of glucose at a cost of USD 70.49 × 10⁻³ (NaHCO3:glucose = 1:2 during first 7 days) [59,60,61]. Combined with the efficiency of decontamination, secondary culture could be adopted if the plant only needed to consider decontamination for water purification. Using the lowest values for biolipid already sold at USD 1.36/L to USD 1.48/L [62], the benefits of direct treatment (0.35906 g/L of biolipid production) and secondary treatment (0.30403 g/L of biolipid production) were USD 0.50989/L and USD 0.43172/L, respectively [63].
In consideration of the social and environmental benefits, the tax of USD 15/t carbon emissions appears to be a reasonable and proportionate measure [64]. It could be observed that for each tonne of municipal wastewater treated, the carbon sequestration benefits of IAA-3 during direct treatment and NaHCO3 during secondary treatment were USD 0.45645 and USD 0.85725, respectively. Although income was low, the benefits to society were enormous [65].
In conclusion, the utilization of municipal wastewater by microalgae to synthesize substances essential for their growth while fixing CO2 and producing biolipid represents a viable solution to the issue of municipal wastewater from an environmental perspective, as it reduces CO2 in the atmosphere from a social standpoint and produces biolipid from an economic perspective, thereby conferring economic, social and environmental benefits.
4. Conclusions
This paper examined the maximum biomass, residual COD, TN and TP, lipid production, lipid content and carbon sequestration efficiency of microalgae under three distinct culture methods. The treatment of CO2 by sodium bicarbonate achieved the best effect of a 2:1 ratio of organic carbon to inorganic carbon. On this basis, a secondary stimulation of plant hormones and sodium bicarbonate was carried out. Furthermore, the decontamination performance of the microalgae was investigated, and the cost of water treatment, the income generated by biolipid production and the benefit of carbon sequestration were calculated. Fundamental experiments and technical support were provided for the development and utilization of microalgae.
Author Contributions
Conceptualization, F.C. and L.L.; Writing-original draft, W.C.; Writing—Review and Editing, W.C., H.Y., W.D., Z.R., D.P., F.C. and L.L.; Supervision, F.C.; Funding Acquisition, F.C. and L.L. All authors have read and agreed to the published version of the manuscript.
Funding
This work was supported by grants from the 2022 Ecological Environment Protection Research Project in Heilongjiang Province (HST2022GF007), 2023 Guangxi Ecological Engineering Vocational and Technical College Talent Introduction Research Project (GXSTKYZX202307007), Postdoctoral Research Foundation of Heilongjiang University of Science and Technology (2023BSH03), Natural Science Foundation of Heilongjiang Province (LH2023E125) and Fundamental Research Funds for the Universities of Heilongjiang Province (2023-KYYWF-0544).
Data Availability Statement
The data that support the findings of this study are available from the corresponding author, upon reasonable request.
Conflicts of Interest
The authors declare no conflicts of interest.
References
- Zhao, H.; Jiang, D.; Li, Y.; Cheng, H.; Wu, T. Evaluation of soil quality in different reclamation areas of Hequ open-pit mine dump. J. Min. Sci. Technol. 2023, 8, 419–427. [Google Scholar]
- Wu, F.; Li, F.; Zhao, X.; Bolan, N.S.; Fu, P.; Lam, S.S.; Mašek, O.; Ong, H.C.; Pan, B.; Qiu, X.; et al. Meet the challenges in the “Carbon Age”. Carbon. Res. 2022, 1, 1. [Google Scholar] [CrossRef]
- Li, L.; Han, J.; Huang, X.; Qiu, S.; Liu, X.; Liu, L.; Zhao, M.; Qu, J.; Zou, J.; Zhang, J. Organic pollutants removal from aqueous solutions using metal-organic frameworks (MOFs) as adsorbents: A review. J. Environ. 2023, 11, 111217. [Google Scholar] [CrossRef]
- Li, L.; Han, J.; Huang, L.; Liu, L.; Qiu, S.; Ding, J.; Liu, X.; Zhang, J. Activation of PMS by MIL-53(Fe)@AC composites contributes to tetracycline degradation: Properties and mechanisms. Surf. Interfaces 2024, 51, 104521. [Google Scholar] [CrossRef]
- Xu, Z.; Liu, X.; Peng, J.; Qu, C.; Chen, Y.; Zhang, M.; Liang, D.; Lei, M.; Tie, B.; Du, H. Tungsten–humic substances complexation. Carbon. Res. 2022, 1, 11. [Google Scholar] [CrossRef]
- Li, L.; Liang, T.; Liu, W.; Liu, Y.; Ma, F. A Comprehensive Review of the Mycelial Pellet: Research Status, Applications, and Future Prospects. Ind. Eng. Chem. Res. 2020, 59, 16911–16922. [Google Scholar] [CrossRef]
- Zhao, X.; Guo, M.; Zhang, T.; Bai, S.; Meng, Y.; Tian, Y.; Yang, J.; Ma, F. Spatiotemporal dynamics of root exudates drive microbial adaptation mechanisms under day-night alterations in constructed wetlands. Chem. Eng. J. 2023, 477, 147311. [Google Scholar] [CrossRef]
- Li, L.; Liang, T.; Zhao, M.; Lv, Y.; Song, Z.; Sheng, T.; Ma, F. A review on mycelial pellets as biological carriers: Wastewater treatment and recovery for resource and energy. Bioresour. Technol. 2022, 355, 127200. [Google Scholar] [CrossRef]
- Wang, B.; Lan, C.Q. Biomass production and nitrogen and phosphorus removal by the green alga Neochloris oleoabundans in simulated wastewater and secondary municipal wastewater effluent. Bioresour. Technol. 2011, 102, 5639–5644. [Google Scholar] [CrossRef]
- Li, L.; Liang, T.; Qiu, S.; Zhang, Y.; Qu, J.; Liu, T.; Ma, F. A rapid and simplified method for evaluating the performance of fungi-algae pellets: A hierarchical analysis model. Sci. Total Environ. 2023, 860, 160442. [Google Scholar] [CrossRef] [PubMed]
- De, B.G.; Subramanian, G.; Mishra, S.; Sen, R. Raceway pond cultivation of a marine microalga of Indian origin for biomass and lipid production: A case study. Algal Res. 2014, 6, 201–209. [Google Scholar]
- Song, Z.; Bi, Y.; Zhang, J. Effect of arbuscular mycorrhiza and grass mulching on corn growth and soil water content in coal mining areas. J. Min. Sci. Technol. 2021, 6, 21–29. [Google Scholar]
- Malaguti, M.; Craveri, L.; Ricceri, F.; Riggio, V.; Zanetti, M.; Tiraferri, A. Dewatering of Scenedesmus obliquus Cultivation Substrate with Microfiltration: Potential and Challenges for Water Reuse and Effective Harvesting. Engineering 2023, 7, 1–18. [Google Scholar] [CrossRef]
- Nookwam, K.; Cheirsilp, B.; Maneechote, W.; Boonsawang, P.; Sukkasem, C. Microbial fuel cells with Photosynthetic-Cathodic chamber in vertical cascade for integrated bioelectricity, biodiesel feedstock production and wastewater treatment. Bioresour. Technol. 2022, 346, 126559. [Google Scholar] [CrossRef] [PubMed]
- Silambarasan, S.; Logeswari, P.; Sivaramakrishnan, R.; Incharoensakdi, A.; Cornejo, P.; Kamaraj, B.; Chi, N.T.L. Removal of nutrients from domestic wastewater by microalgae coupled to lipid augmentation for biodiesel production and influence of deoiled algal biomass as biofertilizer for Solanum lycopersicum cultivation. Chemosphere 2021, 268, 129323. [Google Scholar] [CrossRef] [PubMed]
- Feng, W.; Wang, T.; Zhu, Y.; Sun, F.; John, P.; Wu, F. Chemical composition, sources, and ecological effect of organic phosphorus in water ecosystems: A review. Carbon. Res. 2023, 2, 12. [Google Scholar] [CrossRef]
- Yu, T.; Wang, L.; Ma, F.; Yang, J.; Bai, S.; You, J. Self-immobilized biomixture with pellets of Aspergillus niger Y3 and Arthrobacter. sp. ZXY-2 to remove atrazine in water: A bio-functions integration system. Sci. Total Environ. 2019, 689, 875–882. [Google Scholar] [CrossRef] [PubMed]
- Wang, L.; Yu, T.; Ma, F.; Vitus, T.; Bai, S.; Yang, J. Novel self-immobilized biomass mixture based on mycelium pellets for wastewater treatment: A review. Water Environ. Res. 2019, 91, 93–100. [Google Scholar] [CrossRef] [PubMed]
- Clarens, A.F.; Resurreccion, E.P.; White, M.A.; Colosi, L.M. Environmental life cycle comparison of algae to other bioenergy feedstocks. Environ. Sci. Technol. 2010, 44, 1813–1819. [Google Scholar] [CrossRef]
- Kishi, M.; Yamada, Y.; Katayama, T.; Matsuyama, T.; Toda, T. Carbon mass balance in Arthrospira platensis culture with medium recycle and high CO2 supply. Appl. Sci. 2020, 10, 228. [Google Scholar] [CrossRef]
- Judd, S.J.; Al, M.F.; Znad, H.; Al, K.A. The cost benefit of algal technology for combined CO2 mitigation and nutrient abatement. Renew. Sust. Energ. Rev. 2017, 71, 379–387. [Google Scholar] [CrossRef]
- Chi, Z.; Elloy, F.; Xie, Y.; Hu, Y.; Chen, S. Selection of Microalgae and Cyanobacteria Strains for Bicarbonate-Based Integrated Carbon Cap ture and Algae Production System. Appl. Biochem. Biotechnol. 2014, 172, 447–457. [Google Scholar] [CrossRef]
- Koh, H.G.; Jeong, Y.T.; Lee, B.; Chang, Y.K. Light stress after heterotrophic cultivation enhances lutein and biofuel production from a novel algal strain Scenedesmus obliquus abc-009. J. Microbiol. Biotechnol. 2022, 32, 378–386. [Google Scholar] [CrossRef] [PubMed]
- Pandey, S.; Narayanan, I.; Vinayagam, R.; Selvaraj, R.; Varadavenkatesan, T.; Pugazhendhi, A. A review on the effect of blue green 11 medium and its constituents on microalgal growth and lipid production. J. Environ. Chem. Eng. 2023, 11, 109984. [Google Scholar] [CrossRef]
- Abomohra, A.E.; Jin, W.; Sagar, V.; Ismail, G.A. Optimization of chemical flocculation of Scenedesmus obliquus grown on municipal wastewater for improved biodiesel recovery. Renew. Energ. 2018, 115, 880–886. [Google Scholar] [CrossRef]
- Ansari, F.A.; Ravindran, B.; Gupta, S.K.; Nasr, M.; Rawat, I.; Bux, F. Techno-economic estimation of wastewater phycoremediation and environmental benefits using Scenedesmus obliquus microalgae. J. Environ. Manag. 2019, 240, 293–302. [Google Scholar] [CrossRef]
- Sydney, E.B.; Sturm, W.; Carvalho, J.C.; Thomaz-Soccol, V.; Larroche, C.; Pandey, A.; Soccol, C.R. Potential carbon dioxide fixation by industrially important microalgae. Bioresour. Technol. 2010, 101, 5892–5896. [Google Scholar] [CrossRef]
- Chen, Y.M.; Zhang, L.; Xu, C.; Vaidyanathan, S. Dissolved inorganic carbon speciation in aquatic environments and its application to monitor algal carbon uptake. Sci. Total Environ. 2016, 541, 1282–1295. [Google Scholar] [CrossRef] [PubMed]
- Gonçalves, A.L.; Rodrigues, C.M.; Pires, J.C.M.; Simões, M. The effect of increasing CO2 concentrations on its capture, biomass production and wastewater bioremediation by microalgae and cyanobacteria. Algal Res. 2016, 14, 127–136. [Google Scholar] [CrossRef]
- Huang, Y.; Luo, L.; Xu, K.; Wang, X.C. Characteristics of external carbon uptake by microalgae growth and associated effects on algal biomass composition. Bioresour. Technol. 2019, 292, 121887. [Google Scholar] [CrossRef]
- Mi, Y.; Yang, S.; Chen, J.; Li, Z.; Dong, L.; Wei, Q.; Tang, Y.; Ma, X. Carbon-induced effective lipid accumulation and self-flocculation for biofuel production of Tetradesmus obliquus FACHB-12. J. Clean. Prod. 2022, 355, 131813. [Google Scholar] [CrossRef]
- Ma, X.; Mi, Y.; Zhao, C.; Wei, Q. A comprehensive review on carbon source effect of microalgae lipid accumulation for biofuel production. Sci. Total Environ. 2022, 806, 151387. [Google Scholar] [CrossRef] [PubMed]
- Ratomski, P.; Hawrot-Paw, M.; Koniuszy, A. Utilisation of CO2 from sodium bicarbonate to produce Chlorella vulgaris biomass in tubular photobioreactors for biofuel purposes. Sustainability 2021, 13, 9118. [Google Scholar] [CrossRef]
- Zhao, Y.; Li, Q.; Gu, D.; Yu, L.; Yu, X. The synergistic effects of gamma-aminobutyric acid and salinity during the enhancement of microalgal lipid production in photobioreactors. Energy Convers. Manag. 2022, 267, 115928. [Google Scholar] [CrossRef]
- Liu, X.; Ji, B.; Li, A. Enhancing biolipid production and self-flocculation of Chlorella vulgaris by extracellular polymeric substances from granular sludge with CO2 addition: Microscopic mechanism of microalgae-bacteria symbiosis. Water Res. 2023, 236, 119960. [Google Scholar] [CrossRef] [PubMed]
- Miranda, A.M.; Ocampo, D.; Vargas, G.J.; Ríos, L.A.; Sáez, A.A. Nitrogen content reduction on Scenedesmus obliquus biomass used to produce biocrude by hydrothermal liquefaction. Fuel 2021, 305, 121592. [Google Scholar] [CrossRef]
- Neag, E.; Török, A.I.; Cadar, O.; Băbălău-Fuss, V.; Roman, C. Enhancing lipid production of Synechocystis PCC 6803 for biofuels production, through environmental stress exposure. Renew Energy 2019, 143, 243–251. [Google Scholar] [CrossRef]
- Choi, W.J.; Chae, A.N.; Song, K.G.; Park, J.; Lee, B.C. Effect of trophic conditions on microalga growth, nutrient removal, algal organic matter, and energy storage products in Scenedesmus (Acutodesmus) obliquus KGE-17 cultivation. Bioprocess. Biosyst. Eng. 2019, 42, 1225–1234. [Google Scholar] [CrossRef] [PubMed]
- Chandra, R.; Rohit, M.V.; Swamy, Y.V.; Venkata, M.S. Regulatory function of organic carbon supplementation on biodiesel production during growth and nutrient stress phases of mixotrophic microalgae cultivation. Bioresour. Technol. 2014, 165, 279–287. [Google Scholar] [CrossRef] [PubMed]
- Su, Y. Revisiting carbon, nitrogen, and phosphorus metabolisms in microalgae for wastewater treatment. Sci. Total Environ. 2021, 762, 144590. [Google Scholar] [CrossRef]
- Xiong, J.Q.; Cui, P.; Ru, S. Biodegradation of doxylamine from wastewater by a green microalga, Scenedesmus obliquus. Front. Microbiol. 2020, 11, 584020. [Google Scholar] [CrossRef] [PubMed]
- Shen, Q.; Jiang, J.; Chen, L.; Cheng, L.; Xu, X.; Chen, H. Effect of carbon source on biomass growth and nutrients removal of Scenedesmus obliquus for wastewater advanced treatment and lipid production. Bioresour. Technol. 2015, 190, 257–263. [Google Scholar] [CrossRef] [PubMed]
- Rajasulochana, P.; Subbiah, M.; Murthy, A.R. Bioremediation of oil refinery effluent by using Scenedesmus obliquus. Am. J. Sci. 2009, 5, 17–22. [Google Scholar]
- Aishvarya, V.; Pradhan, N.; Nayak, R.R.; Sukla, L.B.; Mishra, B.K. Enhanced inorganic carbon uptake by Chlorella sp. IMMTCC-2 under autotrophic conditions for lipid production and CO2 sequestration. J. Appl. Phycol. 2012, 24, 1455–1463. [Google Scholar] [CrossRef]
- Moll, K.M.; Gardner, R.D.; Eustance, E.O.; Gerlach, R.; Peyton, B.M. Combining multiple nutrient stresses and bicarbonate addition to promote lipid accumulation in the diatom RGd-1. Algal Res. 2014, 5, 7–15. [Google Scholar] [CrossRef][Green Version]
- Markou, G.; Vandamme, D.; Muylaert, K. Microalgal and cyanobacterial cultivation: The supply of nutrients. Water Res. 2014, 65, 186–202. [Google Scholar] [CrossRef] [PubMed]
- Babu, A.G.; Wu, X.; Kabra, A.N.; Kim, D.-P. Cultivation of an indigenous Chlorella sorokiniana with phytohormones for biomass and lipid production under N-limitation. Algal Res. 2017, 23, 178–185. [Google Scholar] [CrossRef]
- Guldhe, A.; Renuka, N.; Singh, P.; Bux, F. Effect of phytohormones from different classes on gene expression of Chlorella sorokiniana under nitrogen limitation for enhanced biomass and lipid production. Algal Res. 2019, 40, 101518. [Google Scholar] [CrossRef]
- Zheng, S.; Chen, S.; Wu, A.; Wang, H.; Sun, S.; He, M.; Wang, C.; Chen, H.; Wang, Q. Efficient nutrient removal of Pyropia-processing wastewater and rapid algal biomass harvesting by Scenedesmus obliquus combined with chitosan. J. Water Process Eng. 2023, 51, 103365. [Google Scholar] [CrossRef]
- Mohan, S.V.; Rohit, M.V.; Chiranjeevi, P.; Chandra, R.; Navaneeth, B. Heterotrophic microalgae cultivation to synergize biodiesel production with waste remediation: Progress and perspectives. Bioresour. Technol. 2015, 184, 169–178. [Google Scholar] [CrossRef]
- Terrado, R.; Pasulka, A.L.; Lie, A.A.; Orphan, V.J.; Heidelberg, K.B.; Caron, D.A. Autotrophic and heterotrophic acquisition of carbon and nitrogen by a mixotrophic chrysophyte established through stable isotope analysis. ISME J. 2017, 11, 2022–2034. [Google Scholar] [CrossRef] [PubMed]
- Li, Y.; Huang, A.; Gu, W.; Wu, S.; Xie, X.; Wang, G. Effects of inorganic carbon and light on acetate assimilation by Nannochloropsis oceanica (Eustigmatophyceae) in mixotrophic cultivation. Eur. J. Phycol. 2019, 55, 64–75. [Google Scholar] [CrossRef]
- Hu, H.; Li, J.Y.; Zhai, S.W.; Wu, D.D.; Zhu, S.G.; Zeng, R.J. Effect of inorganic carbon limitation on the conversion of organic carbon to total fatty acids by Monodus subterraneus. Sci. Total Environ. 2020, 737, 140275. [Google Scholar] [CrossRef] [PubMed]
- Davis, R.; Aden, A.; Pienkos, P.T. Techno-economic analysis of autotrophic microalgae for fuel production. Appl. Energy 2011, 88, 3524–3531. [Google Scholar] [CrossRef]
- Su, Y.; Song, K.; Zhang, P.; Su, Y.; Cheng, J.; Chen, X. Progress of microalgae biofuel’s commercialization. Renew. Sust. Energ. Rev. 2017, 74, 402–411. [Google Scholar] [CrossRef]
- Muhammad, G.; Alam, M.A.; Mofijur, M.; Jahirul, M.I.; Lv, Y.; Xiong, W.; Ong, H.C.; Xu, J. Modern developmental aspects in the field of economical harvesting and biodiesel production from microalgae biomass. Renew. Sust. Energ. Rev. 2021, 135, 110209. [Google Scholar] [CrossRef]
- Lam, M.K.; Lee, K.T. Effect of carbon source towards the growth of Chlorella vulgaris for CO2 bio-mitigation and biodiesel production. Int. J. Greenh. Gas. Control 2013, 14, 169–176. [Google Scholar] [CrossRef]
- Nunez, M.; Quigg, A. Changes in growth and composition of the marine microalgae Phaeodactylum tricornutum and Nannochloropsis salina in response to changing sodium bicarbonate concentrations. J. Appl. Phycol. 2016, 28, 2123–2138. [Google Scholar] [CrossRef]
- Bonfim-Rocha, L.; Silva, A.B.; Faria, S.H.B.; Vieira, M.; Souza, M. Production of Sodium Bicarbonate from CO2 Reuse Processes: A Brief Review. Int. J. Chem. React. Eng. 2020, 18, 20180318. [Google Scholar] [CrossRef]
- Bunsangiam, S.; Thongpae, N.; Limtong, S.; Srisuk, N. Large scale production of indole-3-acetic acid and evaluation of the inhibitory effect of indole-3-acetic acid on weed growth. Sci. Rep. 2021, 11, 13094. [Google Scholar] [CrossRef]
- Omodolor, I.S.; Kalidindi, S.; Walz, S.A.; Coleman, M.R.; Gogar, R.; Viamajala, S.; Granados, M.L.; Alba-Rubio, A.C. Soluble and reusable polymer-based catalysts with Brønsted and Lewis acidity for the one-pot synthesis of hydroxymethylfurfural from glucose. Catal. Sci. Technol. 2023, 13, 132–146. [Google Scholar] [CrossRef]
- Brar, K.K.; Kaur, G.; Magdouli, S.; Brar, S.K.; Soccol, C.R. Chapter 11—Lipids production using agricultural residues. In Biomass, Biofuels, Biochemicals; Soccol, C.R., Pandey, A., de Carvalho, J.C., Tyagi, R.D., Eds.; Elsevier: Amsterdam, The Netherlands, 2022; pp. 219–244. [Google Scholar]
- Phankosol, S.; Sudaprasert, K.; Lilitchan, S.; Aryusuk, K.; Krisnangkura, K. Estimation of Density of Biodiesel. Energy Fuels 2014, 28, 4633–4641. [Google Scholar] [CrossRef]
- Grainger, C.A.; Kolstad, C.D. Who Pays a Price on Carbon? Environ. Resour. Econ. 2010, 46, 359–376. [Google Scholar] [CrossRef]
- Li, L.; Chai, W.; Sun, C.; Huang, L.; Sheng, T.; Song, Z.; Ma, F. Role of microalgae-bacterial consortium in wastewater treatment: A review. J. Environ. 2024, 360, 121226. [Google Scholar] [CrossRef] [PubMed]


Disclaimer/Publisher’s Note: The statements, opinions and data contained in all publications are solely those of the individual author(s) and contributor(s) and not of MDPI and/or the editor(s). MDPI and/or the editor(s) disclaim responsibility for any injury to people or property resulting from any ideas, methods, instructions or products referred to in the content. |
© 2024 by the authors. Licensee MDPI, Basel, Switzerland. This article is an open access article distributed under the terms and conditions of the Creative Commons Attribution (CC BY) license (https://creativecommons.org/licenses/by/4.0/).