Article

Investigation of Flotation Bubbles Movement Behavior under the Influence of an Immersed Ultrasonic Vibration Plate

1
College of Mechanical and Electronic Engineering, Shandong University of Science and Technology, Qingdao 266590, China
2
College of Energy and Mining Engineering, Shandong University of Science and Technology, Qingdao 266590, China
*
Author to whom correspondence should be addressed.
Separations 2024, 11(8), 234; https://doi.org/10.3390/separations11080234
Submission received: 6 July 2024 / Revised: 23 July 2024 / Accepted: 25 July 2024 / Published: 31 July 2024
(This article belongs to the Special Issue Separation and Extraction Technology in Mineral Processing)

Abstract

:
Ultrasonic flotation is widely used as an efficient mineral separation method. Its efficiency is related to the adhesion behavior between fine particles and flotation bubbles, which can be influenced by the bubbles’ movement behavior. This paper used two immersed ultrasonic vibration plates to generate ultrasonic action and investigated the effect of ultrasonic action on the rising process of flotation bubbles. The distribution, aggregation and fusion, velocity, and other characteristics of bubbles generated by different needle apertures were studied by experimental and simulation methods. The results showed that a 0.4 mm needle produced bubbles that were more evenly spaced and more uniform in size and shape. The ultrasonic action can make the bubbles aggregate together and reduce the bubble rise velocity, as well as prolong their time in the flotation process at the same time. It is beneficial to the sufficient collision and adhesion behavior between flotation bubbles and particles, eventually improving the efficiency of mineral flotation.

1. Introduction

In recent years, extensive research has been devoted to gas–liquid two-phase flow since it is crucial for process control in mineral flotation. Theoretical research on bubble dynamics or deformation vibration reveals more about how they influence each other between the gas–liquid two-phase flow, significantly improving the production efficiency and quality of current industrial equipment [1,2,3,4]. Most control processes are non-linear, time-varying, and uncertain since the bubble-rising process in the liquid is a complex problem, which is affected by the coupling of numerous parameter factors such as fluid viscosity, mass and heat transfer, surface tension, compressibility, etc. [5]. Similarly, Ziegenhein and Lucas [6] observed the shape variation of bubbles in the column by considering different flow fields and bubble sizes. In this work, they found that the shape of bubbles is closely related to these influencing factors. Zhang et al. [7] indicated that the size of the bubbles was non-linearly and positively related to the average bubble rise velocity in a granular bed.
Ultrasound is used significantly for pretreatment in mineral flotation to improve fine particle flotation performance. Many researchers and scholars have studied its mechanism with the help of many modern instruments and reached important conclusions. The main reason ultrasound is helpful for flotation is that the cavitation effect of ultrasound will clean the surface of the mineral particles or even break them [8,9,10], changing the surface chemical properties of minerals [11,12,13]. At the same time, ultrasound can promote the adsorption of the flotation agents on mineral surfaces [14]. Chen et al. studied the interaction of bubbles and coal particles under the action of the ultrasonic field [15,16,17,18]. They found that coal particles aggregate, and the interactions of bubbles and coal particles become much more efficient under the guidance of cavitation bubbles. In addition, it is hypothesized that the selectively attached carrier bubbles produced by ultrasound on the hydrophobic rough surface of coal particles are the main reason why the ultrasound field improves the flotation efficiency of coal particles. Jin et al. [19] investigated the effect of the ultrasonic field with different frequencies on the dynamics of flotation bubbles and coal-bubbles, which showed that frequencies of the ultrasonic field have an important effect on the aggregation of bubbles. Liang [20] investigated the rising dynamics of bubbles in methyl isobutyl methanol (MIBC) solution under an ultrasonic field. It was shown that ultrasound action slowed down the bubble rise velocity and prolonged the residence time of bubbles in the slurry. Ultrasound also produces more nanobubbles due to the complexity of the pulp composition and the cavitation effect. In the ultrasonic field, the higher vibration frequency can transfer relatively higher energy, and bubbles can form more and stronger aggregates [21], which is beneficial for promoting the adhesion of particles and bubbles, ultimately improving the mineral flotation efficiency.
The ultrasonic probe is also suspended above the flotation column for mineral beneficiation and has achieved good flotation results [22], but few studies designed the flotation column by embedding ultrasonic transducers into it. The positive effect of the ultrasonic action on mineral flotation is rarely mentioned from the perspective of ultrasound affecting bubbles too. In this paper, we designed an experimental setup using two immersed ultrasonic vibration plates as the ultrasonic source to study the movement behavior of flotation bubbles. The effect of the ultrasonic action on the bubbles’ movement behavior of different sizes will be studied and discussed using experimental and simulation methods.

2. Theory and Experimentation

Ultrasound, as external field energy, significantly affects the dynamics of bubbles in the fluid and surface physicochemical properties of bubbles. Ultrasound can change the micronucleus in the liquid and form cavitation bubbles. This phenomenon is called ultrasonic cavitation, which is classified into two types, transient cavitation, and the other is stable cavitation. Different cavitation effects have unique functions in the liquid environment.

2.1. Bubble Force Model

The ultrasonic wave is a mechanical wave with a higher frequency. Mechanical vibration energy propagates through longitudinal radiation in the medium. Due to the sinusoidal variation in sound pressure generated by sound waves, its propagations exhibit periodic positive and negative changes, which can affect the motion and distribution of relevant media in the acoustic field to a certain extent.
Ultrasound can generate a high-frequency periodic acoustic field in the medium. Bubbles oscillate due to the continuous changes in sound pressure in the acoustic field. Due to the variation in sound pressure gradient in the field, an additional force is exerted on the bubble, known as the Bjerknes force [23]. This force is one of the main forces acting on bubbles in the acoustic field.
When the size of the bubble in the acoustic field is much smaller than the spatial variation in the sound pressure, that is, when the wavelength of the ultrasound is much larger than the diameter of the bubble, the Bjerknes force of the bubble in the ultra-acoustic field can be obtained as Equation (1):
F B = V t p t t
V t = 4 / 3 π R t 3
where V t (m3) is the volume of the bubble at time t (s); p t (Pa·m−1) is the sound pressure gradient at the location of the bubble at time t ; R t (m) is the equivalent radius of the bubble at time t ; t is the average of space and time on the sphere during one oscillation cycle.
The Bjerknes force on bubbles in an ultrasonic field include primary and secondary Bjerknes forces [24,25]. The primary Bjerknes force refers to the force that causes bubble vibration in the sound field due to changes in the external sound field. The secondary Bjerknes force is the attraction or repulsion force of the radiation pressure generated by other bubbles to the oscillation of another bubble in an acoustic field. For a bubble in the acoustic field, assuming that the bubble is located at a position where the sound pressure gradient value is p e x (Pa), the distance between the bubble and the nearest ultrasonic antinode is d (m), and the value of the antinode of the acoustic wave is P a (Pa), so the primary Bjerknes force [23] of a bubble in the ultrasonic field is shown in Equation (3):
F B 1 = V t p e x t
p e x r , t = P a sin ω t cos k r
where r is the position vector; k is the wave vector; ω is the angular frequency of ultrasound and depends on the surface tension.
Substituting Equations (2) and (4) into Equation (3), the expression for the primary Bjerknes force [23] is obtained as follows:
F B 1 = 3 4 π P a k sin k d R 3 t sin ω t

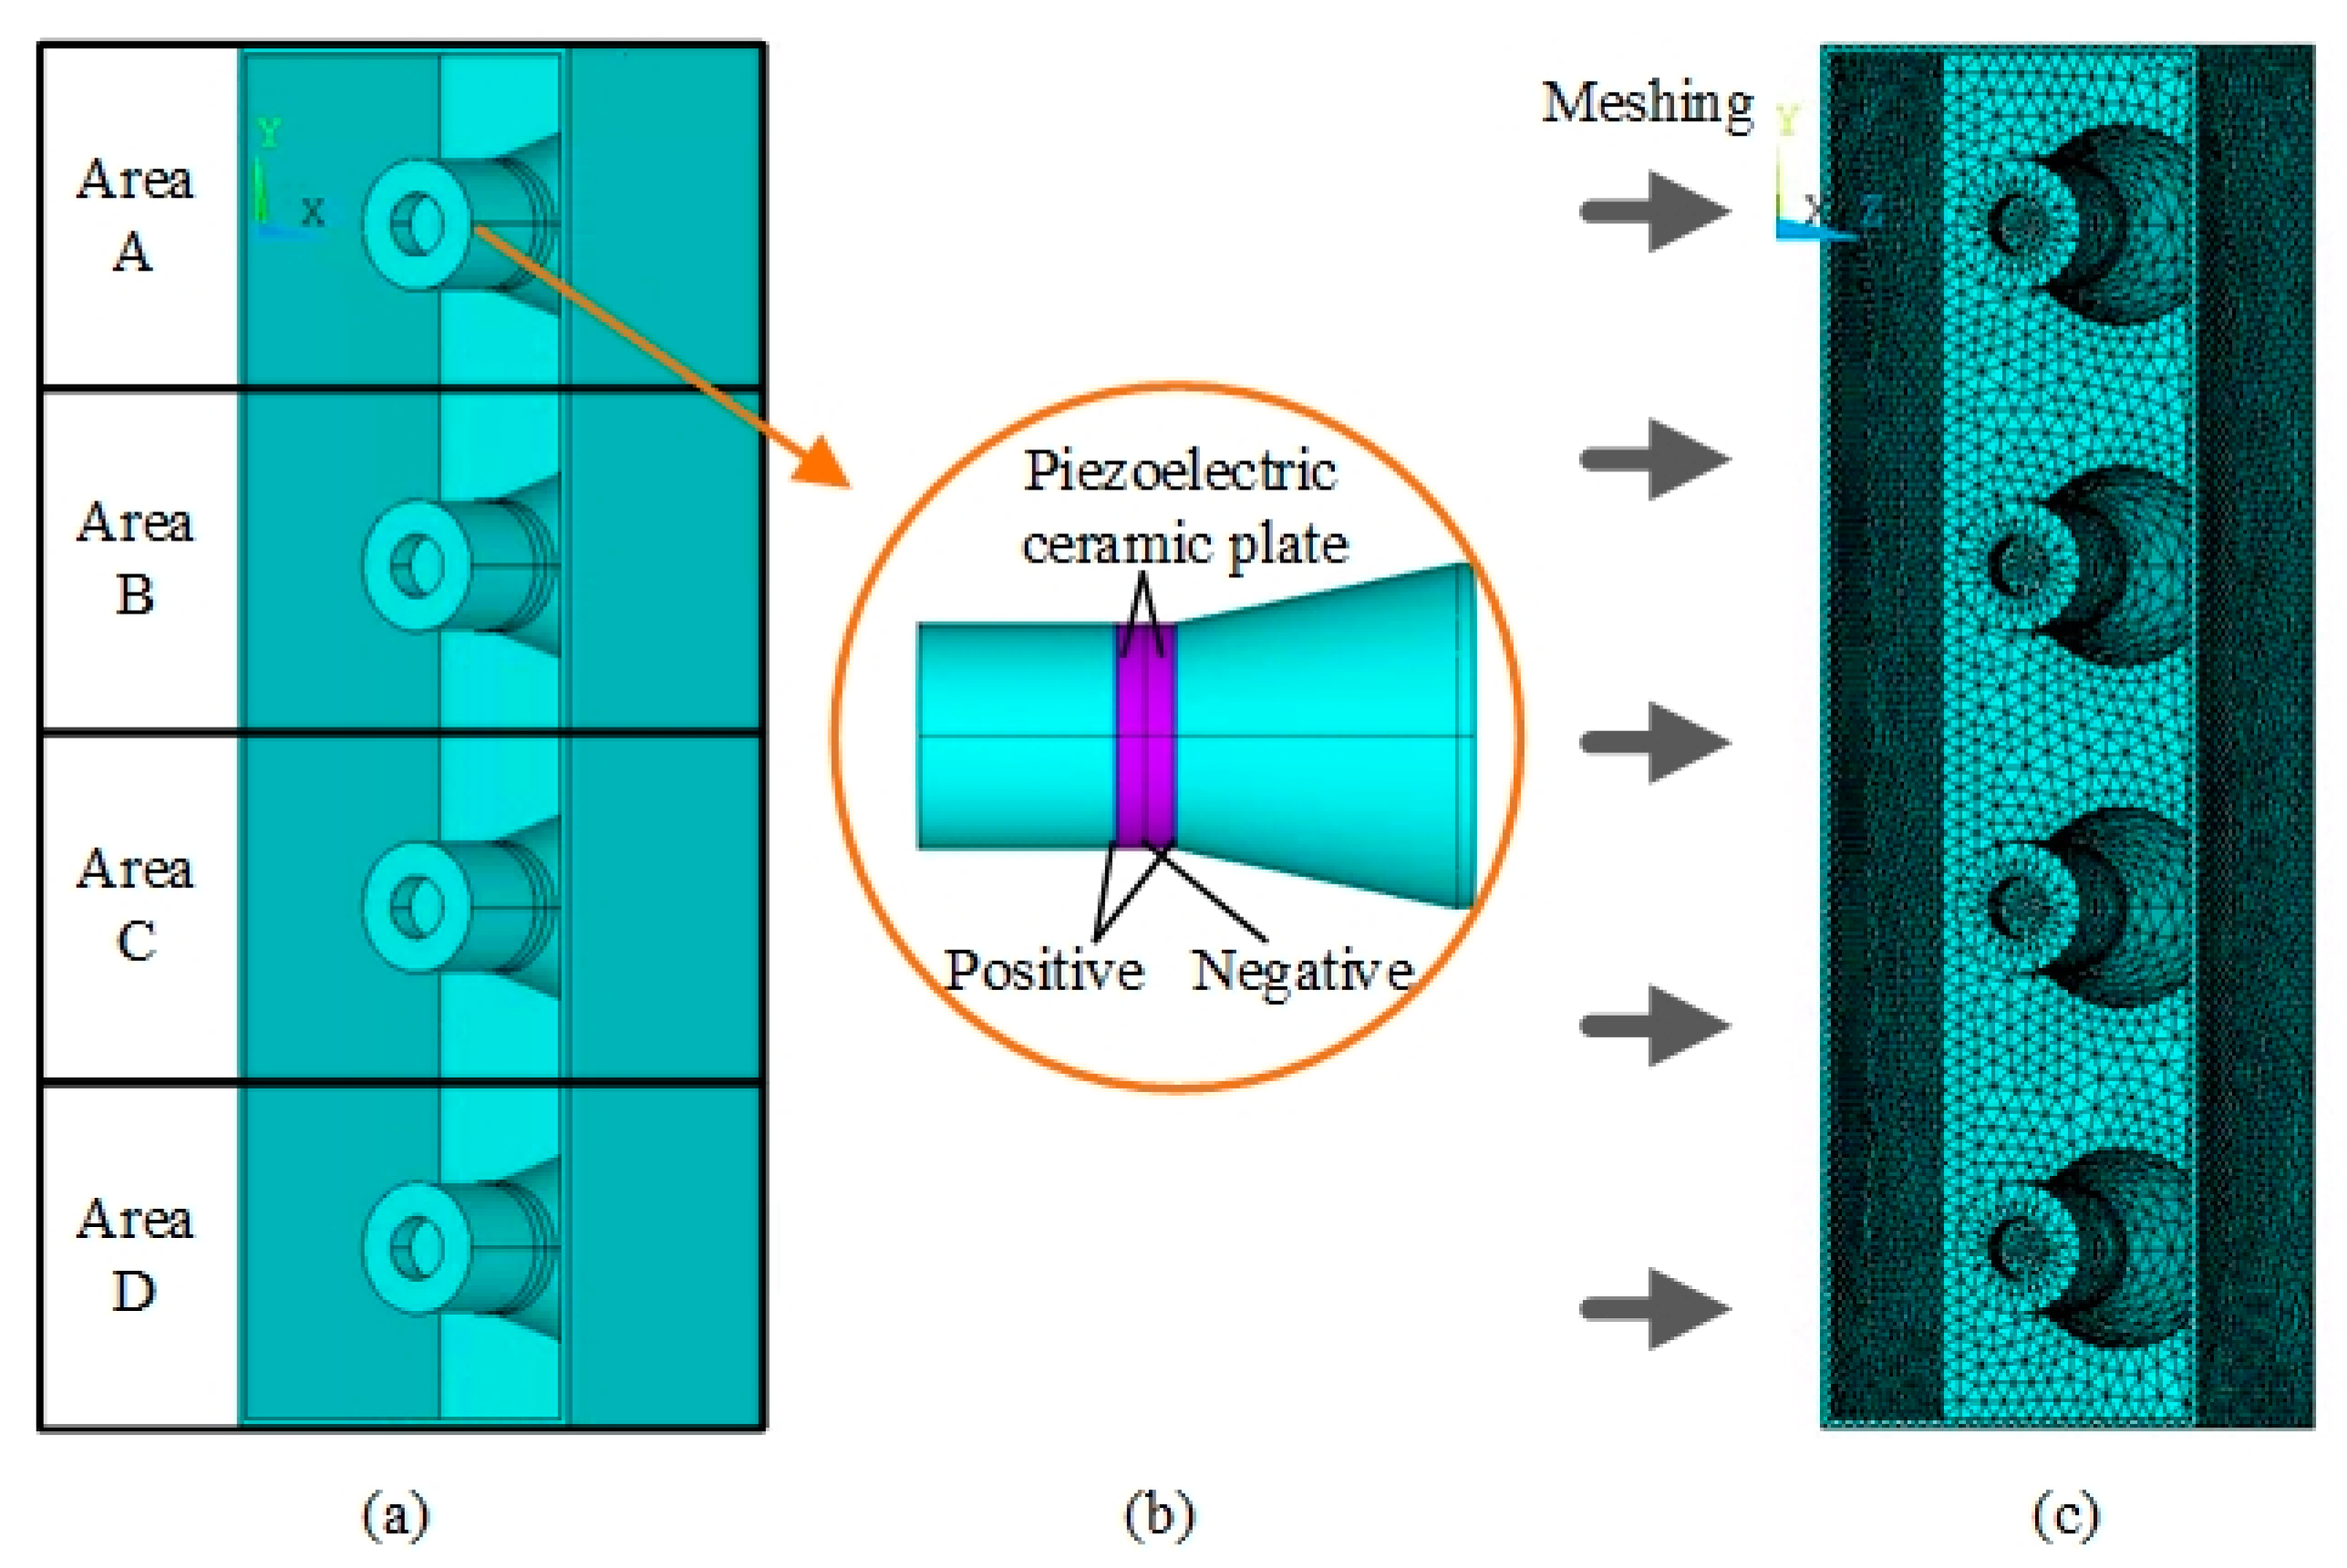
2.2. Vibration Plate Model

The immersed ultrasonic vibration plate is used to generate ultrasonic acoustic fields. The plate’s characteristics determine the amplitude value of the experimental column, which affects the vibration frequency and intensity of the sound field. Therefore, the design of the immersed ultrasonic vibration plate has an extremely important role in studying flotation bubbles.
The immersed ultrasonic vibration plate used in this study is composed of the piezoelectric ceramic transducer (60 w, JieSheng Ultrasonic Equipment Co., Ltd., Wenzhou, China) and an immersed ultrasonic vibration plate shell. To achieve the maximum amplitude value and the optimal working frequency of the immersed ultrasonic vibration plate, the modal simulation analysis is conducted to study the resonance frequency and corresponding natural vibration mode models of the ultrasonic vibration plate at various working frequencies. The amplitude characteristics at different vibration frequencies are analyzed to determine the optimal working state of the immersed ultrasonic vibration plate.
This paper builds a proportional three-dimensional model (100 × 110 × 400) of the immersed ultrasonic vibration plate by simplifying the model’s non-interference region to facilitate the model’s grid division and improve the simulation speed. Based on the modal analysis, the characteristics of the immersed ultrasonic vibration plate are studied. The simplified model of a single-sided vibrating plate is shown in Figure 1. The back side of the vibration surface is directly connected to the piezoelectric ultrasonic transducer, and the front side of the vibration surface is the area where the ultrasonic pressure field is generated. The vibration surface of the ultrasonic vibration plate used in this study is made of stainless steel, the piezoelectric transducer material is aluminum, and the material of the piezoelectric ceramic sheet in the piezoelectric transducer is PZT-8. The material of the immersed ultrasonic vibration plate is defined before simulation.
When meshing, it should ensure that the structure of piezoelectric ceramic sheets and ultrasonic vibration surfaces are regularly meshed to accurately reflect the vibration characteristics of the immersed ultrasonic vibration plate. As shown in Figure 1b, the piezoelectric ceramic model is meshed in hexahedral format, and the vibration plate mesh model is meshed in tetrahedral format. The piezoelectric ceramic model used the hexahedral mesh generation method to evenly divide into 30 parts in the circumferential direction and 20 parts in the axial direction. The vibration plate model is automatically divided using the tetrahedral mesh generation method, and the mesh size is set to the default size. Limit the degree of freedom of piezoelectric ceramics and set the voltage on all five surfaces of the piezoelectric ceramic to 0. Set the number of modes to extract to 10 and the frequency to 15,000 to 35,000.

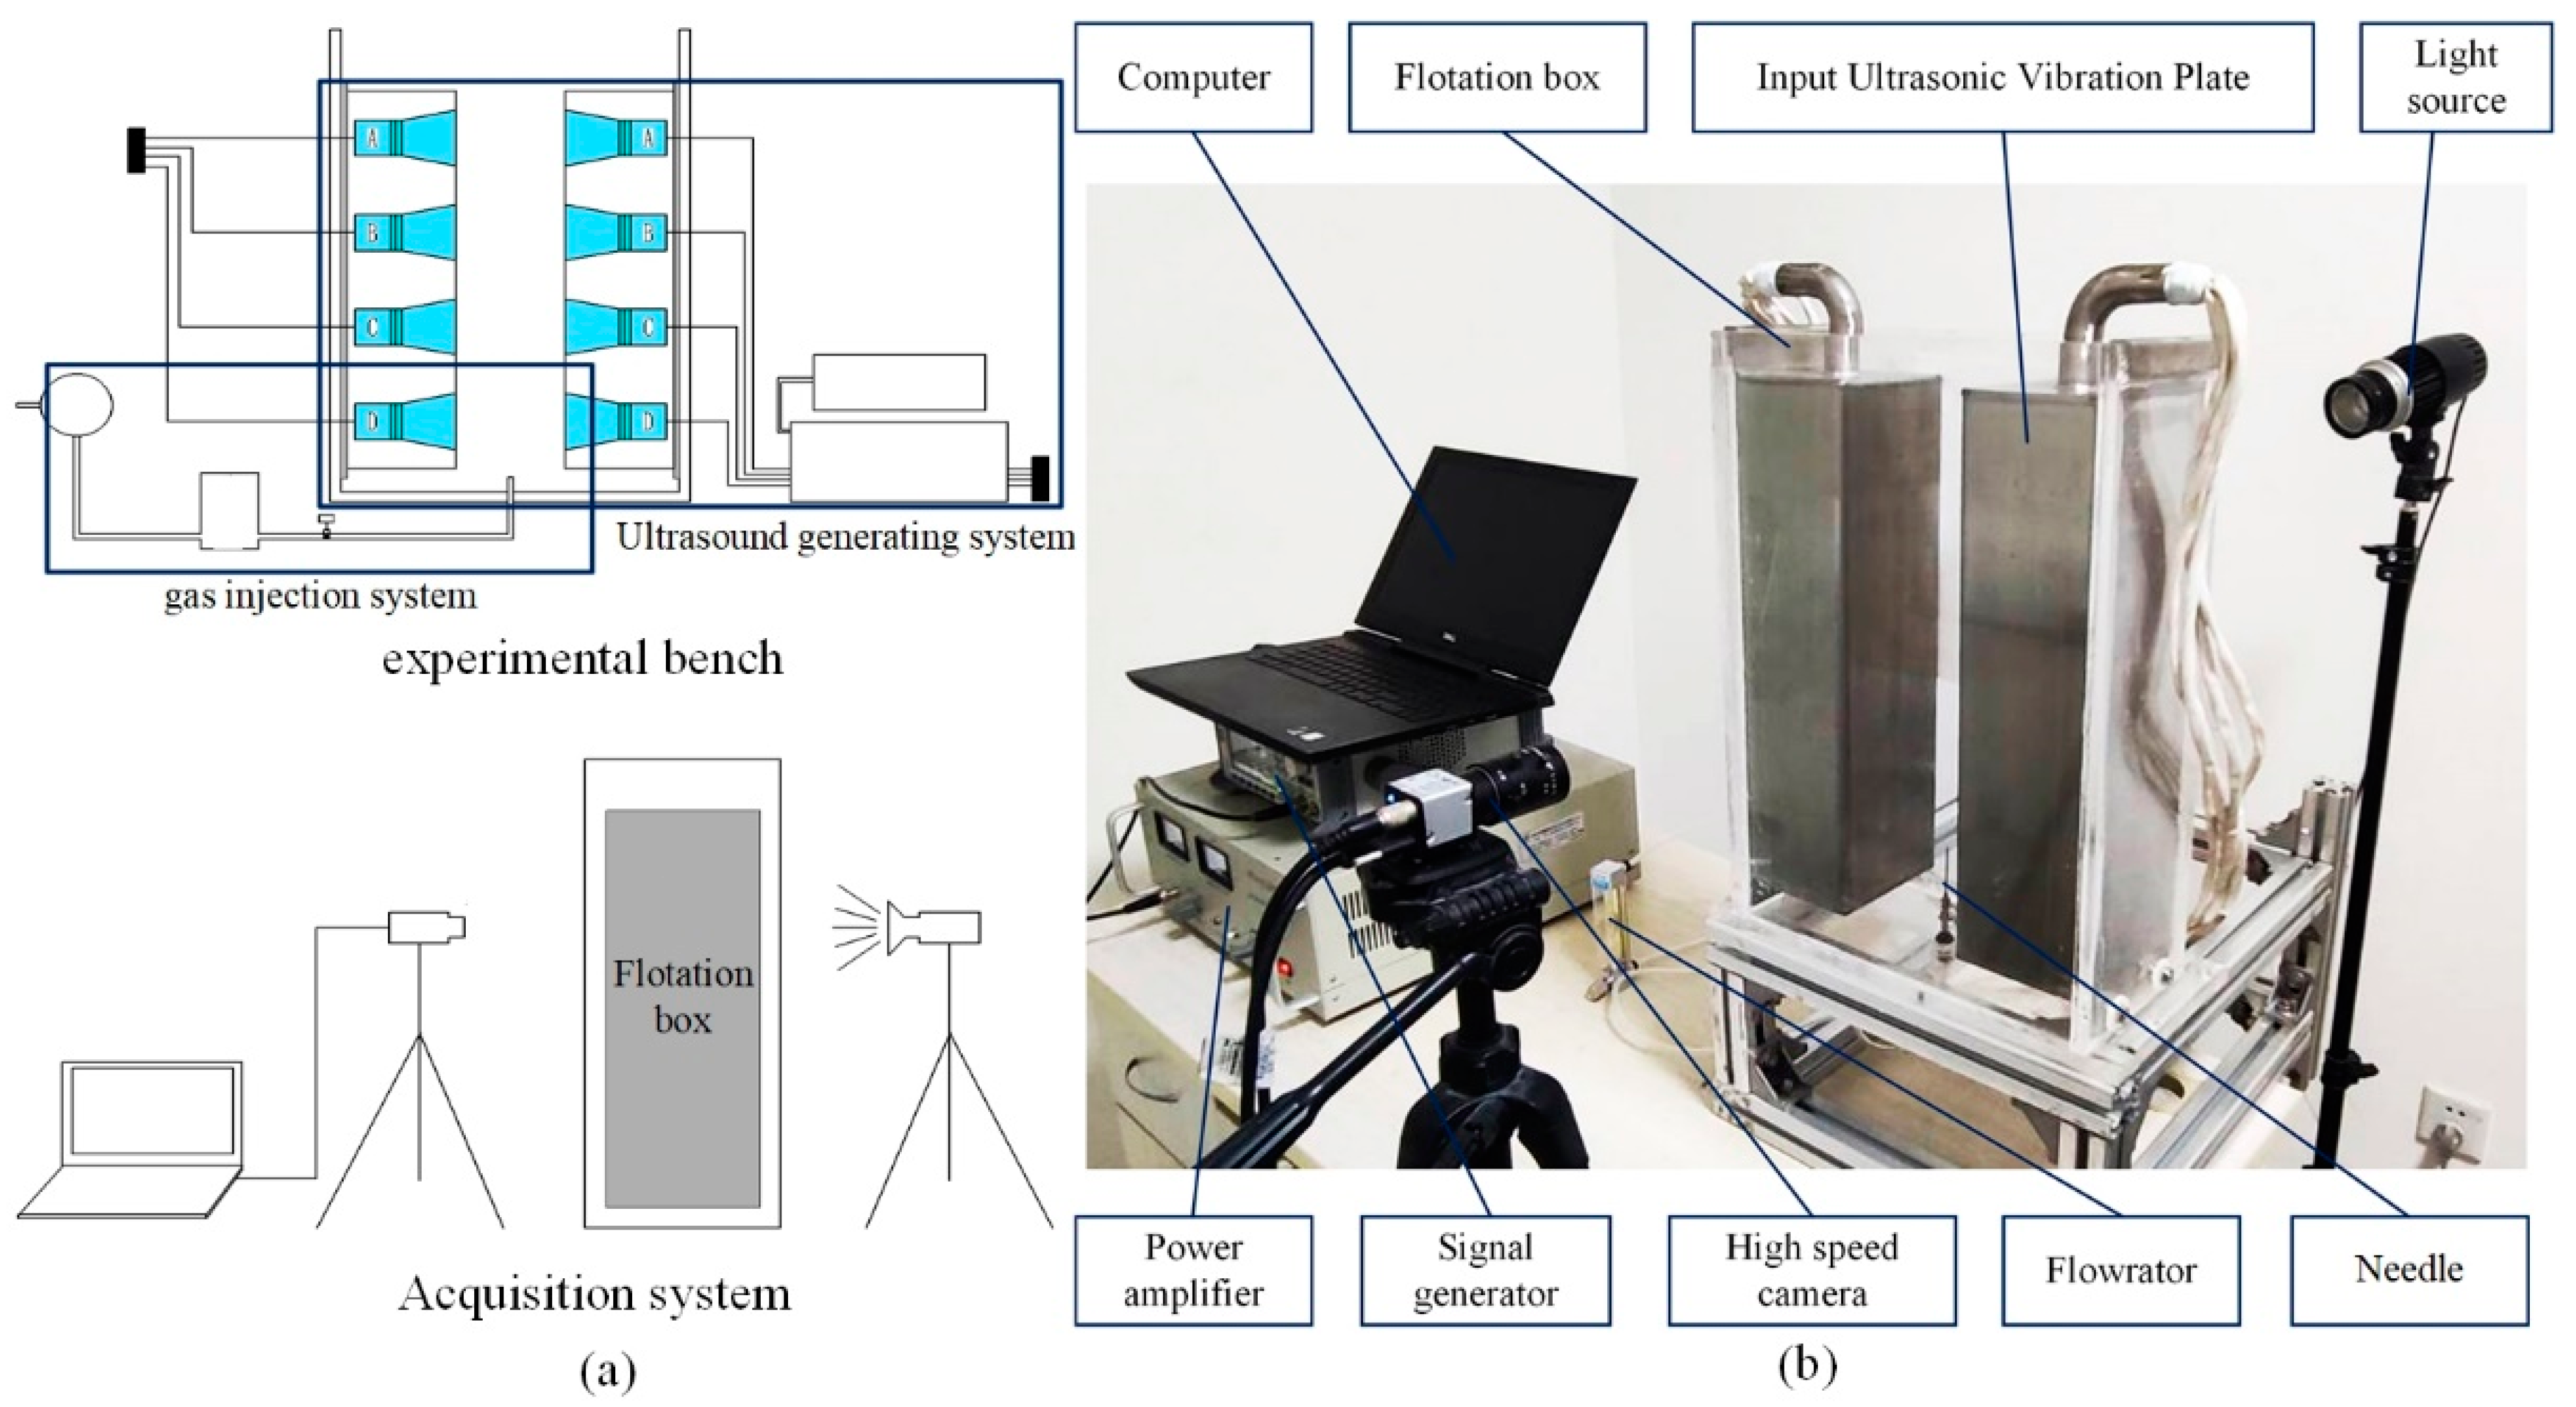
2.3. Experimental System

Visual experimental equipment was set up to investigate the effect of the ultrasonic field on the dynamics of flotation bubbles during their rising process. The experimental equipment consists of a flotation box, a gas injection system, an immersed ultrasonic vibration plate, a signal generator, a power amplifier, a high-speed camera, and a data acquisition computer, as shown in Figure 2. The box’s material is transparent acrylic. The flotation box is filled with appropriate pure water. The gas injection system mainly generates a single bubble, continuous bubble, or bubble groups in liquid. The high-speed camera observes bubble movement in a macroscopic view. Then, the data acquisition device collects and processes data on bubble properties and analyzes the dynamics of flotation bubbles. In this paper, we use five different apertures of the flat needle as the main appliances for bubble generation in the experimental process. As shown in Table 1, the inner diameter of the needle aperture is 0.2 mm, 0.3 mm, 0.4 mm, 0.5 mm, and 0.6 mm.

3. Results and Discussion

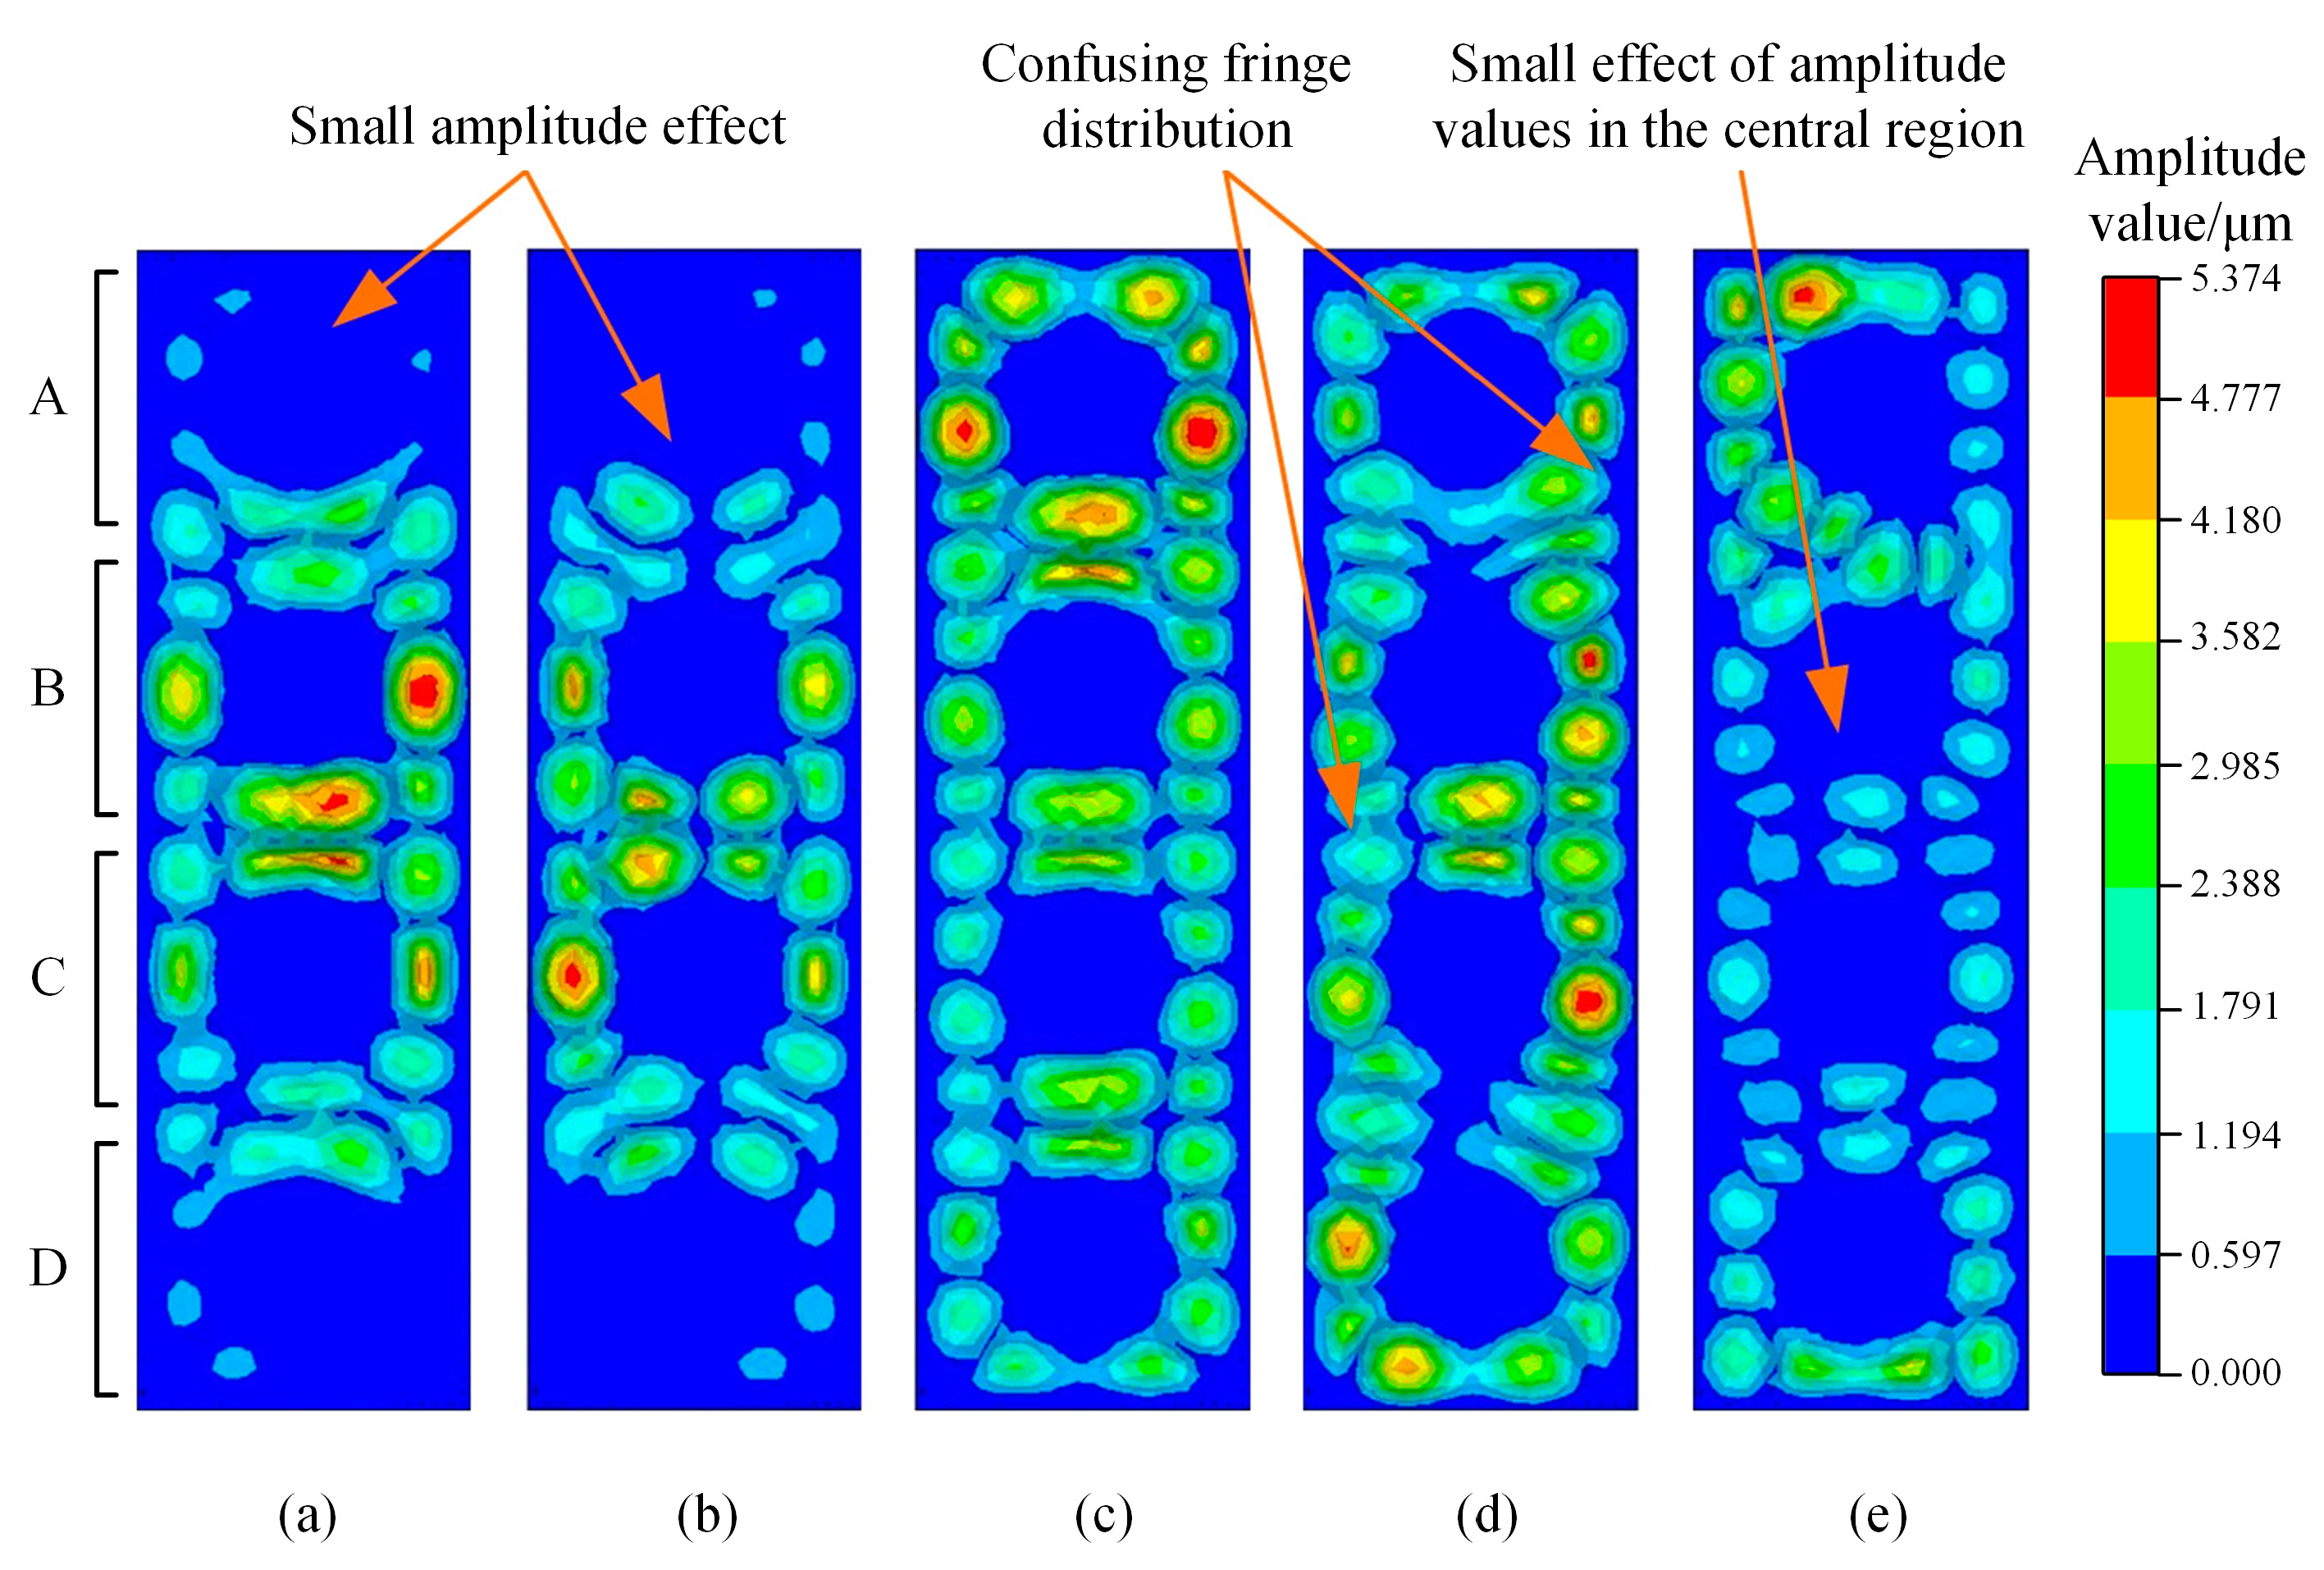
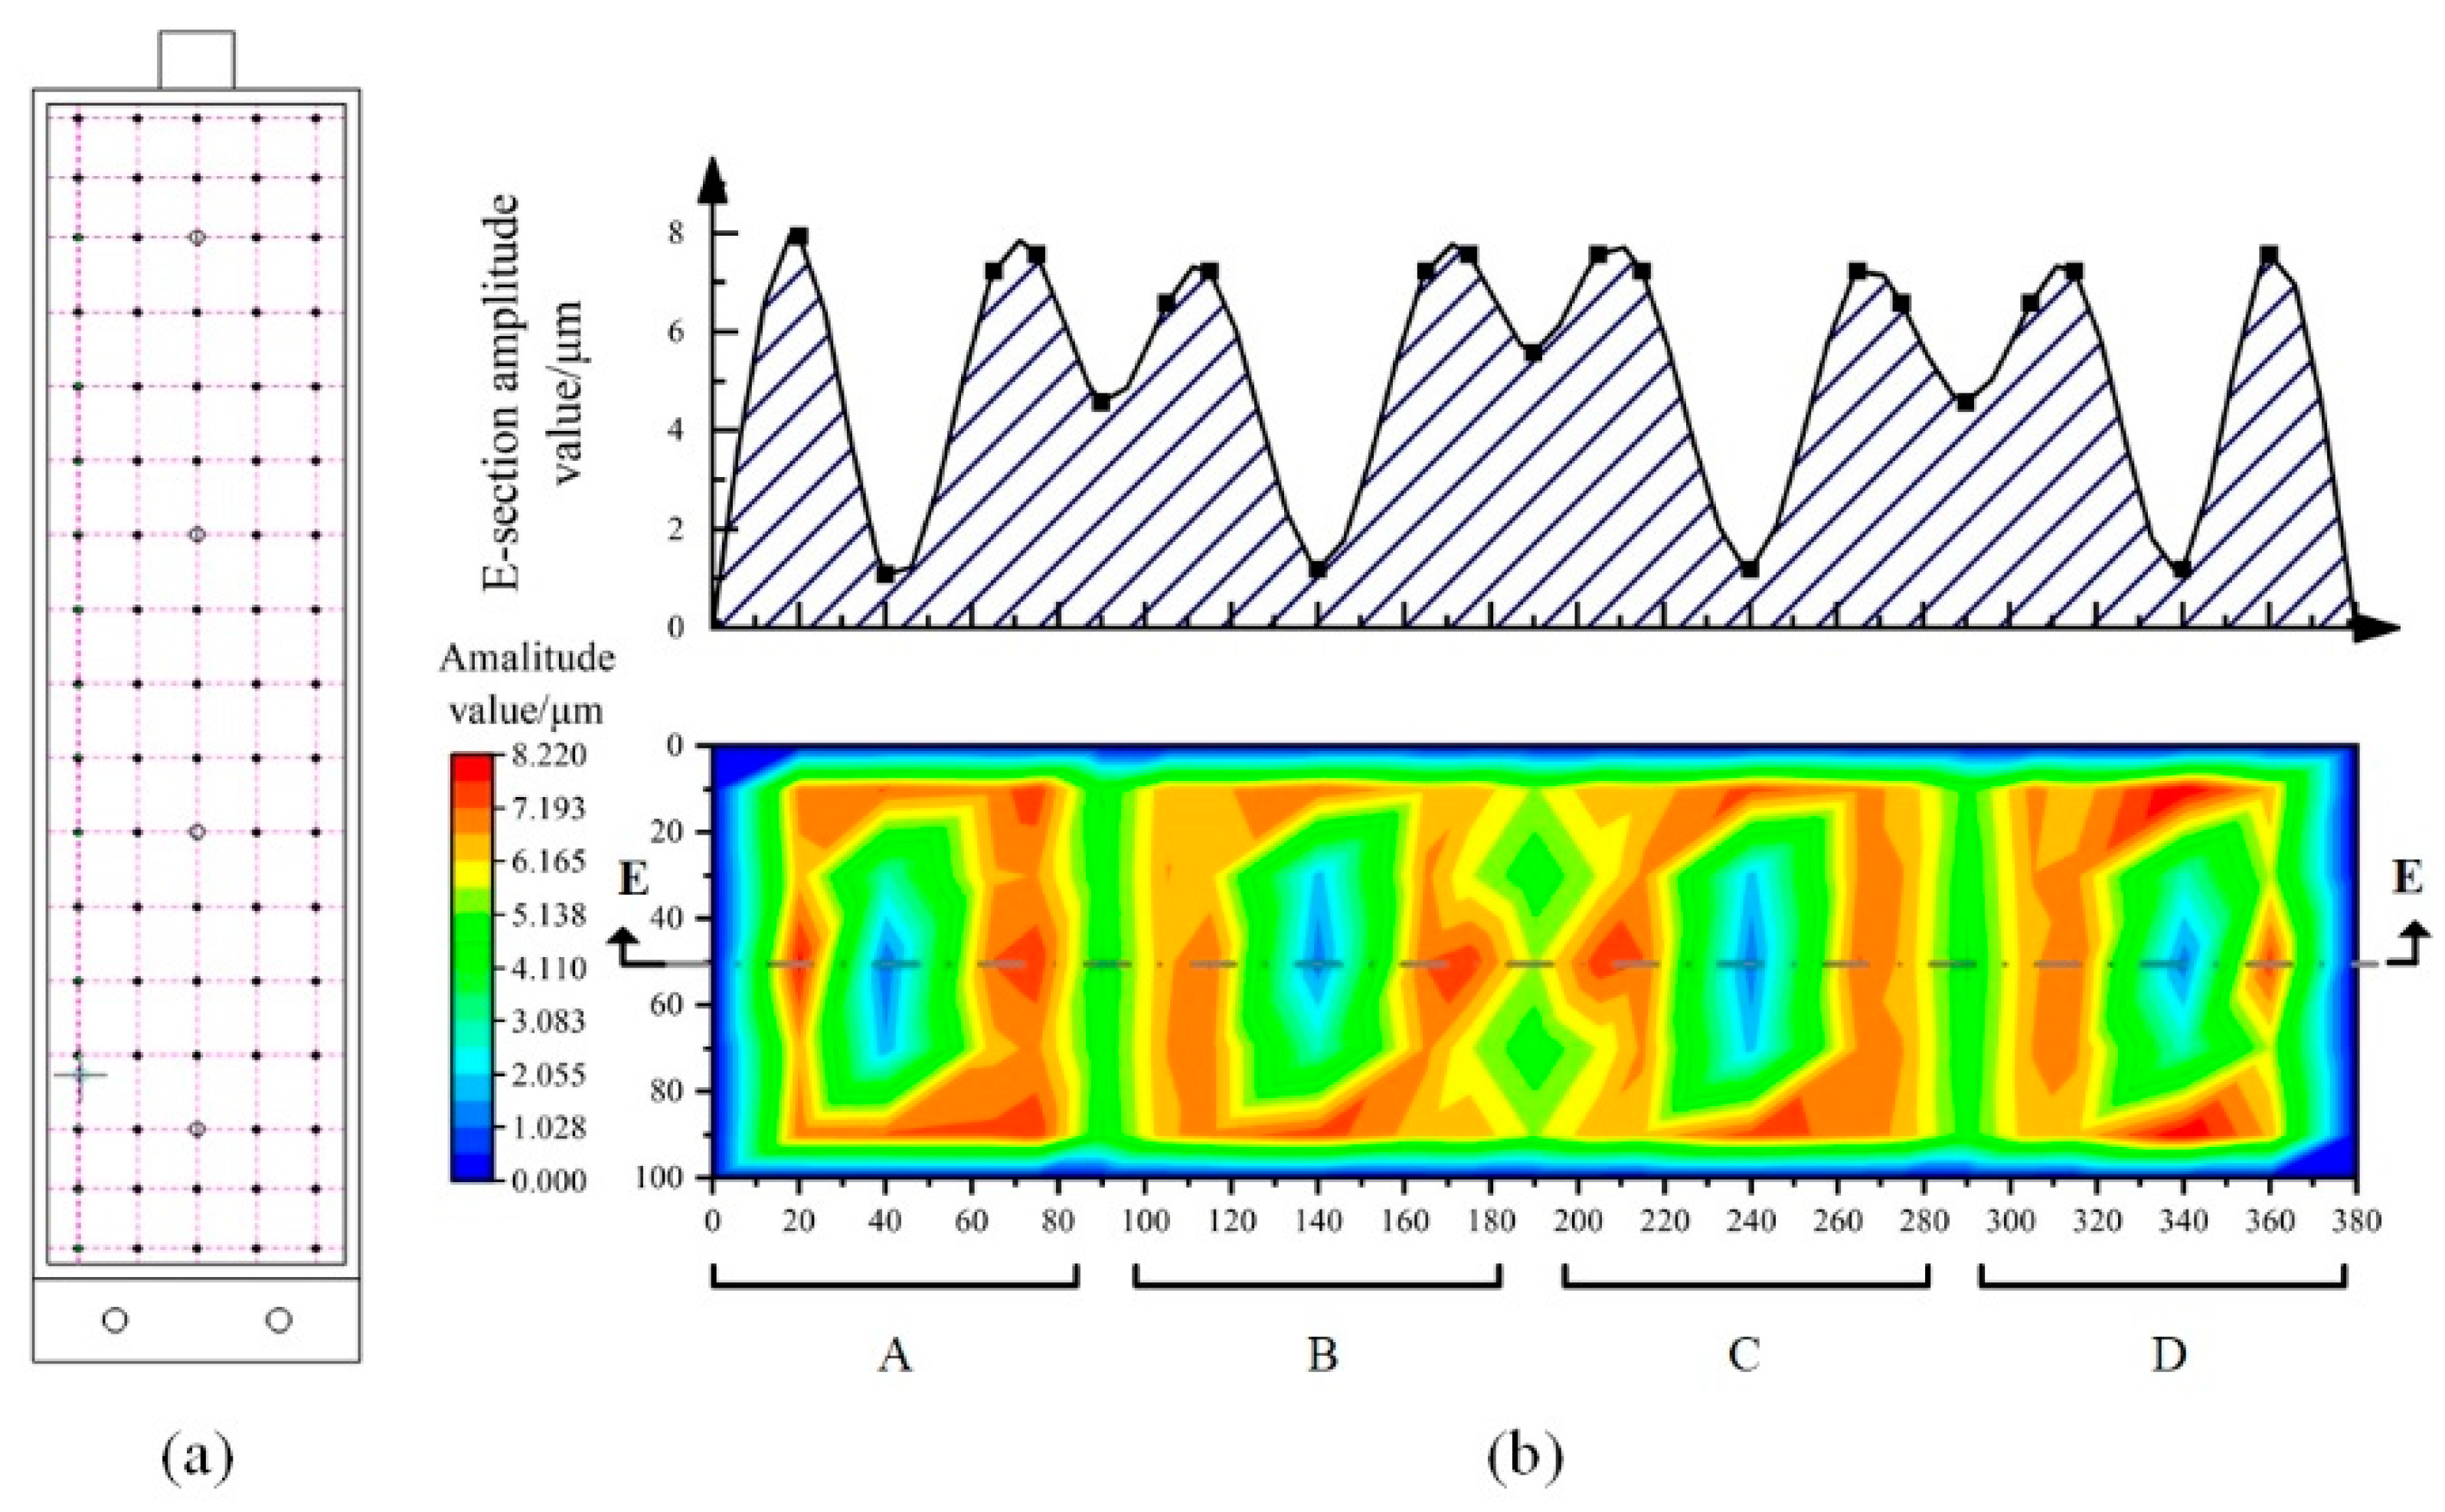
3.1. Vibration Characterization of Immersed Ultrasonic Vibration Plate

The modal analysis of the vibration characteristics of the immersed ultrasonic vibration plate designed for the study is carried out by the analysis software. The search interval for the immersed ultrasonic vibration frequency of the plate is set as 18 KHz–22 KHz, and the modal analysis of the immersed ultrasonic vibration plate’s vibration characteristics is carried out using the Block Lanczos solution. The modal diagram of the immersed ultrasonic vibration plate at its intrinsic frequency is obtained, and the vibration modal diagram of the immersed ultrasonic vibration plate at its specific frequency is shown in Figure 3.
The amplitude characteristics of this immersed ultrasonic vibrating plate at 18.3 KHz, 19 KHz, 19.4 KHz, 20.3 KHz, and 21.7 KHz correspond to (a) to (e) in Figure 3, respectively. Analysis of the results in Figure 3 shows that the vibration characteristics of the immersed ultrasonic plate in Figure 3a are mainly concentrated in the central region, i.e., the transducers A, B, C, and D of the immersed ultrasonic vibration plate. The vibration characteristics of the plates in areas B and C are more pronounced. Still, the amplitudes at the edges of areas B and C are not uniform, and the ultrasonic vibration characteristics of the plates in areas A and D are less effective. From Figure 3b, it can be found that the vibration characteristics of the immersed ultrasonic vibration plate are similar to those in Figure 3a. The modal effects tend to be distributed in an arc around the center in the B and C regions, and the modal effects at the edges and in the B and C regions are slightly better than those in Figure 3a. According to the modal analysis in Figure 3d, it is found that the immersed ultrasonic vibration plate generates a certain degree of amplitude variation in the whole vibration plate at the vibration frequency of 20.3 KHz. The immersed ultrasonic vibration plate modes are distributed around the center of the piezoelectric transducer. The amplitude responses in the A, B, C, and D regions of the vibration plate are relatively chaotic, and the synergy between the piezoelectric transducers is poor, which cannot produce stable amplitude feedback in the local regions A, B, C, and D. This may affect the stability of the ultrasonic sound pressure field. In Figure 3, it can be observed that the amplitude response can be aggregated in the upper-left region of the immersed ultrasonic vibration plate. Still, the amplitude response on both sides of the B and C regions decreases. Comparing the amplitude response characteristics at different frequencies, it can be found that the vibration mode distribution of the ultrasonic vibration plate at a frequency of 19.4 KHz is more uniform, and the points reflected by the amplitude values in the amplitude cloud diagram are more intensive. The immersed ultrasonic vibration plate can be determined to produce a more uniform amplitude value response at a vibration frequency of 19.4 KHz, which ensures that the immersed ultrasonic vibration plate can provide a more uniform and better ultrasonic force field and acoustic pressure field in the liquid environment, which has a positive effect on the experimental verification of the movement of the flotation bubbles.
By comparing and analyzing the modal cloud diagrams, the optimal vibration frequency of the immersed ultrasonic vibration plate is determined to be 19.4 KHz. According to the established vibration frequency, the laser displacement sensor (KEYEBCE LK-H020) is used further to detect the amplitude of the immersed ultrasonic vibration plate. The immersed ultrasonic vibration plate amplitude experiment sampling point distribution and amplitude detection plot are obtained, as shown in Figure 4. Figure 4a shows the distribution of detected sampling points on the ultrasonic vibration plate during the experiment, and Figure 4b shows the cloud of amplitude values of the ultrasonic vibration plate detected by the laser displacement sensor during the experiment, as well as the distribution of the amplitude at the E-section. From Figure 4b, it can be noticed that at a vibration frequency of 19.4 KHz, the amplitude response of the ultrasonically vibrated plate in the E-section is concentrated in the edge range of the piezoelectric transducer circumference. The amplitude response value in the middle region of the adjacent piezoelectric transducer is higher, while the amplitude response value in the center of the piezoelectric transducer is lower. The reason for this is analyzed to be the fixed structure of the piezoelectric transducer, which results in a smaller amplitude response. Comparing the experimental data and the simulated data, the distribution in the amplitude of the vibration response of the immersed ultrasonic vibration plate tends to be consistent with the distribution in the amplitude of the vibration response of the modal analysis. The amplitude responses are regularly arranged around the ultrasonic transducer areas A, B, C, and D, and the amplitude distribution on the vibration plate is relatively uniform. It is further verified that the immersed ultrasonic vibration plate has good amplitude feedback at 19.4 KHz, which can achieve the best vibration effect.

3.2. Bubble Motion Characteristics under the Intervention of Ultrasonic Vibration Plate

Through the modal analysis of the immersed ultrasonic vibration plate, the optimal ultrasonic vibration frequency of the immersed ultrasonic vibration plate vibration modal effect is found. The frequency of the experimental equipment is adjusted to 19.4 KHz, and the corresponding ultrasonic vibration waveforms are immersed to study the impact of the ultrasonic field on the distribution and motion characteristics of the flotation bubbles in the experimental equipment when the instantaneous excitation voltage is 500 V. When the flotation bubbles detach from the needle, the different aperture sizes will affect the detachment state of the bubbles in the needle and the spatial distribution state after detaching from the needle. Therefore, this experiment adopts the method of quantitative air flow for immersed bubbles to study the distribution of flotation bubbles under five different apertures: 0.2 mm, 0.3 mm, 0.4 mm, 0.5 mm, and 0.6 mm. The ultrasonic field action affects the process of bubble rise. Therefore, the study analyzed the effect of different needle apertures on the distribution and movement characteristics of flotation bubbles with and without ultrasonic field intervention in an attempt to reveal the intrinsic link between ultrasonic field intervention on the movement characteristics of flotation bubbles and its effect on flotation during the upward movement of bubbles.

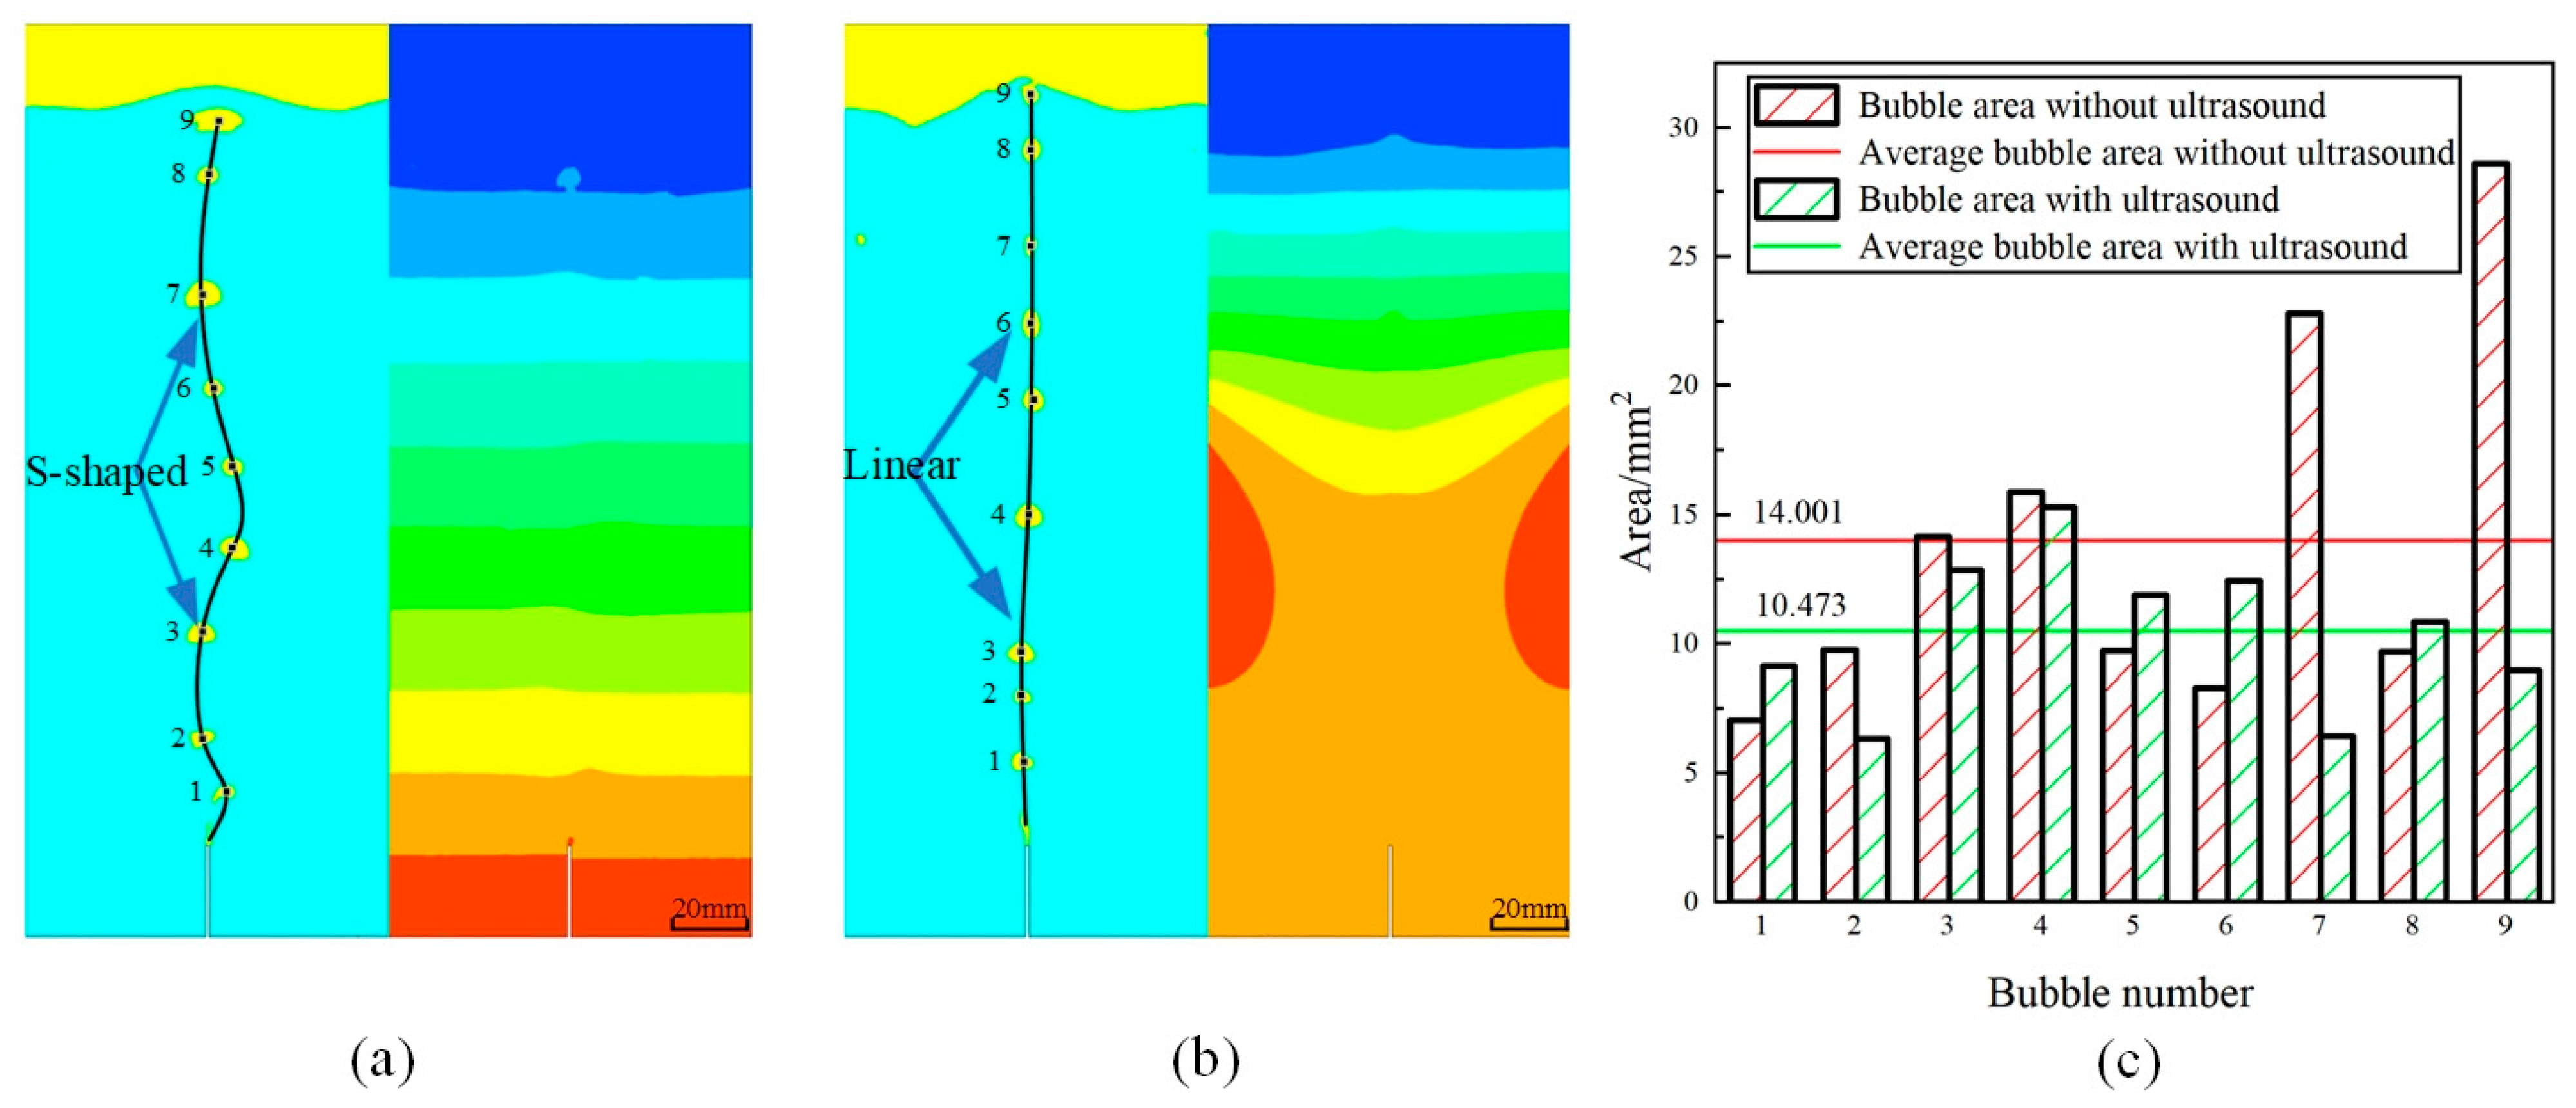
3.3. Simulation Analysis of Bubble Distribution with and without Ultrasonic Field

Through the simulation software to analyze the flow field environment of the established model, the model area is set to be 150 mm × 60 mm, of which the lower 140 mm × 60 mm area is water, the upper 10 mm × 60 mm area is air, and the air is injected at a speed of 0.5 m/s from the needle at the bottom-center position. The free-rising distribution of flotation bubbles without ultrasonic intervention and the rising distribution of flotation bubbles with ultrasonic intervention were simulated, respectively. Processing analysis is used to obtain the flotation bubble distribution and pressure field distribution cloud diagram, as shown in Figure 5, with and without an ultrasonic field. Figure 5a shows the bubble distribution and pressure distribution cloud plots in the absence of an ultrasonic field; Figure 5b shows the bubble distribution and pressure distribution cloud plots in the action of the ultrasonic field generated by the ultrasonic source at the left- and right-center positions. In the bubble distribution cloud plots, yellow represents the gas phase and blue represents the liquid phase; the rainbow colors in the pressure distribution cloud plots represent pressure values from low to high, ranging from blue to red. Figure 5c shows the volumetric distributions of the flotation bubbles with and without the action of an ultrasonic field. In addition, the pressure cloud in the liquid environment shows that the ultrasonic region is in the high-pressure region, and the pressure value in the center is lower than the pressure value on the two sides. At this time, a pressure gradient is generated in the horizontal direction, causing the pressure value at the central axis to be lower than the pressure value on both sides. This pressure gradient is why the bubbles converge towards the central axis and move upwards more nearly in a straight line. By comparing the bubble morphology in Figure 5a,b, it is evident that the transverse and longitudinal diameters of the bubbles are changing continuously with the rise height. The aspect ratio of the flotation bubbles without an ultrasonic field is significantly larger than that with an ultrasonic field. This may also be the reason for reducing the lateral movement range of bubbles in the ultrasonic field, which is unfavorable for flotation. Combined with the rising bubble size distribution shown in Figure 5c, it can be seen that the bubble size in the environment with an ultrasonic field is significantly smaller than that in the environment without an ultrasonic field. The bubble size distribution plot indicates that the bubble size is significantly smaller in the presence of the ultrasonic field, and the aspect ratio is also significantly smaller. The flotation bubble mean volume line reflects this pattern. Under the premise of consistent air intake, smaller-volume bubbles mean larger surface area, which is beneficial for flotation. Due to the ideal nature of the simulation model, the distribution and movement characteristics of the flotation bubbles have to be further revealed through experiments.

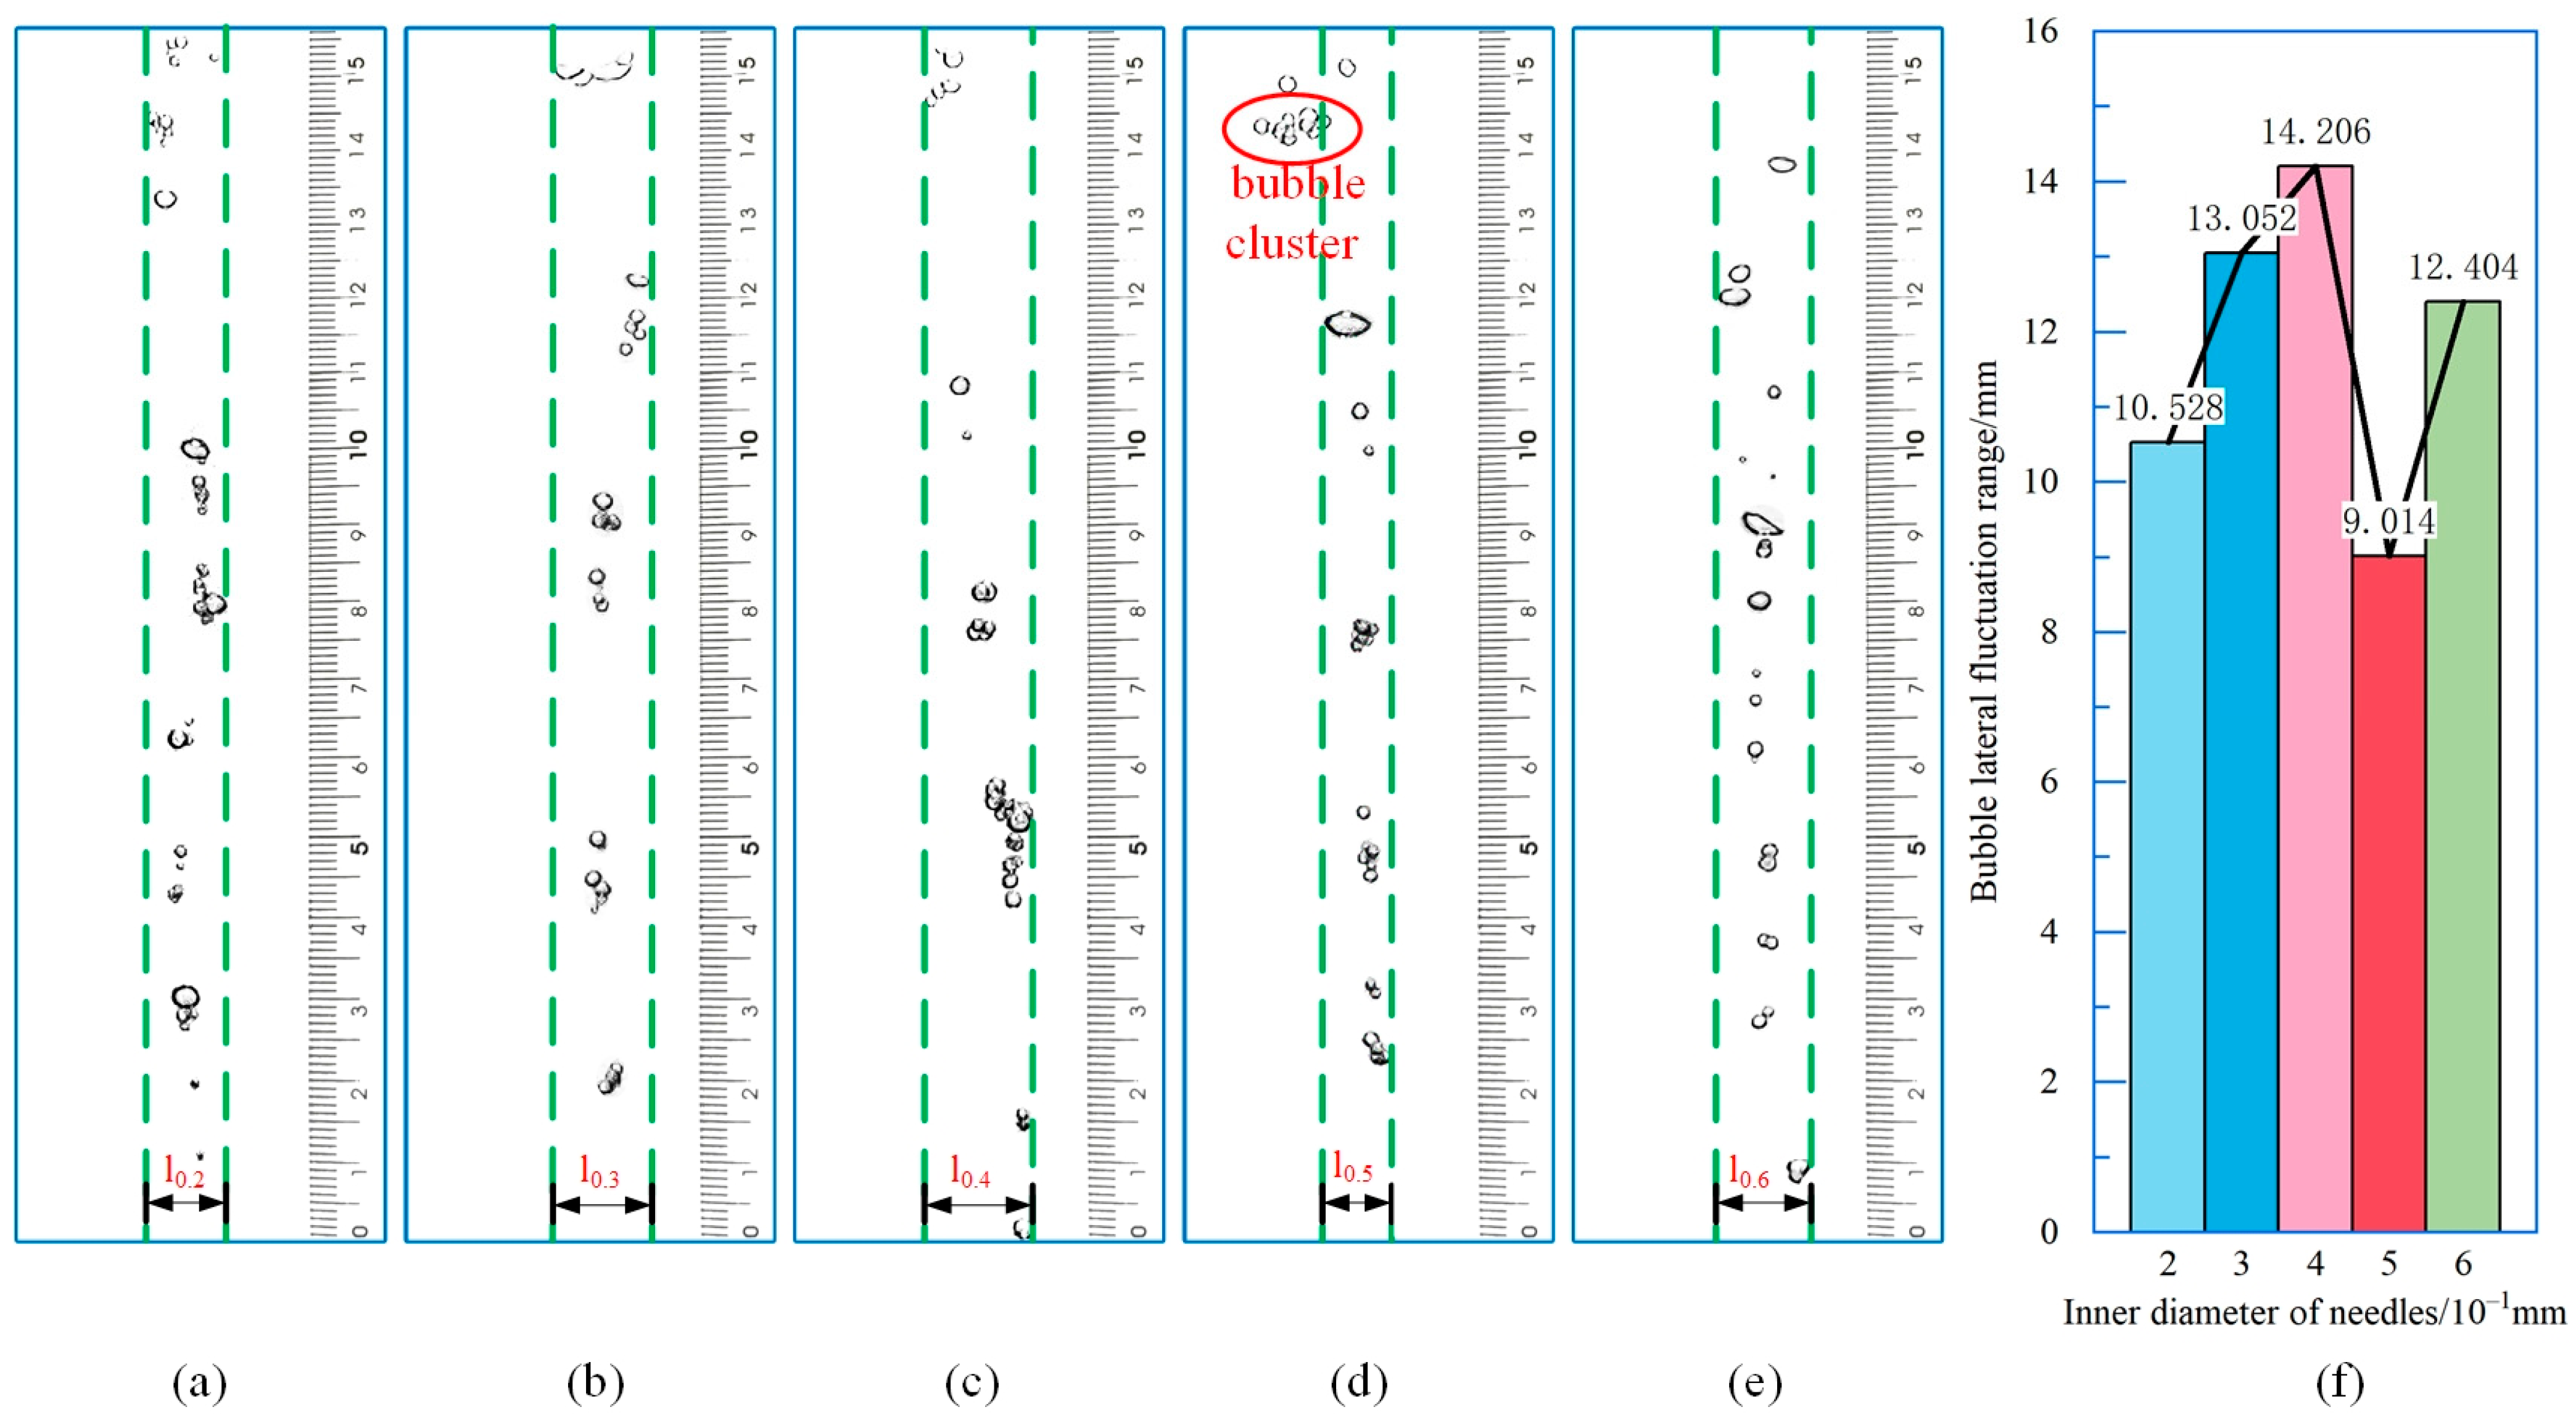
3.3.1. Experimental Distribution Characteristics of Bubbles in the Absence of Ultrasonic Field

According to the data collected by the experimental acquisition software, the flotation bubble distribution states at certain moments were excerpted, as shown in Figure 6. Figure 6a–e show the distribution of bubbles at needle diameters of 0.2 mm, 0.3 mm, 0.4 mm, 0.5 mm, and 0.6 mm, respectively, and Figure 6f shows the influence of the horizontal fluctuation range of bubbles with the change of needle diameter. Figure 6 shows a bubble distribution closer to an S-shape, with more stable lateral fluctuations, closer and relatively uniform bubble-to-bubble distances, and a bubble diameter that tends to increase as the needle aperture increases. After analysis, it is discovered that the size and shape of the volume of the rising bubbles in Figure 6a do not change significantly with the change in the height of the rise, and most of the bubbles show a relatively “spherical” shape; in Figure 6b,c there are large lateral fluctuations of the bubbles due to the constant change in the angle between the long axis of the elliptical bubbles and the horizontal direction. The gradual change to an “oval” shape during ascent is shown in Figure 6b,c, which is a significant change from Figure 6a. Figure 6d shows that in the process of bubble rise, bubble morphology tends towards an “oval” and “spherical cap” transition state. Figure 6e, in the process of bubble rise, is mainly a “spherical cap”; most of the bubble’s diameter is about 4 mm, and some of the bubbles are relatively close. The change in bubble morphology causes a decrease in the bubble aspect ratio, weakening the effect of lateral bubble fluctuations. In addition, the relative increase in bubble diameter indirectly reflects that the distribution of bubbles in the transverse direction shows a more concentrated phenomenon. By comparing and analyzing the range of lateral fluctuation of bubbles in Figure 6f, it can be observed that the lateral distribution characteristics of bubbles show a certain pattern with the change in needle aperture.
When the aperture of the needle is 0.2 mm to 0.4 mm, the lateral fluctuation range of the bubbles shows an upward trend with the increase in the aperture of the needle; when the aperture of the needle continues to increase, the lateral fluctuation range of the bubbles shows a downward trend instead. The main reason for this phenomenon is that the lateral radial ratio of the bubbles has changed. With the needle aperture diameters of 0.3 mm and 0.4 mm, the lateral fluctuation range of the bubbles is relatively large, and the lateral distribution of the bubbles is better. The change in the needle aperture causes changes in the bubbles’ volume size, the morphology, and the spacing between the bubbles, which in turn affects the distribution of the bubbles in the rising process, especially the lateral distribution. The study of the characteristics of the bubble distribution without the ultrasonic field shows that the bubbles produced by 0.3 mm and 0.4 mm apertures have better feedback in bubble volume, morphology, and distribution, which is favorable to the flotation effect of mineral particles.

3.3.2. Experimental Distribution Characteristics of Bubbles under Ultrasonic Field

Based on the data collected by the image acquisition system, the flotation bubbles’ distribution characteristics in the liquid environment’s rising motion in the ultrasonic field are investigated. Figure 7 shows the distribution characteristics of flotation bubbles under the action of an ultrasonic field for different sizes of needles. Figure 7a–e show the distribution of bubbles when the aperture sizes of various needles are 0.2 mm, 0.3 mm, 0.4 mm, 0.5 mm, and 0.6 mm, respectively. Figure 7f shows the influence of the change in aperture size on the lateral fluctuation range of bubbles under the action of the ultrasonic field. The volume of bubbles with needle apertures of 0.2 mm~0.6 mm can be noticed to change more obviously during the rising process of flotation bubbles under the action of the ultrasonic field. As a result of the acoustic pressure in the ultrasonic field region, the volume of the bubbles is reduced by nearly one half, and the bubble–bubble distance is significantly closer. As the size of the needle aperture is small, due to the apparent reduction in the bubbles’ volume produced, the proximity of the distance between bubbles is more significant. Figure 7a shows that, in this case, the rising chain of the flotation bubbles is denser, and the bubble aggregation phenomenon is more evident. The number of bubbles gathered per unit area is relatively large, and the distance between bubbles is close. In Figure 7b–d, it can be noticed that due to the action of the ultrasonic field on the bubbles, the phenomenon of rising of the resulting bubble clusters and the spacing between the bubble clusters are more uniform. In addition, the bubbles in Figure 7b have a better rising-distribution effect. The bubbles in Figure 7e are subjected to the ultrasonic field, and the distribution trajectories of the bubbles are also changed. Compared with the distribution of bubbles with smaller needle aperture sizes, the bubbles with 0.6 mm needle aperture are mainly affected by the bubble volume, the aggregation phenomenon between bubbles is less significant, and the interaction between bubbles is more minor. Figure 7f shows that the lateral fluctuation characteristics of bubbles generated by different sizes of needle apertures under the action of the ultrasonic field have a similar pattern to those under the no-ultrasonic condition.
As the size of the needle aperture increases, the lateral fluctuation range of the flotation bubbles shows a tendency to increase and then decrease. As for the flat bubble cluster with a needle aperture size of 0.5 mm, which is deliberately marked in Figure 7d, the forces on this bubble cluster are more complex during the ascent process, resulting in a significant increase in the transverse/longitudinal ratio of the bubble cluster, which leads to a more significant transverse displacement. Therefore, the transverse displacement of this bubble cluster cannot be used as the basis for the effect of the needle aperture on the transverse fluctuation, and the impact of this bubble cluster on the overall trend should be ignored here. A comparison of the results of the before and after experiments reveals that under the action of the ultrasonic field, the bubbles appeared to have an evident agglomeration phenomenon in the process of rising, and the range of lateral fluctuation of the bubbles is significantly reduced compared with that in the absence of ultrasound. Under the influence of the ultrasonic field, the bubble distribution produced by 0.3 mm, 0.4 mm, and 0.5 mm apertures is more uniform, and the distance between bubble clusters is more balanced. This may be beneficial for increasing the collision probability between flotation bubbles and particles, thereby facilitating flotation. But, compared to the absence of an ultrasound field, the lateral movement range of bubbles is smaller. This is an unfavorable factor for flotation. In comparison, a 0.3 mm aperture shows the most apparent effect and the best performance in the ultrasound field.

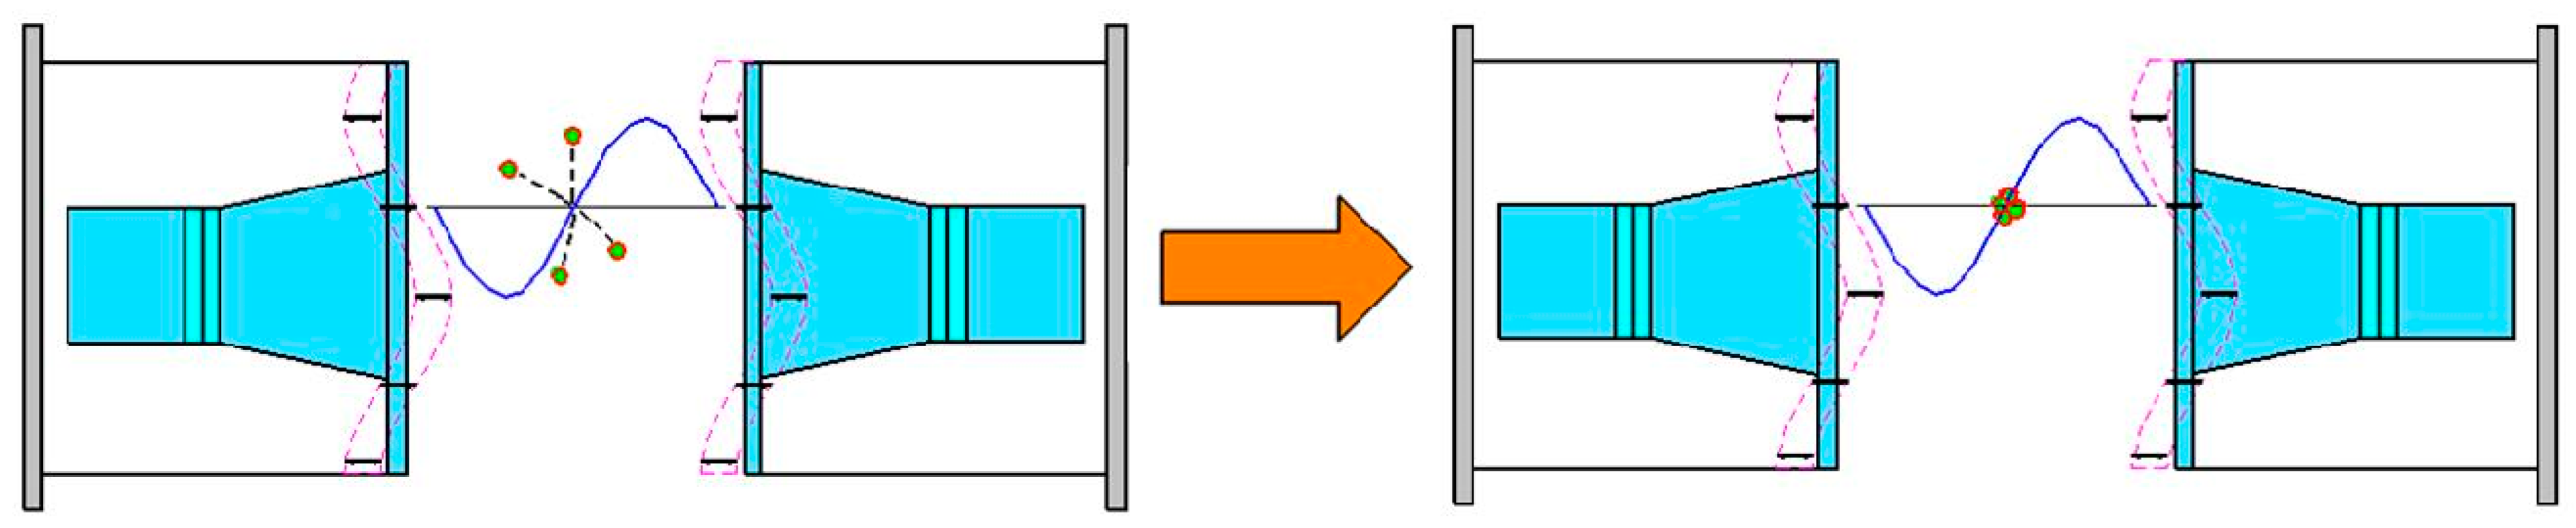
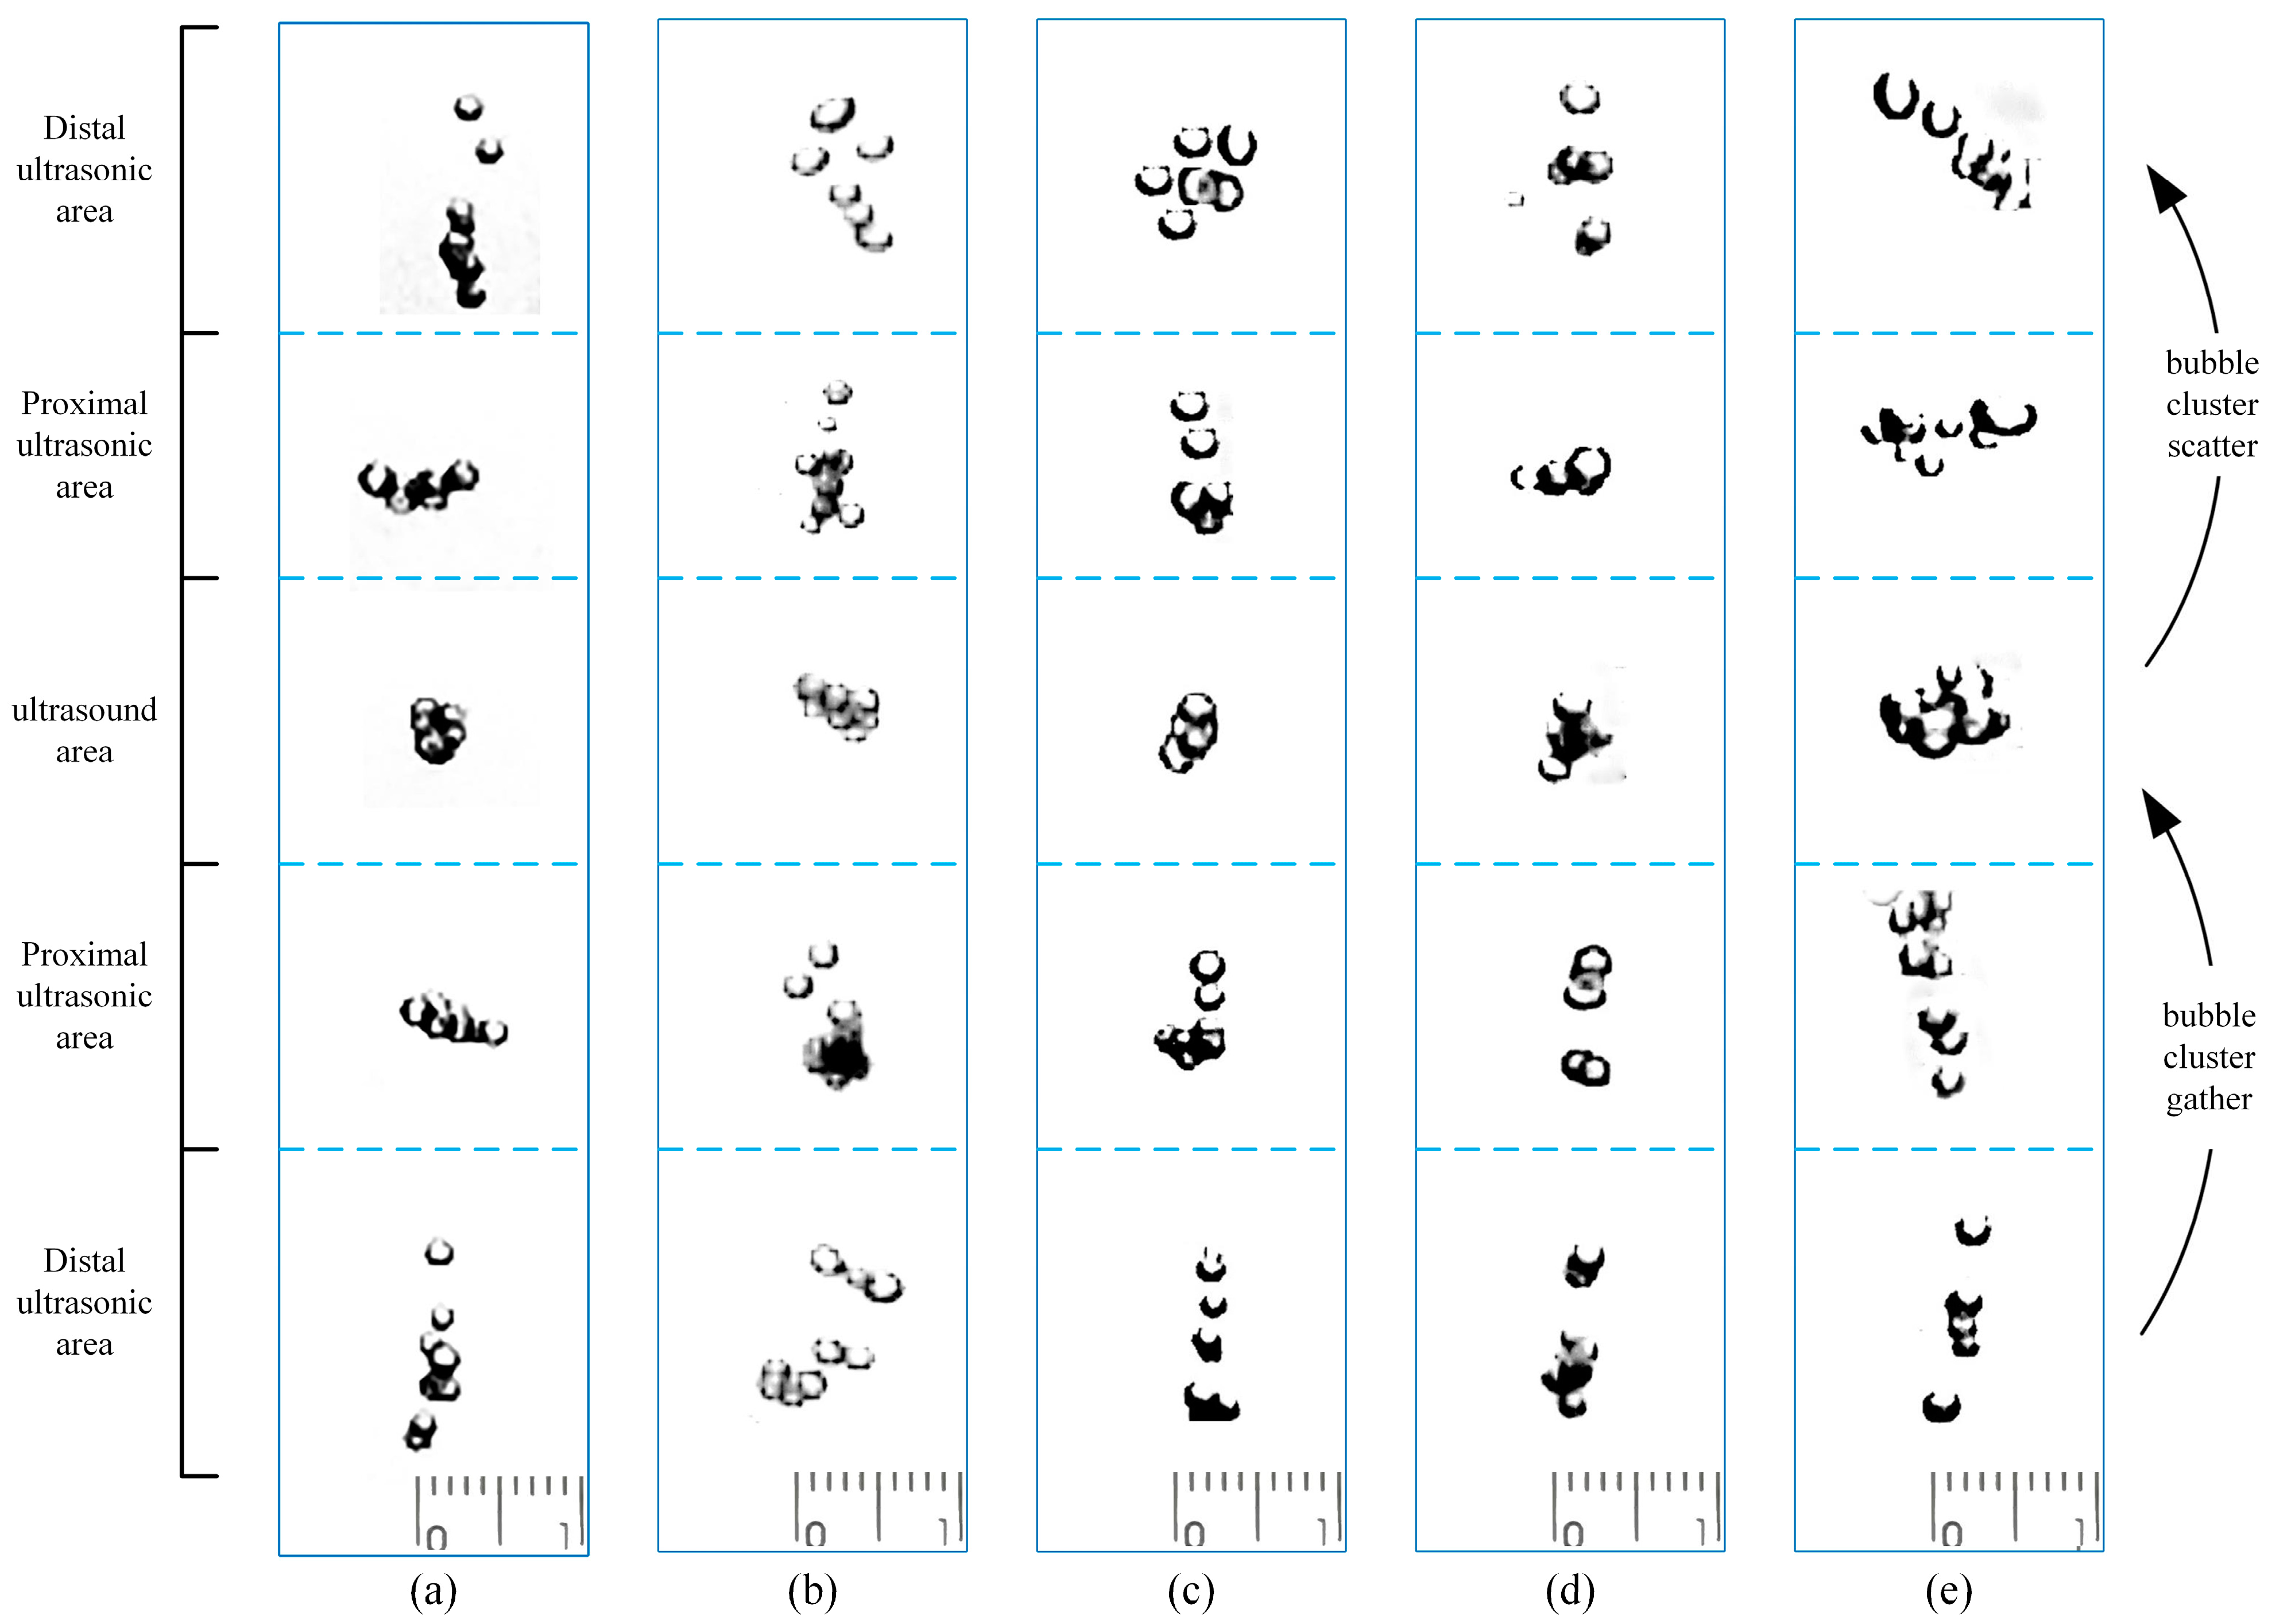
3.3.3. Aggregation Characteristics of Bubbles under the Action of Ultrasonic Field

In a fluid environment, as bubbles are subjected to an ultrasonic acoustic field arranged as in Figure 8, the bubbles themselves undergo morphological oscillations as well as transverse and longitudinal motions. Under the action of the ultrasonic field, spherical bubbles smaller than the resonance size move upward along the gradient direction driven by the acoustic pressure, while spherical bubbles larger than the resonance size move downward along the gradient direction driven by the acoustic pressure. Therefore, bubbles in the ultrasonic field, which are smaller than the resonance scale, cluster at the acoustic pressure antinodes. In contrast, bubbles which are larger than the resonance scale cluster at the acoustic pressure nodes [5].
When the flotation bubbles pass through the region, where the ultrasonic field immersed to the ultrasonic vibration plate is located, the acoustic field causes a change in the internal pressure of the liquid, which changes the distribution of the bubbles and causes them to have a tendency to aggregate, as shown in Figure 9. The image recordings of a particular bubble cluster produced by different needle aperture sizes at different times and at different vertical heights are shown in Figure 9, presenting the changes in the state of flotation bubble clusters passing through the distal ultrasound area, proximal ultrasound area, and ultrasound area throughout the whole process of the bubble cluster morphology. From the morphological changes of the flotation bubbles shown in Figure 9, it can be seen that the aggregation and dispersion characteristics of the bubble cluster undergo changes in five states: dispersed state; tending to aggregate and merge state; aggregating and merging state; tending to disperse state; and dispersed state in the process of the bubble cluster approaching the ultrasonic field action area, being in the ultrasonic field action area, and being far away from the ultrasonic field action area. The aggregating effect of the low-frequency ultrasonic field on large bubbles may be responsible for this phenomenon [19], and the magnitude of this attraction is closely related to the magnitude of the sound pressure [23]. The region with the strongest ultrasonic action is subjected to stronger ultrasonic acoustic pressure, and the pressure field of some liquid environments undergoes drastic changes (huge pressure fluctuations in local areas occur). Therefore, the effect of bubble agglomeration is most evident here, with the distance between bubbles decreasing and some bubbles fusing. Comparison of Figure 9a to Figure 9e reveals that at smaller needle aperture sizes, i.e., 0.2 to 0.4 mm, the number of bubbles in the bubble clusters is larger, and there is aggregation between bubbles but no apparent fusion. However, if the needle aperture is larger, i.e., the size of 0.6 mm, bubble aggregation and a certain degree of fusion obtains between the bubbles, where this phenomenon has a significant impact on the size of the flotation bubbles, which changes the flotation bubbles’ subsequent rising movement characteristics. Therefore, the flotation bubbles produced by needles with an aperture size of 0.2 mm to 0.4 mm are able to maintain their bubble morphology while maintaining bubble aggregation. This can improve the carrying capacity of bubbles without reducing the surface area, and bubbles can carry more mineral particles during flotation, thereby enhancing flotation efficiency.

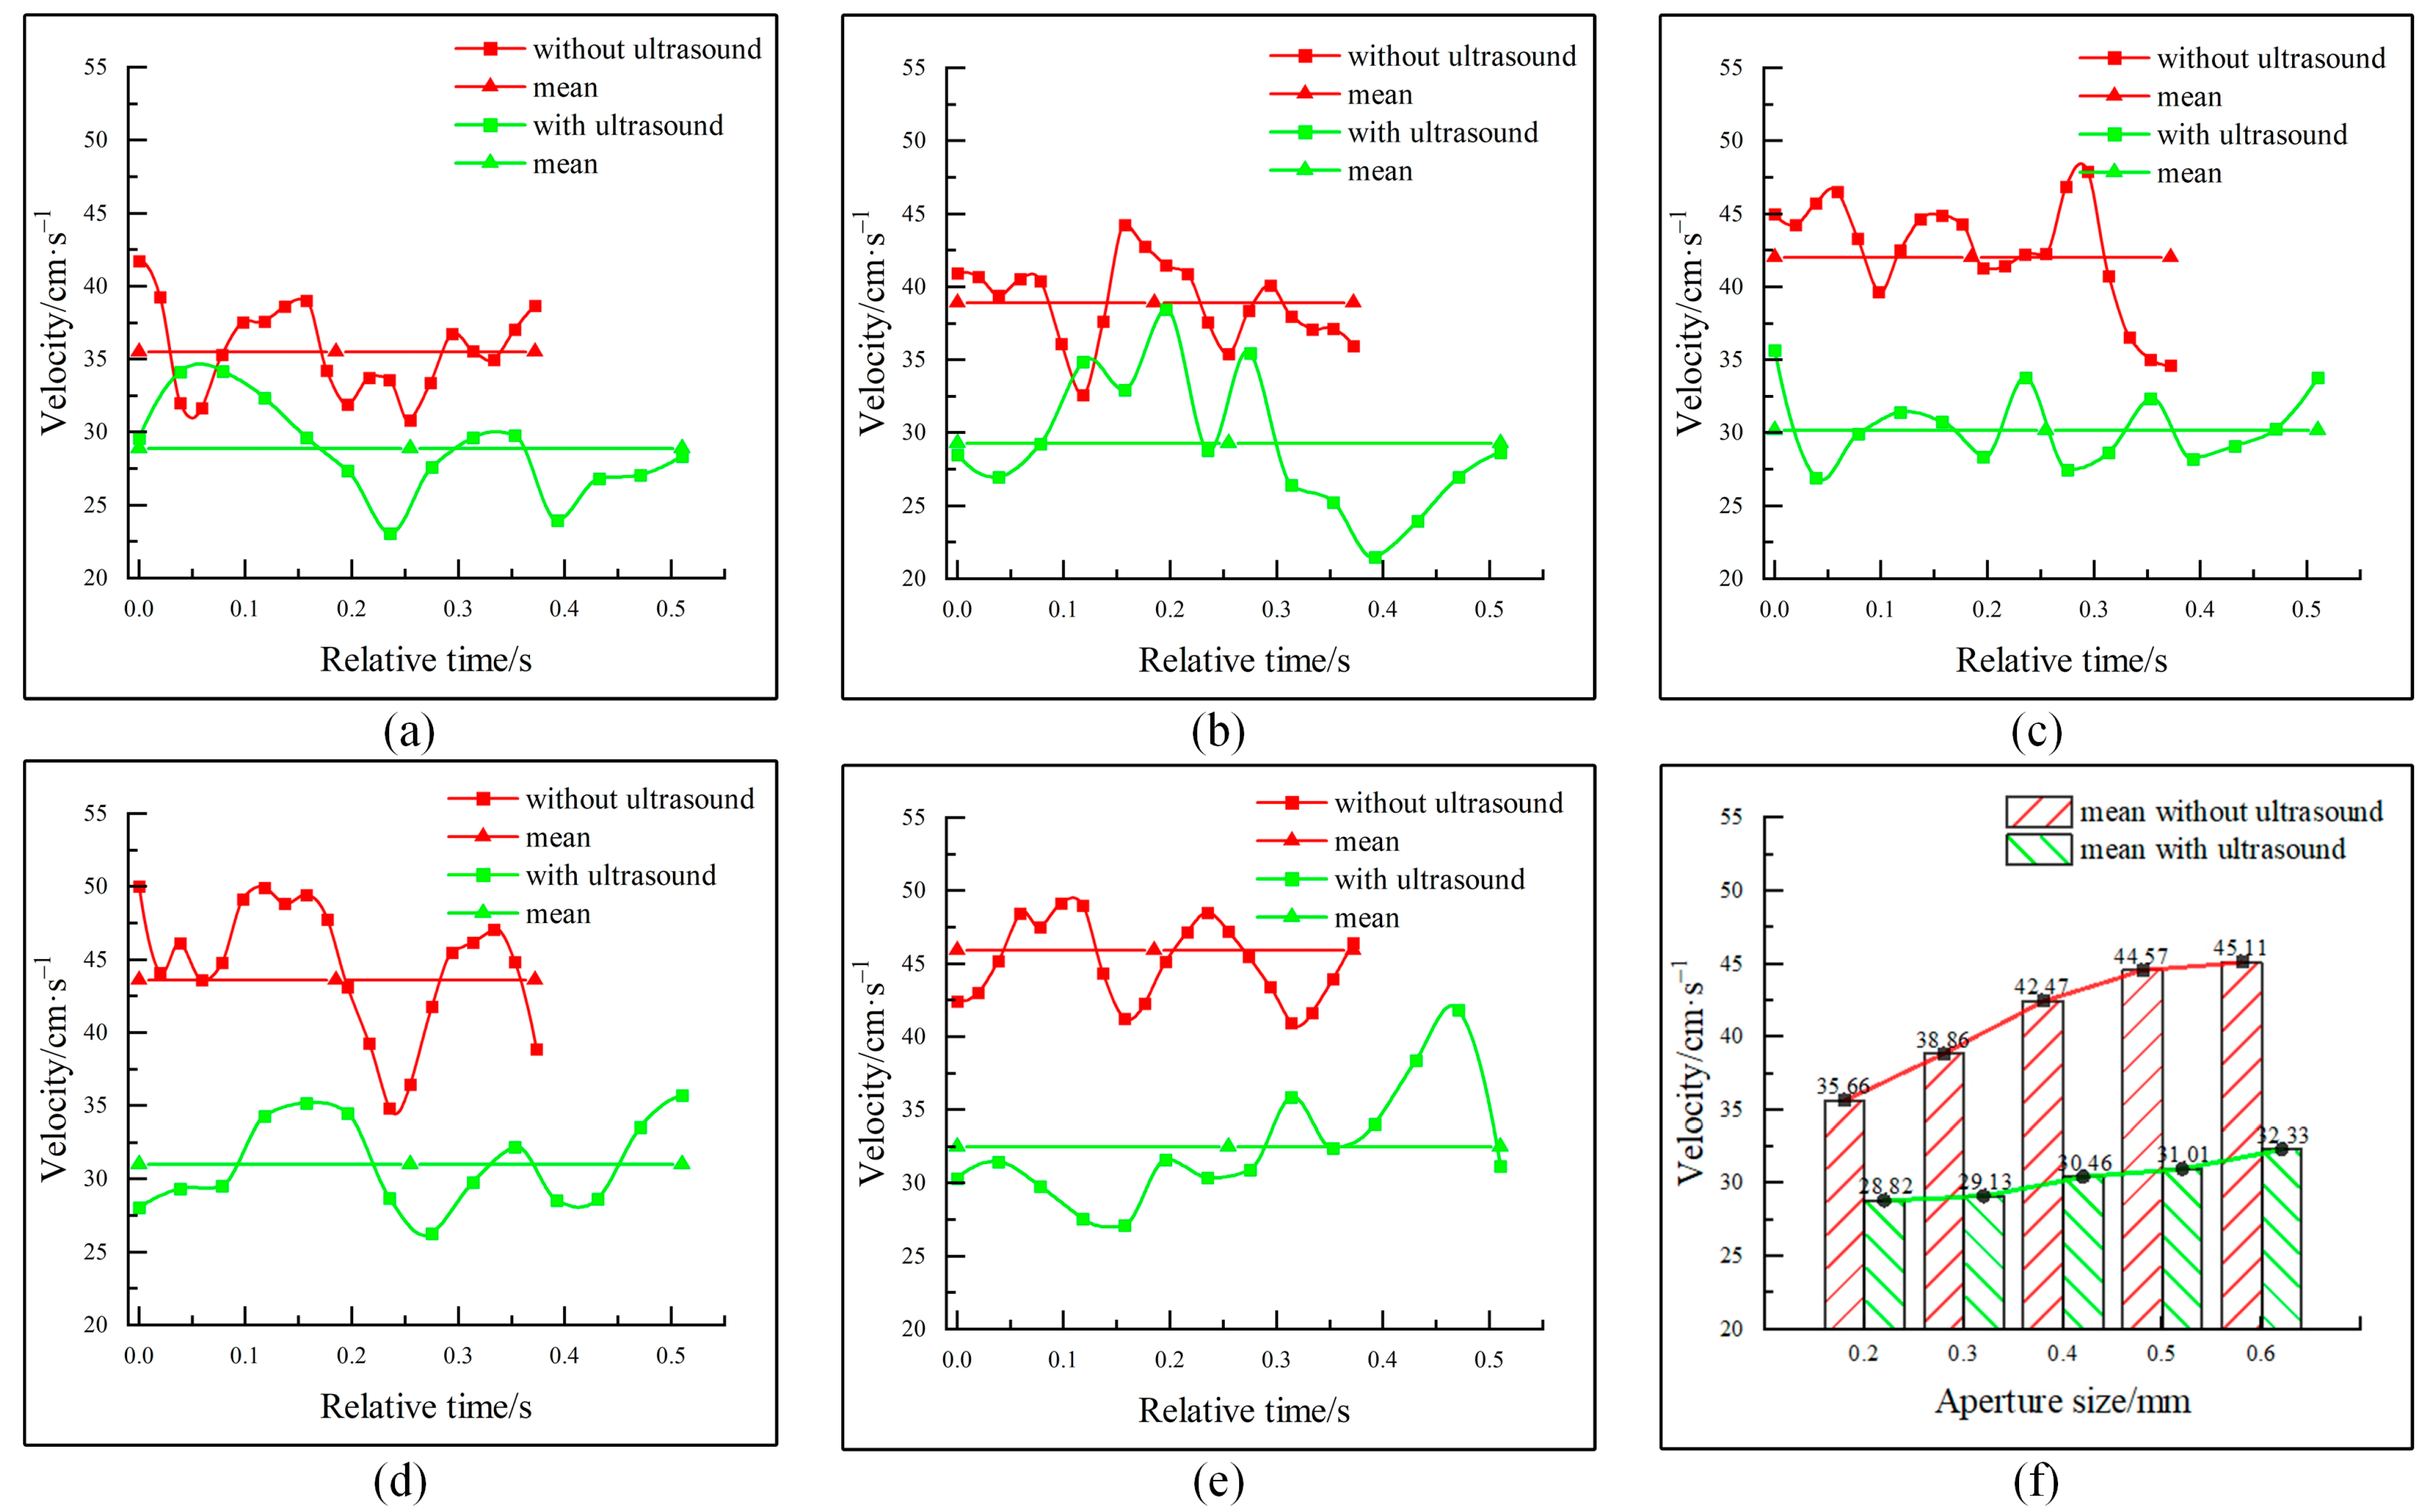
3.3.4. Motion Velocity Characteristics of Bubbles in an Ultrasonic Field

The data are processed using image processing software to intercept some positional data during the rising process of flotation bubbles to explore the characteristics of flotation bubble velocity change under the action of an ultrasonic field.
This experiment investigates the velocity characteristics of bubbles produced by different sizes of needle apertures under the action of an ultrasonic field. From the experimental results, the different aperture sizes of the needles cause the bubbles to have different diameter sizes after they are detached from the needles, which would significantly affect the rising motion of the bubbles. Based on the velocity fluctuation data during the rising process of the flotation bubbles, the velocity curves of the bubbles with five different needle aperture sizes were plotted under the two conditions without the ultrasonic field and with the ultrasonic field, as shown in Figure 10. For a certain air flow rate, the velocity of bubbles produced by needle apertures of sizes 0.2 mm and 0.3 mm without the action of the ultrasonic field fluctuates around the range of 30–40 cm/s. In contrast, the velocity of bubbles produced by needle apertures of 0.4 mm, 0.5 mm, and 0.6 mm fluctuates around 40–50 cm/s. Comparative analysis of the curves of the velocity of the bubbles produced by each size of needle aperture, combined with the variation in the average velocity in the absence of ultrasound shown in Figure 10f, shows that the velocity of the bubbles during the rising process increases with the size of the needle aperture for a certain air flow rate.
Observing the velocity curves of the bubbles with the ultrasonic field, it can be discovered that the velocity of the bubbles generated by the needles of five different aperture sizes fluctuates in the range of 20–40 cm/s during the rising process, and the velocity changes of the bubbles in the process of movement tend to be close to sinusoidal changes. The velocity fluctuations of bubbles generated by 0.4 mm and 0.5 mm apertures are relatively uniform and stable during the rising process, and the maximum fluctuation range of the velocity is only about 9–10 cm/s. In comparison, the velocity fluctuations of bubbles generated by 0.2 mm and 0.6 mm apertures are more prominent, and the maximum fluctuation range reaches about 15–17 cm/s.
By analyzing the average velocity line of the bubbles affected by the ultrasonic field, it can be discovered that, with the increase in the size of the needle aperture, the movement speed of the bubbles in the process of the rise shows an increasing trend, and the bubble uplift time becomes shorter within a given distance. The shorter the bubble uplift time, the shorter the flotation bubbles stay in the flotation column, which is not conducive to the flotation bubbles and particles in the flotation column experiencing sufficient collision and adhesion behavior, for the enhancement of flotation efficiency will have a negative impact. The data in Figure 10 show that under the action of the ultrasonic field, different sizes of needles produced different degrees of reduction in the velocity of movement of the flotation bubbles. As the size of the needle aperture increases, the magnitude of the decrease in bubble velocity induced by the ultrasonic field decreases. Comparing the velocities of flotation bubbles generated by various needle aperture sizes in the process of rising movement under the two conditions with and without the ultrasonic field, it can be observed that the rising speed of bubbles in the ultrasonic field is significantly reduced compared to the absence of an ultrasonic field. This can allow bubbles to stay in the flotation column for a longer period of time, increasing the gas content of the flotation column. This is quite beneficial for flotation. In addition, it can be concluded that the influence of needle aperture size on the rising velocity of flotation bubbles is weakened under the effect of the ultrasonic field, i.e., the change in flotation bubble velocity is reduced by the change in needle aperture size. Under a certain air flow rate, the air bubbles produced by a 0.4 mm needle aperture oscillate uniformly and stably in the rising process, and the average rising speed is maintained at about 30 cm/s, which is better than the other effects.

4. Conclusions

This paper studied the movement behavior of flotation bubbles under the ultrasonic action generated by an immersed ultrasonic vibration plate. First, we explored the optimal vibration frequency of the designed ultrasonic plate through simulation of its inherent vibration characteristics. Then, under the optimal vibration frequency, the distribution, coalescence, and velocity of the flotation bubbles generated by different needle aperture sizes were studied through experiments and simulations. For comparison, the characteristics of the flotation bubbles were also studied without ultrasonic action. The following conclusions have been obtained.
The optimal vibration frequency of the designed immersed ultrasonic vibration plate is about 19.4 KHz. The ultrasonic transducer’s amplitude values are regularly changed in areas A, B, C, and D. The amplitude distribution on the vibration plate is relatively uniform, with an average amplitude value of about 7.5 μm.
Without ultrasonic action, the volume, shape, and distribution of bubbles generated by needle aperture sizes of 0.3 mm and 0.4 mm are relatively uniform, showing a clear S-shaped distribution overall. When there is an ultrasonic action, bubbles can aggregate, and the distribution of bubble clusters is relatively uniform, with a 0.3 mm needle size being the best. When the needle size is 0.2 mm–0.4 mm, there are more bubbles in the bubble cluster. At this time, coalescence occurs between bubbles but they are not completely fused. The aggregated bubbles will exhibit a more obvious fusion phenomenon when the needle size increases to 0.5 mm and 0.6 mm.
When the needle size is the same, ultrasonic action reduces the velocity of flotation bubbles and weakens the influence of needle size on flotation bubble velocity. With a constant gas flux, a stable velocity of bubbles generated by a 0.4 mm aperture is maintained at around 30 cm/s.

Author Contributions

Conceptualization, K.G., L.S. and L.L.; Methodology, K.G., W.Z., Z.Z., L.S. and L.L.; Software, W.Z.; Validation, Z.Z. and L.S.; Formal analysis, L.L.; Investigation, L.S.; Resources, L.S.; Data curation, Z.Z.; Writing—original draft, W.Z. and Z.Z.; Writing—review & editing, W.Z.; Visualization, Z.Z.; Supervision, K.G., L.S. and L.L.; Project administration, L.S. and L.L.; Funding acquisition, L.S. All authors have read and agreed to the published version of the manuscript.

Funding

This work was supported by the National Natural Science Foundation of China (Grant Nos. 52104258, 52074175), Shandong Provincial Natural Science Foundation (Grant Nos. ZR2021ME016, ZR2020ME103), Taishan Scholars Program of Shandong Province, and Project of Shandong Province Higher Educational Young Innovative Talent Introduction and Cultivation Team (Intelligent Transportation Team of Offshore Products). The APC was funded by Liqing Sun.

Data Availability Statement

The original contributions presented in the study are included in the article, further inquiries can be directed to the corresponding authors.

Conflicts of Interest

The authors declare no conflicts of interest.

References

  1. Ren, L.Y.; Zhang, Y.M.; Qin, W.Q.; Bao, S.X.; Wang, J. Collision and attachment behavior between fine cassiterite particles and H2 bubbles. Trans. Nonferrous Met. Soc. China 2014, 24, 520–527. [Google Scholar] [CrossRef]
  2. Li, Y.J.; Liu, M.Y.; Li, X.N. Single bubble behavior in gas-liquid- solid mini-fluidized beds. Chem. Eng. J. 2016, 286, 497–507. [Google Scholar] [CrossRef]
  3. Norori-McCormac, A.; Brito-Parada, P.R.; Hadler, K.; Cole, K.; Cilliers, J.J. The effect of particle size distribution on froth stability in flotation. Sep. Purif. Technol. 2017, 184, 240–247. [Google Scholar] [CrossRef]
  4. Gao, F.; Peng, Y.Y.; Li, C.; Cui, W.; Yang, Z.H.; Zeng, G.M. Coupled nutrient removal from secondary effluent ad algal biomass production in membrane photobioreactor (MPBR): Effect of HRT and long-term operation. Chem. Eng. J. 2018, 335, 169–175. [Google Scholar] [CrossRef]
  5. Gao, K.D.; Hong, L.; Sun, L.Q.; Zhang, Z.H. Effect of Gas Input Conditions and Ultrasound on the Dynamic Behavior of Flotation Bubbles. ACS Omega 2022, 7, 22326–22340. [Google Scholar] [CrossRef] [PubMed]
  6. Ziegenhein, T.; Lucas, D. Observations on bubble shapes in bubble columns under different flow conditions. Exp. Therm. Fluid Sci. 2017, 85, 248–256. [Google Scholar] [CrossRef]
  7. Zhang, Y.C.; Wang, W.; Xu, X.; Yang, Q. Effect of bubble size on bubble rising velocity and stagnation in a granular bed. Chem. Eng. J. Adv. 2022, 12, 100425. [Google Scholar] [CrossRef]
  8. Li, C.W.; Dong, L.N.; Zhang, H.J. Recovery of clean coal from tailings by flotation with aid of ultrasonic. Energy Sources Part A Recovery Util. Environ. Eff. 2018, 40, 373–379. [Google Scholar] [CrossRef]
  9. Barma, S.D.; Baskey, P.K.; Rao, D.S.; Sahu, S.N. Ultrasonic-assisted flotation for enhancing the recovery of flaky graphite from low-grade graphite ore. Ultrason. Sonochem. 2019, 56, 386–396. [Google Scholar] [CrossRef]
  10. Filippov, L.O.; Royer, J.J.; Filippova, I.V. Improvement of ore recovery efficiency in a flotation column cell using ultra-sonic enhanced bubbles. J. Phys. Conf. Ser. 2017, 879, 012023. [Google Scholar] [CrossRef]
  11. Shu, K.Q.; Xu, L.H.; Wu, H.Q.; Fang, S.; Wang, Z.J.; Xu, Y.B.; Zhang, Z.Y. Effects of ultrasonic pre-treatment on the flotation of ilmenite and collector adsorption. Miner. Eng. 2019, 137, 124–132. [Google Scholar] [CrossRef]
  12. Shu, K.Q.; Xu, L.H.; Wu, H.Q.; Wang, Z.J.; Xu, Y.B.; Fang, S. Influence of ultrasound pre-treatment on ilmenite surface chemical properties and collectors’ adsorption behaviour. Ultrason. Sonochem. 2019, 57, 98–107. [Google Scholar] [CrossRef]
  13. Gungoren, C.; Baktarhan, Y.; Demir, I.; Ozkan, S.G. Enhancement of galena-potassium ethyl xanthate flotation system by low power ultrasound. Trans. Nonferrous Met. Soc. China 2020, 30, 1102–1110. [Google Scholar] [CrossRef]
  14. Wu, H.Q.; Fang, S.; Shu, K.Q.; Xu, Y.B.; Wang, Z.J.; Luo, L.P.; Yang, J.; Xu, L.H. Selective flotation and adsorption of ilmenite from titanaugite by a novel method: Ultrasonic treatment. Powder Technol. 2020, 363, 38–47. [Google Scholar] [CrossRef]
  15. Chen, Y.R.; Ni, C.; Xie, G.Y.; Liu, Q.X. Toward efficient interactions of bubbles and coal particles induced by stable cavitation bubbles under 600 kHz ultrasonic standing waves. Ultrason. Sonochem. 2020, 64, 105003. [Google Scholar] [CrossRef] [PubMed]
  16. Chen, Y.R.; Truong, V.N.T.; Bu, X.N.; Xie, G.Y. A Review of Effects and Applications of Ultrasound in Mineral Flotation. Ultrason. Sonochem. 2020, 60, 104739. [Google Scholar] [CrossRef]
  17. Chen, Y.R.; Chelgani, S.C.; Bu, X.N.; Xie, G.Y. Effect of the ultrasonic standing wave frequency on the attractive mineralization for fine coal particle flotation. Ultrason. Sonochem. 2021, 77, 105682. [Google Scholar] [CrossRef] [PubMed]
  18. Kursun, H.; Ulusoy, U. Zinc Recovery from a Lead-Zinc-Copper Ore by Ultrasonically Assisted Column Flotation. Part. Sci. Technol. 2015, 33, 349–356. [Google Scholar] [CrossRef]
  19. Jin, L.Z.; Wang, W.D.; Tu, Y.N.; Zhang, K.H.; Lv, Z.Q. Effect of ultrasonic standing waves on flotation bubbles. Ultrason. Sonochem. 2021, 73, 105459. [Google Scholar] [CrossRef]
  20. Liang, Y.N.; Wang, H.N.; Zhou, R.Q.; Li, D.L.; Zhang, H.J. Effect of ultrasonication on rising characteristics of a single gas bubble. Adv. Powder Technol. 2024, 35, 104305. [Google Scholar] [CrossRef]
  21. Pourkarimi, Z.; Rezai, B.; Noaparast, M.; Nguyen, A.V.; Chelgani, S.C. Proving the existence of nanobubbles produced by hydrodynamic cavitation and their significant effects in powder flotation. Adv. Powder Technol. 2021, 32, 1810–1818. [Google Scholar] [CrossRef]
  22. Mao, Y.Q.; Chen, Y.R.; Bu, X.N.; Xie, G.Y. Effects of 20 kHz ultrasound on coal flotation: The roles of cavitation and acoustic radiation force. Fuel 2019, 256, 115938. [Google Scholar] [CrossRef]
  23. Crum, L.A. Bjerknes forces on bubbles in a stationary sound field. J. Acoust. Soc. Am. 1975, 57, 1363–1370. [Google Scholar] [CrossRef]
  24. Pelekasis, N.A.; Tsamopoulos, J.A. Bjerknes forces between two bubbles. Part 1. Response to a step change in pressure. J. Fluid Mech. 1993, 254, 467–499. [Google Scholar] [CrossRef]
  25. Pelekasis, N.A.; Tsamopoulos, J.A. Bjerknes forces between two bubbles. Part 2. Response to an oscillatory pressure field. J. Fluid Mech. 1993, 254, 501–527. [Google Scholar] [CrossRef]
Figure 1. Immersed ultrasonic vibration plate: (a) 3D model of the vibrating plate and transducer area; (b) transducer model; (c) meshing models.
Separations 11 00234 g001
Figure 2. Schematic diagram of the experiment rig: (a) schematic diagram of the experimental setup; (b) physical diagram of the experimental setup.
Separations 11 00234 g002
Figure 3. Modal analysis of immersed ultrasonic vibrating plate: (a) 18.3 KHz; (b) 19.0 KHz; (c) 19.4 KHz; (d) 20.3 KHz; (e) 21.7 KHz.
Separations 11 00234 g003
Figure 4. Distribution of sampling points of immersed ultrasonic vibration plate amplitude experiment and their amplitude detection plots: (a) distribution of sampling points; (b) vibration plate amplitude detection cloud and E-section amplitude distribution.
Separations 11 00234 g004
Figure 5. Distribution and pressure cloud of bubbles with and without ultrasonic field action. (a) Without ultrasonic; (b) with ultrasonic; (c) bubbles 1 to 9 size distribution.
Separations 11 00234 g005
Figure 6. Spatial distribution characteristics of flotation bubbles with different needle sizes without ultrasonic action: (a) 0.2 mm; (b) 0.3 mm; (c) 0.4 mm; (d) 0.5 mm; (e) 0.6 mm; (f) lateral distribution of bubbles.
Separations 11 00234 g006
Figure 7. Spatial distribution characteristics of flotation bubbles with different needle sizes under ultrasonic action: (a) 0.2 mm; (b) 0.3 mm; (c) 0.4 mm; (d) 0.5 mm; (e) 0.6 mm; (f) lateral distribution of bubbles.
Separations 11 00234 g007
Figure 8. Bubble motion law under the action of immersed ultrasonic vibration plate.
Separations 11 00234 g008
Figure 9. Aggregation characteristics of flotation bubbles of different needle sizes with height under ultrasound action: (a) 0.2 mm; (b) 0.3 mm; (c) 0.4 mm; (d) 0.5 mm; (e) 0.6 mm.
Separations 11 00234 g009
Figure 10. Variation in bubble velocity with time without and with ultrasonic field for needle aperture diameters of (a) 0.2 mm, (b) 0.3 mm, (c) 0.4 mm, (d) 0.5 mm, and (e) 0.6 mm, respectively; (f) relationship between bubble velocity and aperture size.
Separations 11 00234 g010
Table 1. Needle aperture size.
Needle Number1-G272-G243-G224-G215-G20
Inner diameter of needle/mm0.20.30.40.50.6
Disclaimer/Publisher’s Note: The statements, opinions and data contained in all publications are solely those of the individual author(s) and contributor(s) and not of MDPI and/or the editor(s). MDPI and/or the editor(s) disclaim responsibility for any injury to people or property resulting from any ideas, methods, instructions or products referred to in the content.

