Article

Influence of Organic Carbon from Weathered Sediments on Triclocarban Distribution in Environmental Aqueous Systems

1
National University of Science and Technology Politehnica Bucharest, Faculty of Industrial Chemistry and Biotechnologies, 313 Splaiul Independentei Street, 060042 Bucharest, Romania
2
National Research and Development Institute for Chemistry and Petrochemistry ICECHIM, 202 Splaiul Independentei Street, 060021 Bucharest, Romania
*
Author to whom correspondence should be addressed.
Separations 2024, 11(9), 255; https://doi.org/10.3390/separations11090255
Submission received: 20 July 2024 / Revised: 14 August 2024 / Accepted: 23 August 2024 / Published: 25 August 2024
(This article belongs to the Special Issue Adsorption and Remediation of Emerging Pollutants from Water and Soil)

Abstract

:
In this study, the chemical distribution of triclocarban (TCC), in natural aqueous systems, between water and sediment, with different chemical compositions of the aqueous phase and different percentages of organic carbon (OC%) in the sediments is presented. The influences of the temperature, of the composition of the aqueous matrices of natural waters and (OC%) in the sediment over the solubility of triclocarban, and its distribution coefficient Kd values were studied. log KD at 25 °C varied between 1.94 and 3.27 for a sediment with 5.50% OC and between 3.95 and 5.93% for a sediment with 6.75% OC, in the studied aqueous systems, with different concentrations of OC in the sediment.

1. Introduction

Triclocarban, or 3,4,4-trichlorocarbanilide (TCC), was found up to 0.3% (w/w) in several personal care products [1], where it is used as a disinfectant, and it might cause allergies and milder, or more complicated, dysfunctions. It originates in different types of waters, natural or incompletely treated waste ones, from soaps, shampoos, deodorants, and detergents, where because of its hydrophobicity, accumulates usually in sediments. TCC is partially removed during wastewater treatment, and it remains in the aqueous environment at concentration levels up to tens of µg/L [2]. As an endocrine disruptor, its presence in the organism might provoke immune disfunctions, presenting health risks in humans and animals [3] even at low concentrations. The effect of TCC on the aqueous environment has to be estimated, due to its further migration in aquatic organisms, such as algae and fish [4]. Transformation compounds such as carbanilides impact the hormone induction of estrogens and steroid biogenesis [5]. To succeed in quantification and evaluation of its environmental concentrations and further possible toxic effects, it has to be taken into account its partition in natural or waste waters and sediment. In what concerns non-polar organic compounds, their distribution mostly occurs in the solid sediment of the aquatic matrices, usually in connection with the Koc (amorphous organic carbon/water partition coefficients) of hydrophobic organic substances. In sediments, the partition behavior of TCC is based on transport mechanisms such as sedimentation, molecular diffusion, and electrostatic forces and by several interactions: van der Waals forces, electric double layer, hydrogen bonding, and mutual adsorption. Schenker et al. [6] demonstrated a relationship of logKOW (octanol water partition coefficients) and log S (solubility of the organic compound) with the number of chlorine atoms from the chloro-organic structures and with content of organic carbon in the solid phase from the aquatic system (sorbent or sediment), confirmed by Razzaque and Grathwohl [7], too.
Aqueous solubility of TCC was determined and then correlated with experimental log KOC values. KOC reflects the distribution of organic substances between an aqueous phase and a solid one, based on the percentage of organic carbon from the last one. Usually, S and KOC are determined based on updated standards [8], but the evaluation of KOC values are not so facile, because log KOC varies among different chemical compositions of the aqueous systems, based on organic carbon composition. The log KOC values obtained might be modified by including sorption contributions onto carbon constituents of the solids [9].
In this study, the behavior of triclocarban, in terms of solubility and distribution in aqueous systems water–sediment, was evaluated. The study was conducted in the laboratory batch experiments, by mimicking natural systems with different chemical compositions of the aqueous phase, with different concentrations of organic carbon in the weathered sediment, at different temperatures. Because of the lack of data on log KOC values for TCC distribution in natural matrices water–sediment, this early study might be helpful in future applications concerning the green removal of triclocarban from natural waters and wastewaters.

2. Materials and Methods

All reagents necessary in the analysis were of analytical grade.
Analysis of TCC was conducted by HPLC, using a chromatograph Waters equipped with a UV detector and adapted software for data acquisition [10]. The chromatographic parameters were as follows: injection volume of 50 µL; 6 min analysis time; column temperature of 25 °C; column C18, 3.5 µm, 100 × 4.6 mm i.d.; flow rate of 1 mL/min, isocratic conditions 80:20 A: B (v/v), where A = acetonitrile and B = ultrapure water. Before each series of chromatographic separations, the analytical column is conditioned for 30 min with acetonitrile and balanced with an acetonitrile mixture: water (80:20 v/v). The TCC monitoring is carried out at the wavelength of 265 nm using the UV detector. Identification is achieved by comparing the retention time with the retention time (tR) of the standard solution. There were two calibration curves on the ranges 1–100 µg/L and 10–400 µg/L that were used to quantify the TCC. The calibration curves were graphically built by representing the area of the TCC peak vs. TCC concentration in the working standards [11].
To determine the cation content by the ICP-OES method, the Optima 2100 DV ICP-OES System (Perkin Elmer, Waltham, Massachusetts, US) equipment was used, with dual-view optical system—axial and radial view of the plasma in a single working sequence, which works with an independent transistorized radio frequency generator at a frequency of 40 MHz. The nebulization system is equipped with a PEEK Mira Mist® nebulizer coupled to the spray chamber—Baffled Cyclonic. The spectrometer has an optical module comprising an Echelle monochromator with a CCD detector (charged coupled device), two-dimensional, the spectral range being 165–800 nm. The determination of the inorganic matrix of the sediments was carried out [12,13,14] using dehydrated sediment (approx. 0.1 g) at 105 °C, mineralized by a mixture of HNO3 (65%):HCl (37%):HF (50%) = 6:2:2 mL. The calibration curves were obtained by dilution from the stock solutions of 1000 mg L−1 ICP Multi-Element Standard Certipur (Merck) and 100 mg L−1 Quality Control Standard 21 (Perkin Elmer) [15].
The pH was measured with a pH/conductometer WTW InoLab, Multi 720 series. pH and conductivity were measured based on EN 27888:1993-11 and on DIN 38404-5:1984-01, C5, before experiments. The total carbon (TC) and organic carbon (OC) were determined from the dried sediment at 40 °C with the TOC Analyzer, module Primacs MCS (SKALAR The Netherlands).
Sample preparation and characterization. The samples of waters and sediments used as sorbents were taken from the same aquifer area, from five different springs, the composition of waters reflecting those of the geological layers of the area [16,17]. The samples were filtered and dried at room temperature for several days, after which they were dried at a higher temperature for several hours. The humidity of dried sediment was then determined at 105 °C. Natural water samples were chromatographically analyzed before adding the weathered sediment with different organic carbon concentrations, depending on its composition. Then, both characterized sediment and water samples were mixed with measured volumes of analyzed waters in an experimental laboratory setup, consisting in a batch sorption cell.
Determination of TCC solubility. It was analyzed by the column elution method (USEPA, 1996a) [18], for substances with water solubility less than 10 mgL−1. TCC dissolved in acetonitrile with 0.25% v/v 1-octanol was deposed and dried onto glass beads. A certain amount, 2 g, of loaded beads is introduced into a glass column of 10 cm in length, representing a quarter of the total volume, three quarters being completed with ultrapure water, or NaCl aqueous solutions, or samples of natural waters with different compositions of aqueous matrix and of the sediment (Table 1 and Table 2). The temperature was controlled by a thermostatic column in all experiments, during 5 h each, samples being analyzed each 30 min, till equilibrium installs when a certain number of consecutive samples have concentrations with values differing less than 30%.
Boehm titration for determining organic carbon in weathered sediment. The acidic and basic functional groups were determined based on Boehm titration. Different acidic functional groups can be identified by using NaHCO3 solutions as titration reagent, for neutralizing only carboxyl groups and sodium carbonate solution for neutralizing carboxyl and lactonic groups. Based on this chemical behavior, NaHCO3 (pKa = 10.25) reacted with carboxylic groups (pKa < 5) but not with hydroxyl groups from phenols or alcohols (pH > 9). NaOH neutralizes all the oxygen-containing functional groups, meaning carboxyl, lactonic, and phenolic ones. Different types of oxygen-containing functional groups were quantified in this way by using the titration volume for the determination of the number of mmol H3O+ equivalent/g of weathered sediment (Table 3).
Experimental batch sorption setup. A 1 mg amount of adsorbent (weathered sediment)/100 mL of each water sample, at two temperatures of 5 and 25 °C, was stirred in the sorption bath, before adding the corresponding volumes of TCC stock solution. The contact time and the temperature were carefully monitored during the experiments and repeatedly analyzed during a contact time of 4 h.

3. Results

3.1. Characterization of the Natural Samples

Representative samples of natural aqueous systems might be difficult to achieve in studies concerning the quantification of contaminants at trace levels of concentration [19,20]. Analyzing the organic carbon concentration in weathered sediment and studying its influence over the sorption properties of the sediment in aqueous systems [21,22] require long periods of time for obtaining accurate experimental data.
The chemical characterization of the studied environmental aqueous systems is presented below in Table 1 and Table 2.
Table 2. Chemical composition of the aqueous matrices [23].
WaterpHC.e.
µS/cm
Na+,
mg/L
K+,
mg/L
Ca2+,
mg/L
HCO3
mg/L
Mg2+,
mg/L
17.32902.68 ± 0.251.79 ± 0.1456.1 ± 0.35212 ± 20.511.5 + 0.09
27.15005.46 + 0.281.55 ± 0.0940 ± 0.29209 ± 18.213.9 + 0.11
36.395010.96 ± 0.553.93 ± 0.25287 ± 20.51305 ± 100.589.0 + 0.07
46.770025.06 + 5.03.46 ± 0.20192 ± 15.2914 ± 80.732.7 + 0.02
55.9135055.85 + 9.28.22 ± 0.74130 ± 9.71044 ± 101.629.7 + 0.025
In Table 1, the characteristics of the sediment used in all the experiments are presented. It was taken monthly from the same aquifer and its features were averaged, taking into account the weathering process, which leads at the variation in organic carbon (OC%). The mixtures of spring water–weathered sediment samples also incorporate geochemical properties of the natural environment from which the samples were collected and emphasize the influence of environmental parameters over the chemical distribution of TCC between aqueous and solid phase.
In Table 2, the chemical composition of five natural water samples, located in the same aquifer, are presented. Five aqueous matrices were considered for observing the differences in TCC distribution between the same sediment, weathered in time, in contact with different aqueous phases, reflected by the differences between the major inorganic components present in the aqueous samples.

3.2. Characterization of the Weathered Sediments

The specific surfaces were calculated based on the adsorption/desorption data by using Brunauer–Emmet–Teller (BET) equations. The specific surface was measured by the nitrogen adsorption/desorption by using the BET method in between a range of relative pressures (P/P0) of 0.0001–0.99 [24]. Based on the BET equation, the specific surface was calculated, with the resulting differences in between based on the percentage of OC in weathered sediments. pH of the point of zero charge (pHPZC) represents the pH value for which the net surface charge of adsorbent is equal to zero, being observed that in adsorption studies, the process is dependent on pH. pHPZC was determined based on the pH drift method, the values being consistent with the literature [25]. The results obtained are presented in Table 3.
Table 3. Specific surface, pH of zero-point charge and the number of oxygen-containing functional groups in the weathered sediments determined by Boehm titration, depending on the weathering time.
Weathered SedimentSpecific Surface 1 SBET, m2∙g−1pHPZC 2Carboxylic Groups Conc. (mmol ∙g−1)Lactone Groups Conc. (mmol∙g−1)Phenolic Groups Conc. (mmol∙g−1)
At the beginning1108.5---
After one month1358.90.050.030.02
After three months1745.74.51.200.65
After 6 months2082.85.441.401.72
1 SBET(Brunauer–Emmet–Teller), m2∙g−1, specific surface. 2 pHPZC, pH of zero-point charge.
As can be observed from Table 3, there is a variation during the weathering time of the concentrations of different oxygen-containing functional groups (carboxylic, lactone, and phenolic) present on the surface of the studied sediment. Among these, the carboxylic groups present the most important increase after six months, probably being more sensitive to the small pH variations in the aqueous phase.

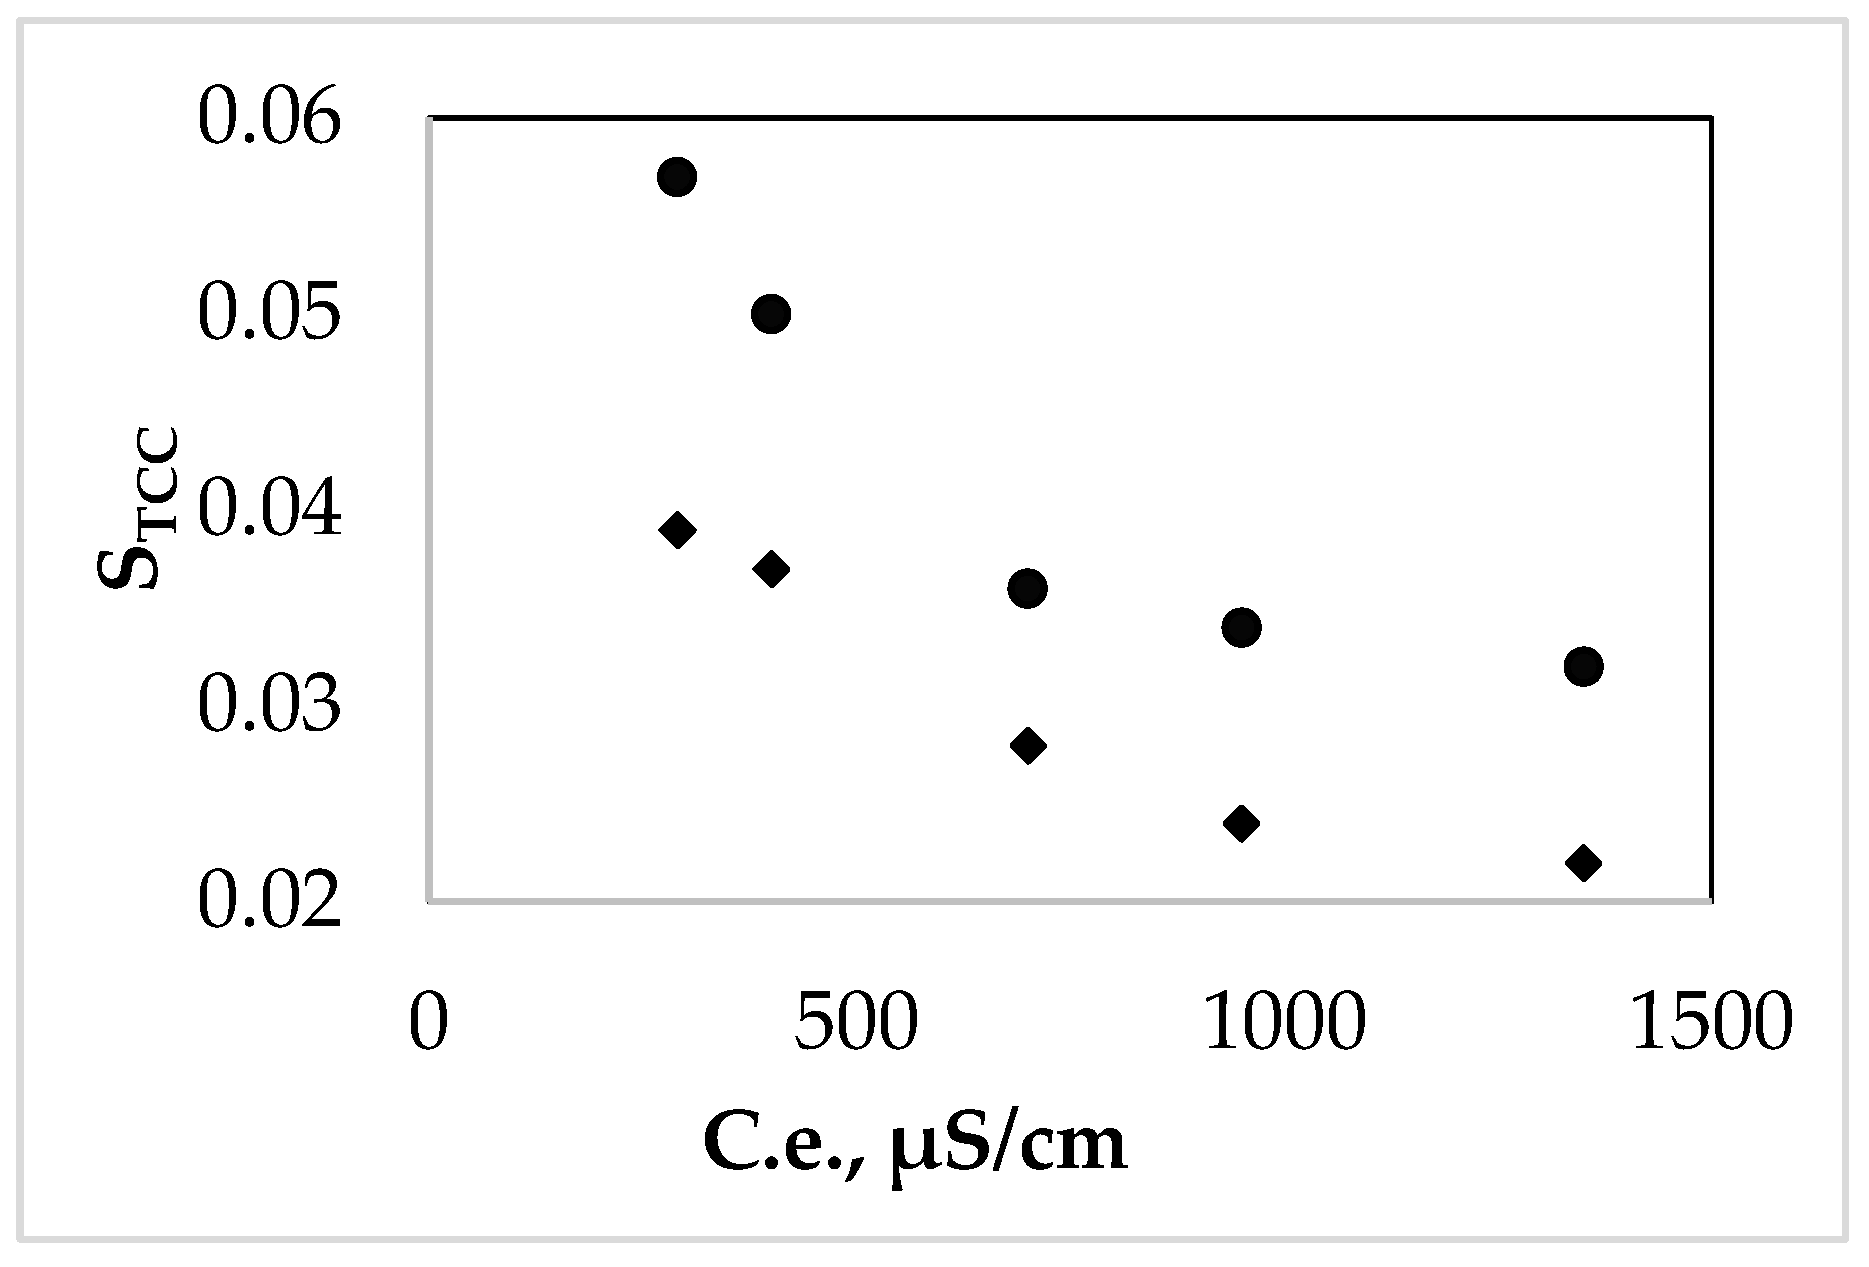
3.3. Influence of the Chemical Matrix of the Natural Water over TCC Solubility

The hydrophobic nature of TCC (log KOW = 3.5–4.5) [26] influences its partition in natural aqueous systems containing sediments. The solubility of TCC depends on the environmental conditions such as the chemical composition of the natural water, the seasonal temperature, and the pH.
The variation in the TCC concentrations in the aqueous phase, after stabilization, in the studied natural water samples (1–5) is presented in Table 4. TCC concentrations, at equilibrium, vary based on the chemical composition of the waters and on the temperatures, one averaged for the cold season and the other for the warm one, meaning 5 and 25 °C, respectively.
It can be observed from Table 4 that the solubility of TCC is influenced by the ionic strength of the aqueous solution, its solubility decreasing by increasing the ionic strength and increasing by the contact time. In aqueous systems with the same ionic strength, the solubility of TCC is influenced by the environmental temperature, increasing by increasing temperature of the aqueous solution. In all the experimental collected aqueous samples, the concentration of TCC was determined in order to estimate its initial concentration in the distribution experiments where the sediment is involved.

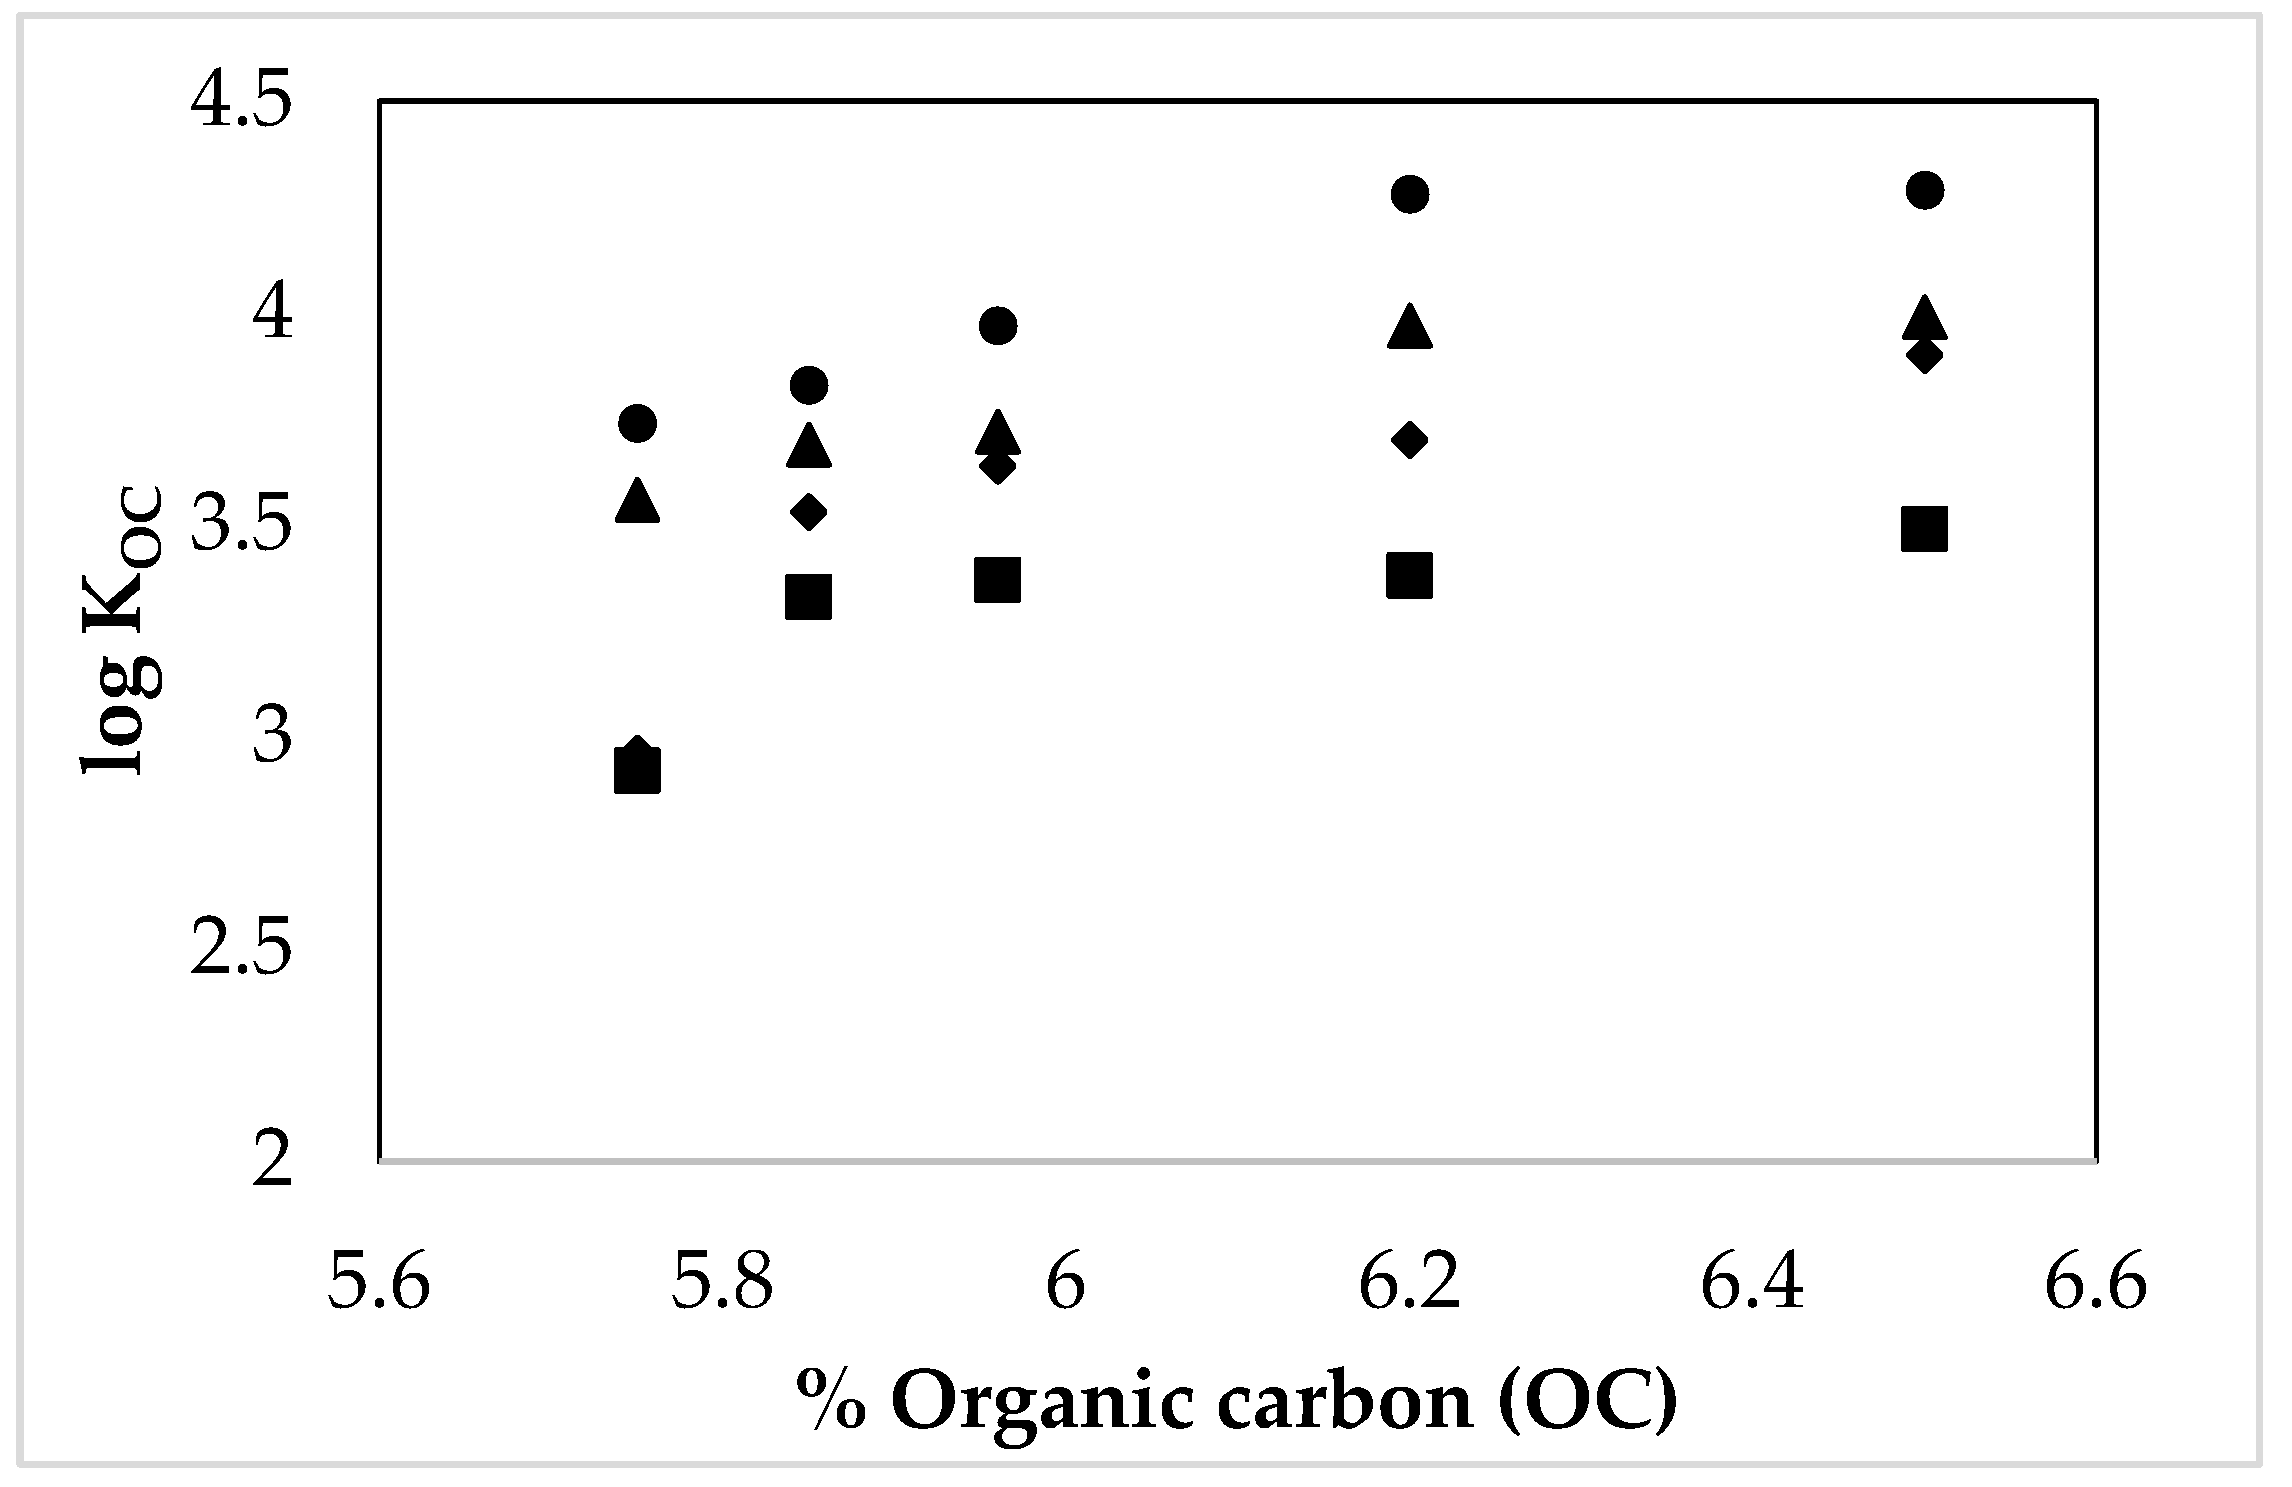
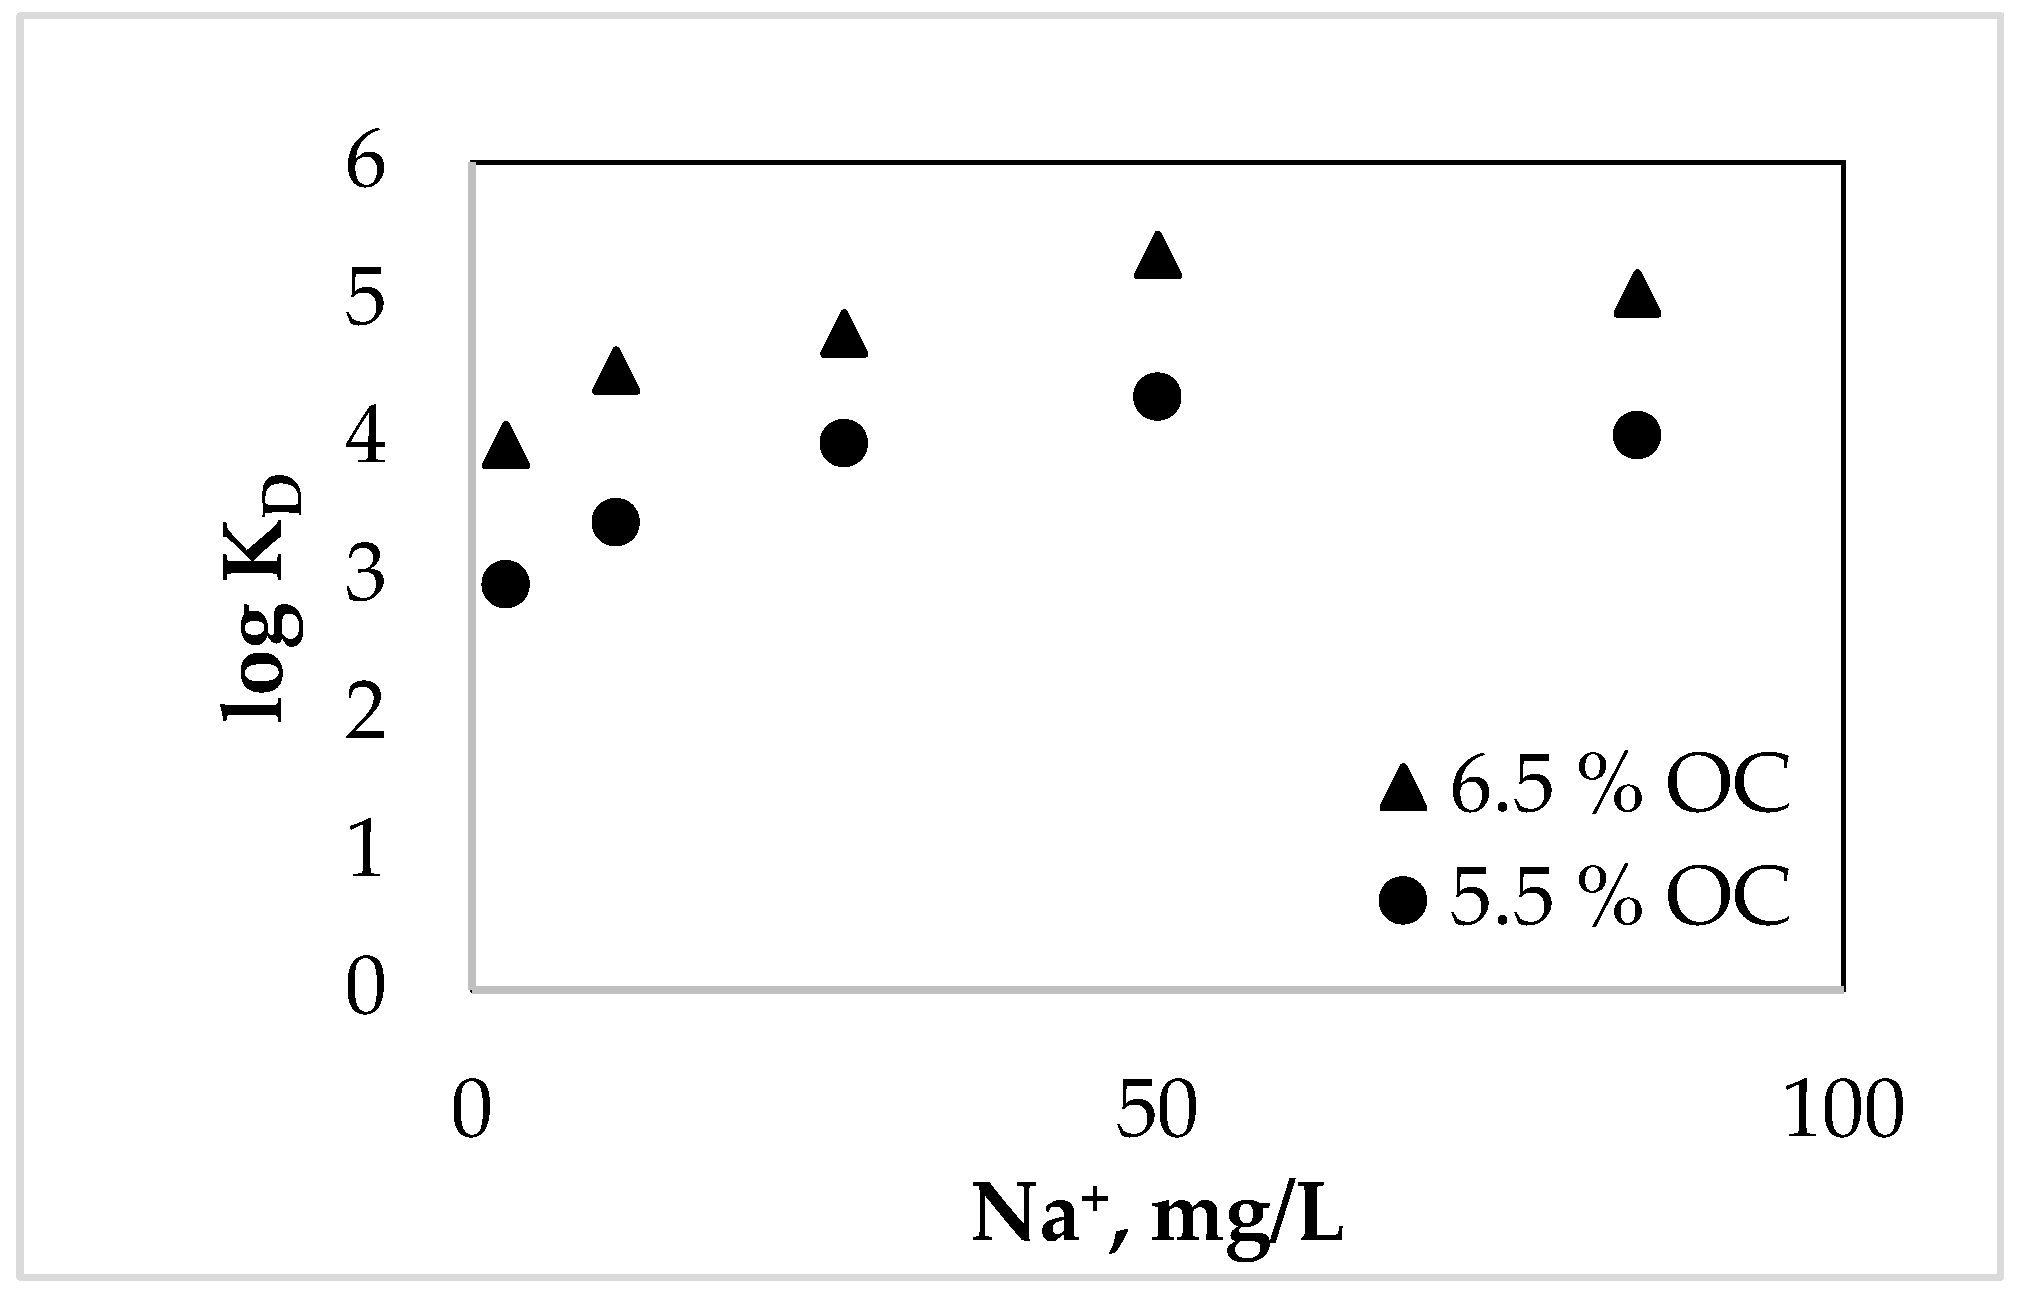
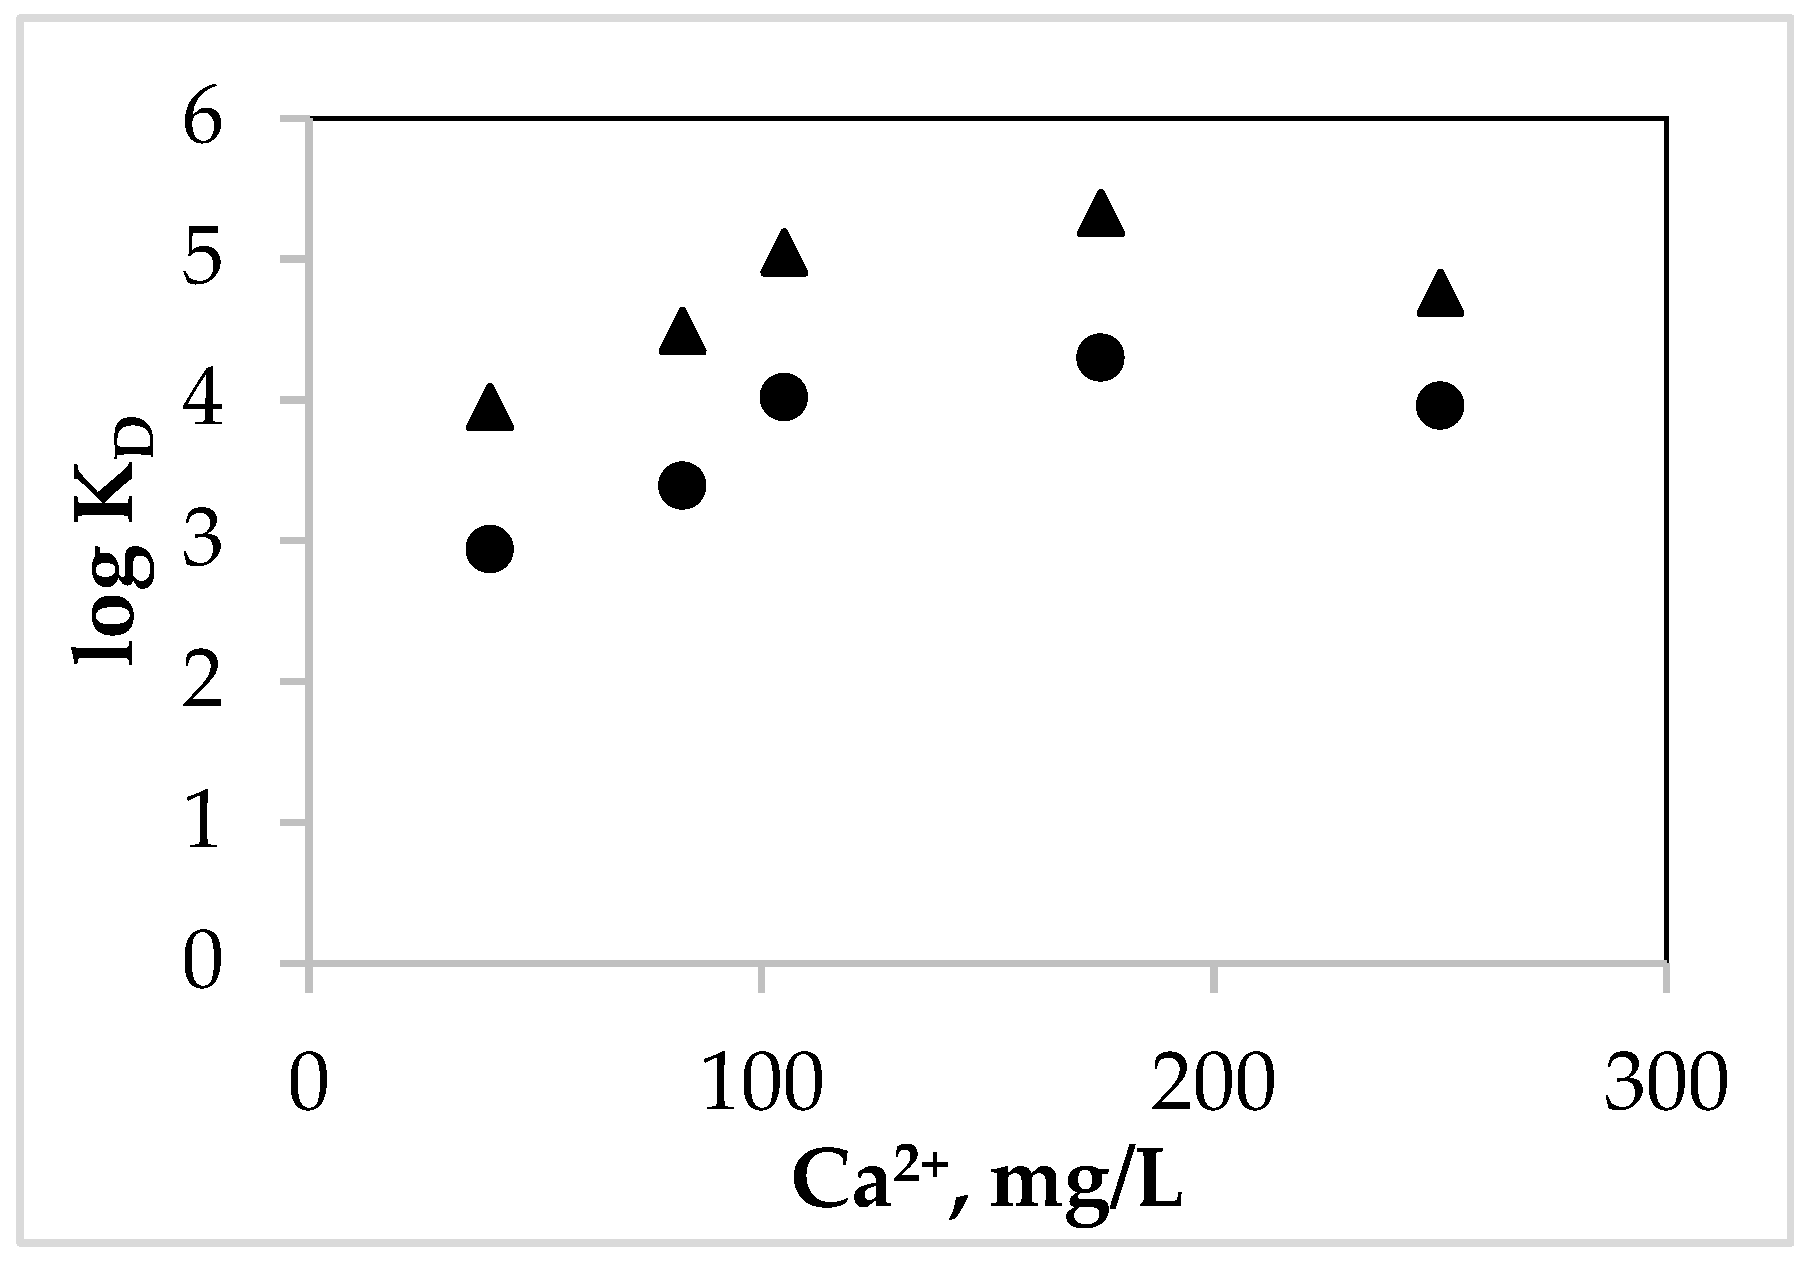
3.4. Influence of the Environmental Parameters over the TCC Solubility and Distribution in the Studied Natural Systems

Distribution of TCC in the studied natural systems, between waters and the sediment with different degrees of weathering, during a sampling period of six months was studied. The tested natural waters, with different initial TCC concentrations, indicated in Table 4, were in contact with the characterized sediment, in thermostatic sorption cells with reduced dimensions, at the two studied temperatures, for six hours. The solubility of TCC in the studied natural aqueous media was tested, the initial concentrations of TCC being used in further calculations (Figure 1).
Figure 1 illustrates the solubility of TCC in natural waters with different mineralization at 5 °C and 25 °C. The data indicate that higher ionic strength promotes TCC partitioning into the organic phase, a phenomenon known as the ‘salting-out effect’. This effect is more pronounced at higher temperatures, suggesting that TCC could accumulate more in sediments during warmer seasons, potentially affecting aquatic life. The polynomial relationship observed in Figure 1 indicates a salting-out effect, where increasing ionic strength enhances the partitioning of TCC into the organic phase. This might suggest higher bioaccumulation potential in more saline environments, which could impact.
Figure 2 shows the variation in the distribution coefficients, log KOC of TCC, in the studied natural aqueous systems with different concentrations of OC in weathered sediment at 5 and 25 °C.
The distribution coefficient KOC was assumed as a partition of the hydrophobic organic compound between water and sediment, depending on both the composition of the aqueous phase and the solid one. It was determined in the solution of each studied natural aqueous system as the ratio between adsorbed amount sorbate/kg solid sorbent), at equilibrium. It was observed that at lower temperatures, of 5 °C, the TCC distribution between water and weathered sediment decreases, the temperature influencing the TCC distribution much more strongly in comparison with the variation in OC% in the same experimental conditions.
The studied sediment in these experiments had OC averaged value of 5.75–6.75 ± 0.17% during the sampling period. The observed differences in TCC distribution between the aqueous solutions with different chemical compositions and the sediment might be explained [27] based on sediment composition, especially in what regards the OC [28], on the ionic strength of the aqueous phase and on the temperature at which the processes take place.
Increased OC concentration in weathered sediments in natural aqueous systems (water and sediments) leads to stronger sorption processes of organic hydrophobic contaminants, based on three factors: one concerning the stability of aqueous suspensions based on the chemical composition and on surface modification of the sediment caused by weathering factors; the second concerning the influence of the chemical composition of the sediments which act as sorbents for organic compounds; the third one based on the organic carbon concentration in the sediment—the higher the concentration of humic acid, the smaller the agreement with the additive model of distribution in these natural systems.
The pH values in natural water systems do not affect the colloidal stability, possibly because the weathered sediment, in correlation with the organic carbon part of it, may influence the adsorption process on the surface of the sediment, humic acid present in sediment increasing the electronegativity of the surface, mitigating the aggregation through electrosteric repulsions of aquatic organisms in a negative way.

4. Discussion

The partition coefficient KD of TCC was determined (Table 5) in environmental systems consisting of sediment with different concentrations of OC and natural waters with different ionic strengths and compositions, coming from the same aquifer. log KD at 25 °C varied between 1.94 and 3.27 for a sediment with 5.50% OC and between 3.95 and 5.93% for a sediment with 6.75% OC. Increased values of KD show TCC’s tendency to distribute preferentially in sediments with increased concentrations of OC, the TCC mobility decreasing in such systems. The TCC concentrations were measured in both phases, the KD values being calculated from the obtained experimental data, in triplicate.
Figure 3 shows the variation in the distribution coefficients, log KD of TCC in the studied natural aqueous systems depending on the concentrations of Na+, in aqueous matrices at 5 and 25 °C.
By increasing the concentration of Na+ in water, the increase in the sorption capacity of the sediment, for both OC% concentrations of weathered sediment, will be moderately influenced, until a 0.1 M aqueous concentration of Na+ is reached [29]. This was in accordance with previous results [30], where it was observed that natural organic matter, respectively OC%, increases the stability of sediment suspensions. Environmental concentrations are generally lower than 0.1 M; therefore, Na+ effect on the stability of sediment in aqueous systems is reduced [31]. In natural waters where Na+ concentration was higher than 180 mg/L, a stronger increase in TCC partition in the sediment was observed.
Figure 4 shows the variation in the distribution coefficients, log KD of TCC in the studied natural aqueous systems depending on the concentrations of Ca2+, in aqueous matrices at 5 and 25 °C.
The presence of Ca2+ ions substantially influence the TCC distribution in weathered sediments at 25 °C, the aggregation beginning from the critical coagulation concentration (CCC) in the presence of 4.80 mM Ca2+. It was observed that even at higher Na+ concentrations, the TCC distribution is mainly influenced by the presence of Ca2+ ions even at significantly lower concentrations in comparison with those of Na+. In aqueous samples with higher concentrations of Ca2+, the sorption capacity decreases on sediments with higher concentrations of OC, probably due to a decrease in the solubility of TCC in the aqueous solution.
The colloidal stability of the carbonic organic part (OC) of the sediment decreases by increasing the valence and the concentrations of monovalent and divalent cations present in the natural water systems. It was observed that the valence of cations and concentration have an important effect on the stability of the sediment, therefore on its sorption capacity, too.
The sorption capacity of the sediment seems to be influenced by the concentrations of major ions in the aqueous solution, based on the concentrations of Na+, Ca2+, Fe3+, and HCO3. The differences in the partition of TCC in sediments in aqueous solutions with different ratios of Na+ and Ca2+ might be comparable with the Schulze–Hardy rule [32], but there are also differences based on the composition of the sediment, concerning the concentration of organic carbon, OC%. In the aqueous samples with higher concentrations of trivalent ions Fe3+, the sorption capacity is alike, because in the aqueous matrix, in the presence of trivalent cations, the degree of aggregation of sediments increases. In the case of a lower temperature, of 5 °C, the TCC distribution is lowered, and the influence of the increased concentrations of Ca2+ is not so important [33].
TCC solubility was less influenced by the presence of monovalent cations in solution. In the presence of divalent cations, the decrease in solubility is higher at the same ionic strength of the aqueous solution. In natural systems containing weathered sediments and dissolved inorganic salts, the solubility of TCC might vary due to intermolecular interactions, beyond those of mono- and divalent cations in the aqueous phase.
In aqueous matrices containing bivalent cations (Ca2+ and Mg2+) and trivalent ones (Fe3+), even at low concentrations, the increase in organic carbon (OC%) in the sediment will lead to a decrease in TCC concentration in the aqueous solution, with ratios depending on its solubility influenced by the chemical composition of the aqueous matrix. It was also observed that the variation in temperature diminishes its influence over the sorption capacity of the sediments with higher OC concentrations. The obtained results suggest that the colloidal stability of the sediment is reduced in the presence of higher concentrations of divalent and trivalent cations, the value decreasing by increasing the valence and the concentrations of the ions in the aqueous solution.
The modification of the pH of the natural water solutions does not strongly influence the TCC distribution, because of the pKa of TCC of 12.7. No deprotonation takes place below this value of pH. It is also possible that the organic part of the sediment (natural organic matter mainly consisting of humic acids) will increase the electronegativity of the surface at basic pH values, hindering the aggregation of the sediment, due to the steric repulsions installed between the newly formed aggregates and positively influencing the TCC access to the surface of the sediment.

5. Conclusions

The behavior of TCC in the studied natural systems water–sediment was influenced by the temperature, the composition of the aqueous phase, and the composition of the sediment, especially by its organic part. It was observed that in cold seasons, the distribution of TCC is reduced in comparison with warmer ones, this being achieved by working at two seasonal temperatures, 5 and 25 °C. log KD at 25 °C varied between 1.94 and 3.27 for a sediment with 5.50% OC and between 3.95 and 5.93% for a sediment with 6.75% OC, in the studied aqueous systems, with different concentrations of OC in the sediment. Depending only on the concentration of organic carbon in the sediment, the values of the distribution coefficient of TCC vary, in the range of 1.94–5.93, independent of the season.
Our studies will continue on other completely characterized natural sediments, with variable concentrations of OC in different aqueous matrices, because the influence of their chemical compositions needs further studies. It might be possible for the increase in the OC concentration in the sediment to decrease the effect of divalent and trivalent cations’ concentrations in natural waters, through binding the active centers with the long aliphatic chains of the organic structures (humic or fulvic acids) from the sediments.

Author Contributions

Conceptualization, A.C.I. and I.I.; methodology, I.I.; software, R.M.S.; validation, A.C.I., I.I. and R.M.S.; formal analysis, A.C.I.; investigation, R.M.S.; writing—original draft preparation, A.C.I.; writing—review and editing, A.C.I. and R.M.S.; visualization, A.C.I., I.I. and R.M.S.; supervision, I.I. All authors have read and agreed to the published version of the manuscript.

Funding

This research received no external funding.

Data Availability Statement

The raw data supporting the conclusions of this article will be made available by the authors on request.

Conflicts of Interest

The authors declare no conflicts of interest.

References

  1. Gunasekara, A.S.; Troung, T. Environmental Fate of Fipronil; Environmental Monitoring Branch; California Environmental Protection Agency: Sacramento, CA, USA, 2005.
  2. Halden, R.U.; Paul, D.H. Co-occurrence of triclocarban and triclosan in U.S. water resources. Environ. Sci. Technol. 2005, 39, 1420–1426. [Google Scholar] [CrossRef] [PubMed]
  3. Vimalkumar, K.; Seethapan, S.; Pugazhendhi, A. Fate of triclocarban in aquatic and terrestrial systems and human exposure. Chemosphere 2019, 230, 201–209. [Google Scholar] [CrossRef] [PubMed]
  4. Pes, K.; Friese, A.; Cox, C.J.; Laize, V.; Fernanadez, I. Biochemical and molecular responses of the Mediterranean mussel to short-term exposure to three commonly prescribed drugs. Mar. Environ. Res. 2021, 168, 105309. [Google Scholar] [CrossRef] [PubMed]
  5. Lu, S.; Lin, C.; Lei, K.; Xin, M.; Wang, B.; Ouyang, W.; Liu, X.; He, M. Endocrine disrupting chemicals in a typical urbanized bay of Yellow Sea, China: Distribution, risk assessment and identification of priority pollutants. Environ. Pollut. 2021, 287, 117588. [Google Scholar] [CrossRef]
  6. Schenker, U.; Macleod, M.; Scheringer, M.; Hungerbuhler, K. Improving data quality for environmental fate models a least squares adjustement procedure for harmonizing physico chemical properties of organic compounds. Environ. Sci. Technol. 2005, 39, 8434–8441. [Google Scholar] [CrossRef]
  7. Razzaque, M.M.; Gratwohl, P. Predicting organic carbon-water patitioning of hydrophobic organic chemicals in soils and sediments based on water solubility. Water Res. 2008, 42, 3775–3780. [Google Scholar] [CrossRef]
  8. Qian, Y.; Xia, S.; Ma, P. Octanol/water partition coefficient of substituted benzene derivatives containing halogens and carboxyl-determination using the shake-flask method and estimation using fragment method. J. Chem. Eng. Data 2008, 53, 280–282. [Google Scholar]
  9. Niederer, C.; Goss, K.U. Effect of ortho-chlorine substitution on the partition behavior of chlorophenols. Chemosphere 2008, 71, 697–702. [Google Scholar] [CrossRef]
  10. Ion, I.; Senin, R.M.; Ivan, G.R.; Radulescu, I.; Ion, A.C. Effect of ionic strength and natural organic matter in aqueous solutions over the sorption of organic contaminants on irradiated and pristine carbon nanomaterials. U.P.B. Sci. Bull. Ser. B Chem. Mater. Sci. 2018, 80, 17–30. [Google Scholar]
  11. Ivan, G.R.; Capra, L.; Ion, I.; Ion, A.C. Effects of pH, temperature, ionic strength and organic matter on triclocarban solubility. J. Environ. Eng. Landsc. Manag. 2021, 29, 244–250. [Google Scholar] [CrossRef]
  12. Capra, L.; Manolache, M.; Ion, I.; Ion, A.C. Validation of a method for determination of antimony in drinking water by ICP-OES. U.P.B. Sci. Bull. Ser. B Chem. Mater. Sci. 2016, 78, 103–112. [Google Scholar]
  13. Ion, A.C.; Ion, I.; Antonisse, M.M.G.; Snellink-Ruel, B.H.M.; Reinhoudt, D.N. Characteristics of fluoride-selective electrode with uranyl salophen receptors in aqueous solutions. Russ. J. Gen. Chem. 2001, 71, 159–161. [Google Scholar] [CrossRef]
  14. Ion, I.; Culetu, A.; Costa, J.; Luca, C.; Ion, A.C. Polyvinyl chloride-based membranes of 3,7,11-tris (2-pyridylmethyl)-3,7,11,17-tetraazabicyclo [11.3.1] heptadeca-1(17),13,15-triene as a Pb(II)-selective sensor. Desalination 2010, 259, 38–43. [Google Scholar] [CrossRef]
  15. Capra, L.; Manolache, M.; Ion, I.; Stoica, R.; Stinga, G.; Doncea, S.M.; Alexandrescu, E.; Somoghi, R.; Calin, M.R.; Radulescu, I.; et al. Adsorption of Sb (III) on oxidized exfoliated graphite nanoplatelets. Nanomaterials 2018, 8, 992. [Google Scholar] [CrossRef] [PubMed]
  16. Droppo, I.G.; Ongley, E.D. The state of suspended sediments in the fresh water fluvial environment—A method of analysis. Water Res. 1992, 26, 65–72. [Google Scholar] [CrossRef]
  17. Philips, J.M.; Russel, M.A.; Walling, D. Time-integrated sampling of fluvial suspended sediment: A simple methodology for small catchments. Hydrol. Process. 2000, 14, 2589–2602. [Google Scholar] [CrossRef]
  18. United States Environmental Protection Agency (USEPA). Product Properties Test Guidelines, OPPTS 830:7840, Water Solubility: Column Elution Method: Shake Flask Method; United States Environmental Protection Agency (USEPA): Washington, DC, USA, 1996.
  19. Walling, D.E. Physical and chemical properties of sediment: The quality dimension. Int. J. Sediment Res. 1989, 4, 27–39. [Google Scholar]
  20. Phillips, J.M.; Walling, D.E. The particle size characteristics of fine-grained channel deposits in the river Exe Basin, Devon UK. Hydrol. Process. 1999, 13, 1–19. [Google Scholar] [CrossRef]
  21. McLeod, P.B.; Van Den Heuvel-Greve, M.J.; Allen King, M.R.; Luoma, S.N.; Luthy, G.R. Effects of particulate carbonaceous matter on the bioavailability of benzopyrene and 2,2’,5,5’-tetrachlorobiphenyl to the clam, Macoma balthica. Environ. Sci. Technol. 2000, 34, 1729–1736. [Google Scholar]
  22. Ghosh, U. In-situ sorbent amendments: A new direction in contaminated sediment management. Environ. Sci. Technol. 2011, 45, 1163–1168. [Google Scholar] [CrossRef]
  23. Calin, M.R.; Radulescu, I.; Ion, A.C.; Sirbu, F. Radiochemical investigations on natural mineral waters from Bucovina region, Romania. Rom. J. Phys. 2016, 61, 1051–1066. [Google Scholar]
  24. Quach, N.K.N.; Yang, W.D.; Chung, Z.J.; Tran, H.L. The influence of the activation temperature on the structural properties of the activated carbon xerogels and their electrochemical performance. Ann. Mater. Sci. Eng. 2017, 9, 8308612. [Google Scholar] [CrossRef]
  25. Gusain, R.; Kumar, N.; Ray, S.S. Recent advances in carbon-nanomaterial-based adsorbents for water purification. Coord. Chem. Rev. 2020, 405, 213111. [Google Scholar] [CrossRef]
  26. Snyder, E.H. Fate, Transport and Risk Assessment of Biosolids-Borne Triclocarban (TCC). Ph.D. Thesis, University of Florida, Gainesville, FL, USA, 2009. [Google Scholar]
  27. Yousefi, N.; Lu, X.; Elimelech, M. Environmental performance of of graphene-based 3D nanostructures. Nat. Nanotechnol. 2019, 14, 107–119. [Google Scholar] [CrossRef] [PubMed]
  28. Wu, C.; Spongberg, A.L.; Witter, J.D. Adsorption and degradation of triclosan and triclocarban in soils and biosolids-amended soils. J. Agric. Food Chem. 2009, 57, 4900–4905. [Google Scholar] [CrossRef]
  29. Zhang, L.; Zhang, Y.; Lin, X.; Yang, K.; Lin, D. The role of humic acid in stabilizing fullerene C60 suspensions. J. Zhejiang Univ.—Sci. A Appl. Phys. Eng. 2014, 15, 634–642. [Google Scholar] [CrossRef]
  30. Duncan, L.K.; Jinscheck, J.R.; Vikesland, P.J. C60 colloid formation in aqueous systems: Effects of preparation method on size, structure and surface charge. Environ. Sci. Technol. 2008, 42, 173–178. [Google Scholar] [CrossRef] [PubMed]
  31. Lin, D.; Liu, N.; Yang, K.; Xing, B.; Wu, F. Different stabilities of multiwalled carbon nanotubes in fresh surface water samples. Environ. Pollut. 2010, 158, 1270–1274. [Google Scholar] [CrossRef] [PubMed]
  32. Hwang, Y.S.; Li, Q.L. Characterizing photochemical transformation of aqueous nC60 under environmentally relevant conditions. Environ. Sci. Technol. 2010, 44, 3008–3013. [Google Scholar] [CrossRef]
  33. Chen, K.L.; Elimelech, M. Influence of humic acid on the aggregation kinetics of fullerene C60 nanoparticles in monovalent and divalent electrolyte solutions. J. Colloid Interface Sci. 2007, 309, 126–134. [Google Scholar] [CrossRef]
Figure 1. Solubility values of TCC in natural waters with different mineralization (1–5), at 5 (•) and 25 °C (♦), after four hours of contact time.
Separations 11 00255 g001
Figure 2. Variation in the distribution coefficients, log KOC of TCC, in two studied natural aqueous systems vs. different concentrations of OC in progressively weathered sediment at 5 and 25 °C, as follows: (•) C.e. 290 µS/cm at 25 °C; (♦) C.e. 290 µS/cm at 5 °C; (▲) C.e. 700 µS/cm at 25 °C; (■) C.e. 700 µS/cm at 5 °C
Separations 11 00255 g002
Figure 3. Variation in the distribution coefficients, log KD of TCC in the studied natural aqueous systems vs. different concentrations of Na+, in aqueous matrices at 5 and 25 °C.
Separations 11 00255 g003
Figure 4. Variation in the distribution coefficients, log KD of TCC in the studied natural aqueous systems vs. different concentrations of Ca2+, in aqueous matrices at 5 and 25 °C, as follows: (♦) Ca2+, 25 °C; (•) Ca2+, 5 °C
Separations 11 00255 g004
Table 1. Chemical characterization of the tested sediment, std. dev. being calculated for monthly sampling, during six months.
ComponentValue
Humidity (105 °C), %5.48 ± 0.02
Inorganic Carbon IC, %2.47 ± 0.16
Organic Carbon TOC, %5.75 ± 0.15–6.75 ± 0.17, weathered in time
Ca %5.19
Mg %2.04
K %1.31
Fe %2.11
Table 4. Variation in the TCC concentrations, after stabilization, in the five studied natural water samples (1–5) based on their chemical composition, for an initial TCC concentration of 400 µg/L.
Contact
Time
(Stirring), h
TCC Concentration, µg/L
Samples 1Samples 2Samples 3Samples 4Samples 5
25 °C5 °C25 °C5 °C25 °C5 °C25 °C5 °C25 °C5 °C
123.422.39.394.723.49.810.47.521.631
325.842.926.213.534.916.632.811.434.753.3
427.357.336.614.733.223.236.319.038.654.6
Table 5. Variation in the distribution coefficients, log KD of TCC in the studied the natural aqueous systems with different concentrations of inorganic salts and two different concentrations of OC in weathered sediment at 25 °C, in the presence of sodium and calcium as major cations present in the aqueous phase.
Na+
mg/L
Ca2+
mg/L
Log KD, S 1Log KD, S 2
2.5040.002.94 ± 0.263.90 + 0.32
4.1082.003.39 ± 0.244.49 + 0.30
7.15250.003.96 ± 0.194.76 + 0.30
95.00105.004.02 ± 0.205.05 + 0.26
50.60175.004.27 ± 0.195.33 + 0.30
S 1: natural systems water—sediment with 5.50% TOC; S 2: natural systems water—sediment with 6.75% TOC.
Disclaimer/Publisher’s Note: The statements, opinions and data contained in all publications are solely those of the individual author(s) and contributor(s) and not of MDPI and/or the editor(s). MDPI and/or the editor(s) disclaim responsibility for any injury to people or property resulting from any ideas, methods, instructions or products referred to in the content.

