Abstract
Although PDO Pecorino Sardo is one of the oldest traditional cheeses of Sardinia, Italy, data on its nutritional properties and food safety are lacking. In particular, significant amounts of lactose and galactose may be a health concern for consumers. The primary objective of this study is to quantify, using a validated GC-FID method, the residual lactose and galactose content in “maturo” (i.e., ripened for at least two months) Protected Denomination of Origin (PDO) Pecorino Sardo cheese. A statistically representative sampling from seven dairies distributed throughout Sardinia has been selected for this aim. In addition to lactose and galactose, two of their metabolites (i.e., glucose and tagatose, respectively) and a bioactive polyol like myo-inositol were quantified. The concentration of lactose (mean 26 mg kg−1, range 4–90 mg kg−1) was below the strictest limit set in the European Union (i.e., 100 mg kg−1), while the galactose content was found to be in an amount (mean: 76 mg kg−1, range: 10–200 mg kg−1) that even patients afflicted with severe galactosemia, albeit with some circumspection, could consume this cheese. Ripening (two to four months) had no significant effect on the amount of all analytes, while a slight decrease in galactose levels was observed during the manufacturing season. Finally, the amounts of glucose, tagatose, and myo-inositol are constant in the range of a few tens of mg kg−1.
Keywords:
sheep’s cheese; pecorino sardo; lactose; galactose; glucose; tagatose; myo-inositol; GC-FID; lactose intolerance; galactosemia 1. Introduction
Protected Designation of Origin (PDO) Pecorino Sardo is a traditional semi-cooked cheese from sheep’s milk produced in Sardinia, Italy [1]. It is available in two varieties: “maturo” (ripened for at least 2 months) and “dolce” (ripened between 20 and 60 days). The “maturo” variety, which has a richer historical background, represents 73.4% of the total PDO-certified production of Pecorino Sardo. Cheese contains various saccharides (lactose, galactose, glucose, tagatose, etc.) and polyols with structural similarities to glucose (myo-inositol) that are significant from nutritional, health, and technological perspectives [2,3,4]. During the initial cheese-making stage, lactose, the most abundant saccharide in milk, is fermented by starter lactic acid bacteria (LAB) into galactose and glucose. These monosaccharides are utilized by LAB to produce lactic acid and other metabolites. Lactic acid production is essential for curd acidification, facilitating syneresis and the proper progression of cheese ripening [5]. Lactose is not completely hydrolyzed during curd acidification, and its residual amount in fresh cheese depends on several factors, including the starter culture, which is crucial for lactose reduction.
Additional mechanical factors promoting syneresis also play a significant role [6]. As cheese ages, the residual lactose content typically decreases, making long-ripened cheeses naturally lactose-free [7]. Therefore, determining the residual content of these saccharides is crucial for ensuring that the product is suitable for lactose and galactose-intolerant individuals. Lactose is an important nutritional component, providing energy and aiding calcium absorption. However, about 70% of the global population suffers from lactose malabsorption [8] with an increasing prevalence in the Eurozone [9]. Lactose intolerance (LI) results from a deficiency in the enzyme lactase–phlorizin hydrolase (LPH), which is a β-galactosidase necessary for lactose digestion. Without sufficient LPH, lactose reaches the large intestine, where it is fermented by intestinal microorganisms, causing symptoms such as diarrhea, abdominal cramps, bloating, and flatulence as well as nausea, headaches, exhaustion, and skin rashes [10]. On the other hand, also the galactose from lactose hydrolysis can cause a severe disorder (galactosemia), resulting from deficiencies in enzymes of the Leloir pathway: galactose kinase, galactose-1-phosphate uridyltransferase, and galactose-4-epimerase uridinediphosphate. This deficiency leads to elevated plasma galactose levels, causing acute toxicity effects like weight loss, growth faltering, and severe liver impairment [11].
One solution for these issues is eliminating all sources of lactose and galactose, including milk and cheese, from the diet of affected individuals. This underscores the importance of assessing the content of these saccharides in products that are naturally lactose-free and galactose-free due to their production processes, thus allowing their inclusion in the diets of those with these conditions [12]. As a result, the market for lactose-free products has grown significantly in recent years, driven by consumer demand [13].
To meet the needs of people with LI, EU Regulation 1169/2011 [14] requires information on the presence of milk, milk derivatives, and lactose, which are included in the list of 14 allergens that must be declared in foods. However, claims regarding lactose content are not yet harmonized in the EU. Only EU Delegated Regulation 2016/127 [15] allows the claim “lactose-free” for infant formulae and follow-on formulae with a lactose content ≤ 10 mg on 100 kcal. No further EU legislation has been issued since then, although the European Food Safety Authority (EFSA) suggests that people with LI should avoid foods containing milk or lactose, aiming for a daily lactose intake of ≤25 mg on 100 kcal [16]. For individuals with galactosemia, the guidelines are much stricter, allowing the consumption of foods with galactose content ≤ 5 mg on 100 g and restricting those containing from 5 to 20 mg on 100 g [17]. On the other hand, international clinical guidelines also allow people with severe galactosemia to consume aged cheeses with a content of galactose less than 25 mg on 100 g [18], while the EFSA also suggests limiting the daily intake of lactose (as a galactose precursor) to less than 10 mg on 100 kcal for infants and less than 25 mg on 100 kcal for older infants, children, and adult patients [16]. The Italian Ministry of Health has issued guidelines [19,20] about the labeling of lactose in dairy products. The most recent directive stipulates that products with naturally reduced lactose due to inherent characteristics of their production processes may utilize the designation “naturally lactose-free” if their residual lactose content is lower than 100 mg on 100 g. This threshold is also established in Germany, Hungary, Slovenia, and Switzerland, whereas other countries, like Spain, Denmark, Estonia, Finland, Norway, and Sweden, have established tenfold lower limits [8].
Instead, tagatose and myo-inositol have both interesting nutritional properties. D-tagatose, generally recognized as safe (GRAS) in the United States, Australia, New Zealand, South Korea, Brazil, South Africa, and the European Union [21], provides health benefits like attenuating glycemic response [22] and preventing tooth decay. In addition, it has been demonstrated to promote the growth of probiotics with a preference for bifidobacteria and lactobacillus over enterobacteriaceae. Tagatose is naturally found in human milk, sterilized and powdered cow’s milk [23], and fermented dairy products like yogurt [24]. D-tagatose derives from galactose isomerization through a process facilitated by a phosphoenolpyruvate (PEP) lactose phosphotransferase system (PTS), which is commonly associated with a phospho-β-galactosidase system [25]. Myo-inositol, a typical component of living cells [26], is naturally present in milk [27] or in fermented dairy products [28]. It plays a pivotal role in neonatal nutrition [29,30].
The determination of saccharides in dairy products is typically conducted using chromatographic techniques, including gas chromatography (GC), high-performance liquid chromatography (HPLC), and their relevant hyphenation with mass spectrometers (MS) [31]. Each of these approaches has its own set of advantages and disadvantages. In summary, GC methods are typically more sensitive than HPLC methods. In the latter case, refractive index (RI) detectors are less sensitive than flame ionization (FID) detectors, whereas ultraviolet or fluorescence detectors are not suitable for the analysis of carbohydrates. The only high-sensitivity HPLC approach is the HPAEC-PAD (High-Performance Anion Exchange Chromatography-Pulsed Amperometric Detector) one, which is nevertheless less common in laboratories than a GC-FID instrument. In contrast to HPAEC-PAD methods, all GC-based methods invariably necessitate sample derivatization, which frequently represents a complex and time-consuming phase of the analytical procedure.
Recently, several GC-FID methods for determining the saccharide profile of milk and dairy products from Sardinia have been developed and validated [32,33,34]. One such method has been employed to analyze lactose and galactose in Pecorino Romano, which is a valuable PDO sheep’s cheese produced in Sardinia [34]. In that case, the quantity of both analytes was found to be below the most rigorous limits set by international organizations, ensuring the suitability of this cheese for consumption by patients suffering from either LI or galactosemia. Conversely, significant discrepancies in product specifications and cheese-making procedures raise concerns about the safety of PDO Pecorino Sardo for both consumer groups. It seems reasonable to posit that the “maturo” PDO Pecorino Sardo, rather than the “dolce” variety, would be more readily able to meet the requirements of a minimization of both the amounts of lactose and galactose. Accordingly, the objective of this study is to evaluate the amounts of lactose and galactose in the “maturo” PDO Pecorino Sardo sheep’s cheese with the aim of ascertaining its suitability for consumption by individuals with LI or galactosemia. To achieve this objective, a previously developed GC-FID method was adapted and validated for use on this matrix, and it was subsequently applied to a statistically significant number of samples of “maturo” PDO Pecorino Sardo from various zones of Sardinia Island. Furthermore, the GC-FID method was validated and applied to detect and quantify other minor sugars and polyols of potential interest in this matrix, like glucose, tagatose, and myo-inositol.
2. Materials and Methods
2.1. Samples
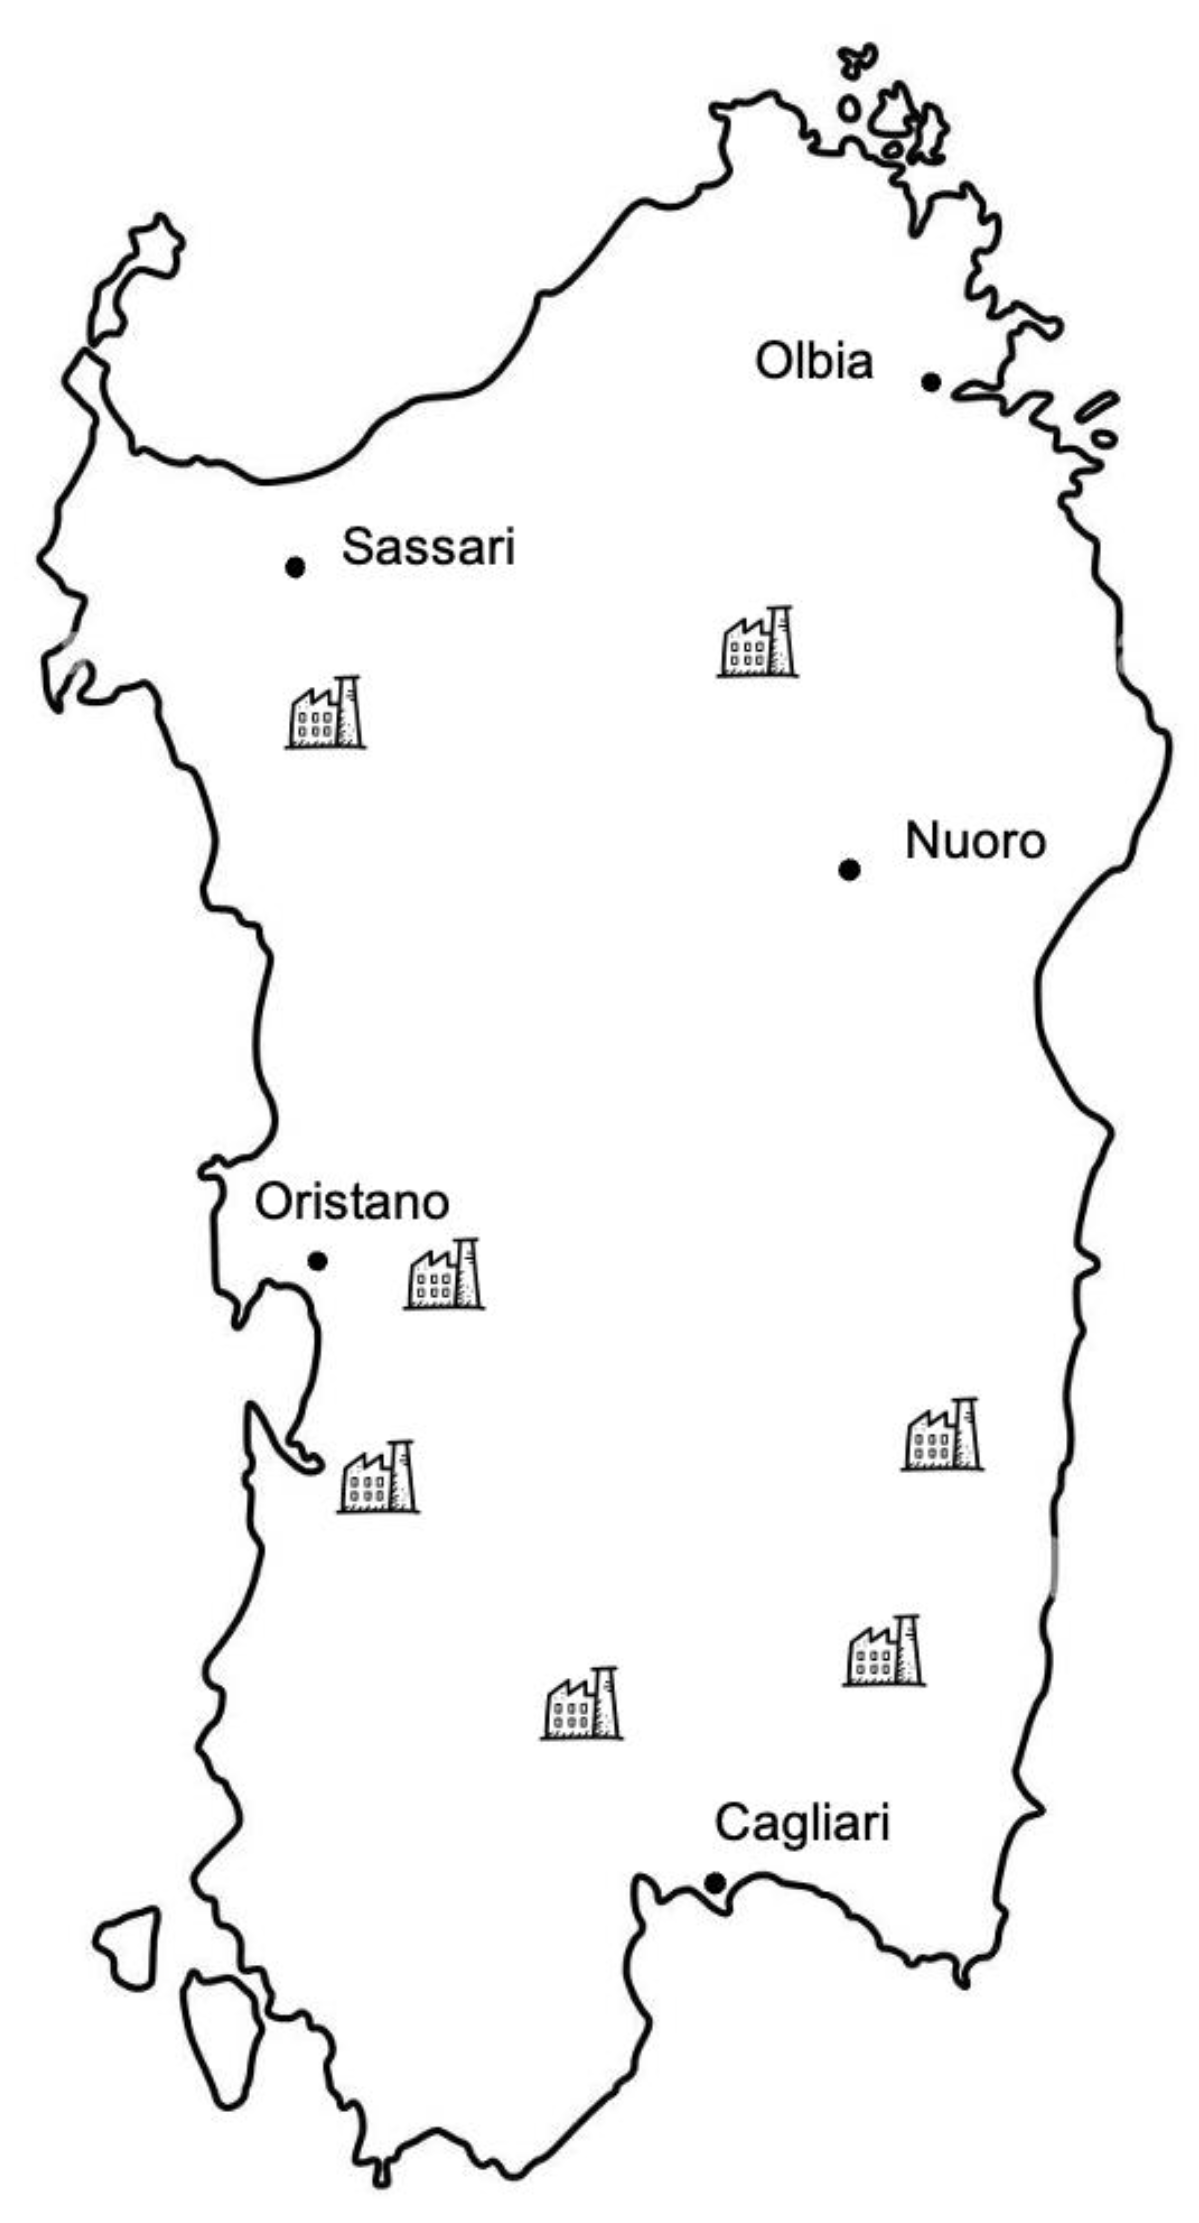
Forty-two wheels of “maturo” PDO Pecorino Sardo cheese from seven dairies belonging to the “Consorzio per la Tutela del Formaggio Pecorino Sardo DOP”, homogeneously distributed on the island of Sardinia (Figure 1), were sampled after two and four months of ripening.

Figure 1.
Geographical distribution of the 7 dairy farms producing “maturo” PDO Pecorino Sardo cheese.
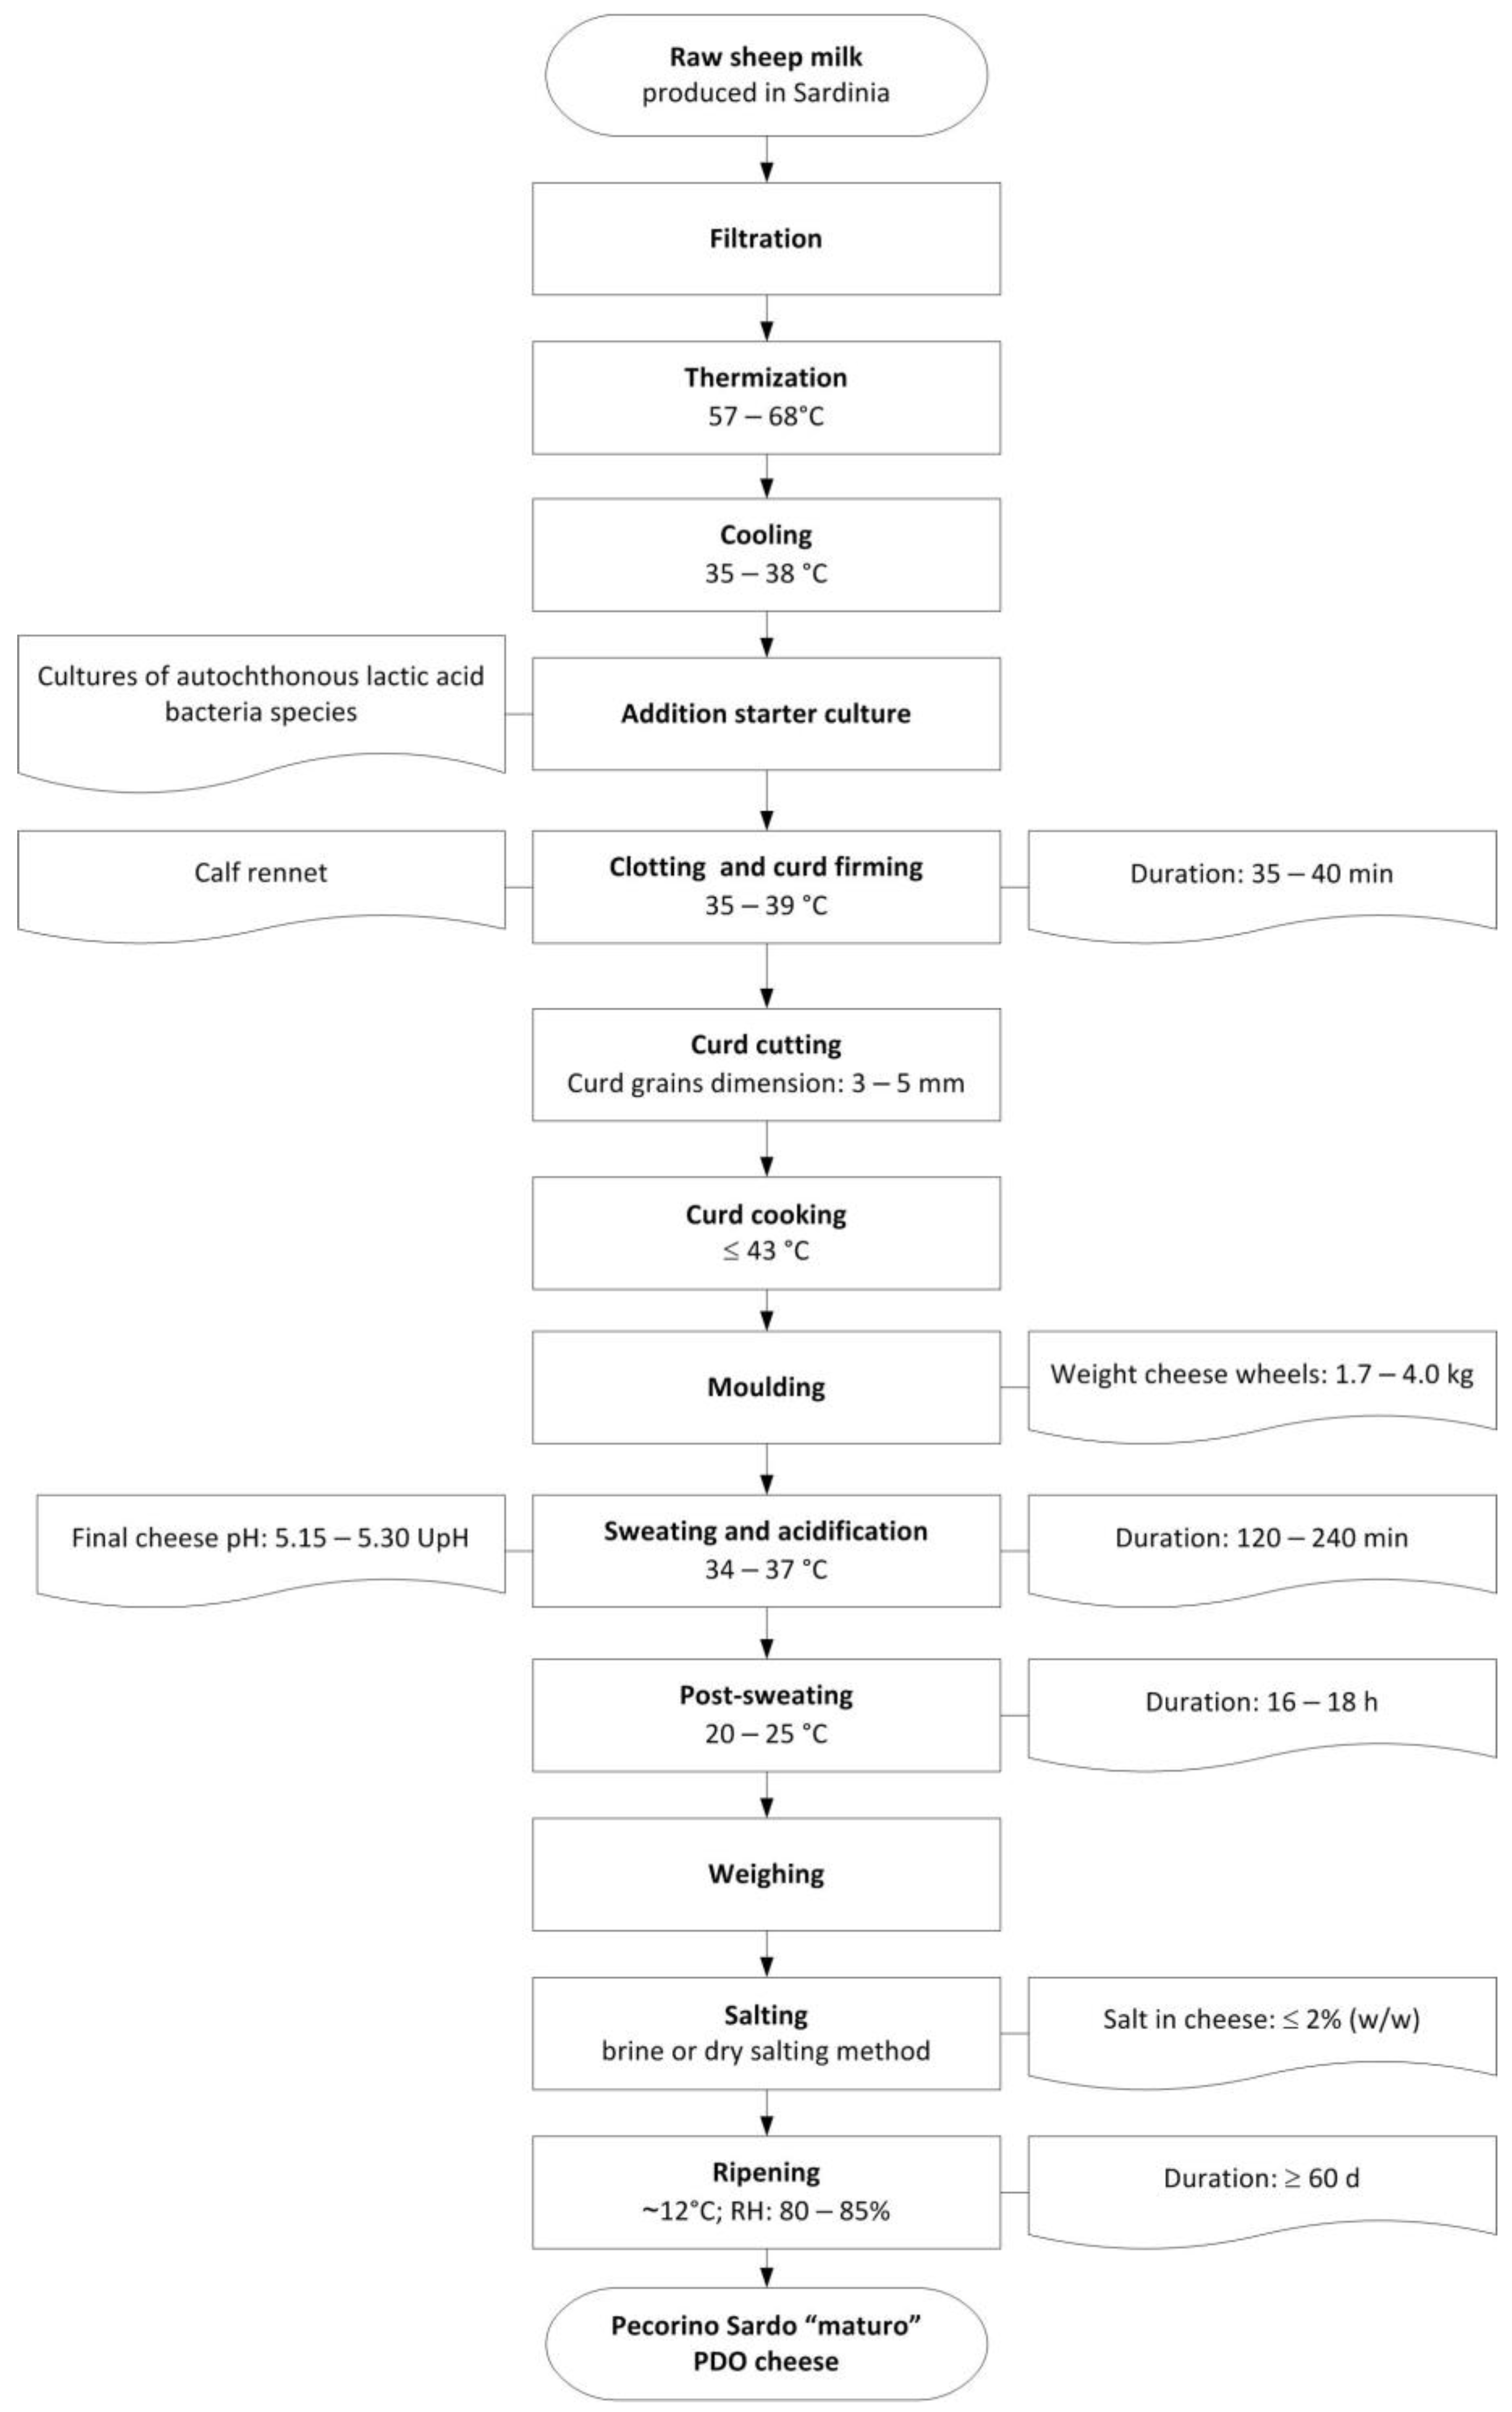
The samples were also representative of the entire production season, which spanned from January to June. This period aligns with the seasonal availability of sheep’s milk. In addition to their geographical representativeness, the selected dairies are also representative of 77.5% of the total production of “maturo” PDO Pecorino Sardo cheese. All samples were produced in strict compliance with the product specification [35]. The production process of the “maturo” cheese is summarized in Figure 2, and details the macro-composition of Pecorino Sardo PDO cheeses have been reported on Table S1 on the Supplementary Materials.
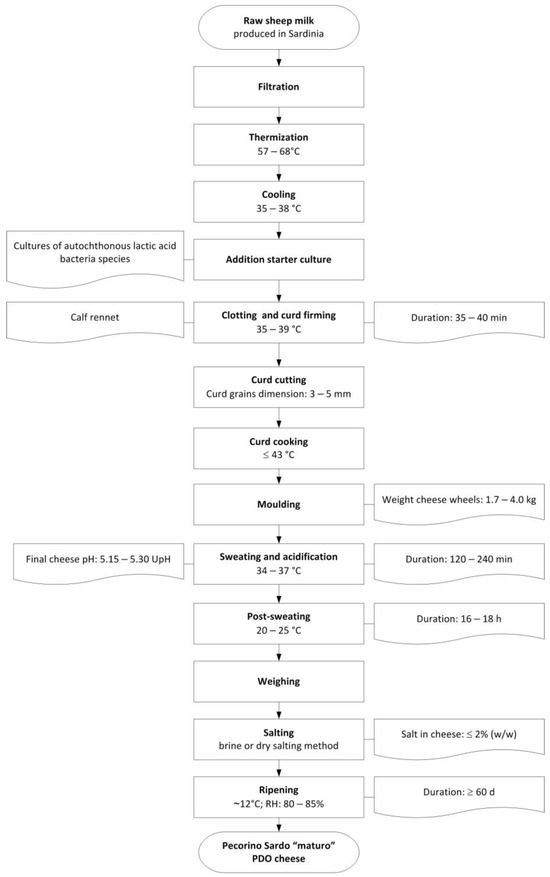
Figure 2.
Typical cheese-making process of “maturo” PDO Pecorino Sardo cheese.
Whole sheep’s milk from Sardinia is thermized and inoculated with autochthonous LAB starter cultures, which are also taxonomically related to the Streptococcus thermophilus species. Complete coagulation is achieved in about 40 min using calf rennet. The curd is then cut into 3–5 mm grains and semi-cooked at 41–43 °C. After shaping and sweating to allow acidification and draining of the whey, the cheese is salted, either in brine or dry salt, and then matured in controlled thermo-hygrometric conditions for at least two months. Sampling was carried out according to Larrajoz et al. [36]: two pieces from opposite ends of each cheese wheel are pooled and grated after discarding 1.5 cm of rind. Immediately after sampling, the grated samples are stored at −18 °C until analysis.
2.2. Chemicals and Reagents
Reagents (methanol, pyridine, heptane, trimethylsilylimidazole (TMSI) and trimethylchlorosilane (TMCS), all analytical grade) and chromatographic standards: D-lactose, purity 99.3% (mixture of α and β anomers); D-galactose, purity 99.5% (mixture of α, β and γ anomers); D-glucose, purity 99.5% (mixture of α and β anomers); D-tagatose, purity > 99% (mixture of α and β anomers); myo-inositol, purity ≥ 99.5%; and Internal Standard methyl-α-D-galactopyranoside, purity ≥ 99% were purchased from Merck (Milan, Italy). Ultrapure (Type 1) water (specific resistance 18 MΩ) was used throughout the analyses.
2.3. Sample Preparation and Instrumentation
Sample preparation was performed according to a method previously developed by this research group [34]. Briefly, the cheese sample was deproteinized by repeated extractions with a 40:60 (v/v) methanol/water solution. An aliquot of the extract was evaporated to dryness, then dissolved in pyridine, and later treated with a 2:1 (v/v) TMSI/TMCS silylation mixture. After silylation, the excess of silylating reagents was hydrolyzed with water, and the sample was dissolved in n.heptane for chromatographic analysis.
Gas chromatographic analysis was performed on a Varian 3900 gas chromatograph equipped with a split/splitless injector (Varian, Harbor City, CA, USA) and a Flame Ionization Detector (Varian, Harbor City, CA, USA). Chromatographic separation was performed on a Supelco Low Bleed SLB™—5 ms (Sigma Aldrich, Milan, Italy) capillary column (30 m × 0.32 mm × 0.25 μm). Helium was used as a carrier gas at 1 mL min−1 flow; injector split ratio: 1:10. Oven temperature was held at 50 °C for 2 min; then, it increased to 130 °C (heating rate: 10 °C min−1) and then to 300 °C (heating rate: 5 °C min−1); the temperature was held at 300 °C for 5 min, and then it was finally raised to 360 °C (heating rate: 30 °C min−1) and held for 5 min. Injector and detector temperatures were 300 °C. Data acquisition and integration were performed using the Star Chromatography Workstation 6.0 software (Varian, Harbor City, CA, USA). The entire chromatographic run lasts less than 40 min. Peak assignment in authentic cheese samples was performed both on a retention time basis and by spiking with each pure analyte. Quantification has been accomplished by using methyl-α-D-galactopyranoside as an internal standard, and figures from S1 to S10 report the calibration plots for all analytes taken into account in this study. Each sample was analyzed twice.
2.4. Statistic Analysis
The statistical package Minitab 16 (Minitab Inc., State College, PA, USA) was used to analyze the acquired data. The general linear model (GLM) procedure and Tukey test for multiple comparison of means were used to evaluate the effect of seven Sardinian dairies, production month and ripening time (p < 0.05).
3. Results and Discussion
3.1. Chromatographic Separation of the Analytes
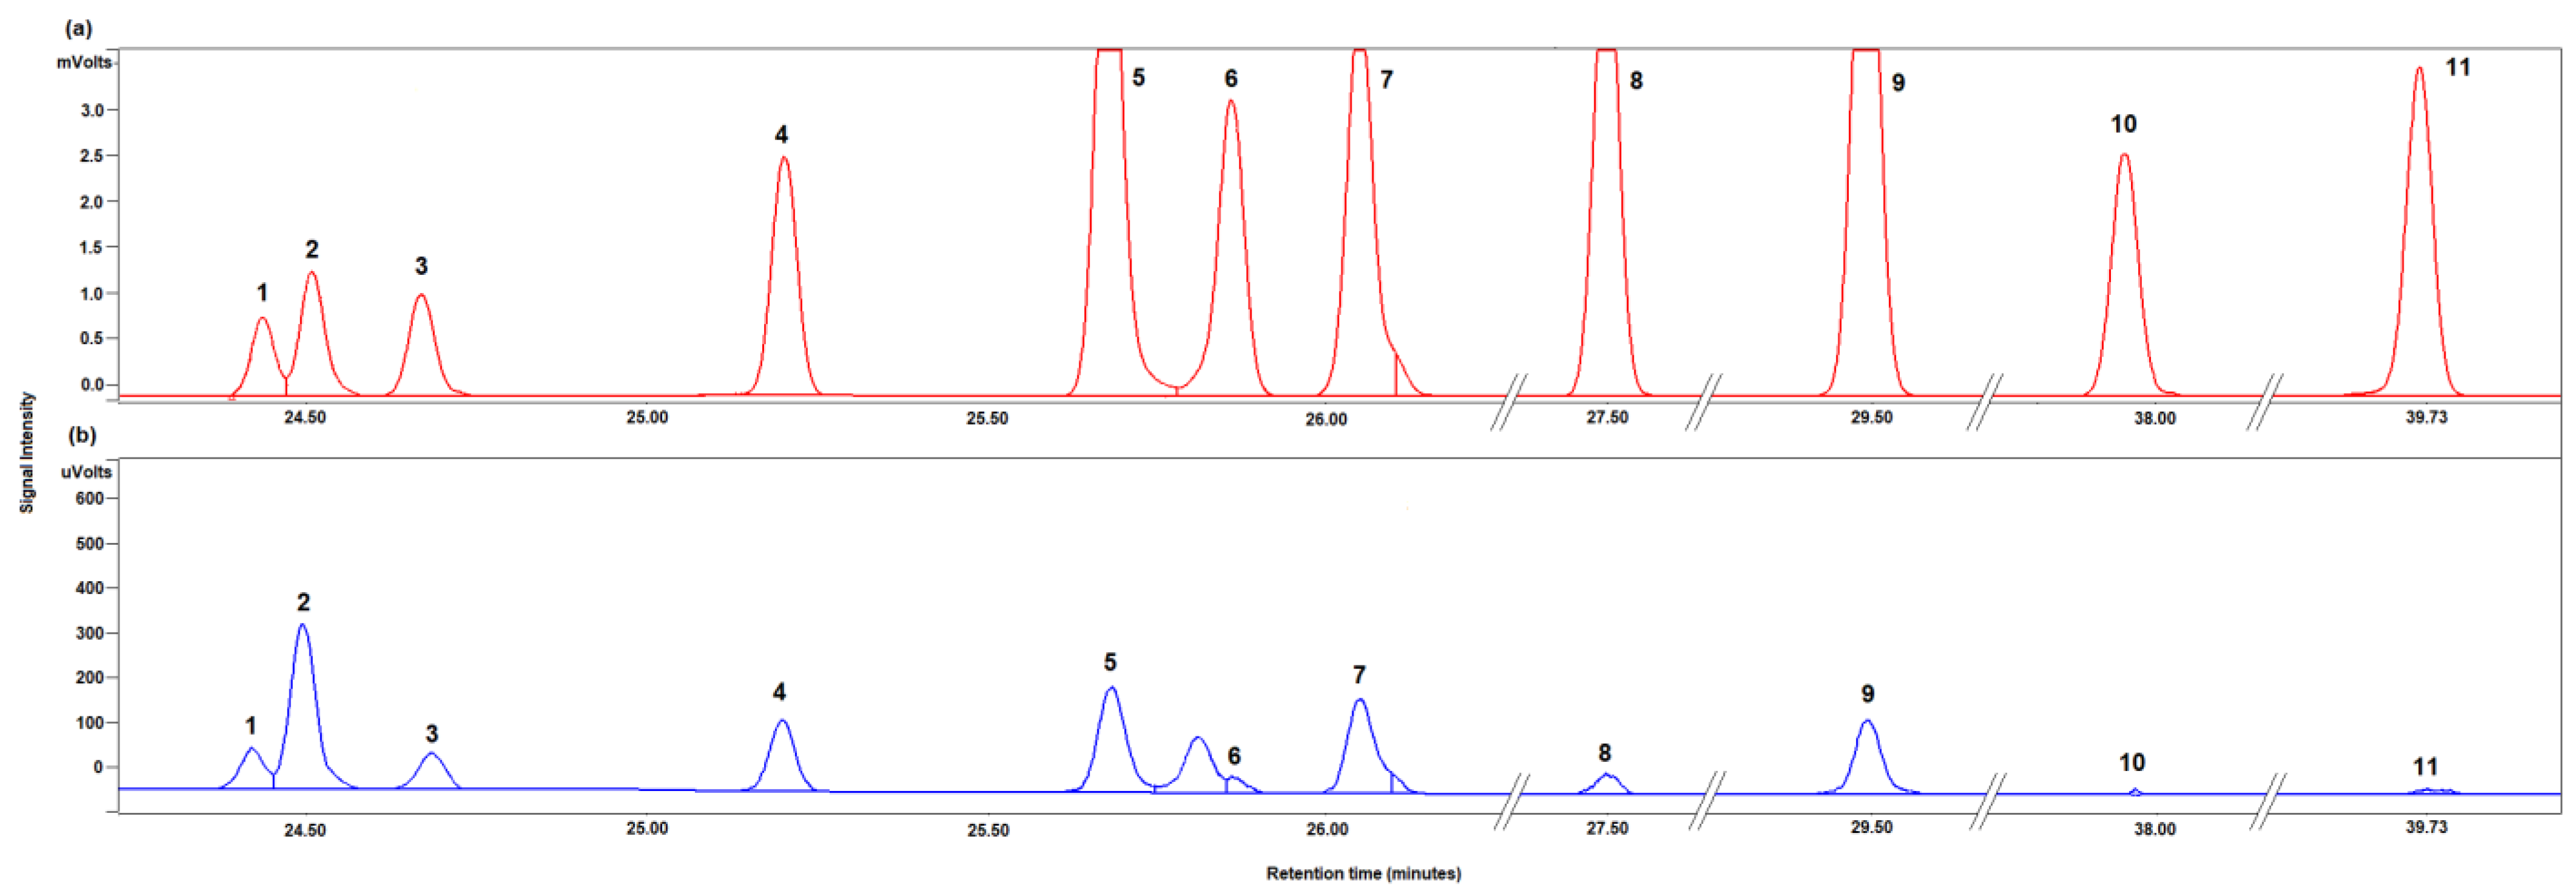
Figure 3 shows the typical chromatograms obtained for the separation of a standard solution of all analytes (Figure 3a) and of a real sample (Figure 3b). Almost all peaks are satisfactorily resolved at the baseline level.
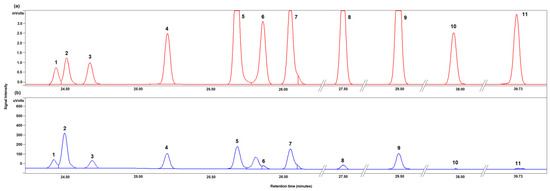
Figure 3.
Chromatogram portion of the trimethyl silyl ethers of a standard mixture of all analytes (a) and of the trimethyl silyl ethers of the mono- and disaccharides identified in 2 month-aged “maturo” PDO Pecorino Sardo cheese sample (b). Peak attribution: 1, γ-D-galactose; 2, methyl-α-D-galactopyranoside (internal standard, IS); 3, α-D-tagatose; 4, α-D-galactose; 5, β-D-tagatose; 6, α- D-glucose; 7, β-D-galactose; 8, β-D-glucose; 9, myo-inositol; 10, α-D-lactose; 11, β-D-lactose.
3.2. Validation
Validation of the method has been accomplished in terms of limit of detection (LoD), limit of quantification (LoQ), intermediate precision and trueness. Table 1 reports the relevant figures of merit.

Table 1.
Validation parameters of the GC-FID method aimed to quantify the analytes in “maturo” PDO Pecorino Sardo cheese.
The LoD and LoQ of all analytes have been achieved using the method 3.2.3.3 (based on the standard deviation of a linear response and a slope) proposed by the International Conference on Harmonization [37]. In essence, the LOD is equal to 3.3σ/S, where σ represents the standard deviation of the response and S is the slope of the calibration curve obtained through the analysis of samples with a concentration of the analyte close to the expected LOQ. Furthermore, the LOQ is equal to 10σ/S. Quantification limits always less than 10 mg kg−1 accounted for the good sensitivity of the method. The intermediate precision, measured in terms of CV% on fifteen measurements, has been obtained by analyzing the same cheese sample in physical triplicate over five different analytical sessions held over several weeks. Precision data, ranging between 10% (for glucose) and 15% (for galactose), are found to be acceptable according to Horwitz’s theory [38], providing always HorRat values below 1.5. Due to the lack of certified reference samples, trueness has been evaluated through recovery tests. Three aliquots of a real sample of Pecorino Sardo PDO have been spiked with known and increasing amounts of each analyte, whereas one further aliquot of that cheese has been kept unspiked. The GC-FID analyses performed of these samples accounted for quantitative recoveries for each analyte (criteria: two-tail t-test, p > 0.95). Furthermore, Table S2 report some linearity features for all analytes considered in this study. The validation figures proposed here are in good agreement with those previously reported by Monti et al. [39] for the HPAEC-PAD determination of lactose, galactose, and glucose in Grana Padano PDO cheese. Moreover, the trueness parameter reported here is in fair agreement with those reported by Shakerdi et al. [40] for the HPAEC-PAD determination of lactose and galactose in Cheddar and lactose-free cheeses.
3.3. Saccharides and Myo-Inositol in “Maturo” PDO Pecorino Sardo Cheese
Data relative to the amounts of the five analytes considered in “maturo” PDO Pecorino Sardo cheese samples at two months of ripening are summarized in Table 2, whereas the box plot reporting the content of all analytes in the sampling of Pecorino Sardo PDO cheese are reported in Figures S11–S15.
Table 2.
Mean amounts (in mg kg−1) of lactose, galactose, glucose, tagatose, and myo-inositol in “maturo” PDO Pecorino Sardo after two months of ripening produced in seven Sardinian dairies along the whole lactation year (January–June).
The average concentration of lactose in “maturo” PDO Pecorino Sardo cheese produced throughout the lactation period (from January to June) is 26 mg kg−1 (range from 4 to 90 mg kg−1, n = 42). These amounts are below the limit of 1 g kg−1 posed by the Italian Ministry of Health for the “naturally” lactose-free products [20] and the strictest EU regulations (i.e., below 100 mg kg−1) posed by Spain, Denmark, Estonia, Finland, Norway and Sweden. In addition, the average lactose content of “maturo” PDO Pecorino Sardo produced by five of the seven dairies considered in this study is below the limit of 10 mg kg−1, thus obtaining the Lfree® trademark [41], which identifies products whose lactose content can only be quantified using the most sensitive analytical methods. In any case, no statistically significant difference was observed between the average amounts of lactose in the two-month “maturo” PDO Pecorino Sardo cheeses produced by all the dairies considered in this study. The observed reduction in lactose content during cheese production and ripening can be attributed to several factors, primarily the metabolic activity of the bacteria in the starter culture, which utilize lactose as an energy source [6]. The presence of thermophilic bacteria such as Lactobacillus delbrueckii, Lactobacillus helveticus, and Streptococcus thermophilus in the starter culture (i.e., the so-called scotta-innesto, commonly used for this production) [42] plays a significant role in early lactose conversion [6]. Additionally, the product specification of Pecorino Sardo DOP does not exclude the possibility of using freeze-dried commercial starter cultures, consisting of native LAB species, which may include mesophilic ones like those belonging to the genus Lactococcus [43], characterizing, in the past, traditional productions of Pecorino Sardo and that contributes to lactose reduction even in later stages of ripening. The prevalence of mesophilic lactobacilli during the final stage of cheese ripening is contingent upon specific conditions, including low water activity and high salt concentration. Although mesophilic LAB such as enterococci or Lb. casei (that constitute the secondary microflora) were not identified in the scotta-innesto utilized in this cheese-making process, it is plausible that these bacteria entered the cheese from the surrounding environment and/or from the milk, as postulated by Mannu et al. [42], and that they contribute to the reduction in residual lactose, in the post-production stages and during ripening.
Secondary factors, including the removal of whey and changes in synergistic parameters (such as temperature, pH, and moisture) throughout the processing stage, also exert a pivotal influence on lactose reduction [6]. The combination of primary, secondary, and synergistic factors allows for the natural production of lactose-free hard and semi-hard cheeses, such as the PDO Pecorino Sardo. Therefore, in a manner analogous to that observed with other Italian PDO cheeses, the “maturo” Pecorino Sardo represents a dairy product that is entirely compatible with the nutritional requirements of individuals with lactose intolerance [6,34,44].
Unlike lactose, the amount of galactose significantly varies between dairies during the lactation period (p < 0.01). In this case, the galactose concentration ranged from 10 to 200 mg kg−1 with an average concentration of 76 mg kg−1 (n = 42). In any case, the amount of galactose measured in the “maturo” PDO Pecorino Sardo cheese of four out of seven dairies is consistently below the threshold of 50 mg kg−1 established by the most restrictive international recommendations [16,17]. Consequently, this cheese can be safely consumed even by patients with severe galactosemia. Such patients can also consume, with some caution, cheeses produced by the other three dairies, as they do not exceed the limit of 250 mg kg−1 set by the Galactosemia Network (GalNet) [18]. While the ability of LAB to utilize lactose is well documented, their capacity to metabolize galactose is more challenging to predict [45,46]. Indeed, numerous LAB species, including the majority of Streptococcus thermophilus and Lactobacillus delbrueckii ssp. bulgaricus strains, are galactose negative. Consequently, they are only capable of metabolizing the glucose moiety of lactose, resulting in the release of galactose into the extracellular medium [47]. This deficiency is associated with the absence of specific enzymes or galactose transport systems involved in its two metabolic pathways: the tagatose-6P pathway and the Leloir pathway [45]. The presence of excess galactose has been demonstrated to have adverse effects on the health of individuals with galactosemia. Additionally, it can lead to defects in cheese during storage, including browning due to the Maillard reaction and texture alterations resulting from CO2 production by some LAB species [46,48]. The low galactose content observed in “maturo” PDO Pecorino Sardo cheese may be attributed to the presence of LAB belonging to the genus Lactococcus, Lactobacillus helveticus, and Lactobacillus delbrueckii subspecies other than bulgaricus, which are capable of fermenting galactose [42,43]. However, it should be noted that this remains a hypothesis, as there are currently no studies that can provide a deep microbiological characterization of this cheese. Despite the relatively short ripening period (two months), the galactose concentration in “maturo” PDO Pecorino Sardo cheese is comparable to that observed in cheeses with a longer ripening period (over six months) [49]. Hence, the potential for the dietary inclusion of the “maturo” PDO Pecorino Sardo cheese is considerable, as it offers a means of providing galactosemia patients a source of essential nutrients, such as calcium, which is of paramount importance for maintaining optimal skeletal health [49].
Finally, glucose, tagatose, and myo-inositol are normally present in “maturo” PDO Pecorino Sardo cheese in concentrations ranging from a few units to tens of mg kg−1. These concentrations are not statistically different among the dairies.
Glucose, resulting from the hydrolysis of lactose, is metabolized in the initial stages of the fermentation process by LAB into phosphoenolpyruvate via glucokinase while generating adenosine triphosphate (ATP) and nicotinamide adenine dinucleotide (NADH) primarily through glycolysis [50]. During this phase, the pentose phosphate pathway may also be active [51]. Subsequently, the enzyme lactate dehydrogenase reduces pyruvate to lactic acid, which is responsible for the reduction in pH of the cheese, facilitating coagulation and inhibiting the growth of undesirable microorganisms [52]. Among the limited number of studies that have quantified the residual glucose content in ripened cheeses, it is noteworthy that the low concentration of glucose observed in the “maturo” PDO Pecorino Sardo cheese, despite its short ripening time, is not significantly different from that observed in long ripened (9–23 months) hard cow cheeses such as Grana Padano [39].
Tagatose is a low-calorie sweetener (1.5 kcal g−1) with a sweetness level of 92% that of sucrose [53], which is only partially absorbed in the small intestine. Tagatose is an uncommon saccharide in cheese that is typically present in trace amounts. It may be formed by a number of metabolic pathways, the most representative of which is the “tagatose pathway.” This pathway begins with galactokinase, which converts galactose into galactose-1-phosphate. This intermediate can then be isomerized to tagatose-1-phosphate by means of galactose-6-phosphate isomerase [54]. Ultimately, tagatose-1-phosphate may undergo partial dephosphorylation, resulting in the generation of free tagatose.
The quantity of myo-inositol commonly present in “maturo” Pecorino Sardo cheese was comparable to that observed in cow’s milk (ranging from 20 to 40 mg dm−3). This finding is consistent with those of Idda et al. [32] and Troyano et al. [55]. The presence of myo-inositol in milk and dairy products may have multiple origins. An endogenous pathway through the mammary gland allows for the presence of free inositols in the environment as naturally occurring bioactive components of living cells. Myo-inositol is recognized as a lipotropic nutrient due to its role as the precursor of phosphatidylinositol [4,26]. Another pathway involves the metabolism of certain LAB, such as Lactobacillus plantarum, which can produce inositol through biosynthetic genes encoding a series of enzymes required for inositol biosynthesis [56].
3.4. Influence of the Seasonality
Table 3 provides evidence of the behavior of the five analytes measured in two-month ripened cheese samples produced from the seven dairies in January, April, and June, respectively.
Table 3.
Mean concentrations (in mg kg−1) among seven dairies of lactose, galactose, glucose, tagatose and myo-inositol measured in “maturo” PDO Pecorino Sardo produced in January, April, and June after two months of ripening.
Data reported in Table 3 accounted for no statistical differences in the concentration of lactose, glucose, tagatose, and myo-inositol measured in “maturo” PDO Pecorino Sardo cheese produced during the whole lactation year. In particular, the lactose concentration remains always below the thresholds for “naturally” lactose-free products. Conversely, the galactose concentration presents a statistically significant peak of concentration (p < 0.01) in cheeses produced in January, although all samples remain well below the limit of 250 mg kg−1 fixed by GalNet guidelines. The data obtained support the reaching of a good level of standardization for the production process of this cheese.
3.5. Influence of the Ripening Time
The results obtained for the PDO Pecorino Sardo cheese, ripened for two months, demonstrated a satisfactory level of safety concerning both lactose-intolerant and galactosemic patients. However, to further ensure optimal quality and food safety, the concentration of the five analytes was monitored for an additional two months of ripening. Table 4 presents a comparison of the concentrations of lactose, galactose, glucose, tagatose, and myo-inositol in PDO Pecorino Sardo cheese samples that were ripened for two and four months, respectively.
Table 4.
Mean concentrations (in mg kg−1) among seven dairies of lactose, galactose, glucose, tagatose and myo-inositol measured in “maturo” PDO Pecorino Sardo produced along the whole lactation after two and four months of ripening.
No statistically significant change in the concentration of any analyte was observed as a function of the additional maturation period undergone by the PDO Pecorino Sardo cheese.
4. Conclusions
A validated GC-FID method was employed to determine the concentrations of lactose and galactose in a statistically representative sampling of “maturo” PDO Pecorino Sardo cheese. The cheese samples were obtained from various dairy farms along Sardinia and collected at different stages of the milk production process as well as at varying lengths of ripening time. The cheese was found to contain low levels of lactose that were consistently below the strictest limits set by some countries of the European Union. This resulted in its classification as naturally “lactose-free” after a mere two months of ripening, which is a designation that allows for its free consumption by individuals with lactose intolerance. Furthermore, the low levels of galactose identified in this study indicate that this cheese can be consumed moderately by individuals with a severe form of galactosemia. In addition, glucose, tagatose, and myo-inositol were quantified in all samples. These analytes were found to be present at low concentrations, typically in the range of a few tens of mg kg−1. The satisfactory homogeneity of the analytical data obtained supports a good level of standardization of the cheese-making process used by all dairies according to the product specification. These findings permit the expansion of the consumer base for “maturo” PDO Pecorino Sardo cheese and establish a foundation for analogous studies on “dolce” PDO Pecorino Sardo cheese which, having a shorter ripening time than the “maturo” type one (less than two months), could have a higher residual content of carbohydrates. Nevertheless, a more profound comprehension of the cheese’s microflora and the mechanisms governing both lactose and galactose metabolic pathways during ripening is essential to fully elucidate these results. As a future perspective, this analytical method could be used to determine the residual content of carbohydrates in Fiore Sardo PDO cheese, which is an artisanal product from raw sheep milk obtained following a different technological process than Pecorino Sardo and Pecorino Romano cheeses.
Supplementary Materials
The following supporting information can be downloaded at: https://www.mdpi.com/article/10.3390/separations11090265/s1, Table S1—Macro-composition of Pecorino Sardo PDO cheeses (mean ± sd); Table S2—Operative linearity interval and the coefficient of determination for the analytes quantified in Pecorino Sardo PDO cheese samples; Figure S1—Internal standard calibration plot for α-Lactose; Figure S2—Internal standard calibration plot for β-Lactose; Figure S3—Internal standard calibration plot for α-Galactose; Figure S4—Internal standard calibration plot for β-Galactose; Figure S5—Internal standard calibration plot for γ-Galactose; Figure S6—Internal standard calibration plot for α-Glucose; Figure S7—Internal standard calibration plot for β-Glucose; Figure S8—Internal standard calibration plot for α-Tagatose; Figure S9—Internal standard calibration plot for β-Tagatose; Figure S10—Internal standard calibration plot for Myo-inositol; Figure S11—Box plot of Lactose content in Pecorino Sardo PDO cheese samples after two months of ripening produced in seven Sardinian dairies; Figure S12—Box plot of Galactose content in Pecorino Sardo PDO cheese samples after two months of ripening produced in seven Sardinian dairies; Figure S13—Box plot of Glucose content in Pecorino Sardo PDO cheese samples after two months of ripening produced in seven Sardinian dairies; Figure S14—Box plot of Tagatose content in Pecorino Sardo PDO cheese samples after two months of ripening produced in seven Sardinian dairies; Figure S15—Box plot of myo-inositol content in Pecorino Sardo PDO cheese samples after two months of ripening produced in seven Sardinian dairies; References [57,58,59,60] are cited in the Supplementary Materials.
Author Contributions
Conceptualization, M.A. and G.S.; methodology, M.A. and G.S.; software, A.S.D. and M.C.; validation, A.S.D., M.C., M.F. and G.S.; formal analysis, A.S.D., M.C. and M.F.; investigation, A.S.D., M.P. and G.L.; resources, M.A.; data curation, A.S.D., M.C., M.A., A.M. and G.S.; writing—original draft preparation, A.S.D., M.A., G.L., M.C., M.P. and G.S.; writing—review and editing, A.S.D., M.C., M.A., G.L., M.F., M.P., A.M. and G.S.; visualization, A.S.D. and M.C.; supervision, M.A. and G.S.; project administration, M.A.; funding acquisition, M.A. All authors have read and agreed to the published version of the manuscript.
Funding
This research received no external funding.
Data Availability Statement
Data are contained within the article.
Acknowledgments
The authors would like to thank the Consorzio per la Tutela del Formaggio Pecorino Sardo DOP for their availability and collaboration in involving dairy farms, obtaining cheese samples and sharing information on PDO production.
Conflicts of Interest
The authors declare no conflicts of interest.
References
- Consorzio per la Tutela del Formaggio Pecorino Sardo, Dairy Season 2022. Available online: https://www.pecorinosardo.it/en (accessed on 18 July 2024).
- Panseri, S.; Pavlovic, R.; Castrica, M.; Nobile, M.; Di Cesare, F.; Chiesa, L.M. Determination of Carbohydrates in Lactose-Free Dairy Products to Support Food Labelling. Foods 2021, 10, 1219. [Google Scholar] [CrossRef] [PubMed]
- Zhao, R.; Xu, K.; Yan, M.; Peng, J.; Liu, H.; Huang, S.; Zhang, S.; Xu, Z.; Guo, X.; Wang, T. Preparation of sweet milk and yogurt containing D-tagatose by the L-arabinose isomerase derived from Lactobacillus rhamnosus. LWT—Food Sci. Technol. 2023, 187, 115355. [Google Scholar] [CrossRef]
- Caboni, P.; Murgia, A.; Porcu, A.; Manis, C.; Ibba, I.; Contu, M.; Scano, P. A metabolomics comparison between sheep’s and goat’s milk. Food Res. Int. 2019, 119, 869–875. [Google Scholar] [CrossRef] [PubMed]
- Madrau, M.A.; Mangia, N.P.; Murgia, M.A.; Sanna, M.G.; Garau, G.; Leccis, L.; Caredda, M.; Deiana, P. Employment of autochthonous microflora in Pecorino Sardo cheese manufacturing and evolution of physicochemical parameters during ripening. Int. Dairy J. 2006, 16, 876–885. [Google Scholar] [CrossRef]
- Facioni, M.S.; Dominici, S.; Marescotti, F.; Covucci, R.; Taglieri, I.; Venturi, F.; Zinnai, A. Lactose Residual Content in PDO Cheeses: Novel Inclusions for Consumers with Lactose Intolerance. Foods 2021, 10, 2236. [Google Scholar] [CrossRef]
- Facioni, M.S.; Raspini, B.; Pivari, F.; Dogliotti, E.; Cena, H. Nutritional management of lactose intolerance: The importance of diet and food labelling. J. Transl. Med. 2020, 18, 260. [Google Scholar] [CrossRef]
- Dominici, S.; Marescotti, F.; Sanmartin, C.; Macaluso, M.; Taglieri, I.; Venturi, F.; Zinnai, A.; Facioni, M.S. Lactose: Characteristics, Food and Drug-Related Applications, and Its Possible Substitutions in Meeting the Needs of People with Lactose Intolerance. Foods 2022, 11, 1486. [Google Scholar] [CrossRef]
- Fassio, F.; Facioni, M.S.; Guagnini, F. Lactose Maldigestion, Malabsorption, and Intolerance: A Comprehensive Review with a Focus on Current Management and Future Perspectives. Nutrients 2018, 10, 1599. [Google Scholar] [CrossRef]
- Succoio, M.; Sacchettini, R.; Rossi, A.; Parenti, G.; Ruoppolo, M. Galactosemia: Biochemistry, Molecular Genetics, Newborn Screening, and Treatment. Biomolecules 2022, 12, 968. [Google Scholar] [CrossRef]
- Iwasawa, S.; Kikuchi, A.; Wada, Y.; Arai-Ichinoi, N.; Kamoto, O.; Tamiya, G.; Kure, S. The prevalence of GALM mutations that cause galactosemia: A database of functionally evaluated variants. Mol. Genet. Metab. 2019, 126, 362–367. [Google Scholar] [CrossRef]
- Gallo, A.; Pellegrino, S.; Lipari, A.; Pero, E.; Ibba, F.; Cacciatore, S.; Marzetti, E.; Landi, F.; Montalto, M. Lactose malabsorption and intolerance: What is the correct management in older adults? Clin. Nutr. 2023, 42, 2540–2545. [Google Scholar] [CrossRef] [PubMed]
- Dekker, P.J.T.; Koenders, D.; Bruins, M.J. Lactose-Free Dairy Products: Market Developments, Production, Nutrition and Health Benefits. Nutrients 2019, 11, 551. [Google Scholar] [CrossRef] [PubMed]
- European Union. Regulation (EU) n. 1169/2011 of the European Parliament and of the Council of 25 October 2011 on the Provision of Food Information to Consumers. Official Journal of the European Union, L 304/18 EN, 22.11.2011. Available online: https://eur-lex.europa.eu/LexUriServ/LexUriServ.do?uri=OJ:L:2011:304:0018:0063:en:PDF (accessed on 18 July 2024).
- European Union. Commission Delegated Regulation (EU) 2016/127 of 25 September 2015 supplementing Regulation (EU) No 609/2013 of the European Parliament and of the Council as Regards the Specific Compositional and Information Requirements for Infant Formula and Follow-on Formula and as Regards Requirements on Information Relating to Infant and Young Child Feeding. Official Journal of the European Union, L 25/12 EN, 2.2016. Available online: https://eur-lex.europa.eu/legal-content/EN/TXT/PDF/?uri=CELEX:32016R0127 (accessed on 18 July 2024).
- European Food Safety Authority (EFSA), EFSA Panel on Dietetic Products, Nutrition and Allergies (NDA), Parma, Italy. Scientific Opinion on lactose thresholds in lactose intolerance and galactosaemia. EFSA J. 2010, 8, 1777. [Google Scholar] [CrossRef]
- Gropper, S.S.; Weese, J.O.; West, P.A.; Gross, K.C. Free galactose content of fresh fruits and strained fruit and vegetable baby foods: More foods to consider for the galactose-restricted diet. J. Am. Diet. Assoc. 2000, 100, 573–575. [Google Scholar] [CrossRef] [PubMed]
- Welling, L.; Bernstein, L.E.; Berry, G.T.; Burlina, A.B.; Eyskens, F.; Gautschi, M.; Grünewald, S.; Gubbels, C.S.; Knerr, I.; Labrune, P.; et al. Galactosemia Network (GalNet). International clinical guideline for the management of classical galactosemia: Diagnosis, treatment, and follow-up. J. Inherit. Metab. Dis. 2017, 40, 171–176. [Google Scholar] [CrossRef]
- Italian Republic, Ministry of Health. Communication DGISAN Number 27673 of 07/07/2015. Updates Resulting from Regulatory Developments Related to the Entry into Force of EU Regulation 609/2013. Available online: https://www.aslvc.piemonte.it/images/downloads/strutture/SIAN/gluten_free/nota_MinSan_27673_del_07-07-2015_applicaz_Reg_609-2013.pdf (accessed on 18 July 2024). (In Italian).
- Italian Republic, Ministry of Health. Communication DGISAN Number 24708 of 16/06/2016. Guidelines for Analytical Tolerances for Official Control. Available online: https://www.agrar.it/upload/documenti/8-Circolare%20Ministero%20della%20Salute%20Giugno%202016%20-%20Estratti%20e%20titolazioni.pdf (accessed on 18 July 2024). (In Italian).
- Lina, B.A.R.; Kuper, C.F. Chronic Toxicity and Carcinogenicity Study with D-Tagatose and Fructose in Wistar Rats; TNO Nutrition and Food Research: Zeist, The Netherlands, 2002; Volume 4533. [Google Scholar]
- Armstrong, M.L.; Luecke, K.J.; Bell, L.N. Consumer evaluation of bakery product flavor as affected by incorporating the prebiotic tagatose. Int. J. Food Sci. Technol. 2009, 44, 815–819. [Google Scholar] [CrossRef]
- Levin, G.V.; Zehner, L.R.; Saunders, J.P.; Beadle, J.R. Sugar substitutes: Their energy values, bulk characteristics, and potential health benefits. Am. J. Clin. Nutr. 1995, 62, 1161S–1168S. [Google Scholar] [CrossRef]
- Hirst, E.L.; Hough, L.; Jones, J.K.N. The structure of Sterculla Setigera gum. Part 1: The investigation by the method of paper partition chromatography of the products of hydrolysis of the gum. J. Chem. Soc. 1949, 3145–3151. [Google Scholar] [CrossRef]
- Postma, P.W.; Lengeler, J.W.; Jacobson, G.R. Phosphoenolpyruvate: Carbohydrate phosphotransferase systems of bacteria. Microbiol. Rev. 1993, 57, 543–594. [Google Scholar] [CrossRef]
- Scano, P.; Carta, P.; Ibba, I.; Manis, C.; Caboni, P. An Untargeted Metabolomic Comparison of Milk Composition from Sheep Kept Under Different Grazing Systems. Dairy 2020, 1, 4. [Google Scholar] [CrossRef]
- Indyk, H.E.; Woollard, D.C. Determination of free myo-inositol in milk and infant formula by high-performance liquid chromatography. Analyst 1994, 119, 397–402. [Google Scholar] [CrossRef] [PubMed]
- Murgia, A.; Scano, P.; Cacciabue, R.; Dessì, D.; Caboni, P. GC-MS metabolomics comparison of yoghurts from sheep’s and goats’ milk. Int. Dairy J. 2019, 96, 44–49. [Google Scholar] [CrossRef]
- Croze, M.L.; Soulage, C.O. Potential role and therapeutic interests of myo-inositol in metabolic diseases. Biochimie 2013, 95, 1811–1827. [Google Scholar] [CrossRef] [PubMed]
- Woollard, D.C.; Macfadzean, C.; Indyk, H.E.; McMahon, A.; Christiansen, S. Determination of myo-inositol in infant formulae and milk powders using capillary gas chromatography with flame ionisation detection. Int. Dairy J. 2014, 37, 74–81. [Google Scholar] [CrossRef]
- Cui, S.W. (Ed.) Food Carbohydrates: Chemistry, Physical Properties, and Applications; CRC Press, Taylor & Francis Group: Boca Raton, FL, USA, 2005; ISBN 978-0-8493-1574-9. [Google Scholar]
- Idda, I.; Spano, N.; Ciulu, M.; Nurchi, V.M.; Panzanelli, A.; Pilo, M.I.; Sanna, G. Gas chromatography analysis of major free mono- and disaccharides in milk: Method assessment, validation, and application to real samples. J. Sep. Sci. 2016, 39, 4577–4584. [Google Scholar] [CrossRef]
- Pulinas, L.; Spanu, C.; Idda, I.; Ibba, I.; Nieddu, G.; Virdis, S.; Scarano, C.; Piras, F.; Spano, N.; Sanna, G.; et al. Production of Farmstead Lactose-Free Pecorino Di Osilo and Ricotta Cheeses from Sheep’s Milk. Ital. J. Food Saf. 2017, 6, 6353. [Google Scholar] [CrossRef]
- Idda, I.; Spano, N.; Addis, M.; Galistu, G.; Ibba, I.; Nurchi, V.M.; Pilo, M.I.; Scintu, M.F.; Piredda, G.; Sanna, G. Optimization of a newly established gas-chromatographic method for determining lactose and galactose traces: Application to Pecorino Romano cheese. J. Food Compos. Anal. 2018, 74, 89–94. [Google Scholar] [CrossRef]
- Production Specification of the Protected Designation of Origin “Pecorino Sardo”. Official Bulletin of Italian Republic, General Series, n.88 of 15.04.2014. Available online: https://ifcq.it/wp-content/uploads/pecorino-sardo/Disciplinare-Pecorino-Sardo-Dop.pdf (accessed on 18 July 2024). (In Italian).
- Larráyoz, P.; Addis, M.; Gauch, R.; Bosset, J.O. Comparison of Dynamic Headspace and Simultaneous Distillation Extraction Techniques Used for the Analysis of the Volatile Components in Three European PDO Ewes’ Milk Cheeses. Int. Dairy J. 2001, 11, 911–926. [Google Scholar] [CrossRef]
- International Conference on Harmonization, 2023. ICH Q2(R2) Guideline of Validation of Analytical Procedures. Step 5. Available online: https://www.ema.europa.eu/en/documents/scientific-guideline/ich-q2r2-guideline-validation-analytical-procedures-step-5-revision-1_en.pdf (accessed on 18 July 2024).
- Horwitz, W. Evaluation of analytical methods used for regulation of foods and drugs. Anal. Chem. 1982, 54, 67A–76A. [Google Scholar] [CrossRef]
- Monti, L.; Negri, S.; Meucci, A.; Stroppa, A.; Galli, A.; Contarini, G. Lactose, Galactose and Glucose Determination in Naturally “Lactose Free” Hard Cheese: HPAEC-PAD Method Validation. Food Chem. 2017, 220, 18–24. [Google Scholar] [CrossRef]
- Shakerdi, L.A.; Wallace, L.; Smyth, G.; Madden, N.; Clark, A.; Hendroff, U.; McGovern, M.; Connellan, S.; Gillman, B.; Treacy, E.P. Determination of the Lactose and Galactose Content of Common Foods: Relevance to Galactosemia. Food Sci. Nutr. 2022, 10, 3789–3800. [Google Scholar] [CrossRef] [PubMed]
- Ellefree Srl. Available online: https://www.ellefree.com/eng/ (accessed on 18 July 2024).
- Mannu, L.; Riu, G.; Comunian, R.; Fozzi, M.C.; Scintu, M.F. A preliminary study of lactic acid bacteria in whey starter culture and industrial Pecorino Sardo ewes’ milk cheese: PCR-identification and evolution during ripening. Int. Dairy J. 2002, 12, 17–26. [Google Scholar] [CrossRef]
- Mannu, L.; Paba, A.; Pes, M.; Scintu, M.F. Genotypic and phenotypic heterogeneity among lactococci isolated from traditional Pecorino Sardo cheese Get access Arrow. J. Appl. Microbiol. 2000, 89, 191–197. [Google Scholar] [CrossRef] [PubMed]
- Li, A.; Zheng, J.; Han, X.; Jiang, Z.; Yang, B.; Yang, S.; Zhou, W.; Li, C.; Sun, M. Health implication of lactose intolerance and updates on its dietary management. Int. Dairy J. 2023, 140, 105608. [Google Scholar] [CrossRef]
- Iskandar, C.F.; Cailliez-Grimal, C.; Borges, F.; Revol-Junelles, A.M. Review of lactose and galactose metabolism in Lactic Acid Bacteria dedicated to expert genomic annotation. Trends Food Sci. Technol. 2019, 88, 121–132. [Google Scholar] [CrossRef]
- Wu, Q.; Cheung, C.K.W.; Shah, N.P. Towards Galactose Accumulation in Dairy Foods Fermented by Conventional Starter Cultures: Challenges and Strategies. Trends Food Sci. Technol. 2015, 41, 24–36. [Google Scholar] [CrossRef]
- Zhang, S.S.; Xu, Z.S.; Qin, L.H.; Kong, J. Low-sugar yogurt making by the co-cultivation of Lactobacillus plantarum WCFS1 with yogurt starter cultures. J. Dairy Sci. 2020, 103, 3045–3054. [Google Scholar] [CrossRef]
- Igoshi, A.; Sato, Y.; Kameyama, K.; Murata, M. Galactose Is the Limiting Factor for the Browning or Discoloration of Cheese during Storage. J. Nutr. Sci. Vitaminol. 2017, 63, 412–418. [Google Scholar] [CrossRef]
- Vitoria, I.; Melendreras, F.; Vázquez-Palazón, A.; Rausell, D.; Correcher, P.; González-Lamuño, D.; García-Peris, M. Lactose and Galactose Content in Spanish Cheeses: Usefulness in the Dietary Treatment of Patients with Galactosaemia. Nutrients 2023, 15, 594. [Google Scholar] [CrossRef]
- McSweeney, P.L.H. Biochemistry of Cheese Ripening. Int. J. Dairy Technol. 2004, 57, 127–144. [Google Scholar] [CrossRef]
- Papagianni, M. Metabolic engineering of lactic acid bacteria for the production of industrially important compounds. Comput. Struct. Biotechnol. J. 2012, 3, e201210003. [Google Scholar] [CrossRef] [PubMed]
- Parvez, S.; Malik, K.A.; Ah Kang, S.; Kim, H.-Y. Probiotics and Their Fermented Food Products Are Beneficial for Health. J. Appl. Microbiol. 2006, 100, 1171–1185. [Google Scholar] [CrossRef]
- Muddada, S. Tagatose: The multifunctional food ingredient and potential drug. J. Pharm. Res. 2012, 5, 626–631. [Google Scholar]
- Kandler, O. Carbohydrate Metabolism in Lactic Acid Bacteria. Antonie Leeuwenhoek 1983, 49, 209–224. [Google Scholar] [CrossRef] [PubMed]
- Troyano, E.; Villamiel, M.; Olano, A.; Sanz, J.; Martínez-Castro, I. Monosaccharides and myo-inositol in commercial milks. J. Agric. Food Chem. 1996, 44, 815–817. [Google Scholar] [CrossRef]
- Fu, B.; Huang, X.; Ma, J.; Chen, Q.; Zhang, Q.; Yu, P. Characterization of an inositol-producing Lactobacillus plantarum strain and the assessment of its probiotic potential and antibacterial activity. LWT 2022, 153, 112553. [Google Scholar] [CrossRef]
- Cheese and Processed Cheese-Determination of The Total Solids Content. 2004. Available online: https://www.iso.org/standard/35249.html (accessed on 18 July 2024).
- Soxhlet, F. Die gewichtsanalytische Bestimmung des Milchfettes. Polytech. J. 1879, 232, 461–465. [Google Scholar]
- Milk and Milk Products-Determination of Nitrogen Content—Part 1: Kjeldahl Principle and Crude Protein Calculation. 2014. Available online: https://www.iso.org/standard/61020.html (accessed on 18 July 2024).
- Cheese and Processed Cheese Products-Determination of Chloride Content-Potentiometric Titration Method. 2006. Available online: https://www.iso.org/standard/43922.html (accessed on 18 July 2024).
Disclaimer/Publisher’s Note: The statements, opinions and data contained in all publications are solely those of the individual author(s) and contributor(s) and not of MDPI and/or the editor(s). MDPI and/or the editor(s) disclaim responsibility for any injury to people or property resulting from any ideas, methods, instructions or products referred to in the content. |
© 2024 by the authors. Licensee MDPI, Basel, Switzerland. This article is an open access article distributed under the terms and conditions of the Creative Commons Attribution (CC BY) license (https://creativecommons.org/licenses/by/4.0/).