Abstract
Sinapine adsorption was studied on four weak cation exchanges at pHs ranging from 2 to 8. The best adsorption rate was observed with C106 resin at pH 4 (95.25%). The adsorption kinetics followed a pseudo-second-order model while the isotherm data better fitted the Langmuir model. The ΔG°, ΔH°, and ΔS° values (−25.834 kJ·mol−1, −24.428 kJ·mol−1, and 0.004 kJ·mol−1·K−1) revealed that the adsorption process was spontaneous and exothermic. Acidified ethanol showed a better desorption rate (75.41%), while virtually no (3.32%) or low (31.14%) sinapine desorption was observed with 50% ethanol and 0.1 M HCl solution, respectively. This indicated that sinapine adsorption took place throughout both ionic and hydrophobic interactions. Very close sinapine adsorption performances were observed with an effluent of the patented rapeseed protein isolate process. Two-step desorption using 50% ethanol, then acidified ethanol, yielded a highly purified neutral sinapine-derivative phenol fraction (75.23%) in the first elution fraction and sinapine (98.85%) in the second one.
1. Introduction
Sinapine is a simple phenolic compound that is sinapic acid esterified by choline (Figure 1). It shows interesting antioxidant, antimicrobial, and anti-inflammatory properties [1,2,3,4,5]. It also acts as a prebiotic and regulates the intestinal microbiota, leading to anti-obesity and antidiabetic effects [6]. Furthermore, its ester bond can be easily hydrolyzed to release choline and sinapic acid, which have interesting health benefits [7,8,9].

Figure 1.
Chemical structure of sinapine (SN) and its hydrolysis products (sinapic acid (SA) and choline).
Sinapine accounts for 61–71% of rapeseed meal’s phenolic compounds. The rest of rapeseed’s polyphenols are other sinapic acid derivatives (SADs) associated with carbohydrates like sinapoylglucose (14–27%) or kaempferol [10,11]. Free sinapic acid is also present (7–10%). Rapeseed meal is the main byproduct of the rapeseed oil extraction process. Its annual worldwide production was estimated to be 29 million tons in 2022 [12], rising to 47.6 million tons in 2023. The main producers are the European Union, China, India, and Canada, with annual productions of 14.0, 11.0, 6.1, and 6.0 million tons, respectively, in 2023 [13]. This meal is used for animal nutrition because of its high protein content, which makes up between 30 and 45% of its composition [14]. Rapeseed meal is used for protein isolate production of highly purified protein products (>90% on a dry matter basis) for human nutrition. Isolates are obtained by tangential filtration after aqueous extraction and purification [15]. Liquid effluents from rapeseed protein isolate were reported to be particularly rich in sinapine and other SADs [10,15,16,17]. Hence, sinapine purification from these effluents could be a promising valorization pathway.
Different techniques are classically used for the purification of phenolic compounds from plant extracts. The most regularly used are liquid–liquid extraction, membrane processes, and adsorption on macroporous resins. Adsorption shows higher selectivity than membrane processes and is easy to use and scale up. In most cases, apolar or mildly apolar macroporous resins are used for the capture of phenolic compounds. Interesting results were obtained with extracts from various resources like kiwi, orange, black and green tea, sunflower, soybean, rapeseed, and ginger [18,19,20,21,22,23,24,25]. The observed binding capacities o ranged from 7.91 mg·g−1 (pokan juice limonin onto LX920 resin) to 90 mg·g−1 (blueberry polyphenols onto XAD-7HP resin) [21,25,26,27,28,29,30]. Various factors impact resin binding capacity, including the material type, its polarity, specific surface area, particle size, pore size, and porosity, as well as the nature and density of the functional groups responsible for substance fixation [31]. Sinapine adsorption capacities from rapeseed extracts ranged from 12.5 mg·g−1 to around 25 mg·g−1. The observed discrepancies were attributed to the effluent composition and ionic strength [10,24]. The adsorption kinetics of sinapine on mildly apolar resins follow a pseudo-second-order kinetic. Langmuir models describe the isotherm data most efficiently. Hence, sinapine adsorption occurs in a monolayer and at specific, uniform sites of the adsorbent, with the adsorption rate depending on the amount of solute at the adsorbent surface [32]. Similar behavior has been observed in the case of polyphenols extracted from sunflower meal using macroporous apolar resins and in the case of alfalfa leaf polyphenols, using both apolar and anion exchange resin [10,24,33,34]. The adsorption process was revealed to be spontaneous and exothermic [10,18,28]. Polyphenol desorption from macroporous resins is usually made using 50% to 80% (v/v) ethanol/water mixtures [25]. A high desorption rate of sinapic acid was observed with 70% ethanol solution, using a selection of hydrophobic resins [24]. In another study, 94.68% of sinapic acid was desorbed from apolar resin XAD16 using a 70% ethanol solution, while a 30% ethanol solution was more effective in removing sinapine (63.19%) [10].
The use of this type of adsorbent is very effective for total phenolic capture, but is non-selective. Hence, they have a poor ability to separate these compounds from each other. The quaternary amine group confers a positive charge to sinapine throughout a large pH range. No other rapeseed polyphenols share this chemical feature. Hence, cation exchange resin should be seen as a promising alternative for its purification from complex extracts. To date, no data are available on sinapine purification using such resins. The polyphenol adsorption mechanism of these resins also remains to be elucidated. In this study, a screening of different weak cation exchange resins based on sinapine adsorption rate, kinetics, and desorption rate was achieved at different pHs. With the most promising resin and pH, experimental kinetics and isotherms at different temperatures were regressed using various kinetics, isotherms, and thermodynamic adsorption models. Then, the capture of sinapine from a patented rapeseed isolate production effluent was studied. Sinapine adsorption performances from this complex matrix were compared with pure sinapine. Eventually, a desorption sequence yielding high-purity sinapine was searched for.
2. Materials and Methods
2.1. Chemicals
Standard sinapine was purchased from MedChemTronica. Sinapic acid (SA), formic acid, and 37% chlorohydric acid (HCl) (w/w) were sourced from Sigma-Aldrich. Sodium chloride (NaCl) and sodium hydroxide (NaOH) pellets and ethanol were sourced from VWR. Methanol and acetonitrile (ACN) were provided by Fisher Chemicals. All solvents and chemical reagents used in this study were analytical and high-performance liquid chromatography (HPLC)-grade. Rapeseed meal (RSM) was provided by the AVRIL group. C106, C115, and C104E+ resins were provided by Purolite. Diaion W100 was sourced from Resindion, Mitsubishi Chemicals. They were all weak cation exchange resins, with COO− as the functional group and H+ as a counterion. They differed in their ion exchange capacity, particle size, and functional group pKa. They also displayed different water retention capacities (Table 1).

Table 1.
Characteristics of the resins used in this study.
2.2. Production of the Sinapine Rich Aqueous Effluent from Rapeseed Meal
The sinapine-rich effluent was the permeate fraction of a rapeseed albumin isolate production process. Its production is precisely described in [15,16,17]. In brief, rapeseed meal was mixed with a 0.1 M NaCl solution at a solid-to-liquid ratio of 1:9 (w/w). The slurry was adjusted at pH 2 by HCl 1 M and agitated at 400 rpm at room temperature for 30 min, then centrifugated at 10,000× g for 30 min at 20 °C. The supernatant was degreased by tangential microfiltration using a 0.22 μm membrane at a transmembrane pressure of 0.2 bar (polyvinylidene difluoride Pellicon membrane, Millipore, MA, USA) up to a volume-reducing factor of 10. Proteins from this extract were purified by diafiltration using the Äkta Flux 6 device module (GE Healthcare, Chicago, IL, USA) using 3 kg·mol−1 cut-off membranes (polyether sulfone hollow fiber membrane, GE Healthcare, Chicago, IL, USA). The feed rate was set at 2 L·min−1 and the transmembrane pressure was maintained at 1.5 bar during the operation. Diafiltration was performed with six diavolumes of 0.5 M NaCl and three diavolumes of deionized water. The resulting permeate was used as a sinapine-rich effluent. It was adjusted at pH 2 after production by adding HCl 1 M to avoid phenol oxidation.
2.3. Adsorption/Desorption Study
2.3.1. Resins Screening, Adsorption Kinetics and Isotherms
For resin screening and kinetics, 30 mL of 0.25 mg·mL−1 sinapine in methanol/water 30% (v/v) or sinapine-rich effluent was stirred with 1.5 g of dry resin at 120 rpm at 25 °C ± 2 °C. The pH was adjusted at the targeted value (pH 2 ± 0.2 to 8 ± 0.2) by using either 1 M HCl or 1 M NaOH solution. For resin screening, the adsorption lasted 2 h. For the kinetics, adsorption was monitored during the 2 h and 200 µL of pure sinapine samples were collected at 0, 3, 9, 15, 20, 25, 30, 45, 60, 90, and 120 min for sinapine quantification by measuring absorbance using microplates at 325 nm.
For the adsorption isotherms, the same amounts of resin and liquid were used (1.5 g and 30 mL). Experiments were achieved at pH 4 ± 0.2 at three temperatures (25 °C, 35 °C and 45 °C) with sinapine concentrations ranging from 0.1 to 0.5 mg.mL−1 at 25 °C for 45 min.
The adsorption rate and capacity (q) were calculated using Equations (1) and (2).
C0 and C are the sample concentration and concentration after adsorption, respectively (mg·mL−1)
Vi is the sample volume (mL) and W is the weight of the dry resin (g).
The adsorption kinetics and isotherms data were regressed with linearized pseudo-first-order (PFO), pseudo-second-order (PSO), intraparticle diffusion models, and Langmuir and Freundlich models, and the thermodynamic parameters were calculated using the equations presented in Table 2.
The RL factor was calculated to check whether the adsorption was favorable (0 < R < 1), unfavorable (R > 1), linear (R = 1), or irreversible (R = 0). RL was calculated using Equation (3):
KL is the Langmuir constant (L·mg−1)
2.3.2. Sinapine Desorption Kinetics
Following the adsorption step, the resins were washed twice with deionized water and separated from the liquid filtration using filter paper. Then, 30 mL of a desorption solution was added to the resin and shaken at 150 rpm and 25 °C for 2 h. Three different elution solutions were tested: hydrochloric acid 0.1 M, ethanol 50% (v/v), and acidified ethanol 50% (HCL 0.044 M). Samples of 200 µL of pure sinapine were collected at 0, 3, 9, 15, 30, 60, 90, and 120 min for sinapine quantification by measuring the absorbance using microplates at 325 nm.
The desorption rate was calculated using Equation (4):
where Cd, Ce, and Vd are the concentration of the desorbed solution, after adsorption at equilibrium, and the volume of the desorbed solution.
2.4. Quantification of Sinapine (SN) and Sinapic Acid (SA)
Sinapine from standard solutions was quantified by UV-Vis spectrophotometry at 325 nm. A calibration curve was established with sinapine standard at concentrations ranging from 0.05 to 0.5 mg.mL−1. The equation for the calibration line was y = 2.822x (R2 = 0.9993).
Sinapine and sinapic acid from aqueous effluents were quantified by SE-HPLC according to Albe Slabi et al. [10,35]. The HPLC system used (by Shimadzu Corporation, Kyoto, Japan) consisted of a pump and degasser (LC-20AD), a column oven (CTO-20A), and a diode array detector (CPO-M20A). The analysis utilized a size exclusion (SE) column, which was a Biosep 5 μm SEC-s2000 145 Å (300 × 7.5 mm, 5 μm) from Phenomenex (Torrance, CA, USA).
During the analysis, elution was carried out over 60 min at a temperature of 35 °C in isocratic mode. The eluent consisted of ACN (acetonitrile), ultra-pure water, and formic acid in a ratio of 10:90:0.1 (v/v). The flow rate was set at 0.6 mL·min−1. The injection volume was 5 µL. The UV signal was monitored in a wavelength range of 190 to 400 nm. Peaks at 325 nm were used for sinapine and sinapic acid quantification. The equations for the calibration lines were y = 2.48 × 10⁷x and y = 4.33 × 10⁷x for sinapine and sinapic acid (R2 > 0.999 for both of the two lines).
2.5. Data Analysis
All experiments were conducted in triplicates. The results are presented as the means ± standard deviation based on three separate experiments. Statistical analysis was performed by the one-way analysis of variance using Excel. All tests were considered significant at a p-value < 0.05.
3. Results and Discussion
3.1. Cation Exchange Resin Screening
3.1.1. Sinapine Adsorption Rate
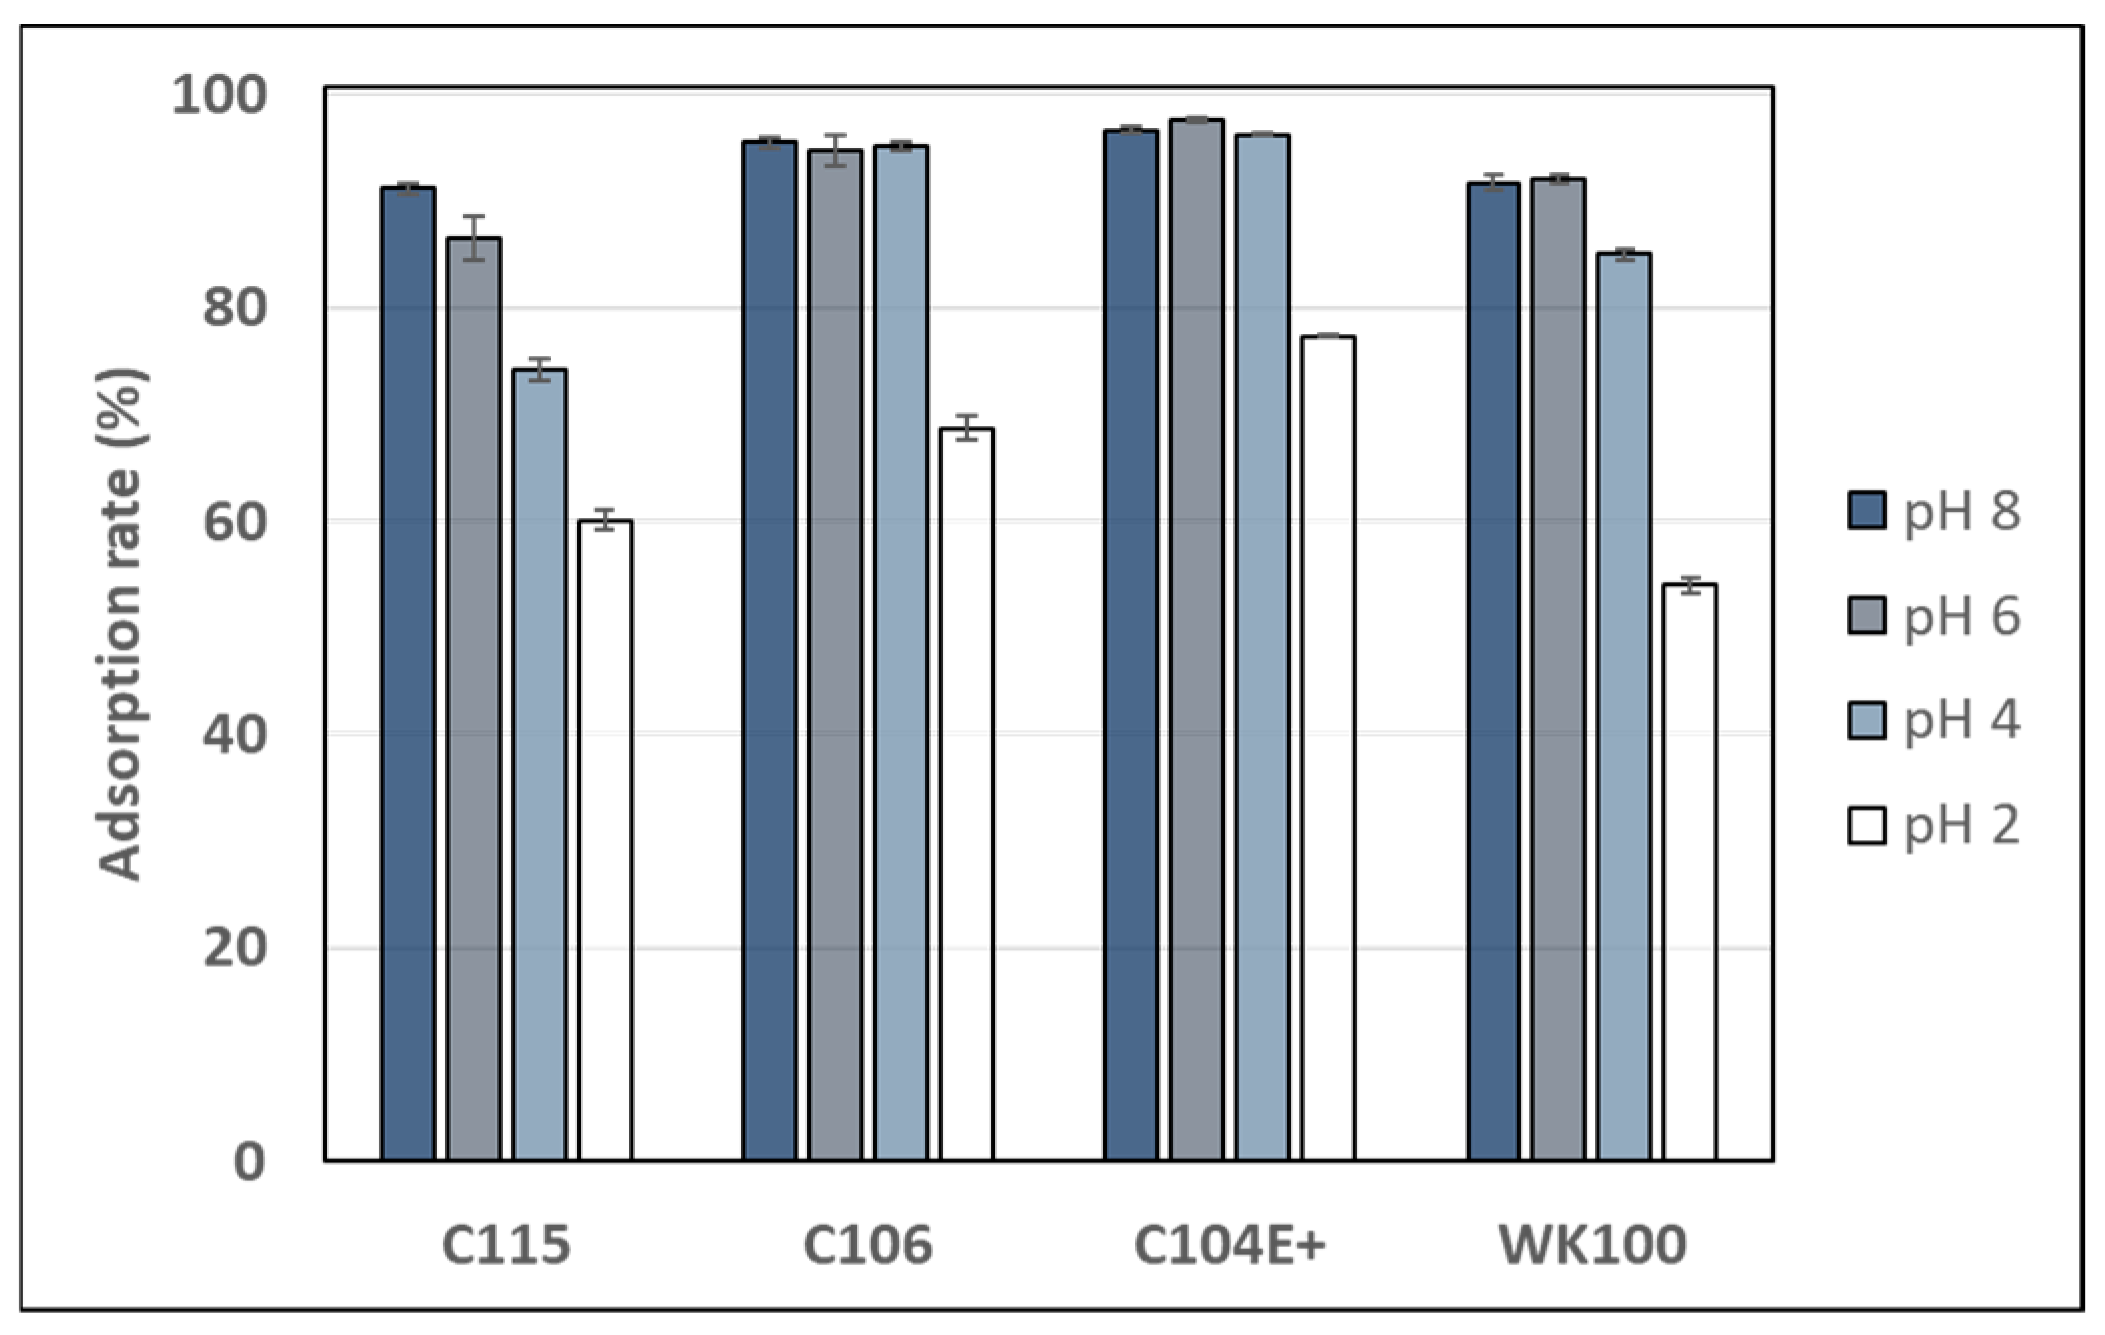
Figure 2 displays the adsorption rate of sinapine on four weak cation exchange resins (Purolite C115, C106, C104E+, and Diaion WK100) at pHs ranging from 2 to 8. The pH range was chosen to obtain various resin charge states, since the pKa of the resin’s carboxylic group ranged from 3.5 to 5.5–6. Such weak exchangers were selected to enable sinapine desorption under mild acidic solutions (pH > 2) in order to avoid its hydrolysis being catalyzed under strong acidic conditions [36]. Out of the four resins, C106 and C104E+ exhibited the highest adsorption rates (> 95%) at pHs 8 to 4, which significantly declined at pH 2 (70% and 77% for C106 and C104+, respectively). The WK100 resin showed lower figures (around 92% at pH 8–6 and 54% at pH 2) and the decrease started at pH 4. From pHs 8 to 2, the adsorption rate on C115 decreased continuously from 91% to 60%. This aligns with C115’s pKa of around 6.
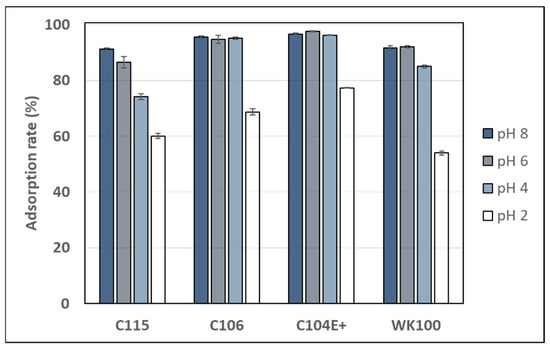
Figure 2.
Adsorption rate of sinapine onto Purolite C115, C116, C104E+, and Diaion WK100 at pHs 2, 4, 6, and 8 (after 120 min).
Both C106 and C104+ have a pKa around 4, as shown in Table 1. Hence, their poor charge at pH 2 may explain the decrease in sinapine adsorption. Interestingly, despite having virtually no positive charge at pH 2, the resin rates remained relatively high (54% to 77%). This indicated that sinapine might also adsorb onto resins throughout the hydrophobic interaction with the methacrylate or polyacrylate backbone. Such interactions were previously observed between sinapine and neutral macroporous resins (XAD resins) [10]. The effect of pH on the adsorption of various molecules onto different types of adsorbents was investigated. It was found that pH did not affect the adsorption of marbofloxacin (a fluoroquinolone) on granular activated carbon. The adsorption rate remained consistent, reaching approximately 90% across a pH range from 3 to 11 [37]. A similar pattern was observed for the batch adsorption of acetylsalicylic acid, where the adsorption rate showed a trend from pH 3 to pH 7 [38]. Another study showed that pHs between 4 and 8 did not influence the rate of caffeine adsorption on the activated carbon. However, this rate decreases at pH 10 due to the electrostatic repulsion between the negatively charged caffeine (pka = 10.4) and the surface of the negatively charged adsorbent (pHPCZ = 8.04) [39].
3.1.2. Sinapine Adsorption Kinetics
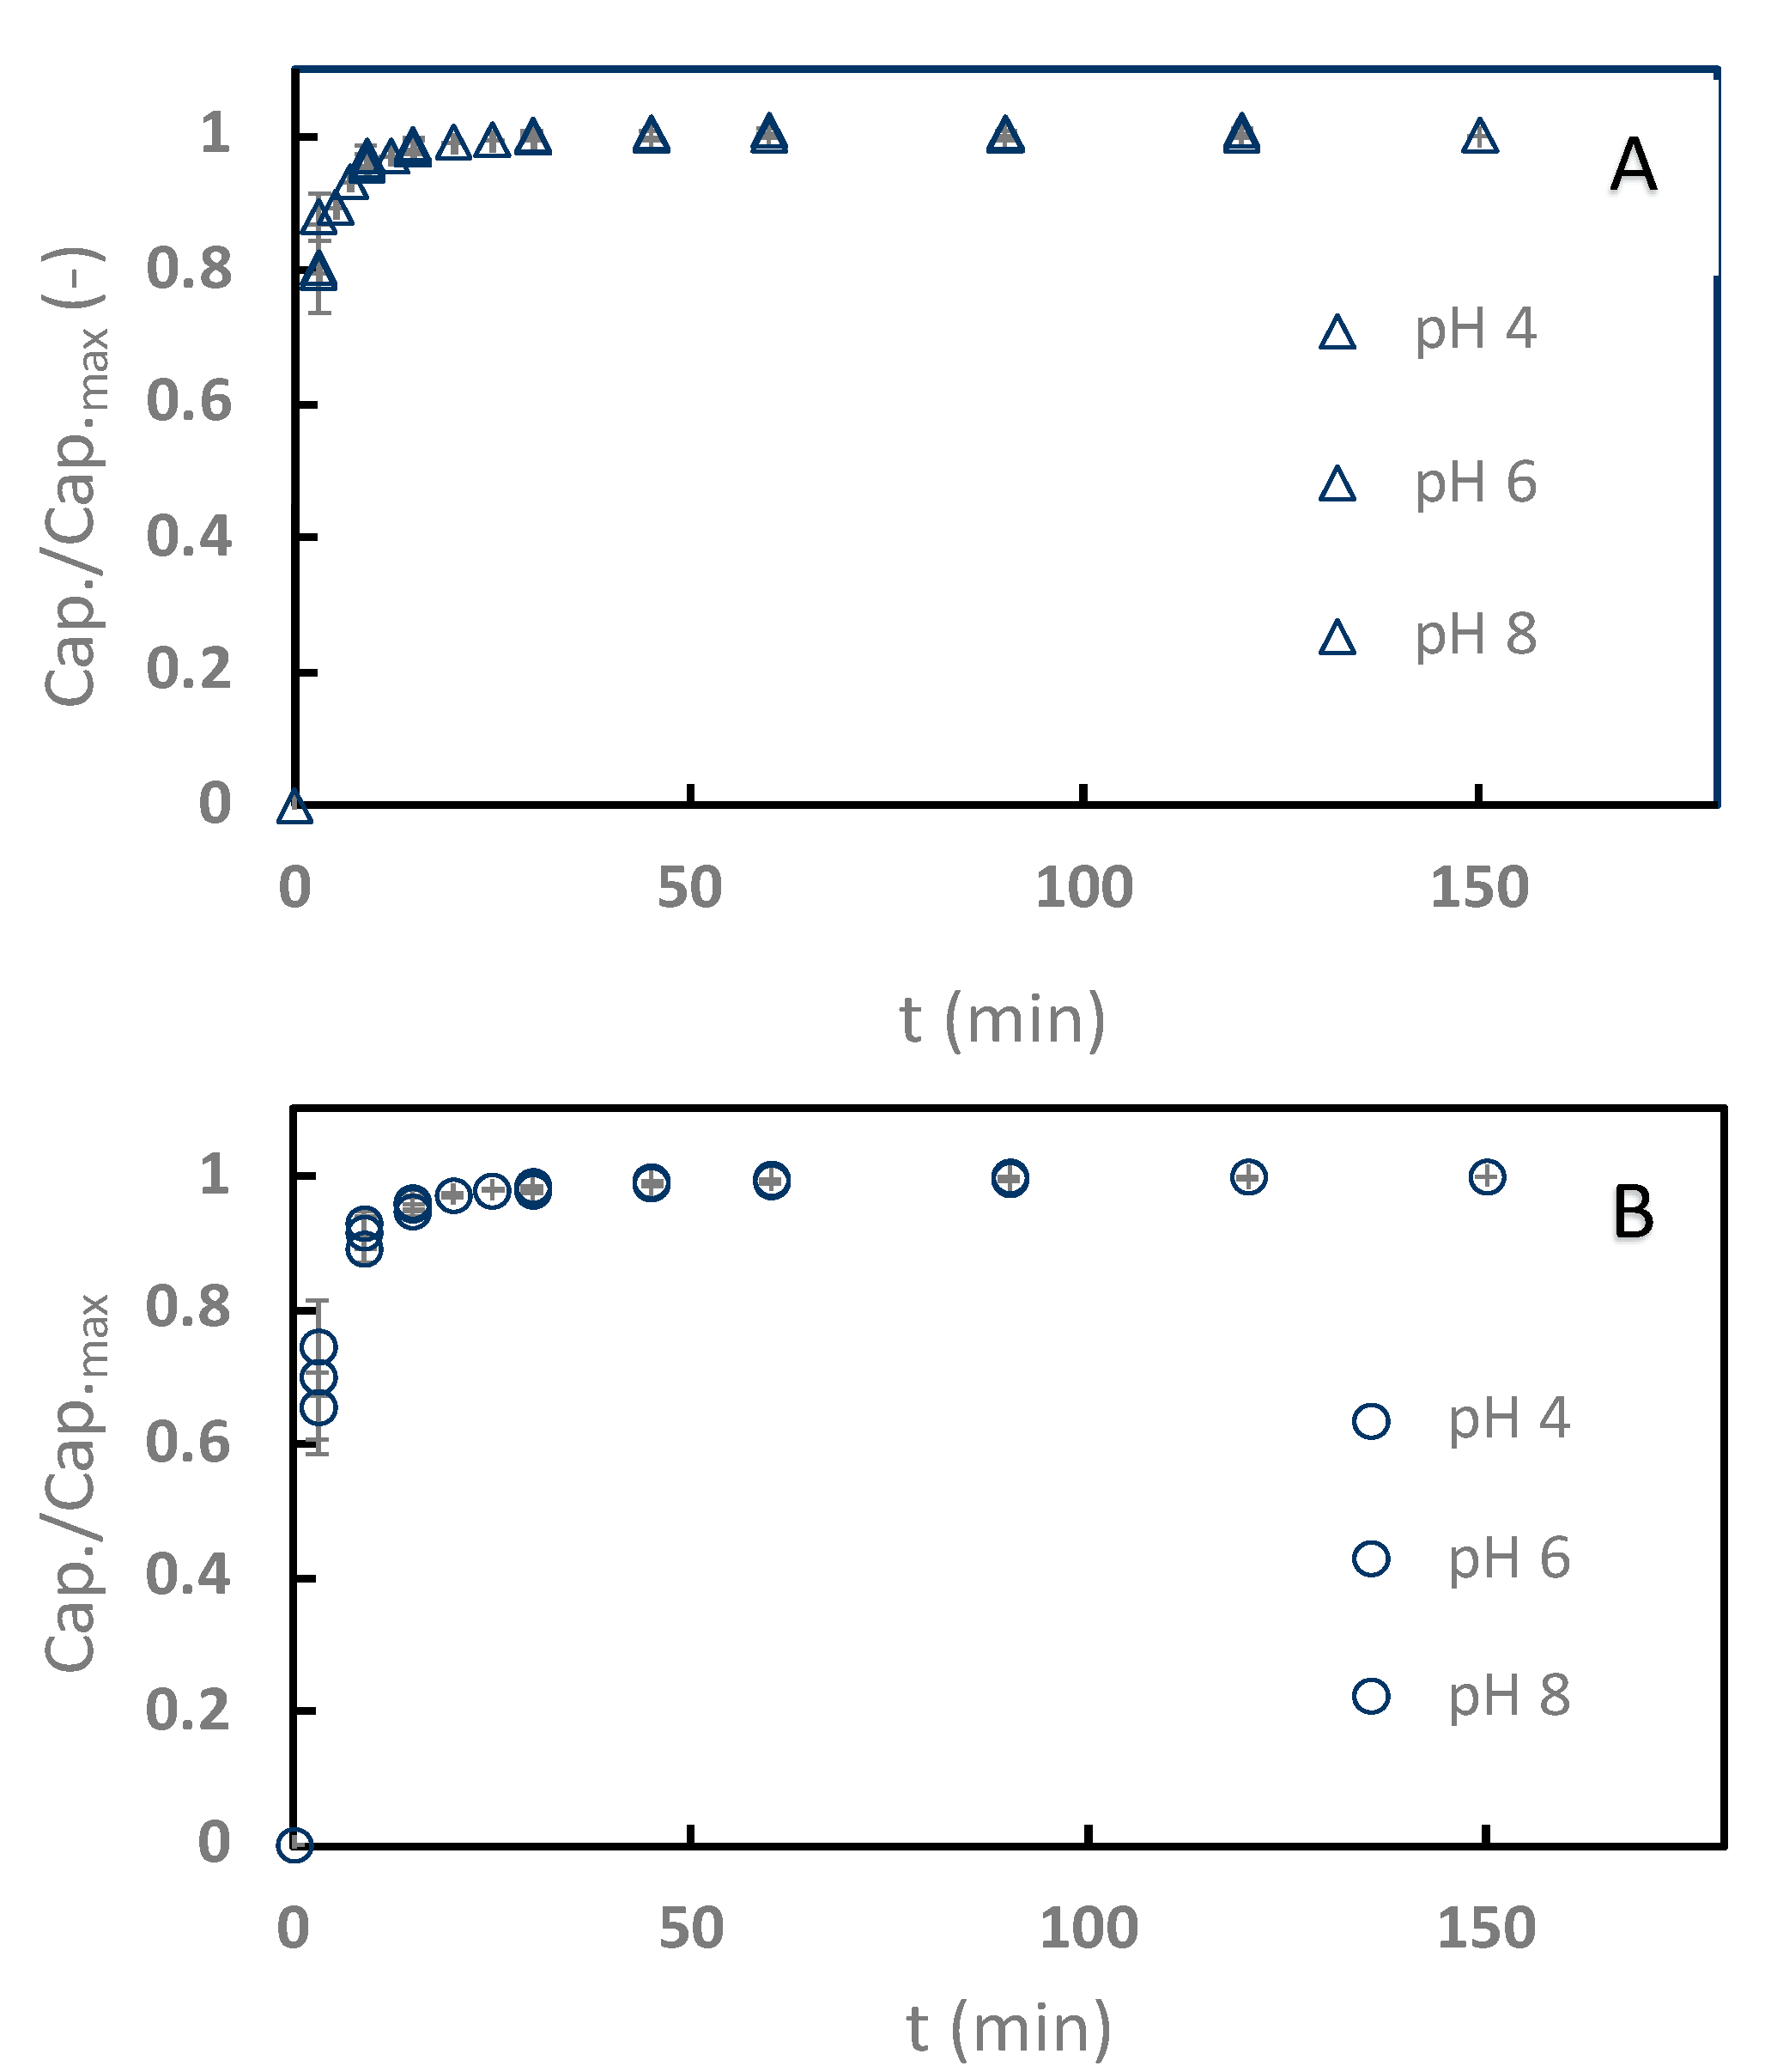
Sinapine adsorption kinetics with the two better resins (C106 and C104+) were monitored at pHs 4–8 (Figure 3), with pH 2 discarded from the kinetics study because of the poor adsorption rates in this condition. Interestingly, the adsorption process was particularly faster with C106 (Figure 3A) than with C104+ (Figure 3B). C106 reached equilibrium within 7 min, while 20 mins were necessary for C104+. Obviously, no effects of the pH on the kinetics were noticed. The diffusive transport of molecules from the liquid phase into resin pores is classically considered as the limiting transport phenomenon [10]. In our case, the resin pore sizes were not given by the manufacturers. However, the moisture retentions are available. They are around 50% for C106 and 40% for C104+. This retention should be related to resin porosity and pore size. Hence, it can be hypothesized that the faster kinetics observed with C106 are due to the resin pore size. In any case, the adsorption on the weak cation exchange resin is faster than what is commonly seen with neutral apolar resins, where the adsorption equilibrium is reached between 30 min and 120 min depending on the amount of resin used versus the amount of adsorbate treated [10,30,33].
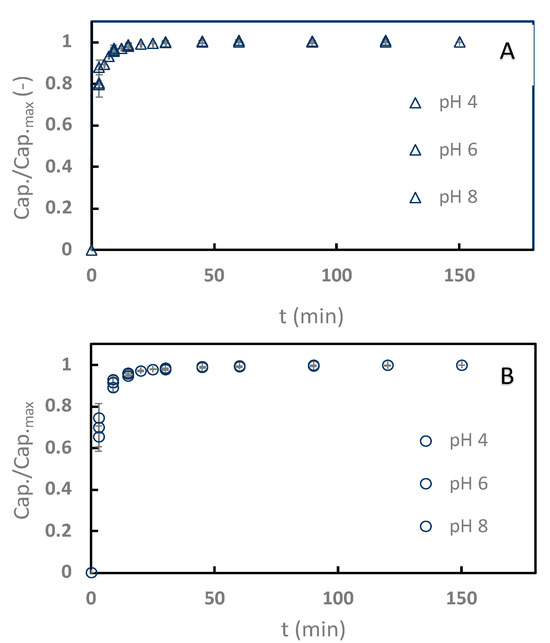
Figure 3.
Relative adsorption capacity kinetics of sinapine adsorption onto Purolite C106 (A) and C104E+ (B) at pHs 4, 6, and 8. Relative adsorption capacity is expressed as capacity at t over maximum capacity (at 25 °C).
3.1.3. Sinapine Desorption
Sinapine should be mainly adsorbed onto C104+ and C106 by the ionic bonds, but hydrophobic interactions were also suggested to probably occur. Hence, 0.1 M HCl, 50% water/ethanol (v/v), and acidified ethanol (50% water/ethanol (v/v), HCl 0.044 M) were assayed for sinapine desorption.
Figure 4A shows that 50% ethanol alone cannot desorb sinapine efficiently from the two resins (3.32 ± 0.96% and 1.46 ± 0.7%). This desorption rate is very low compared to neutral resins [10]. At first sight, this tended to indicate that there were very few non-specific hydrophobic interactions. The relatively high adsorption rate observed at pH 2 (uncharged resin) would let us expect a higher desorption rate when using ethanol. On the other hand, the desorption rate observed with 0.1 M HCl was rather low (31.14%). Interestingly, large desorption rates were observed using acidified ethanol (75.41% for C106 and 70.79% for C104+).

Figure 4.
Desorption rate of sinapine from C106 and C104E+ using different eluents (ethanol 50% v/v, HCl 0.1 M, and 50% water/ethanol (v/v), HCl 0.044 M (EthOH/HCl) (A). Relative desorption kinetics of sinapine from the two resins using acidified ethanol (B). Relative desorption represents the ratio between the desorption rate at t and the maximum desorption rate.
According to previous studies, 63% of sinapine was desorbed from the apolar resin XAD16 using a 30% ethanolic solution [10]. Thiel et al. conducted a study to evaluate the adsorption and desorption of the major phenolic compounds of rapeseed meal (sinapine, sinapic acid) and wheat seed using different materials, such as apolar resins (XAD16), low polar (XAD7HP), polar (PVPP), and two types of zeolites (polar with cation exchange properties). The results showed that when using a 70% ethanol solution, the desorption rate of sinapine was 0% with zeolites, 4.6% with XAD7HP, 3.7% with XAD16, and 2.2% with PVPP [37,38].
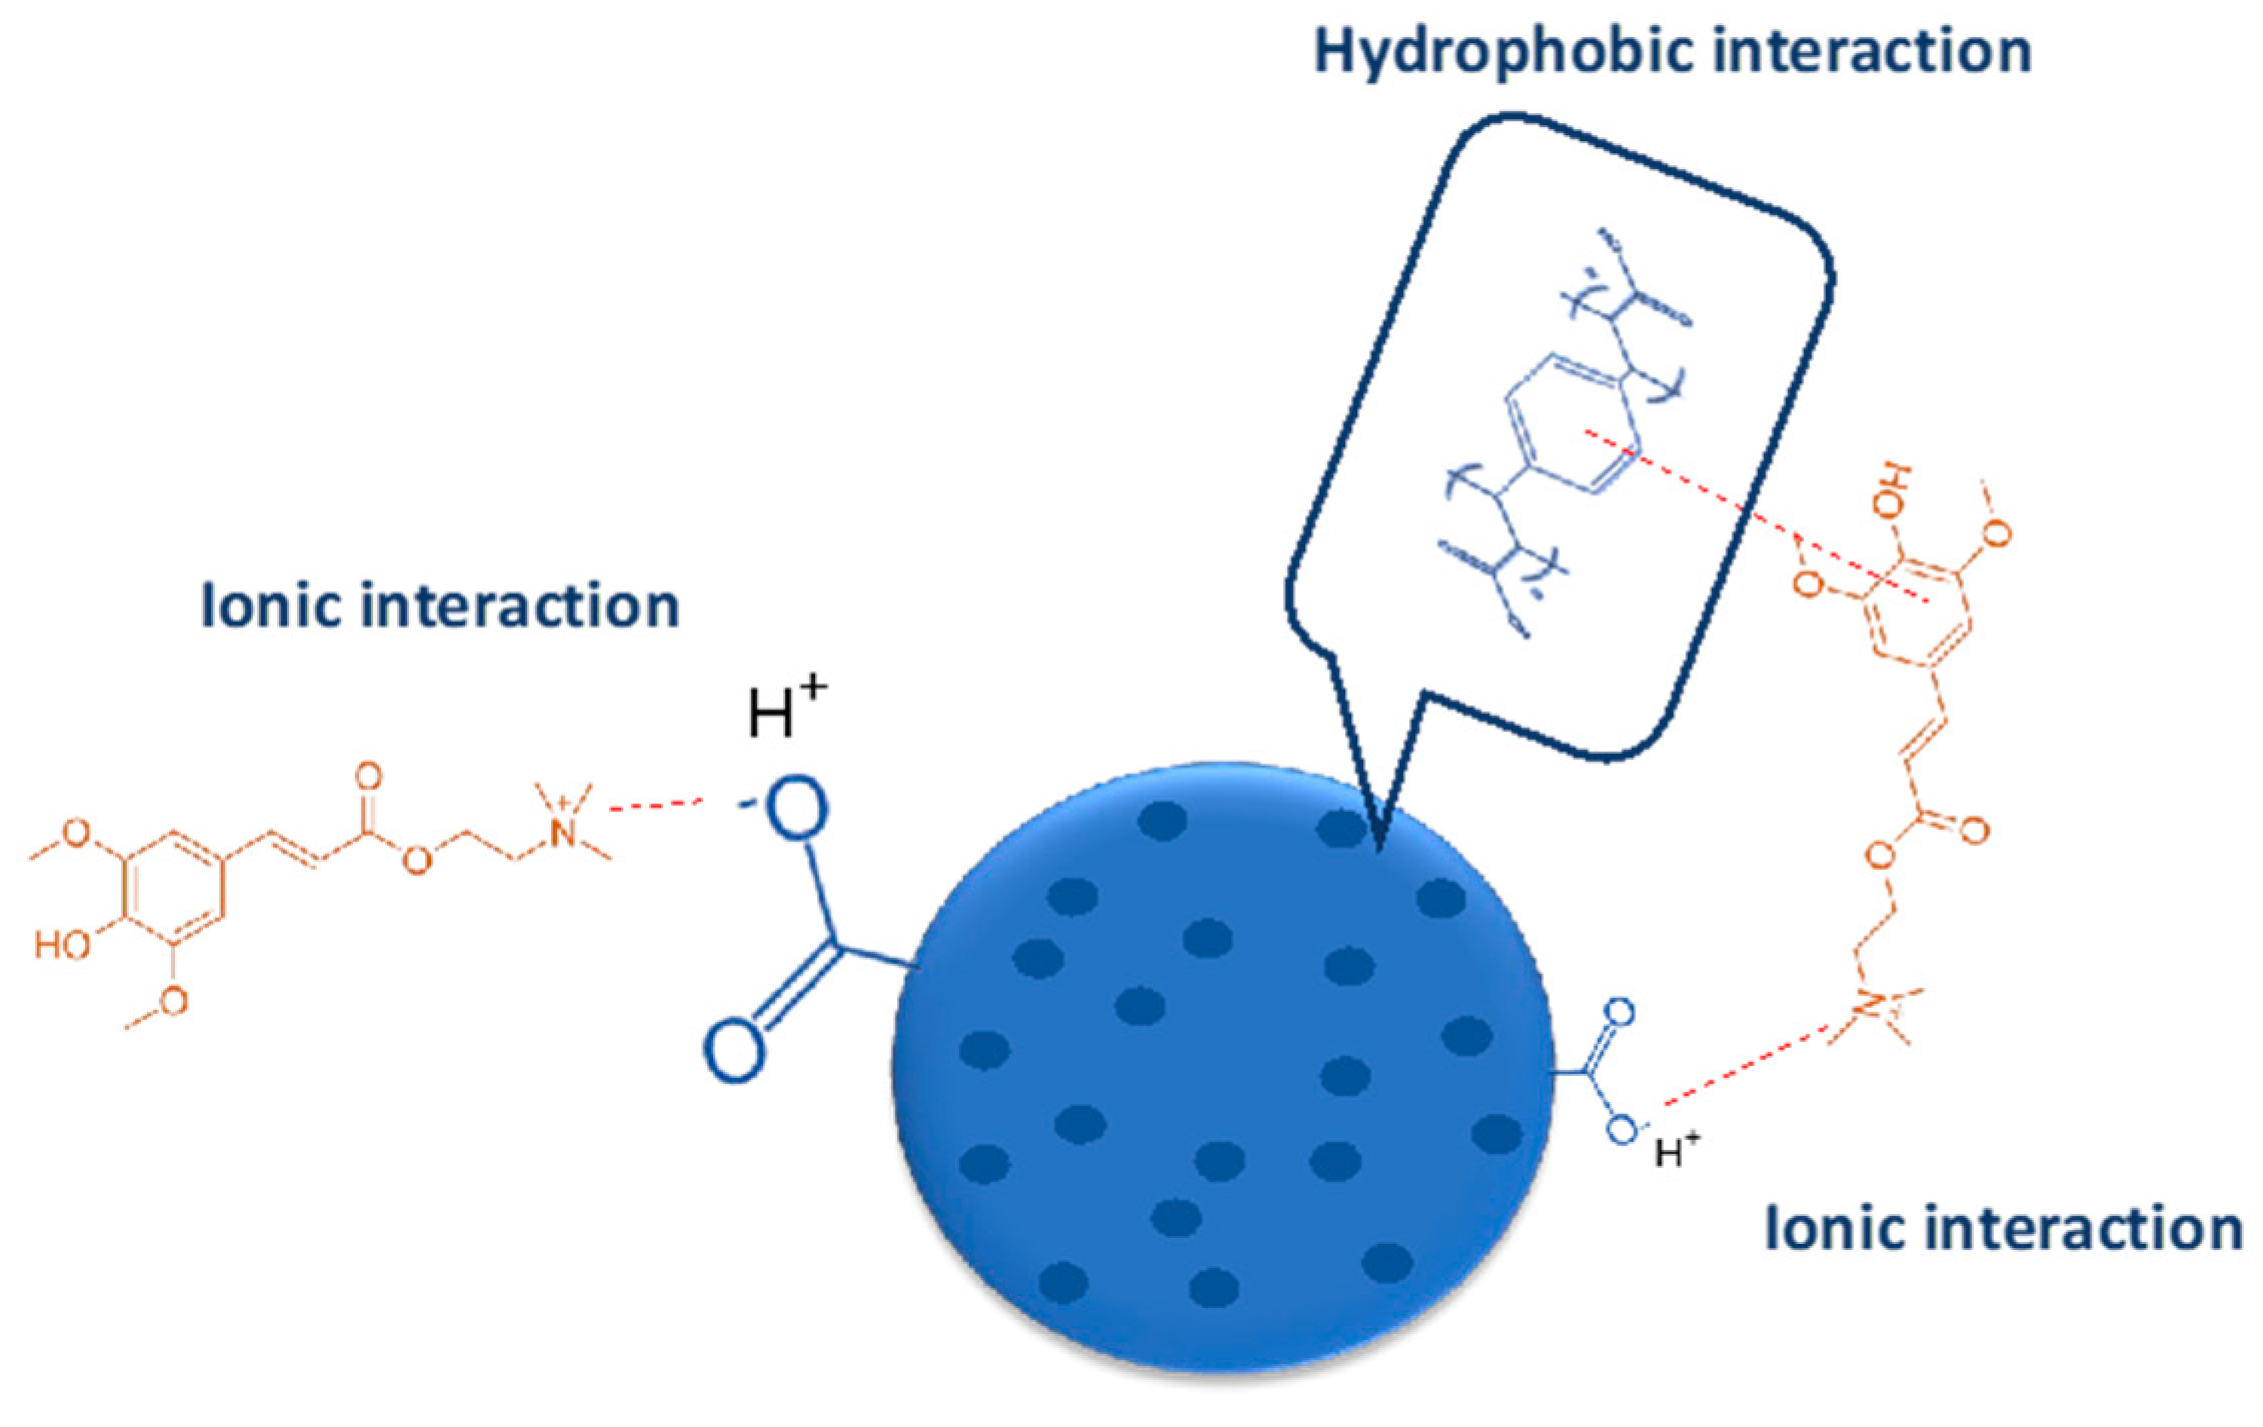
The improvement of desorption using acidified ethanol clearly indicates that a part of sinapine is adsorbed only by the ionic bonds, whereas another one is fixed throughout both the hydrophobic and ionic bonds. Figure 5 illustrates the different possible interactions between resin and sinapine.
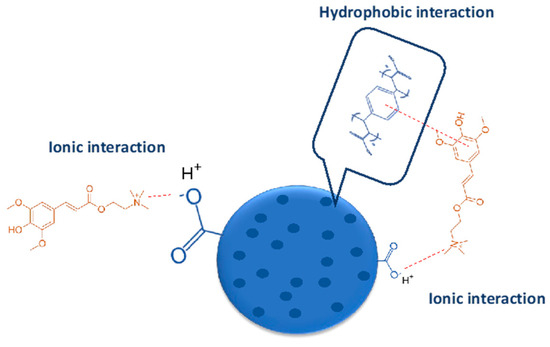
Figure 5.
Hypothetic interactions between C106 resin and sinapine.
The desorption kinetics of sinapine using acidified ethanol were studied for both resins (Figure 4B). The adsorption kinetics are clearly faster than desorption. With C106, equilibrium is observed within 30 min, whereas it is barely reached at 120 min with C104E+. The fastest desorption kinetics of C106 are in line with the adsorption kinetics results observed above. This tends to confirm that higher porosity of C106 is associated with lower diffusional limitations. Hence, C106 resin and adsorption at pH 4 were chosen for adsorption mechanism elucidation.
3.2. Elucidation of the Mechanisms of Sinapine Binding
3.2.1. Kinetic Modeling
Pseudo-first-order, pseudo-second-order, and intraparticular diffusion models were used to regress the experimental data with C106 at pH 4. Figure 6 displays the experimental data and regression of the linearized form of the models. Table 2 presents the kinetic parameters and coefficient determination values.

Figure 6.
Kinetic adsorption of sinapine onto C106 resin at pH 4 (25 °C) regressed with linearized pseudo-first-order (PFO) model (A), linearized pseudo-second-order (PSO) model (B), and linearized intraparticle diffusion model (C).
Comparison between pseudo-first and pseudo-second determination (0.978 vs. 1) indicates that the kinetics of the adsorption process follow a pseudo-second-order mechanism. In addition, the adsorption capacity at the equilibrium (qe) values obtained with the pseudo-first-order model (1.093 mg·g−1) differed significantly from the experimental values (4.998 mg·g−1). This implies that the adsorption process of sinapine onto weak cation exchange resins relates to the number of sites available on the adsorbent, with the reaction rate depending on the amount of solute at the surface of the adsorbent. This finding indicates that the limitation of the adsorption of sinapine is not due to the initial concentration, but rather to the amount of resin used. Similar observations were made in several studies investigating the adsorption of sinapine to XAD16 [10] and other phenolic compounds such as gallic acid, p-coumaric acid, catechin, p-hydroxybenzoic acid, and phenol to activated carbon [39].
Intraparticle diffusion clearly shows a two-slop trend with R2 values of 0.931 and 0.831. Model coefficient ki,1 is higher than ki,2, with the latter tending to be towards 0. This indicated that diffusion through the pores was influenced by the formation of a layer on the resins’ surface or by the resins’ pore size. Similar behavior was also observed for sinapine adsorption on neutral apolar XAD16 resin [10].

Table 2.
The calculation of parameters from linear regressions of kinetic models and isotherms, and the determination of thermodynamic parameters of sinapine adsorption on C106 resin at pH 4.
Table 2.
The calculation of parameters from linear regressions of kinetic models and isotherms, and the determination of thermodynamic parameters of sinapine adsorption on C106 resin at pH 4.
| Equations | Parameters | Value |
|---|---|---|
| Pseudo first-order (Equation (5)) | 0.151 | |
| 1.093 | ||
| 0.978 | ||
| Pseudo second-order (Equation (6)) | 0.303 | |
| 5.078 | ||
| >0.999 | ||
| Intraparticle diffusion (Equation (7)) | 0.617 | |
| 2.490 | ||
| 0.931 | ||
| 0.034 | ||
| 4.679 | ||
| 0.831 | ||
| Langmuir (Equation (8)) | 8.091 | |
| 0.114 | ||
| 0.993 | ||
| Freundlich (Equation (9)) | 0.337 | |
| 1.786 | ||
| 0.929 | ||
| Van’t off (Equation (10)) (Equation (11)) | (*) | −25.83 |
| −24.42 | ||
| 0.004 |
(*) at 25 °C.
3.2.2. Adsorption Isotherms
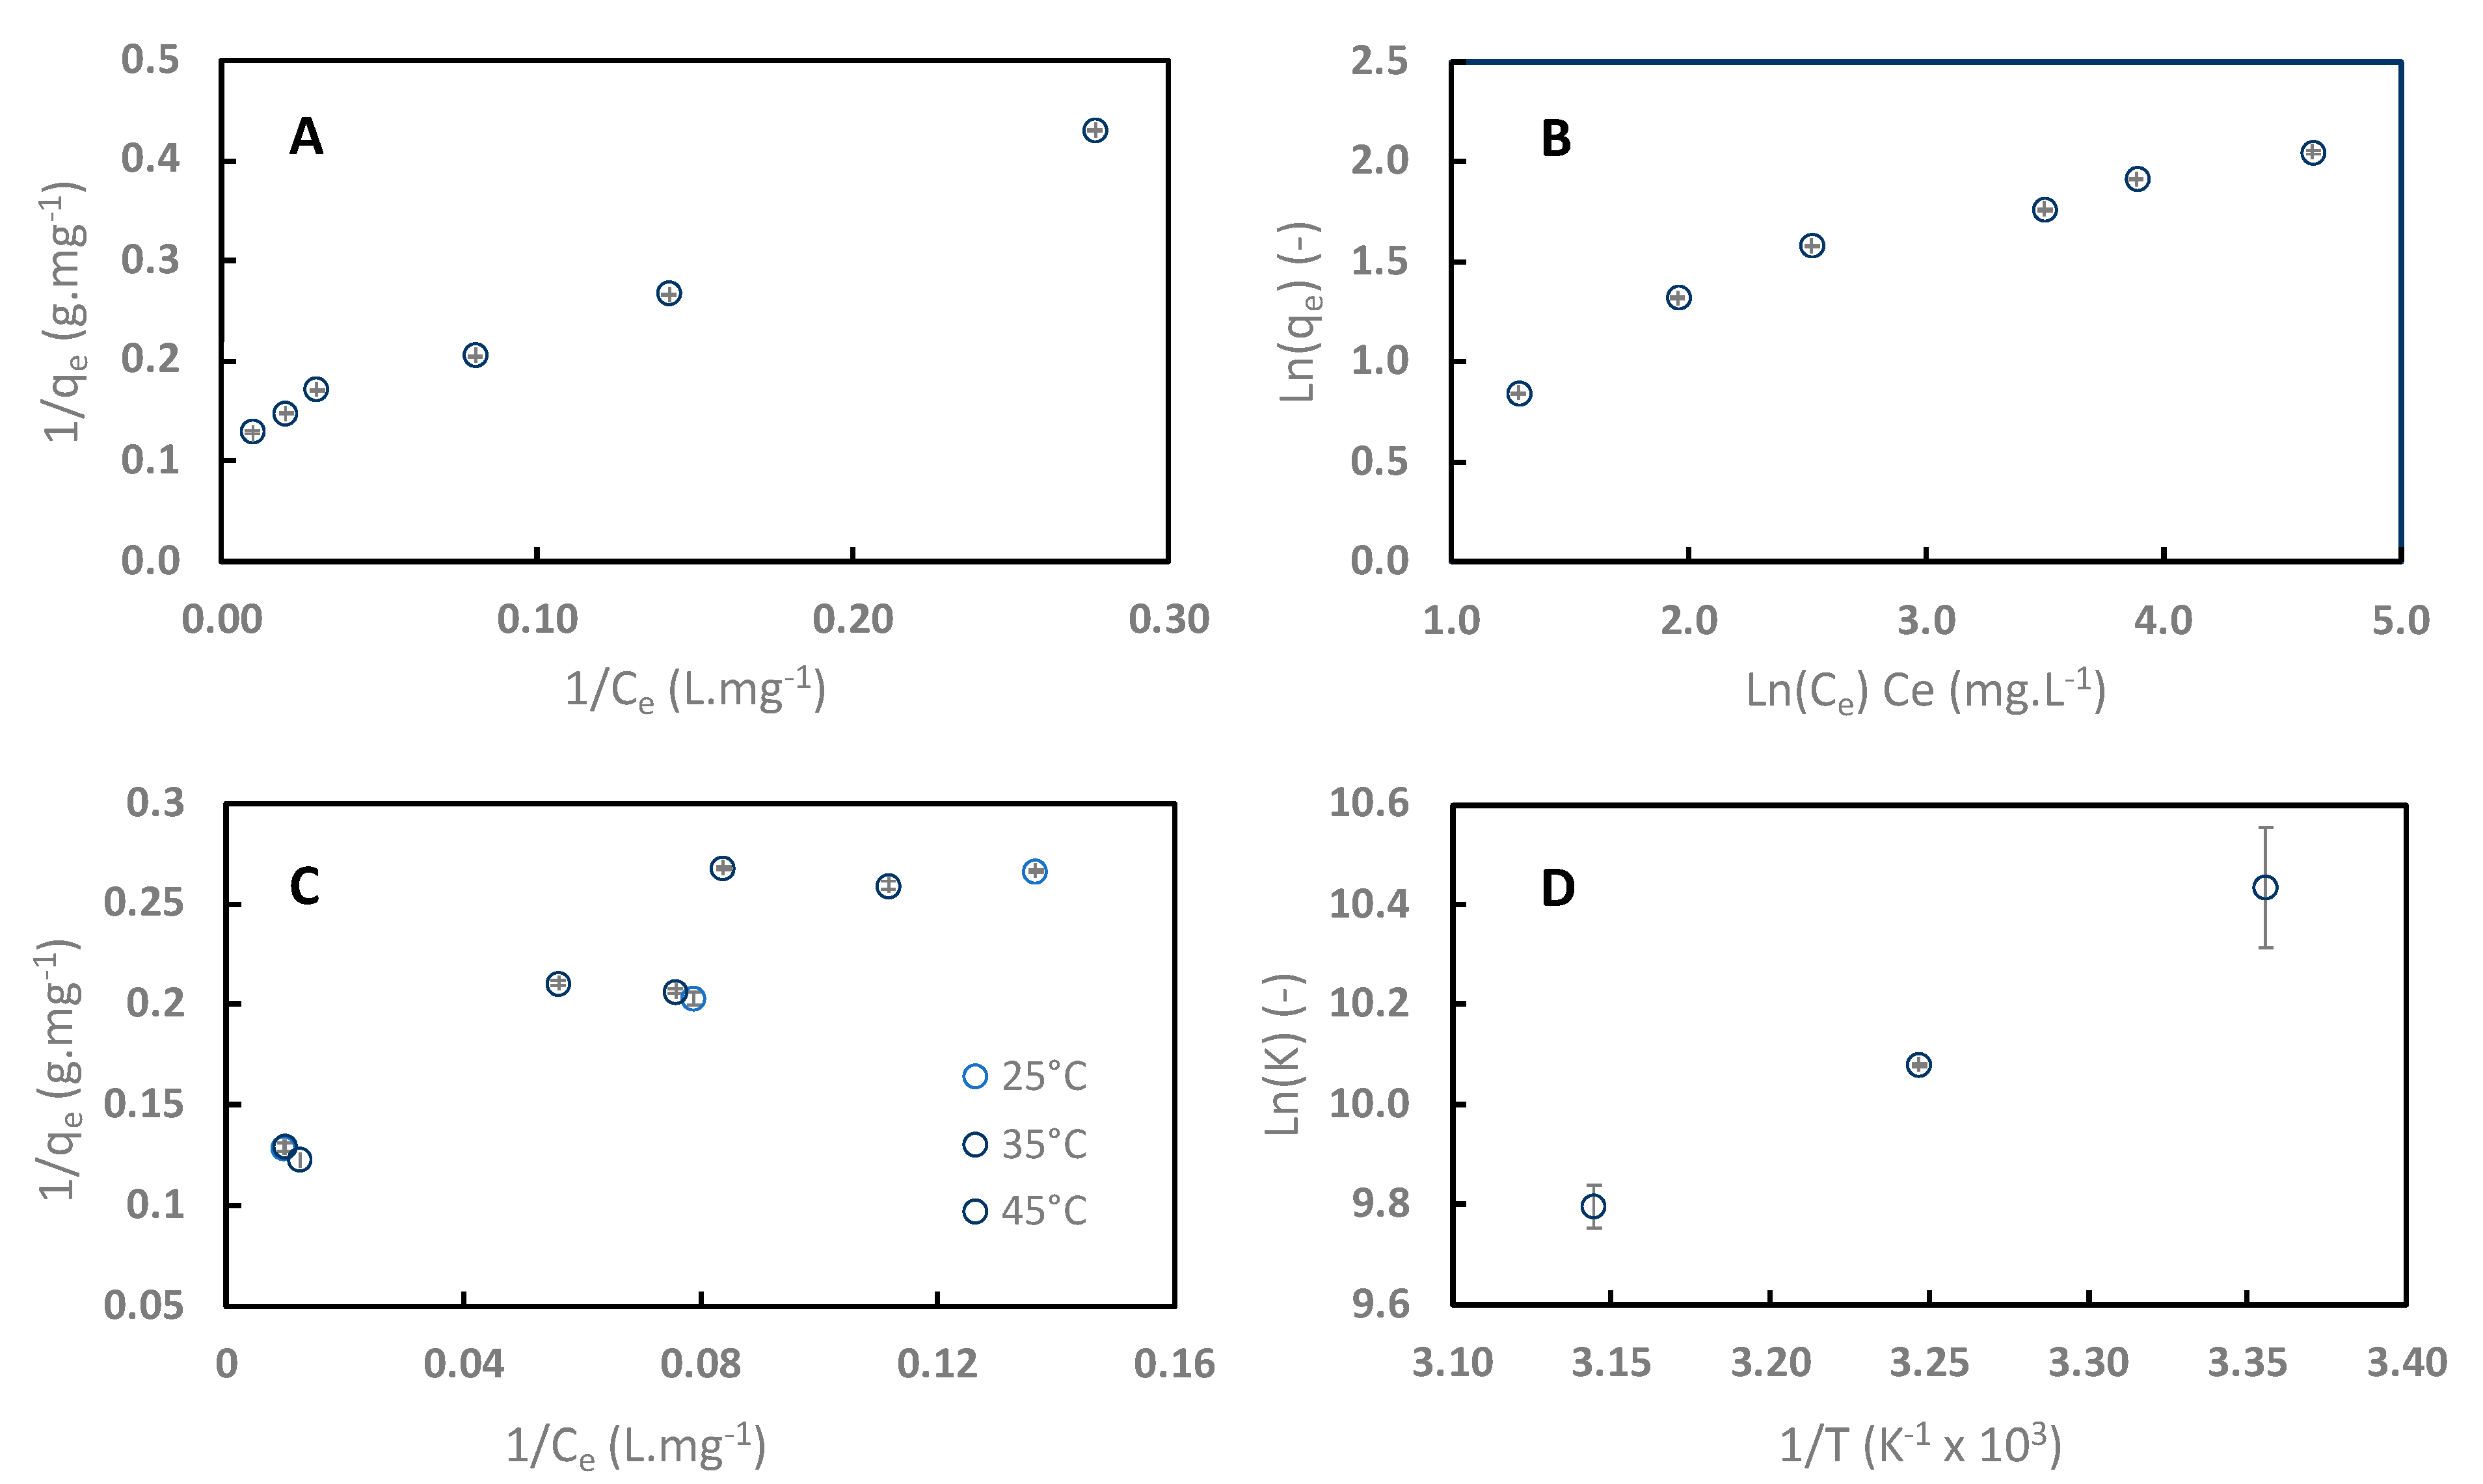
Adsorption isotherms of sinapine onto C106 resin at pH 4 at 25 °C are shown in Figure 7. Data were regressed with linearized Langmuir (Figure 7A) and Freundlich (Figure 7B) equations. Table 2 lists the different parameters and R2 values of the regression. R2 values show that data were better fitted to the Langmuir model for sinapine (0.99) than to the Freundlich model (0.93). Therefore, the adsorption of sinapine on the C106 surface was under a monolayer, as is commonly seen with polyphenol adsorption onto neutral apolar resins including sinapine [10,24,39,40,41,42,43].
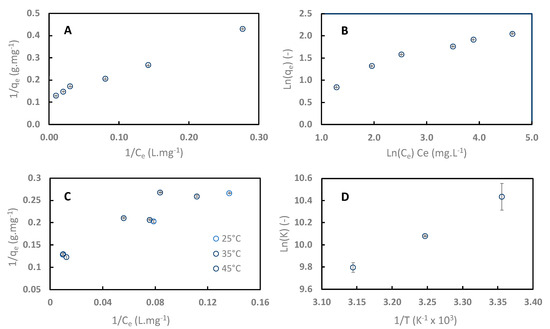
Figure 7.
Adsorption isotherms of sinapine data on C106 at pH 4 and 25 °C, regressed with linearized Langmuir and Freundlich models (A,B). Impact of the temperature on sinapine adsorption isotherm (C) and Ln K vs. 1/T plot (D).
RL separation factor is the Langmuir constant related to the energy of adsorption. RL was 0.05, demonstrating that sinapine adsorption onto weak exchange resin is favorable.
3.2.3. Determination of Thermodynamic Parameters
Figure 7C shows the effect of temperature on sinapine adsorption on C106 (25 to 45 °C). Obviously, the sinapine adsorption capacity decreased with increasing temperature. Such behavior was previously observed with sinapine and CGA adsorption (the majority phenolic compound in sunflower) onto neutral hydrophobic resins [10].
From these data, the Gibbs energy (ΔG°) and the equilibrium constant K of sinapine adsorption at the three temperatures were calculated. Linear regression of LnK vs. 1/T was performed in order to deduce the adsorption enthalpy (ΔH°) and entropy (ΔS°) (Figure 7D). As expected, the negative value of ΔG° indicated that sinapine adsorption onto cation exchange resin is a spontaneous process (Table 3). The negative value of ΔH° showed that the adsorption is exothermic [40]. This was also observed for sinapine and 5-CQA on neutral apolar resins. Interestingly, ΔS° was positive and close to 0. Similar results were observed in a previous study investigating the adsorption of aminophenol on a polyaryletherketone resin containing carboxyl groups [40]. Polyphenol adsorption onto neutral apolar resins showed a negative ΔS° characteristic of random adsorption at the solid–liquid interface. Hence, it can be concluded that the adsorption of sinapine onto ion exchange is made at defined adsorption sites.

Table 3.
Thermodynamic parameters of adsorption of pure sinapine on Purolite C106 resin at pH 4.
3.3. Sinapine and Sinapic Acid Capture from a Rapeseed Protein Isolate Effluent
An effluent from rapeseed protein isolate was adsorbed onto C106 resin at a pH of 4. This effluent is rich in sinapine (70% of total phenolic components), and also contains sinapic acid (10%) and other sinapic acid derivatives (20%). The side constituents are low-molar weight oligosides, non-protein nitrogen molecules, and salts [10,15,16,17]. Table 4 shows the adsorption and desorption rates of sinapine and sinapic acids in two different scenarios. Sinapine adsorption was slightly less than that from standard solutions (80.64 ± 1.57% vs. 95.52 ± 0.44%). The other phenolic compounds adsorption rates were unexpectedly high (64.12 ± 7.05%) considering they are not positively charged. This result confirms the large possibility of hydrophobic interactions with the ion exchange resin. The 15% reduction in sinapine adsorption may be due to competition with other phenolic compounds like sinapic acid at the hydrophobic adsorption sites. In any case, the adsorption rate of sinapine was even better than what was found with neutral apolar resins. XAD16 showed a sinapine adsorption rate of only 43.8% from this effluent and XAD7HP had an adsorption rate of 61.5% [10].

Table 4.
Adsorption onto C106 resin and one- and two-step desorption of sinapine and sinapic acid from the SAD-rich rapeseed aqueous effluent.
High desorption of both sinapine (72.42 ± 1.19%) and sinapic acid (64.50 ± 1.54%) were observed using acidified ethanol, so weak cation exchange resin C106 can be considered particularly suitable for phenolic compound capture. However, as observed with classical apolar macroporous resins, the eluted phenolic fraction was not enriched in sinapine. Indeed, sinapine purity in the effluent and desorbed fraction were 70.08 ± 1.01% and 80.70 ± 2.12%, respectively.
The low selectivity of acid ethanol is due to its ability to desorb molecules associated with both hydrophobic and ionic interactions. Based on these results, a two-step elution process was proposed in order to increase the sinapine purity in the eluted fraction. The first one is a desorption step of compounds fixed exclusively by hydrophobic interactions (sinapic acid and other negatively charged or neutral phenolic compounds). An ethanol/water mixture will be used for this. The second is a specific desorption step of sinapine by acidified ethanol.
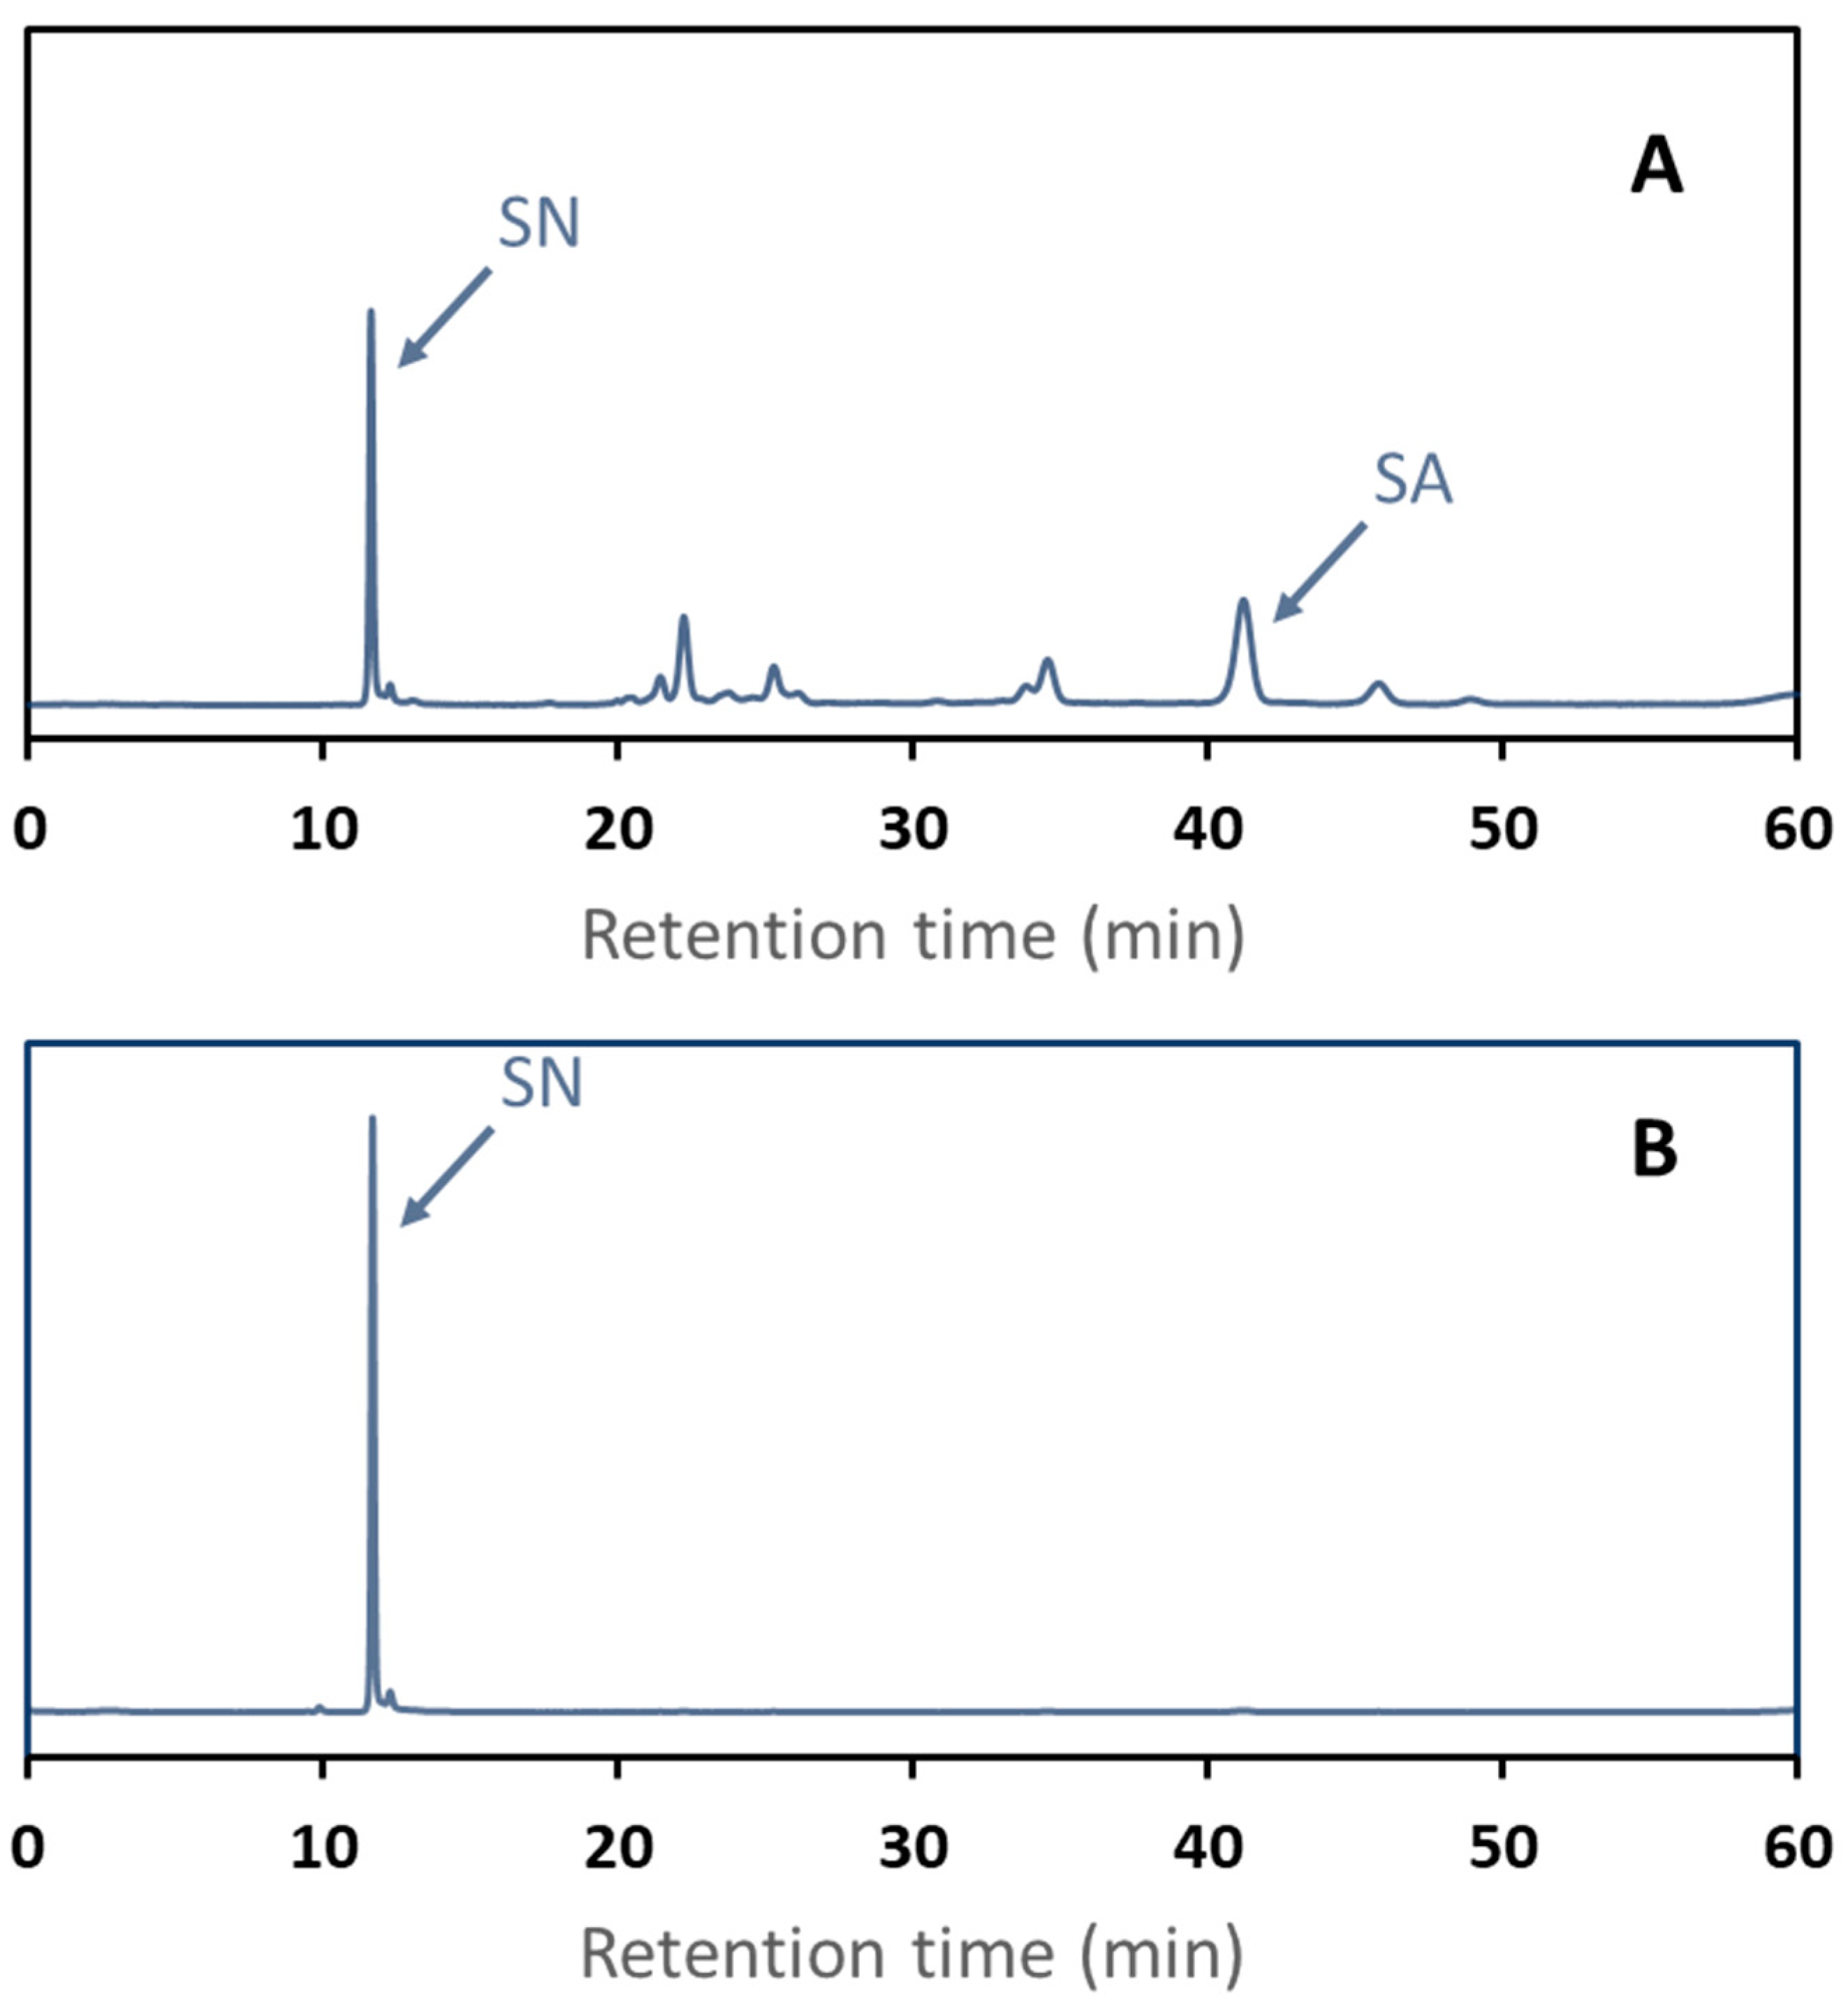
SE-HPLC chromatograms of the eluents are shown in Figure 8 to visualize the separation selectivity. The first-step fraction SE-HPLC chromatogram clearly shows sinapic acid (RT = 41 min) and large contamination by sinapic acid derivatives (RT ranging from 11 to 35 min). This fraction appeared to be slightly contaminated with sinapine (RT = 11 min). The second step fraction SE-HPLC chromatogram shows a single peak of sinapine.
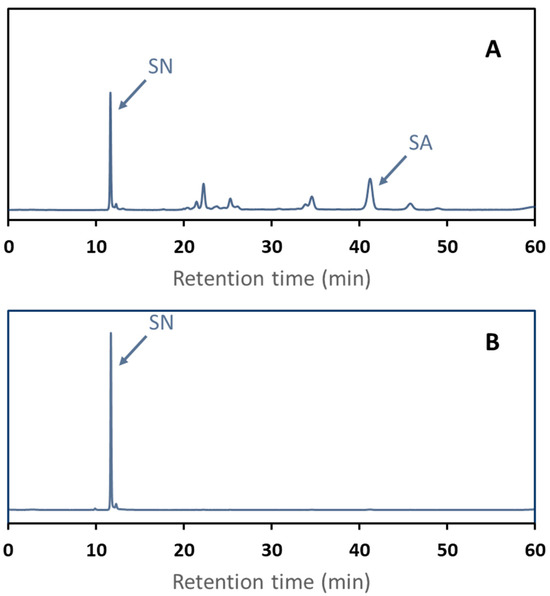
Figure 8.
SE-HPLC chromatograms at 325 nm of two-step elution fractions after adsorption of a rapeseed protein isolate effluent onto C106 resin. The first eluent was 50% v/v ethanol fraction (A). The second was acidified ethanol (B). Sinapine (SN) and sinapic acid (SA) retention times were determined based on mass spectrometry.
As expected, sinapine poorly desorbed from at the first elution step with 50% v/v ethanol (7.18 ± 0.22%), contrarily to sinapic acid (86.55 ± 1.11%). Interestingly, sinapic acid was desorbed to the same extent in 50% ethanol with or without HCl. So, as expected, neutral polyphenol desorption with ethanolic solution is independent of the resin charge. Acidified ethanol as a second eluent showed a high desorption rate for sinapine (63.31 ± 1.16%), while no sinapic acid was quantified in the fraction. Sinapine purity in this fraction was very high (> 98%). The sum of the sinapine desorption rate observed at the two-step desorption is in line with the desorption rate of the single step overall.
Hence, the two-step desorption clearly yielded an enriched fraction that improves the purity of the sinapine product. To the best of our knowledge, such purity levels of polyphenol compound have never been observed from the adsorption of a complex plant extract on macroporous resin
4. Conclusions
Weak cation exchange resins were assayed for sinapine adsorption as an alternative to classical apolar resins, because this kind of resin is efficient for Sinapine uptake but poorly selective. Our results show that sinapine adsorption kinetics and isotherms follow pseudo-second-order and Langmuir’s model, respectively, on this kind of resin. This means that sinapine adsorbtion forms a monolayer at the bead surface and the transport phenomenon is globally limited by the intraparticle diffusion phenomenon. The adsorption process is exothermic and spontaneous. Contrary to the apolar resins, the adsorption is mainly conducted at defined adsorption sites. Interestingly, we demonstrated that sinapine–resin interactions are either made solely by ionic bonds or by both ionic and hydrophobic bonds. So, sinapine desorption must be performed using acidified 50% ethanol (v/v). To our knowledge, such detailed results are reported here for the first time.
Sinapine adsorption on C106 weak cation exchange resin from an aqueous effluent from the production of a rapeseed protein isolate showed a higher adsorption rate than classical apolar resins. Sinapine was efficiently desorbed using acidified ethanol. However, although neutral or negatively charged, other polyphenols (sinapic acids and derivatives) also adsorbed onto cation exchange resins throughout the hydrophobic interactions. The eluted fraction was then poorly enriched in sinapine, as observed with apolar resins. A two-step elution using 50% ethanol v/v in water and acidified ethanol allowed us to obtain a highly purified sinapine fraction (98.85 ± 0.03%) at high recovery. The first fraction, particularly enriched in sinapic acid, could be used as an antioxidant. The second fraction might be used in a state of highly purified sinapine. The adsorption of sinapine from this kind of effluent on the column should be further studied for high value-added valorization of this kind of effluent.
Author Contributions
Conceptualization, F.Z.K. and R.K.; methodology, F.Z.K. and R.K.; software, F.Z.K. and R.K.; validation, R.K., J.-P.F. and A.R.; formal analysis, F.Z.K., R.K. and A.A.; investigation, F.Z.K.; resources, R.K.; data curation, F.Z.K., R.K., L.B. and A.A.; writing—original draft preparation, F.Z.K.; writing—review and editing, F.Z.K. and R.K.; visualization, F.Z.K. and R.K.; supervision, R.K. and J.-P.F.; project administration, R.K. and J.-P.F.; funding acquisition, R.K. and J.-P.F. All authors have read and agreed to the published version of the manuscript.
Funding
This work was supported by “Impact Biomolecules” project of the “Lorraine Université d’Excellence”, funded by the ANR “Investissements d’avenir” [grant number 15-004].
Data Availability Statement
The data presented in this study are available upon request from the corresponding author.
Acknowledgments
The authors gratefully acknowledge the AVRIL Company for providing the rapeseed meal used in this study. The authors are grateful to Sara Albe Slabi and Olivier Galet for their support of this project.
Conflicts of Interest
The authors declare no conflicts of interest.
Abbreviations
| C | Concentration (mg·L−1) |
| Ce | Concentration at equilibrium (mg·mL−1) |
| C0 | Concentration in the initial sample (mg·mL−1) |
| Cd | Concentration in desorption solution (mg·mL−1) |
| CSE | Conventional solvent extraction |
| ΔG° | Gibbs free energy (kJ·mol−1) |
| ΔH° | Enthalpy variation (kJ·mol−1) |
| ΔS° | Entropy variation (kJ·mol−1·K−1) |
| HPLC-SE | Size exclusion high performance liquid chromatography |
| K | Equilibrium constant (L·mol−1) |
| k1 | Constant rate of PFO (min−1) |
| k2 | Constant rate of PSO (g·mg−1·min−1) |
| KF | Freundlich constant (L·mg−1) |
| ki | Constant rate of intraparticle diffusion equation (mg·g−1·min−0.5) |
| KL | Langmuir constant (L·mg−1) |
| MF | Microfiltration |
| PFO | Pseudo first-order |
| PSO | Pseudo second-order |
| q | Adsorption capacity (mg·g−1) |
| qe | Adsorption capacity at equilibrium (mg·g−1) |
| qm | Maximum saturated monolayer adsorption capacity (mg·g−1) |
| R | Ideal gas constant (8.314 J·mol−1·K−1) |
| RL | Separation factor |
| SA | Sinapic acid |
| SAD | Sinapic acid derivative |
| SN | Sinapine |
| T | Temperature (K) |
| UF | Ultrafiltration |
| UV | Ultraviolet |
| Vd | Volume of the desorption solution (mL) |
| Vi | Sample volume (mL) |
| W | Resin dry weight (g) |
References
- Mouterde, L.M.M.; Peru, A.A.M.; Mention, M.M.; Brunissen, F.; Allais, F. Sustainable Straightforward Synthesis and Evaluation of the Antioxidant and Antimicrobial Activity of Sinapine and Analogues. J. Agric. Food Chem. 2020, 68, 6998–7004. [Google Scholar] [CrossRef]
- Li, X.; Han, L.; Li, Y.; Zhang, J.; Chen, J.; Lu, W.; Zhao, X.; Lai, Y.; Chen, D.; Wei, G. Protective Effect of Sinapine against Hydroxyl Radical-Induced Damage to Mesenchymal Stem Cells and Possible Mechanisms. Chem. Pharm. Bull. 2016, 64, 319–325. [Google Scholar] [CrossRef]
- Boulghobra, D.; Grillet, P.-E.; Laguerre, M.; Tenon, M.; Fauconnier, J.; Fança-Berthon, P.; Reboul, C.; Cazorla, O. Sinapine, but Not Sinapic Acid, Counteracts Mitochondrial Oxidative Stress in Cardiomyocytes. Redox Biol. 2020, 34, 101554. [Google Scholar] [CrossRef]
- Bulua, A.C.; Simon, A.; Maddipati, R.; Pelletier, M.; Park, H.; Kim, K.-Y.; Sack, M.N.; Kastner, D.L.; Siegel, R.M. Mitochondrial Reactive Oxygen Species Promote Production of Proinflammatory Cytokines and Are Elevated in TNFR1-Associated Periodic Syndrome (TRAPS). J. Exp. Med. 2011, 208, 519–533. [Google Scholar] [CrossRef]
- Chen, S.; Jin, Y.-T.; Zhu, Z.-Y.; Wu, L.-T.; Yang, P.; Jin, P.; Xuan, L.-H. In Vivo Study on Site of Action of Sinapine Thiocyanate Following Acupoint Herbal Patching. Evid.-Based Complement. Altern. Med. 2018, 2018, 9502902. [Google Scholar] [CrossRef]
- Li, Y.; Li, J.; Su, Q.; Liu, Y. Sinapine Reduces Non-Alcoholic Fatty Liver Disease in Mice by Modulating the Composition of the Gut Microbiota. Food Funct. 2019, 10, 3637–3649. [Google Scholar] [CrossRef]
- Šebestík, J.; Marques, S.M.; Falé, P.L.; Santos, S.; Arduíno, D.M.; Cardoso, S.M.; Oliveira, C.R.; Serralheiro, M.L.M.; Santos, M.A. Bifunctional Phenolic-Choline Conjugates as Anti-Oxidants and Acetylcholinesterase Inhibitors. J. Enzym. Inhib. Med. Chem. 2011, 26, 485–497. [Google Scholar] [CrossRef]
- Knott, V.; De La Salle, S.; Choueiry, J.; Impey, D.; Smith, D.; Smith, M.; Beaudry, E.; Saghir, S.; Ilivitsky, V.; Labelle, A. Neurocognitive Effects of Acute Choline Supplementation in Low, Medium and High Performer Healthy Volunteers. Pharmacol. Biochem. Behav. 2015, 131, 119–129. [Google Scholar] [CrossRef] [PubMed]
- Pandi, A.; Kalappan, V.M. Pharmacological and Therapeutic Applications of Sinapic Acid—An Updated Review. Mol. Biol. Rep. 2021, 48, 3733–3745. [Google Scholar] [CrossRef] [PubMed]
- Le, T.T.; Framboisier, X.; Aymes, A.; Ropars, A.; Frippiat, J.-P.; Kapel, R. Identification and Capture of Phenolic Compounds from a Rapeseed Meal Protein Isolate Production Process By-Product by Macroporous Resin and Valorization Their Antioxidant Properties. Molecules 2021, 26, 5853. [Google Scholar] [CrossRef]
- Reungoat, V.; Allais, F.; Ducatel, H.; Ioannou, I. Extraction and Purification Processes of Sinapic Acid Derivatives from Rapeseed and Mustard Seed By-Products. Sep. Purif. Rev. 2022, 51, 521–544. [Google Scholar] [CrossRef]
- Gallorini, R.; Aquilia, S.; Bello, C.; Ciardelli, F.; Pinna, M.; Papini, A.M.; Rosi, L. Pyrolysis of Spent Rapeseed Meal: A Circular Economy Example for Waste Valorization. J. Anal. Appl. Pyrolysis 2023, 174, 106138. [Google Scholar] [CrossRef]
- Production, Supply and Distribution (PS&D) Online database, Foreign Agricultural Service (FAS) of United States Department of Agriculture (USDA). 2023. Available online: https://apps.fas.usda.gov/psdonline/app/index.html#/app/downloads (accessed on 1 November 2024).
- Ivanova, P.; Kalaydzhiev, H.; Rustad, T.; Silva, C.; Chalova, V. Comparative Biochemical Profile of Protein-Rich Products Obtained from Industrial Rapeseed Meal. Emir. J. Food Agric. 2017, 29, 170. [Google Scholar] [CrossRef]
- Albe-Slabi, S.; Defaix, C.; Beaubier, S.; Galet, O.; Kapel, R. Selective Extraction of Napins: Process Optimization and Impact on Structural and Functional Properties. Food Hydrocoll. 2022, 122, 107105. [Google Scholar] [CrossRef]
- Defaix, C.; Kapel, R.; Galet, O. Protein Isolate and Process for the Production Thereof. US020200397018A120201224. Available online: https://storage.googleapis.com (accessed on 1 November 2024).
- Beaubier, S.; Defaix, C.; Albe-Slabi, S.; Aymes, A.; Galet, O.; Fournier, F.; Kapel, R. Multiobjective Decision Making Strategy for Selective Albumin Extraction from a Rapeseed Cold-Pressed Meal Based on Rough Set Approach. Food Bioprod. Process. 2022, 133, 34–44. [Google Scholar] [CrossRef]
- Gao, Z.P.; Yu, Z.F.; Yue, T.L.; Quek, S.Y. Adsorption Isotherm, Thermodynamics and Kinetics Studies of Polyphenols Separation from Kiwifruit Juice Using Adsorbent Resin. J. Food Eng. 2013, 116, 195–201. [Google Scholar] [CrossRef]
- Campone, L.; Celano, R.; Rizzo, S.; Piccinelli, A.L.; Rastrelli, L.; Russo, M. Development of an Enriched Polyphenol (Natural Antioxidant) Extract from Orange Juice (Citrus sinensis) by Adsorption on Macroporous Resins. J. Food Qual. 2020, 2020, 1251957. [Google Scholar] [CrossRef]
- Monsanto, M.; Mestrom, R.; Zondervan, E.; Bongers, P.; Meuldijk, J. Solvent Swing Adsorption for the Recovery of Polyphenols from Black Tea. Ind. Eng. Chem. Res. 2015, 54, 434–442. [Google Scholar] [CrossRef]
- Liu, Y.; Bai, Q.; Liu, Y.; Di, D.; Guo, M.; Zhao, L.; Li, J. Simultaneous Purification of Tea Polyphenols and Caffeine from Discarded Green Tea by Macroporous Adsorption Resins. Eur. Food Res. Technol. 2014, 238, 59–69. [Google Scholar] [CrossRef]
- Weisz, G.M.; Schneider, L.; Schweiggert, U.; Kammerer, D.R.; Carle, R. Sustainable Sunflower Processing—I. Development of a Process for the Adsorptive Decolorization of Sunflower [Helianthus annuus L.] Protein Extracts. Innov. Food Sci. Emerg. Technol. 2010, 11, 733–741. [Google Scholar] [CrossRef]
- Tran, T.; Bui, X.; Loan, N.; Anh, N.; Le, T.; Truong, T. Adsorption and Desorption Characteristics and Purification of Isoflavones from Crude Soybean Extract Using Macroporous Resins. Pol. J. Food Nutr. Sci. 2022, 183–192. [Google Scholar] [CrossRef]
- Moreno-González, M.; Girish, V.; Keulen, D.; Wijngaard, H.; Lauteslager, X.; Ferreira, G.; Ottens, M. Recovery of Sinapic Acid from Canola/Rapeseed Meal Extracts by Adsorption. Food Bioprod. Process. 2020, 120, 69–79. [Google Scholar] [CrossRef]
- Datta, C.; Dutta, A.; Dutta, D.; Chaudhuri, S. Adsorption of Polyphenols from Ginger Rhizomes on an Anion Exchange Resin Amberlite IR-400—Study on Effect of pH and Temperature. Procedia Food Sci. 2011, 1, 893–899. [Google Scholar] [CrossRef]
- Jiao, X.; Li, B.; Zhang, X.; Zhang, Q.; Gao, N.; Meng, X. Optimisation of Enrichement and Purification of Polyphenols from Blueberries (Vaccinium SPP) by Macroporous Resins XAD-7HP. Emir. J. Food Agric. 2017, 29, 581. [Google Scholar] [CrossRef]
- Liu, Q.; Gao, Y. Binary Adsorption Isotherm and Kinetics on Debittering Process of Ponkan (Citrus reticulata Blanco) Juice with Macroporous Resins. LWT—Food Sci. Technol. 2015, 63, 1245–1253. [Google Scholar] [CrossRef]
- Park, J.J.; Lee, W.Y. Adsorption and Desorption Characteristics of a Phenolic Compound from Ecklonia cava on Macroporous Resin. Food Chem. 2021, 338, 128150. [Google Scholar] [CrossRef]
- Frascari, D.; Rubertelli, G.; Arous, F.; Ragini, A.; Bresciani, L.; Arzu, A.; Pinelli, D. Valorisation of Olive Mill Wastewater by Phenolic Compounds Adsorption: Development and Application of a Procedure for Adsorbent Selection. Chem. Eng. J. 2019, 360, 124–138. [Google Scholar] [CrossRef]
- Abdullah, M.A.; Chiang, L.; Nadeem, M. Comparative Evaluation of Adsorption Kinetics and Isotherms of a Natural Product Removal by Amberlite Polymeric Adsorbents. Chem. Eng. J. 2009, 146, 370–376. [Google Scholar] [CrossRef]
- Gavach, M. Détoxification de Condensats de Distillerie par Osmose Inverse, Échange D’ions et Leur Combinaison. Application au Recyclage en Fermentation Alcoolique. Ph.D. Thesis, AgroParisTech, Massy, France, 2010. [Google Scholar]
- William Kajjumba, G.; Emik, S.; Öngen, A.; Kurtulus Özcan, H.; Aydın, S. Modelling of Adsorption Kinetic Processes—Errors, Theory and Application. In Advanced Sorption Process Applications; Edebali, S., Ed.; IntechOpen: Rijeka, Croatia, 2019. [Google Scholar] [CrossRef]
- Firdaous, L.; Fertin, B.; Khelissa, O.; Dhainaut, M.; Nedjar, N.; Chataigné, G.; Ouhoud, L.; Lutin, F.; Dhulster, P. Adsorptive Removal of Polyphenols from an Alfalfa White Proteins Concentrate: Adsorbent Screening, Adsorption Kinetics and Equilibrium Study. Sep. Purif. Technol. 2017, 178, 29–39. [Google Scholar] [CrossRef]
- Wang, Z.; Peng, S.; Peng, M.; She, Z.; Yang, Q.; Huang, T. Adsorption and Desorption Characteristics of Polyphenols from Eucommia ulmoides Oliv. Leaves with Macroporous Resin and Its Inhibitory Effect on α-Amylase and α-Glucosidase. Ann. Transl. Med. 2020, 8, 1004. [Google Scholar] [CrossRef]
- Slabi, S.; Mathé, C.; Framboisier, X.; Defaix, C.; Mesieres, O.; Galet, O.; Kapel, R. A New SE-HPLC Method for Simultaneous Quantification of Proteins and Main Phenolic Compounds from Sunflower Meal Aqueous Extracts. Anal. Bioanal. Chem. 2019, 411, 2089–2099. [Google Scholar] [CrossRef] [PubMed]
- Siger, A.; Czubinski, J.; Dwiecki, K.; Kachlicki, P.; Nogala-Kalucka, M. Identification and Antioxidant Activity of Sinapic Acid Derivatives in Brassica napus L. Seed Meal Extracts. Eur. J. Lipid Sci. Technol. 2013, 115, 1130–1138. [Google Scholar] [CrossRef]
- Jurado-Davila, V.; Oshiro, G.P.; Estumano, D.C.; Féris, L.A. Immobilization of Marbofloxacin for Water Treatment by Adsorption in Batch Scale and Fixed-Bed Column: Applying of Monte Carlo Bayesian Modeling. Ind. Eng. Chem. Res. 2024, 63, 9976–9987. [Google Scholar] [CrossRef]
- Jurado-Davila, V.; Reolon, L.S.; Nunes, K.G.P.; Cardoso Estumano, D.; Féris, L.A. Classical and Bayesian Computational Statistics Applied to Acetylsalicylic Acid Mitigation in Aqueous Solutions: Study of Batch Scale, Kinetic Modeling, and Fixed-Bed Column Adsorption. Ind. Eng. Chem. Res. 2024, 63, 9943–9954. [Google Scholar] [CrossRef]
- De Oliveira, J.T.; Nunes, K.G.P.; Cardoso Estumano, D.; Féris, L.A. Applying the Bayesian Technique, Statistical Analysis, and the Maximum Adsorption Capacity in a Deterministic Way for Caffeine Removal by Adsorption: Kinetic and Isotherm Modeling. Ind. Eng. Chem. Res. 2024, 63, 1530–1545. [Google Scholar] [CrossRef]
- Thiel, A.; Muffler, K.; Tippkötter, N.; Suck, K.; Sohling, U.; Hruschka, S.M.; Ulber, R. A Novel Integrated Downstream Processing Approach to Recover Sinapic Acid, Phytic Acid and Proteins from Rapeseed Meal: A Novel Downstream Processing Approach for Rapeseed Meal. J. Chem. Technol. Biotechnol. 2015, 90, 1999–2006. [Google Scholar] [CrossRef]
- Thiel, A.; Tippkötter, N.; Suck, K.; Sohling, U.; Ruf, F.; Ulber, R. New Zeolite Adsorbents for Downstream Processing of Polyphenols from Renewable Resources. Eng. Life Sci. 2013, 13, 239–246. [Google Scholar] [CrossRef]
- Kessoum, M.; Caqueret, V.; Chedeville, O.; Cagnon, B.; Bostyn, S.; Porte, C. Etude de la cinétique et de la thermodynamique d’adsorption de composés phénoliques en monosolutés et en mélange sur charbon actif. In Recent Progress in Chemical Engineering, Proceedings of the 12th Congress of French Chemical Engineering Society, Marseille, France, 14 October 2009; ResearchGate: Berlin, Germany, 2009. [Google Scholar]
- Li, X.; Zhou, X.; Mu, J.; Lu, L.; Han, D.; Lu, C.; Wang, M. Thermodynamics and Kinetics of p-Aminophenol Adsorption on Poly(Aryl Ether Ketone) Containing Pendant Carboxyl Groups. J. Chem. Eng. Data 2011, 56, 4274–4277. [Google Scholar] [CrossRef]
Disclaimer/Publisher’s Note: The statements, opinions and data contained in all publications are solely those of the individual author(s) and contributor(s) and not of MDPI and/or the editor(s). MDPI and/or the editor(s) disclaim responsibility for any injury to people or property resulting from any ideas, methods, instructions or products referred to in the content. |
© 2025 by the authors. Licensee MDPI, Basel, Switzerland. This article is an open access article distributed under the terms and conditions of the Creative Commons Attribution (CC BY) license (https://creativecommons.org/licenses/by/4.0/).


