Abstract
Dracocephalum heterophyllum Benth is well-known for its ability to alleviate liver heat. In this study, Dracocephalum heterophyllum Benth ethyl acetate extracts were evaluated on mouse models of nonalcoholic steatohepatitis and liver fibrosis. After 6 and 8 weeks of treatment, serum parameters and gene expressions in tissue samples, as well as stained tissue sections, demonstrated that the ethyl acetate extracts were effective in treating these liver diseases. The principal bioactive constituent (rosmarinic acid) was identified and screened by high pressure liquid chromatography-1,1-diphenyl-2-picrylhydrazyl and affinity ultrafiltration-HPLC. The rosmarinic acid was separated from extracts with high purity by medium- and high-pressure liquid chromatography. Finally, the interactions between rosmarinic acid and the key targets of lipid metabolism, oxidative stress and inflammation were verified by molecular docking. Thereby, an indirect regulation of lipid and cholesterol metabolism and inhibition of liver inflammation and liver fibrosis by the studied extract has been observed. This study demonstrated that Dracocephalum heterophyllum Benth ethyl acetate extracts have the potential to treat nonalcoholic steatohepatitis and liver fibrosis, revealing their multi-target and multi-pathway therapeutic characteristics.
1. Introduction
Nonalcoholic steatohepatitis (NASH) has been established as a chronic progressive nonalcoholic fatty liver disease (NAFLD) [1]. NASH occurs when the metabolism of fatty acids and the export of lipids are impaired [2,3,4]. The pathological mechanism of NASH is insufficiently explored, and there is no established treatment available for it. NASH-related clinical drugs result in the reduction of hepatocyte steatosis and the activation of hepatic stellate cells, which then inhibit the extracellular matrix synthesis [5,6]. Both inflammation and oxidative stress, as pivotal initiating and promoting factors for NASH and liver fibrosis, can certainly be selected as significant targets for the treatment [7,8], as metabolites produced by organisms through the evolutionary process of the survival of the fittest, natural products (NPs) have long been an indispensable resource for the development of new therapies [9,10,11,12,13].
Dracocephalum heterophyllum Benth (D. heterophyllum) is a traditional Tibetan medicine commonly used in ethnic areas. Its Tibetan name is “Jizi Qingbao”. Jizi Qingbao represents the dry aerial part of the labiatae plant Dracocephalum heterophyllum Benth. In the Tibetan medicine system, it has a wide therapeutic application in the treatment of jaundice hepatitis, mouth ulcers, and other diseases [14,15]. According to findings in Jingzhu Materia Medica, this plant was reported to treat oral and dental diseases. Stappen et al. reported other pharmacological effects of D. heterophyllum such as anti-hypertension, cardiovascular protection and antiviral [16]. However, its effect on NASH and liver fibrosis is remaining elusive. Therefore, elucidating further mechanisms underlying its hepatoprotective activity remains a goal for future studies.
The traditional techniques for the isolation and purification of plant-derived compounds, namely column chromatography, in which gels (including sephadex, sepharose) and silica gel are used, are not suitable for the separation of high-purity standards. The key reason for the limitation of these techniques is that different compounds have different molecular weights or different capacities for adsorbing on silica gel [17]. On-line HPLC-1,1-diphenyl-2-picrylhydrazyl (HPLC-DPPH) is a technique for the current investigation and assessment of the antioxidant activity of separate components in multi-complex medicinal herbs. DPPH is a stable radical that can chemically interact with the reactive hydrogen of antioxidant substances and change their chemical structure [18]. The affinity ultrafiltration-HPLC coupling method uses an ultrafiltration technique to separate ligand-target complexes in the solution [19].
Molecular docking is an effective method enabling the study of the interactions between molecules, especially biomolecular complexes, which offer great insights in terms of binding conformation, site, and force of ligands and receptors [20]. With the fast progress of investigating computer simulation technology, the molecular docking technique has turned into an effective means for the interaction between proteins and small molecules. Molecular docking is composed of the following three components: identification of binding sites, an algorithm of conformational search, and a scoring function [21,22]. This gives molecular docking a tremendous value in terms of enhancing the effectiveness of virtual screening and minimizing the cost of drug development.
In the current study, acetyl acetate extracts of D. heterophyllum were prepared. Next, the methionine-choline deficient (MCD)-induced mouse NASH and CCl4-induced liver fibrosis models were established to test the bioactivity of D. heterophyllum-derived acetyl acetate extracts on them. According to the obtained results, these extracts significantly improved liver function. Considering the importance of oxidative stress and inflammatory response in the development of NASH and liver fibrosis, DPPH and cyclooxygenase-2 (COX-2) were used as activity-directed compounds to rapidly determine the key constituents in the ethyl acetate extract of D. heterophyllum. Interestingly, the main component was found to be the functional component by HPLC-DPPH and the affinity ultrafiltration-HPLC screening. Subsequently, the main component was successfully isolated with >99% purity. We also managed to predict the key targets of rosmarinic acid against NASH and liver fibrosis by employing molecular docking. The combined analysis demonstrated that the enrichment of the main functional component of D. heterophyllum was achieved rapidly and efficiently by combining traditional extraction and medium- and high-pressure liquid chromatography. The findings of this study provide a framework for future quality control investigations and the expansion of D. heterophyllum’s usefulness.
2. Materials and Methods
2.1. Apparatus and Reagents
Two prep-HPLC pumps from the NP7000 series, an NU3000 detector that detects in the UV-Vis range, and a manual 5 mL injector, were the main parts of the preparative MPC workstation (Hanbon Science & Technology Co., Ltd., Jiangsu, China) that were used for this study. A degasser DGU-20A3R was utilized for the removal of gas in the samples, after which the Shimadzu Essentia LC-16A instrument enabled the performance of the HPLC analysis, which was supplied with an additional two tools such as a column thermostat and autosampler. ESI-MS spectra were obtained on the Agilent 6500 series Q-TOF mass spectrometer. Using deuterated methanol as a solvent, the 1H and 13C nuclear magnetic resonance (NMR) spectroscopic data were recorded on the Bruker Avance NMR spectrometer at 600 MHz. Multimode Microplate Reader was purchased from Molecular Devices (Shanghai, China), while the BioMajesty® JCA-BM6010/C was supplied by the Sysmex (Wuxi, China). An automated quantitative pathology imaging system was purchased from PerkinElmer (Shanghai, China). Furthermore, the fluorescence quantitative PCR instrument was supplied by the Agilent Technologies (Palo Alto, CA, USA).
The MCD diet was provided by Research Diets (New Brunswick, NJ, USA). Concerning carbon tetrachloride (CCl4), carboxymethylcellulose sodium (CMC-Na) and olive oil were obtained from the manufacturer Sinopharm Chemical Reagent Co., Ltd., Shanghai, China. RNAiso plus and PrimScriptTM RT Master Mix were obtained from the Takara Biomedical Technology, Co., Ltd. (Beijing, China). The dye synergy brand Green was purchased from Vazyme Medical Technology (Nanjing, China). Moreover, the aspartate aminotransferase (AST) test reagent R2 and alanine aminotransferase (ALT) w test reagent R1 were purchased from Sysmex (Wuxi, China). Shanghai FosunLong March Medical Science Co., Ltd. (Shanghai, China) provided the cholesterol and triglyceride total test regent kits. The Biotechnology company Shanghai Kehua bio-engineering (Shanghai, China) provided the total bile acid (TBA) and hydroxyproline (HYP) test regent kits. The separation material series MCI GEL® CHP20P (120 μm) was bought from a company named Mitsubishi Chemical Corporation (Tokyo, Japan). 7-X10 analytical and preparation columns were obtained from ACCHROM (Beijing, China). SunFire column was from Waters Corporation (Milford, MA, USA). Preparative and high-grade MeOH, EtOH, and ethyl acetate were from China KELON (Chengdu, China). Cyclooxygenase 2 was from Sigma-Aldrich (St. Louis, MO, USA) and PBS from Solarbio Science & Technology Co. Ltd. (Beijing, China). The ultrafiltration membranes (YM-30, 30 kDa) were from Millipore Co. Ltd. (Burlington, MA, USA). Moreover, the DPPH was purchased from Sigma–Aldrich (Steinheim, Germany). Moore Water Purifier was applied for ultra-pure HPLC water (Chongqing, China).
2.2. Sample Preparation
D. heterophyllum plants were collected from the North Mountain in Huzhu, Qinghai (2488 m, 36°50′15″ N, 101°57′06″ E) and were identified as D. heterophyllum by Prof. Lijuan Mei, Northwest Plateau Institute of Biology, Chinese Academy of Sciences. The sample (nwipb-2016-10-10) was preserved at the Tibetan Medicine Research Lab, Northwest Plateau Institute of Biology, Chinese Academy of Sciences.
The plant samples were air-dried and ground (8.6 kg) in a cool place. The extraction was followed with 95% of ethanol three times (3 h/each, material-liquid ratio: 1:5). The filtrates were combined, evaporated, and concentrated under reduced pressure to obtain 1026.00 g of ethanol crude extract (yield 11.93%), then diluted with a small amount of water (about 500 mL). Triple extractions for 2 h each with an equivalent volume of ethyl acetate were conducted, followed by drying to obtain the ethyl acetate extraction (132 g, yield 1.53%). The extract activity was evaluated on 32 g of the extracts. The remaining 100 g was mixed in methanol-water (1:1 v/v) and 170 g of silica gel (270 g in total) for subsequent isolation and purification.
2.3. Design and Treatment of Animal Experiments
Animal experimentations were permitted by the Animal Care and Use Committee affiliated with the Shanghai Institute of Materia Medica with approval number 2017-10-LJ-53 and 2018-11-LJ-66. Animal experiments were performed following the National Institutes of Health Guide for the Care and Use of Laboratory Animals (NIH Publication No. 85-23, revised in 1985). C57BL/6J males (Shanghai Lingchang Biotechnology Unit) were bred under controlled conditions, on a balanced diet for one week at a room temperature of 22 ± 2 °C, with normal circadian rhythm (12/12 h light/dark cycles), water use, and access to adequate food guaranteed.
2.3.1. Mouse MCD-Induced NASH Models
A standard diet or MCD (21% fat, 63% carbohydrate, and 16% protein, Research Diets Inc, A02082002BR) was fed to mice (10 weeks old). After 2 weeks, the animals were distributed into 5 groups (10 mice each): control (standard regime), vehicle (MCD diet and supplemented with the vehicle), and D. heterophyllum (DH) treatment group (MCD diet plus 240 mg/kg DH). Blood samples were collected from these animals after 2 or 4 weeks of treatment followed by a precise dissection and the weight of the levers. A portion of liver tissues was immediately frozen in liquid nitrogen and stored at −80 °C. Another part was preserved in 4% paraformaldehyde for further analysis.
2.3.2. Mouse CCl4-Induced Liver Fibrosis Models
Mice at 8 weeks of age were intraperitoneally administrated 3 times/weekly with 10% CCl4 (dissolved in olive oil, 2 mL/kg body weight) to cause liver fibrosis. Two weeks later these CCl4-treated mice were divided into four groups of 10 mice each: the vehicle group (CCl4 plus vehicle for 6 weeks), and the DH treatment (MCD diet and supplementation with 200 mg/kg, 400 mg/kg DH). The mice (n = 10) in the control cohort were treated with olive oil only. Blood samples were gathered 3- or 6-weeks post-treatment. Livers were precisely separated, pondered, frozen in liquid nitrogen, and stowed at −80 °C. Some of the biopsies were partly fixed in 4% paraformaldehyde for further analysis.
2.3.3. Testing Indicators and Methods
Basic Indicators
Body weight and wet liver weight were acquired by weighing them before and after sampling. The liver index was calculated following the formula: liver wet weight (g)/body weight (g) × 100%.
Biochemical Analysis
The Sysmex JCA-BM6010C measured the blood serum concentration of ALT, AST, triglycerides (TG), total cholesterol (TC) and TBA. Liver TG, TC, and Hyp concentrations were evaluated by a Folch withdrawal. The dehydrated lipid remainders were mixed in 800 μL of EtOH with 1% Triton X-100. The TG, TC, TBA, and Hyp contents were assayed under the instructions of the kits.
Quantitative Real-Time PCR
The total RNA was extracted from the livers by the TRIzol method (Invitrogen, Waltham, MA, USA). RNA samples were then reverse-transcribed using the PrimeScript Reverse Transcriptase kit (Takara). The cDNA amplification was carried out by 2 × SYBR Green qPCR Master Mix (Vazyme) and at a Stratagene Mx3005P PCR (Agilent Technologies). The housekeeping GAPDH gene is an internal standard. PCR primer pairs are shown in Table 1.

Table 1.
Primer sequence for mice.
Histological Analysis
Liver biopsies were paraffinized and were preserved in 4% paraformaldehyde for two days and fixed in paraffin. Hematoxylin-eosin (H&E)-staining and Sirius red dying followed. H&E-stained paraffin samples were quantified for the NAFLD activity score (NAS). Data quantitation was conducted with the PerkinElmer software (Version, Shanghai, China).
2.4. DPPH Inhibitor Recognition and Screening of Anti-Inflammatory Active Component
DPPH inhibitors in the studied plant extracts of D. heterophyllum were evaluated with an online HPLC-DPPH technique. The technique was conducted on an analytical 7-X10 (4.6 × 250 mm, 5 µm) chromatographic column. MeOH (mobile phase B) was prepared in 0.1% v/v aqueous formic acid (HCOOH, mobile phase A) and was linearly increased from 0% B to 100% B by a gradient elution for 60 min. The eluate speed was 1.0 mL/min at an injection volume of 2 μL. DPPH (50 μg/mL) was applied in EtOH at a flow speed of 0.8 mL/min for post-column derivatization. The absorbance at 517 nm was observed.
Affinity ultrafiltration-HPLC-based evaluation of D. heterophyllum ethyl acetate extracts for potential anti-inflammatory active components was conducted by weighing 10.00 mg of D. heterophyllum ethyl acetate extracts, which were then dissolved in PBS (1 mL, pH 7.2). The sample solution (120 μL) was mixed with 200 μL COX-2 (2 U) in an incubator shaker for 30 min at 37 °C. The mixture was centrifuged at 12,000 rpm for 10 min and resuspended three times with PBS (200 μL). The filtrate was gathered to eliminate unbound ligands. The COX-2-linked ligand was unconstrained from the composite after mixing with MeOH (200 uL, 90%, v/v) for 10 min at room temperature and centrifuged at the same conditions described above. This step was performed in triplicate and the remains were gathered. It was desiccated by low temperature and dissolved in high-grade MeOH (50 μL). HPLC analyses followed. In the negative control samples, the enzyme was deactivated at 95 °C for 10 min, and the operation steps were the same as above. The relative binding affinity (RBA) was calculated following the formula:
where A1 is the peak area of the sample with the activated enzyme and A2 is the peak area of the sample with the inactivated enzyme.
RBA = A1/A2
Compounds with an RBA > 1.5 were taken as compounds’ possible ligands for the enzyme.
2.5. Medium- and High-Pressure Liquid Chromatography Separation of the Main Functional Component from the Ethyl Acetate Extraction
The dried plant mixture (90.00 g) was mounted onto a small medium-pressure chromatography pylon (49 × 100 mm) and prepared in series with a medium-pressure chromatography column (49 × 460 mm) containing 1.2 L MCI GEL CHP20P stationary phase for dry sample charging. The elution was carried out with a MeOH/water system for 320 min. Isocratic elution with 0% MeOH was performed from 0 to 35 min, followed by gradient elution with increasing percentages of MeOH from 0 to 100% from 35 to 195 min, and finally with an isocratic elution of 100% MeOH for 125 min. A constant flow rate of 57.0 mL/min was applied. Next, the elution was observed by monitoring the absorbance at 210 nm. The process was conducted in triplicates at room temperature and finally, the mixture was concentrated and dried to yield a total of 5 fractions.
Furthermore, HPLC analysis demonstrated that the major functional component of the ethyl acetate extraction of D. heterophyllum was present in Fr3 (7.06 g with 7.06% recovery). For further preparative purification, the sample was mixed with MeOH/water solution and sieved through organic filter membranes (0.45 μm). Chromatographic conditions for HPLC have been described above in Section 2.5.
2.6. Purity and Activity Analysis of the Isolated Main Functional Component in the Studied Extracts
The purity and activity of the isolated compound were analyzed using a SunFire C18 (4.6 × 250 mm, 5 μm) analytical column. The mobile phases A and B were 0.1% v/v formic acid in water and MeOH. The linear gradient elution phase was 0–30 min at 10–90% B. The chromatogram was evaluated at 210 nm at a flow speed of 1.0 mL/min. The temperature of the column oven was 30 °C.
2.7. Molecular Docking Validation Analysis
To further valuate the effect of ethyl acetate extraction of D. heterophyllum on NASH and liver fibrosis, a molecular docking study was carried out on rosmarinic acid and 13 significant target protein molecules. These 13 3D structures of proteins were obtained from the Protein Data Bank (https://www.rcsb.org/, (assessed on 28 July 2022)) Their PDB IDs were 1UHL (liver x receptor (LXR)), 2JED (protein kinase C (PKC)), 1OT7 (farnesoid x receptor (FXR)), 1A9U (mitogen-activated protein kinase (MAPK)), 5CGJ (nuclear factor E2-related factor 2 (Nrf2)), 4I7B (kelch-like ECH-associated protein 1 (Keap1)), 1N3U (heme oxygenase-1 (HO-1)), 2GH5 (glutathione peroxidase (GSH-Px)), 4HJ2 (glutathione S-transferase (GST)), 5IKQ (COX-2), 3RZF (nuclear factor kappa-B (NF-κB)), 6CCY (protein kinase B (AKT) and 2CDU (nicotinamide adenine dinucleotide phosphate oxidase 2 (NOX2)). Chem3D version 16.0 was used to convert the 2D structure of the primary component rosmarinic acid into a 3D structure, and its low-energy stable conformation was produced using the semi-empirical AM1 method with geometric optimization and default parameters. The receptor protein was then optimized using PyMOL software (2.3.0, DeLano Scientific LLC, Sahnghai, China) for correlation, removing water molecules, hydrogen addition, force fields, and charges. Finding and defining the protein active site followed. As a final point, the compound and protein molecule formats are adapted to the “pdbqt” format by AutoDock. After docking, 100 docking conformations were generated and the best scored one was selected as the docking result for analysis. A docking binding energy < −5 kcal/mol indicates that the compound has some binding activity to the target protein, while a docking binding energy < −7 kcal/mol shows a good binding activity to the target protein. Molecular docking conformations were visualized and analyzed by Pymol and Discovery Studio programs.
2.8. Statistical Data Evaluation
The results are presented as the mean ± standard deviation. The unpaired Student’s t-tests evaluated the differences between the two groups, while one-way ANOVA verified them among numerous assemblies. SPSS software (Version 20.0, SPSS, Chicago, IL, USA) was applied for the statistical data evaluations where * p < 0.05, ** p < 0.01, # p < 0.05, and ## p < 0.01 were accepted as statistically substantial.
3. Results and Discussion
3.1. Evaluation of the Therapeutic Effect of NASH and Liver Fibrosis
Hepatic fibrosis is represented by the abnormal proliferation of intrahepatic connective tissue during the repair process of chronic liver injuries [23]. In this study, used mouse models of NASH and liver fibrosis were established and treated with D. heterophyllum plant extracts. Their bioactivities were evaluated by measuring the animals’ basal and biochemical indices such as body weight, liver wet weight, serum levels of ALT, AST, TG, TC, and TBA, liver TG, TC, and Hyp content, as well as the gene expression of α-SMA, col1α1, MCP-1, and CD68. Herein, these indicators were selected for NAHS and liver fibrosis, as data demonstrate that these pathologies are described by a discrepancy in the generation and degradation of the extracellular matrix (ECM), which leads to the excessive deposition of collagen type Ⅰ alpha 1 (col1α1)-dominated ECM, and ultimately leads to the weakening of liver function [24,25]. The α-smooth muscle actin (α-SMA) is an indicator of hepatic stellate cell (HSC) stimulation. It is upregulated with the aggravation of organ fibrosis in the liver and other types of fibrosis [26]. The disruption of the released pro-inflammatory factors and tissue repair capacity caused by the macrophage hyperpolarization in immune regulation is an important factor correlated with liver fibrosis [23,27]. M1-type macrophages mainly mediate pro-inflammatory effects and secrete large amounts of TNF-α, which promotes the progression of liver fibrosis. The monocyte chemotactic protein 1 (MCP-1) is a cytokine from the CC chemokine family and represents an important pro-inflammatory cytokine with the specific chemotactic activation of macrophages [28,29]. CD68 is a cytoplasmic glycoprotein that can be used to assess the degree of the polarization of macrophages that are type M1 [30,31].
3.1.1. Effects of D. Heterophyllum Plant Extracts on Mouse MCD-Induced NASH Model
Liver injury in the mouse models was assessed by measuring the liver index and the blood serum concentrations of ALT and AST. The obtained results have been shown in Figure 1A,B. It has been revealed that in the MCD model group (Vehicle), the body weight of mice decreased continuously in comparison to the normal control group, however, no significant variations in this indicator were observed in the subject (DH 240 mg/kg) compared with the vehicle. In the MCD model group, the mice had a decreased liver index, while there were no important variations in the subject group. As revealed in Figure 1C,D, the blood plasma levels of ALT and AST in the vehicle animal cohorts were significantly increased. Our results further demonstrated that DH (240 mg/kg) groups were significantly reduced after 4 weeks of administration.

Figure 1.
Investigation of the blood plasma concentrations of ALT and AST in NASH mouse model after supplementation of mice with ethyl acetate extraction of D. heterophyllum. Body weight (A), liver index (B), plasma levels of ALT (C) and AST (D). Pre: preparation; 2 d–28 d: 2 days–28 days; 2W: 2 weeks, 4W: 4 weeks. DH 240 mg/kg: 240 mg/kg ethyl acetate extract. Values are presented as the mean ± SD (n = 10). ** p < 0.01 vs. the control group; # p < 0.05, ## p < 0.01 vs. the vehicle group.
Liver biopsies from the three groups of mice were stained with H&E and the results are displayed in Figure 2A. Data quantitation was conducted by calculating the NAS score (Figure 2B). The results demonstrated that the liver cells in the control group had a regular morphology with clear borders of the liver lobules, without lipid droplet distribution and inflammatory cell infiltration. The NAS score was the lowest NAS. The distribution of hepatocytes in the vehicle group was recorded, with a large number of lipid droplet vacuoles in the cytoplasm, while the hepatocytes showed bullous diffuse steatosis. Furthermore, inflammatory cell infiltration was found, with the highest NAS score. However, in the DH (240 mg/kg) mice, there were more lipid droplets and lamellar balloon-like lesions in the hepatocytes. Their NAS score was slightly lower than that of the vehicle group. This revealed that DH (240 mg/kg) had a lesser effect on steatosis but a tendency to reduce lobular inflammation.
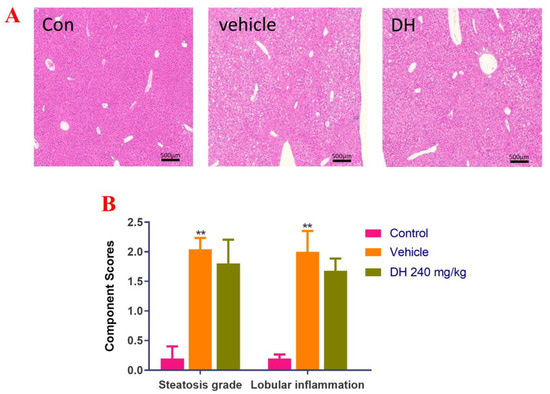
Figure 2.
Investigation of steatosis in NASH mouse model after supplementation of mice with ethyl acetate extraction of D. heterophyllum extract supplementation of mice had no obvious effect on steatosis. We detected that steatosis is not obvious, but there is a certain tendency to alleviate lobular inflammation in the NASH mice. (A) HE staining results (500×), (B) NAS score. Con: control group; DH: 240 mg/kg ethyl acetate extract. Values are presented as the mean ± SD (n = 10). ** p < 0.01 vs. the control group.
Based on the histopathological findings, the parameters related to lipid metabolism (TG and TC) were further evaluated. Their blood serum concentrations were significantly reduced in the vehicle group after 2 and 4 weeks of administration (Figure 3A,B) compared with the normal control group. In the liver, they were also significantly increased after 4 weeks of administration (Figure 3C,D). DH (240 mg/kg) had some therapeutic effect on it, but there was no statistically significant difference (Figure 3A–D).

Figure 3.
Effect of the ethyl acetate extract of D. heterophyllum supplementation on the blood serum levels of TC and TG, and the expression of related genes. Levels of TG (A), TC (B), liver levels of TG (C), and TC (D), col1α1 mRNA expression in the NASH mice. α-SMA mRNA expression (E), col1α1 mRNA expression (F), MCP-1 mRNA expression (G), and CD68 mRNA expression (H). DH 240 mg/kg: 240 mg/kg ethyl acetate extract. Values are presented as the mean ± SD (n = 10). * p < 0.05, ** p < 0.01 vs. the control group; # p < 0.05, ## p < 0.01 vs. the vehicle group.
Differential expression of related genes was investigated by quantitative real-time PCR and the obtained results are displayed in Figure 3E–H. Herein, the obtained data suggested that compared with the normal control group, the expression of liver col1α1, α-SMA, MCP-1, and CD68 genes were found to be considerably upregulated in the vehicle group after 4 weeks of administration. In the subject DH (240 mg/kg) group, a significant decrease in the expression levels of genes including col1α1, α-SMA, MCP-1, and CD68 was observed.
3.1.2. Effects on Mice CCl4-Induced Liver Fibrosis Model in Mice
As depicted in Figure 4A,B, there were no major dissimilarities in body weight measurements among mice. The CCl4 model group (vehicle) demonstrated significant differences in the liver index compared to the normal group. The subjects (DH 200 mg/kg, 600 mg/kg) did not affect the liver index 6 weeks post-administration compared to the vehicle group.
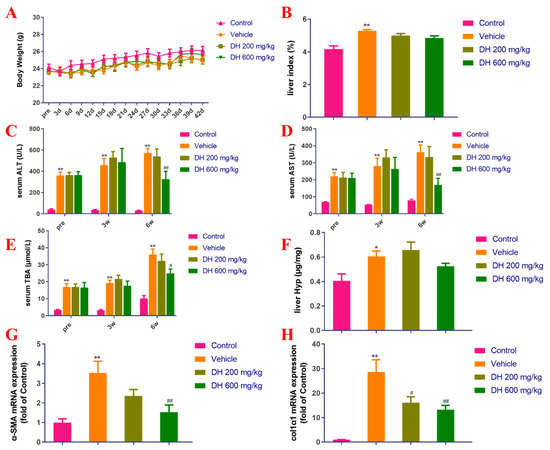
Figure 4.
Investigation of the effect of D. heterophyllum treatment on the blood serum levels of ALT, AST, and TBA production, as well as its impact on the gene expression of α-SMA and col1α1 mRNA expression in the CCl4-induced liver fibrosis mice. Body weight (A), liver index (B), serum levels of ALT (C), AST (D), TBA (E), liver levels of Hyp (F), α-SMA mRNA expression (G) and col1α1 mRNA expression (H). Pre: preparation; 3 d–42 d: 3 days–42 days; 3W: 3 weeks, 6W: 6 weeks. DH 200 mg/kg: 200 mg/kg ethyl acetate extract; DH 600 mg/kg: 600 mg/kg ethyl acetate extract. Values are presented as the mean ± SD (n = 10). * p < 0.05, ** p < 0.01 vs. the control group; # p < 0.05, ## p < 0.01 vs. the vehicle group.
Biochemical markers of liver function are the key basis for determining the extent of liver injury. The blood serum concentrations of ALT, AST, and TBA in mice from the vehicle group were significantly higher in comparison with the control group (Figure 4C–E). On the contrary, the blood serum concentrations of these biochemical markers in the DH (600 mg/kg) groups were found to be considerably lower after 6 weeks of administration but did not affect liver Hyp (Figure 4C–F).
The gene expression levels of liver fibrosis-associated biomarkers, α-SMA and colα1 were probed by quantitative real-time PCR. Figure 4G,H showed the results from these experiments. The hepatic α-SMA and col1α1 expression rates were considerably upregulated in the vehicle group 6 weeks post-administration, while the subject DH mice had significantly downregulated α-SMA and col1α1 gene expression rates in a concentration-dependent manner. The comparisons are related to the control group of mice and their expression levels of these genes.
Next, the liver pathological sections stained with Sirius red were examined. Figure 5 shows that the mice in the vehicle group had clear presinusoidal fibrosis in their liver tissues and that some of them exhibited bridging formation and considerably diminished ECM deposition around the central vein. The liver fibrosis in the DH (600 mg/kg) groups was still obvious, with no significant improvement effect.

Figure 5.
Pathological investigation of liver tissue sections in the CCl4-induced liver fibrosis mice stained with Sirius red. (A) Sirius red stained representative micrographs of liver sections from the studied groups of mice (200×), the (B) area ratio of collagen. DH 200 mg/kg: 200 mg/kg ethyl acetate extract; DH 600 mg/kg: 600 mg/kg ethyl acetate extract. Values are presented as mean ± SD (n = 10). ** p < 0.01 vs. the control group.
Combining the experimental results of the two mice models, it was found that the ethyl acetate extraction of D. heterophyllum significantly reduced the TBA concentration in the liver, as well as influenced the expression of α-SMA and CD68 genes. It decreased the liver NAS score and reduced the formation of inflammatory foci in the liver. Moreover, it inhibited the expression of the col1α1 gene in type I collagen, reduced ECM formation, and exhibited antifibrotic properties. However, there was no significant improvement in the concentrations of Hyp neither in liver tissues, nor in the concentrations of TG and TC in liver tissues, which were indicators of liver fat metabolism in the model. Based on these results, it seems that the pharmacological effects of D. heterophyllum extract on liver fibrosis may come from reducing inflammation or affecting the activation of stellate cells at a later stage.
3.2. Isolation of DPPH Inhibitor and Anti-Inflammatory Active Component in Ethyl Acetate Extract Using Medium- and High-Pressure Liquid Chromatography
D. heterophyllum ethyl acetate extracts (100 mg) were mixed with 100 μL MeOH-water (1:1 v/v) and sieved through a 0.45 μm filter membrane. It was analyzed on a 7-X10 analytical column using an online HPLC-DPPH system under optimized chromatographic conditions, as shown in Figure 6. Herein, the data obtained from isolation studies suggested that the main part of the D. heterophyllum ethyl acetate extract had a negative peak at 517 nm. This meant that the main part had strong antioxidant activity. The affinity ultrafiltration-HPLC analysis Figure was shown in Figure 7. Peak areas were obtained by HPLC integration. RBA values obtained by comparing the peak area ratio of the main component of D. heterophyllum ethyl acetate extract with the active and inactivated enzyme after incubation was greater than 1.5 [32], indicating that the main component of D. heterophyllum ethyl acetate extracts have a good binding affinity to COX-2 and possess a certain anti-inflammatory activity (RBA = 1.79). This is a significant finding and may serve as a candidate, considering that COX-2 controls inflammation. It is abundantly expressed when cells are stimulated by inflammation and rapidly respond to a series of pro-inflammatory mediators and cytokines [33].
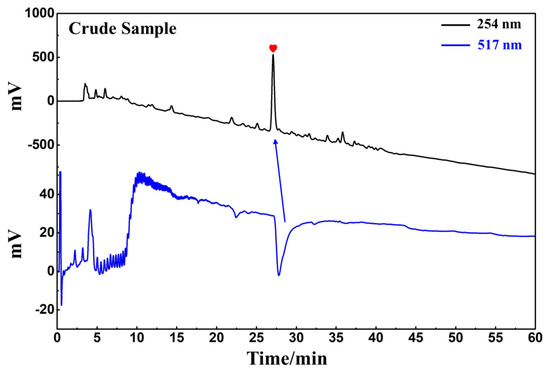
Figure 6.
Analytical chromatogram on a 7-X10 analytical column and DPPH inhibitory activity profile of the extract of the ethyl acetate extraction of D. heterophyllum. Antioxidant peak marked with red heart. Conditions for HPLC1: mobile phase A: 0.1% v/v formic acid in water, B: MeOH; gradient elution: 0–60 min, 0–100% B; monitoring wavelength: 210 nm; flow rate: 1.0 mL/min; injection volume: 5 μL; column temperature: 30 °C. Conditions for HPLC2: monitoring wavelength: 517 nm; DPPH solution flow rate: 0.8 mL/min.
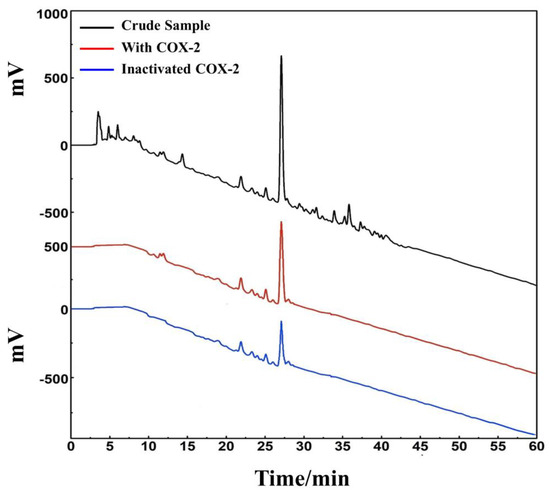
Figure 7.
An affinity ultrafiltration-HPLC chromatogram for potential COX-2 ligands present in the ethyl acetate extraction of D. heterophyllum. The black, red, and blue lines, respectively, correspond to the HPLC chromatograms of the ethyl acetate extraction of D. heterophyllum without COX-2, with activated COX-2, and with inactivated COX-2. Conditions: mobile phase A: 0.1% v/v formic acid in water, B: MeOH; gradient elution: 0–60 min, 0–100% B; flow rate: 1.0 mL/min; monitoring wavelength: 210 nm; injection volume: 2 μL; column temperature: 30 °C.
The following phase involved the fast and efficient preparative separation of the primary functional component using medium- and high-pressure liquid chromatography in accordance with the activity-oriented results. The ethyl acetate extraction of D. heterophyllum contained a massive quantity of chlorophyll and lipophilic compounds, which were easily adsorbed on the stationary stage of the preparative column, causing column contamination and therefore had to be removed by pretreatment before further preparative separation experiments. MCI GEL® CHP20P packing is stable and can achieve good reproducibility for target compounds during purification [34,35]. Using it as a stationary phase for medium-pressure liquid chromatography can achieve high resolution for sample enrichment and high product recovery. In this view, 90.00 g of silica mix sample to a small medium-pressure tower (49 × 100 mm) was attached to a medium-pressure column packed with MCI GEL® CHP20P for dry loading sample preparation. The prepared enrichment chromatogram is shown in Figure 8A. Five fractions (Fr1, Fr2, Fr3, Fr4, and Fr5) were gathered after three repeated cycles using methanol–water as an eluent.
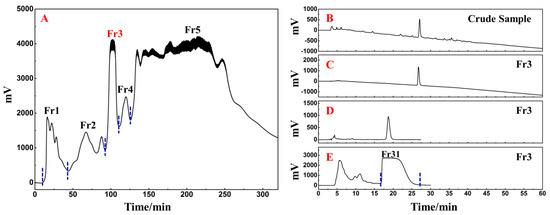
Figure 8.
Separation chromatograms of D. heterophyllum ethyl acetate extracts mixed with amorphous silica gel (A). Conditions: mobile phase A: water and B: MeOH; gradient: 0–35 min, 0% B, 35–195 min, 0–100% B, 195–320 min, 100% B; monitoring wavelength: 210 nm; flow rate: 57.0 mL/min; sample loading: 90.0 g of D. heterophyllum ethyl acetate extract amorphous silica gel combination; column temperature: room temperature. The analytical chromatogram of the D. heterophyllum ethyl acetate extraction (B) and fraction Fr3 (C,D) on a 7-X10 analytical column. Preparative chromatogram (E) of the main component Fr31 sample on a 7-X10 preparative column. Conditions: mobile phase A: 0.1% formic acid in water, B: MeOH; gradient elution for (B,C): 0–60 min, 0–100% B; isocratic elution for (D,E): 0–30 min, 30% B; flow rate for (B–D): 1.0 mL/min, for (E): 19.0 mL/min; monitoring wavelength: 210 nm; injection volume for (B,D): 2 μL, for (E): 1.0 mL; column temperature for (B–D): 30 °C, for (E): room temperature.
As a highly engineered process, NPs’ quality control is a system of considerable complexity. The efficient preparative separation of its main functional component can provide an important basis for its quality control studies. Therefore, the high-resolution screening and purification of the extract were performed. The liquid phase analysis chromatograms of the current study analyses are presented in Figure 8B,C. The main functional component from the D. heterophyllum to be in fraction Fr3 (7.06 g with 7.06% recovery). To achieve a high-purity preparative separation of its main functional component and to save preparation separation time and organic solvents, we optimized the separation conditions of Fr3 on a 7-X10 analytical column (4.6 × 250 mm, 5 μm). By adjusting the elution settings we prepared the main component of Fr3 by a 30% isocratic elution of MeOH in a mix of MeOH/0.1% v/v formic acid in the water system. Figure 8D contains the analysis diagram. The optimized isocratic elution conditions allowed the separation of the main functional component of the ethyl acetate D. heterophyllum extract. After linear amplification, 500.00 mg of Fr31 were further separated on the 7-X10 preparative column (20 × 250 mm, 5 μm) after 60 cycles, with a net recovery of 7.08%. The preparation diagram is shown in Figure 8E.
3.3. Purity Analysis and Structural Characterization of the Target Compound
Using a SunFire C18 analytical column, the separated Fr31 was re-evaluated for purity and activity. Figure 9B reveals the purity of the main functional component isolated from the ethyl acetate extraction of D. heterophyllum, which was above 99%. This indicated that its high purity preparation was successfully achieved. The comparison with the chromatogram of the crude extract (Figure 9A) demonstrated that Fr31 was indeed the main functional compound present in the ethyl acetate extraction of D. heterophyllum. Its structure was further studied by ESI-MS, 1H, and 13C NMR spectral analyses and data were documented and identified in comparison with the present information in the literature. Below, we list all spectra of the original spectra records, while the raw spectra are shown in the supporting materials (Figures S1–S3). Our results proved that the key component isolated from the ethyl acetate extraction of D. heterophyllum was the rosmarinic acid. Its chemical structure is shown in Figure 9C.
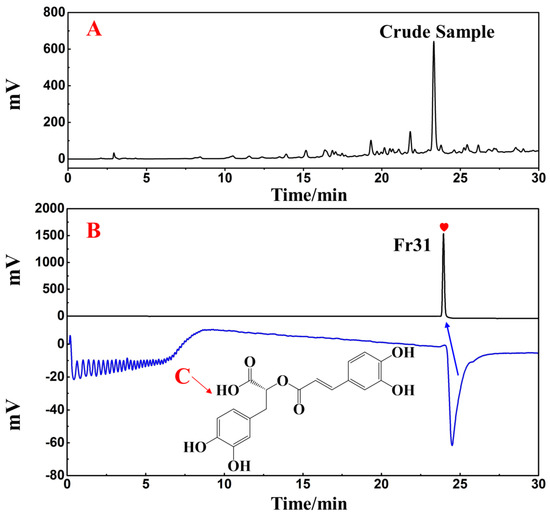
Figure 9.
Purity and activity analysis comparison figures of the isolated main component Fr31 (A,B) on the SunFire analytical column. (C) is the chemical structure of the isolated compound. Antioxidant peak marked with red heart. Conditions: 0.1% formic acid in water, B: MeOH; gradient: 0–30 min, 10–90% B; monitoring wavelength: 210 nm; flow rate: 1.0 mL/min; injection volume: 1 μL; column temperature: 30 °C.
The principal bioactive compound isolated from the ethyl acetate extraction of D. heterophyllum include: (rosmarinic acid, 500.0 mg, white powder, ESI-MS m/z 359.25 [M-H]−, calcd for C18H16O8 m/z 360.25): 1H NMR (600 MHz, MeOH-d4) 7.54 (1H, d, J = 15.9 Hz, 7′-H), 7.03 (1H, d, J = 2.1 Hz, 2′-H), 6.94 (1H, dd, J = 8.1, 2.1 Hz, 6′-H), 6.77 (1H, d, J = 8.2 Hz, 5′-H), 6.74 (1H, d, J = 2.1 Hz, 2-H), 6.69 (1H, d, J = 8.0 Hz, 5-H), 6.60 (1H, dd, J = 8.0, 2.1 Hz, 6-H), 6.26 (1H, d, J = 15.9 Hz, 8′-H), 5.18 (1H, m, 8-H), 3.09 (1H, dd, J = 14.4, 4.3 Hz, 7b-H), 3.00 (1H, dd, J = 14.4, 8.5 Hz, 7a-H); 13C NMR (151 MHz, MeOH-d4) 173.4 (C-9), 168.4 (C-9′), 149.8 (C-4′), 147.7 (C-7′), 146.8 (C-3′), 146.2 (C-3), 145.3 (C-4), 129.2 (C-1), 127.7 (C-1′), 123.2 (C-6′), 121.8 (C-6), 117.6 (C-2), 116.5 (C-5′), 116.3 (C-5), 115.2 (C-8′), 114.4 (C-2′), 74.6 (C-8), 37.9 (C-7). These data corresponded to rosmarinic acid [36].
3.4. Prediction of the Therapeutic Potential of Rosmarinic Acid for Liver Diseases by Molecular Docking
The binding strength of the D. heterophyllum ethyl acetate extraction main functional component rosmarinic acid to important proteins of interest was evaluated by the molecular modeling of interactions by docking. After the analysis and visualization of the obtained results are shown in Figure 10, Figure 11 and Figure 12, we found that the possible action mechanism of rosmarinic acid could be discussed from the perspectives of lipid metabolism, oxidative stress, and inflammation.
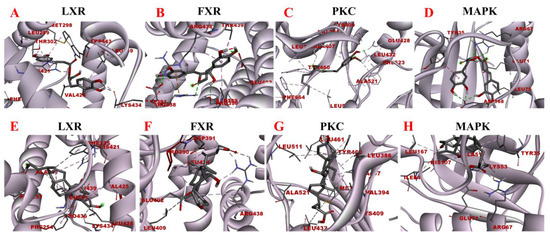
Figure 10.
Molecular docking models of rosmarinic acid and obeticholic acid binding to LXR, FXR, PKC, and MAPK. (A–D) correspond to the binding models of rosmarinic acid with LXR, FXR, PKC, and MAPK, respectively. (E–H) correspond to the binding models of obeticholic acid with LXR, FXR, PKC, and MAPK, respectively.
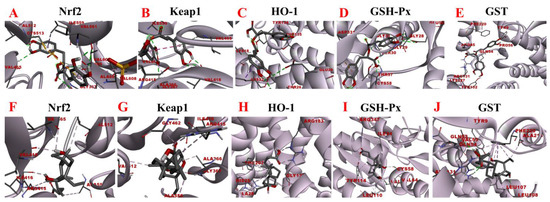
Figure 11.
Molecular docking analysis of rosmarinic acid and obeticholic acid binding to Nrf2, Keap1, HO-1, GSH-Px, and GST. (A–E) correspond to the binding models of rosmarinic acid with Nrf2, Keap1, HO-1, GSH-Px and GST, respectively. (F–J) correspond to the binding models of obeticholic acid with Nrf2, Keap1, HO-1, GSH-Px, and GST, respectively.
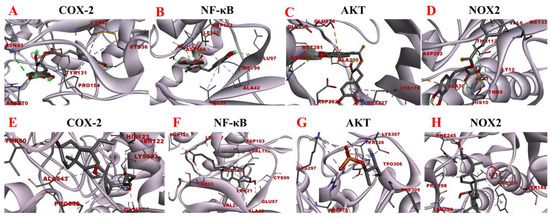
Figure 12.
Molecular docking analysis of rosmarinic acid and obeticholic acid binding to COX-2, NF-κB, AKT and NOX2. (A–D) correspond to the binding models of rosmarinic acid with COX-2, NF-κB, AKT and NOX2, respectively. (E–H) correspond to the binding models of obeticholic acid with Nrf2, Keap1, HO-1, GSH-Px and GST, respectively.
LXR and FXR are members of the nuclear receptor supergene family encoding transcription factors, which are key transcriptional regulators of lipid metabolism genes and prospective therapeutic targets for the prevention and treatment of numerous diseases. FXR activity inhibits the ab initio synthesis of hepatic lipids, increases insulin sensitivity, and overcomes bile acid-induced cytotoxicity. It also results in the inhibition of adipogenic factor expression, which affects the transcription of key enzymes contributing to lipid production, such as ACC, FAS, and SCD-1 [37]. The MAPK signaling pathway is a signaling network consisting of a series of catalytic cascades that together regulate a variety of cellular processes including proliferation, differentiation, and migration. FXR can antagonize the MAPK signaling pathway, thereby inhibiting the expression of its downstream genes and other inflammation-related genes [38]. The PKC family includes about ten isoforms, which are involved in many important physiological responses in the body, including apoptosis, lipid metabolism, and the development of cardiovascular diseases. Unsaturated fatty acids can activate the PKC activity, which inhibits LXR activity and causes intracellular lipid accumulation, leading to hepatic metabolic disorders. The blockade of LXRα/β genes results in more lipid droplets stored in hepatocytes and increased expression of fibrotic genes, including Acta2 (the gene encoding α-SMA) and Col1a1 [39]. To maintain the liver’s nutrient/energy balance, FXR and LXR are involved in processes including lipid, glucose, and inflammatory activation metabolism. Based on the above results, four proteins LXR, PKC, FXR, and MAPK were selected to establish the functional correlation between experiments and bioinformatics in this study. The obtained molecular models of the docking experiments are displayed in Table 2 and Table 3 and Figure 10. The prediction models of this study demonstrated that the rosmarinic acid binds to the receptors of the above-discussed proteins via conventional hydrogen bonds, pi-sigma, pi-alkyl, pi-pi stacked and pi-cation. The relative binding affinities were −7.77 kcal/mol, −5.89 kcal/mol, −7.17 kcal/mol, and −6.86 kcal/mol, respectively, indicating that rosmarinic acid had the strongest binding affinity to LXR, further corroborating the data from previous animal model experiments. Further molecular docking results demonstrated that rosmarinic acid has multiple binding sites to LXR, PKC, FXR, and MAPK, advocating that rosmarinic acid regulates lipid metabolism by directly binding LXR, PKC, FXR, and MAPK.
Table 2.
Intermolecular interactions between rosmarinic acid and LXR, PKC, FXR, and MAPK.
Table 3.
Intermolecular interactions between obeticholic acid and LXR, PKC, FXR, and MAPK.
Oxidative stress is a state of redox imbalance in the body, which is one of the risk factors for NASH and liver pathologies such as liver fibrosis. Data demonstrate that the Nrf2-Keap1 signaling pathway is not only an important defense system against oxidative stress damage but also is a key signaling pathway to enhance the antioxidant capacity of the body. The imbalance of oxidants and antioxidants in the body induces conformational changes in the cysteine residues of Keap1, resulting in the release of Nrf2 from the nucleus. There, it builds a heterodimer with Maf and interacts with the antioxidant response element, inducing the expression of downstream antioxidant molecules such as HO-1, GSH-Px, and GST [40,41]. Based on the activity-directed isolation results, we hypothesized that rosmarinic acid may bind to Nrf2, Keap1, HO-1, GSH-Px, and GST to regulate oxidative stress in the organism. As shown in Figure 11, the rosmarinic acid can enter the binding pockets of these five receptors through the conventional hydrogen bond, carbon hydrogen bond, pi-sigma, pi-alkyl, pi-pi stacked, pi-sulfur, and pi-anion. In addition, Table 4 and Table 5 shows data that prove that the binding affinity of rosmarinic acid to these targets was below −6.5 kcal/mol, especially with GSH-Px, GST reaching −8.11 kcal/mol and −8.41 kcal/mol accordingly. Additionally, it was found that when the binding affinity was below −5.5 kcal/mol it is considered that the bioactive compound had a good binding activity to the target, whereas affinity values less than −7.0 kcal/mol indicated strong adhesion of the receptor to the ligand. In this view, rosmarinic acid is likely a good antioxidant, which is supported by the results of the preliminary HPLC-DPPH screening experiments.
Table 4.
Intermolecular interactions between rosmarinic acid and Nrf2, Keap1, HO-1, GSH-Px, and GST.
Table 5.
Intermolecular interactions between obeticholic acid and Nrf2, Keap1, HO-1, GSH-Px, and GST.
The inflammatory response is one of the major factors contributing to most chronic liver diseases and liver fibrosis. COX-2 initiates cellular reactions against inflammation, promotes cell proliferation, and inhibits apoptosis. COX-2 expression was found to be elevated after the onset of liver fibrosis. Additionally, the activation of HSC was significantly reduced after the application of COX-2 inhibitors [42]. NOX is a transmembrane complex composed of multiple protein subunits and a major source of ROS in hepatocytes, which drives the progression of liver fibrosis. NOX PI3K/AKT activity is linked with induced IκBα phosphorylation, which dissociates the NF-κB p65 subunit from it and translocates it to the nucleus, thereby activating the transcriptional activity of NF-κB [43]. NF-κB is considered to be a core molecule in several inflammatory signaling pathways. NF-κB leads to elevated expression levels of various downstream inflammatory factors and exacerbates inflammatory damage, and long-term inflammatory stimulation leads to liver fibrosis [44]. Consequently, the molecular docking analysis of rosmarinic acid with inflammation-related targets was performed to explore the possible interactions between rosmarinic acid and COX-2, NF-κB, AKT, and NOX2. The results are shown in Figure 12. The data revealed that the rosmarinic acid and COX-2, NF-κB, AKT, and NOX2 interacted via a conventional hydrogen bond, pi-sigma, pi-alkyl, pi-sulfur, and pi-anion, respectively, showing −6.21 kcal/mol, −6.94 kcal/mol, −6.73 kcal/mol and −6.67 kcal/mol binding energies. Detailed molecular docking information is summarized in Table 6 and Table 7. It shows that the binding affinity is excellent and is consistent with the results of the preliminary affinity ultrafiltration-HPLC guided separation.
Table 6.
Intermolecular interactions between rosmarinic acid and COX-2, NF-κB, AKT, and NOX2.
Table 7.
Intermolecular interactions between rosmarinic acid and COX-2, NF-κB, AKT, and NOX2.
Taken together, the predicted results of molecular docking further suggest that rosmarinic acid, the main functional component of D. heterophyllum ethyl acetate extract isolated by activity-directed screening, does possess favorable antioxidant, anti-inflammatory, and lipid metabolism modulating activities. It mainly reduces intracellular lipids and free radicals to react to form lipid peroxides by activating peroxidase, which constitutes a multilevel reduced organic hydroperoxide system specific to different substrates. Furthermore, this compound activates peroxidase to form a multi-level reduction organic hydroperoxide system specific to different substrates, thereby reducing the reaction of lipids and free radicals in cells to form lipid peroxides. This provides a scientific basis for the development and exploitation of the D. heterophyllum medicinal value.
4. Conclusions
The structural diversity of NPs and their characteristics that easily combine with those of biological macromolecules determine their incomparable advantages in participating in the physiological processes of life. These characteristics afford them an indispensable and pivotal position in the development of innovative drugs and drug-led structures. Therefore, the quality control research of NPs is a top priority in NPs’ research.
Herein, ethyl acetate was used as the organic solvent to isolate the active constituents of D. heterophyllum. The obtained extract was subjected to efficacy evaluation in a mouse model of NASH and liver fibrosis. The analysis results revealed that D. heterophyllum ethyl acetate extracts improved liver function by reducing cholestasis and decreasing the inflammatory response. Because oxidative stress and inflammation are key factors in the development of NASH and liver fibrosis, the main component rosmarinic acid with a purity of > 99% was isolated. The potential functions of the rosmarinic acid were demonstrated by molecular docking followed by in vivo studies using mice models. The results demonstrated that the rosmarinic acid exhibited lipid-modulating effects and has a role in several antioxidant- and anti-inflammatory-related signaling pathways, revealing a multi-target and multi-pathway therapeutic profile in NASH and liver fibrosis. Taken together, the approach taken in this study to extract and purify NPs paves the way for the discovery of more pharmacologically active NPs in natural sources and further investigation into them, with the ultimate goal of developing novel therapeutics.
We understand that certain mechanistic investigations are required to determine the interactions of the various molecular pathways involved, which should be subject to future explorations.
Supplementary Materials
The following supporting information can be downloaded at: https://www.mdpi.com/article/10.3390/separations9100273/s1, Figure S1: ESI mass spectrum of rosmarinic acid; Figure S2: 1H NMR Spectrum (600 MHz) of rosmarinic acid (in MeOH-d4); Figure S3: 13C NMR Spectrum (151 MHz) of rosmarinic acid (in MeOH-d4).
Author Contributions
Writing—original draft, methodology, Y.F.; writing—review and editing, methodology, D.S.; formal analysis, investigation, G.L.; data curation, Y.L.; conceptualization, visualization, J.L.; conceptualization, project administration, and funding acquisition, Q.W. and J.D. All authors have read and agreed to the published version of the manuscript.
Funding
This research was funded by the International Cooperation Project of Qinghai Province (2020-HZ-804).
Institutional Review Board Statement
The study was conducted in accordance with the Animal Care and Use Committee affiliated with the Shanghai Institute of Materia Medica with approval number 2017-10-LJ-53 and 2018-11-LJ-66. The study was also conducted in following the National Institutes of Health Guide for the Care and Use of Laboratory Animals (NIH Publication No. 85-23, revised in 1985).
Informed Consent Statement
Not applicable.
Data Availability Statement
All data generated or analyzed during this study are included in this published article (and its Supplementary Information file).
Conflicts of Interest
The authors have stated that they have no known conflicting financial interest or personal ties that may have influenced the work presented in this publication.
References
- Eslam, M.; Valenti, L.; Romeo, S. Genetics and epigenetics of NAFLD and NASH: Clinical impact. J. Hepatol. 2019, 68, 268–279. [Google Scholar] [CrossRef]
- Duan, X.; Meng, Q.; Wang, C.; Liu, Z.; Liu, Q.; Sun, H.; Sun, P.; Yang, X.; Huo, X.; Peng, J.; et al. Calycosin attenuates triglyceride accumulation and hepatic fibrosis in murine model of non-alcoholic steatohepatitis via activating farnesoid X receptor. Phytomedicine 2017, 25, 83–92. [Google Scholar] [CrossRef]
- Xu, J.; Dai, L.; Zhang, Y.; Wang, A.; Li, H.; Wang, Y.; Meng, X.; Wu, S.; Wang, Y. Severity of Nonalcoholic Fatty Liver Disease and Risk of Future Ischemic Stroke Events. Stroke 2021, 52, 103–110. [Google Scholar] [CrossRef]
- Younossi, Z.; Anstee, Q.M.; Marietti, M.; Hardy, T.; Henry, L.; Eslam, M.; George, J.; Bugianesi, E. Global burden of NAFLD and NASH: Trends, predictions, risk factors and prevention. Nat. Rev. Gastroenterol. Hepatol. 2018, 15, 11–20. [Google Scholar] [CrossRef] [PubMed]
- Schuppan, D.; Surabattula, R.; Wang, X.Y. Determinants of fibrosis progression and regression in NASH. J. Hepatol. 2018, 68, 238–250. [Google Scholar] [CrossRef]
- Sheka, A.C.; Adeyi, O.; Thompson, J.; Hameed, B.; Crawford, P.A.; Ikramuddin, S. Nonalcoholic Steatohepatitis: A Review. JAMA 2020, 323, 1175–1183. [Google Scholar] [CrossRef]
- Hua, Y.Q.; Zeng, Y.; Xu, J.; Xu, X.L. Naringenin alleviates nonalcoholic steatohepatitis in middle-aged Apoe-/-mice: Role of SIRT1. Phytomedicine 2021, 81, 153412. [Google Scholar] [CrossRef]
- Li, S.; Li, X.; Chen, F.; Liu, M.; Ning, L.; Yan, Y.; Zhang, S.; Huang, S.; Tu, C. Nobiletin mitigates hepatocytes death, liver inflammation, and fibrosis in a murine model of NASH through modulating hepatic oxidative stress and mitochondrial dysfunction. J. Nutr. Biochem. 2022, 100, 108888. [Google Scholar] [CrossRef] [PubMed]
- Rodrigues, T.; Reker, D.; Schneider, P.; Schneider, G. Counting on natural products for drug design. Nat. Chem. 2016, 8, 531–541. [Google Scholar] [CrossRef]
- Harvey, A.L.; Edrada-Ebel, R.; Quinn, R.J. The re-emergence of natural products for drug discovery in the genomics era. Nat. Rev. Drug Discov. 2015, 14, 111–129. [Google Scholar] [CrossRef]
- Gouveia, D.N.; Guimarães, A.G.; Santos, W.B.D.R.; Quintans-Júnior, L.J. Natural products as a perspective for cancer pain management: A systematic review. Phytomedicine 2019, 58, 152766. [Google Scholar] [CrossRef]
- Chopra, B.; Dhingra, A.K. Natural products: A lead for drug discovery and development. Phytother. Res. 2021, 35, 4660–4702. [Google Scholar] [CrossRef] [PubMed]
- Du, K.Z.; Sun, A.L.; Yan, C.; Liang, C.; Qi, L.; Wang, C.; Yang, R.; Cui, Y.; Shang, Y.; Li, J.; et al. Recent advances of green pretreatment techniques for quality control of natural products. Electrophoresis 2020, 41, 1469–1481. [Google Scholar] [CrossRef]
- Bian, J.; Wang, K.; Wang, Q.L.; Wang, P.; Wang, T.; Shi, W.Y.; Ruan, Q.G. Dracocephalum heterophyllum (DH) Exhibits Potent Anti-Proliferative Effects on Autoreactive CD4+ T Cells and Ameliorates the Development of Experimental Autoimmune Uveitis. Front. Immunol. 2020, 11, 575669. [Google Scholar] [CrossRef]
- Shi, Q.Q.; Dang, J.; Wen, H.X.; Yuan, X.; Tao, Y.D.; Wang, Q.L. Anti-hepatitis, antioxidant activities and bioactive compounds of Dracocephalum heterophyllum extracts. Bot. Stud. 2016, 57, 16. [Google Scholar] [CrossRef]
- Stappen, I.; Wanner, J.; Tabanca, N.; Wedge, D.E.; Ali, A.; Kaul, V.K.; Lal, B.; Jaitak, V.; Gochev, V.K.; Schmidt, E.; et al. Chemical Composition and Biological Activity of Essential Oils of Dracocephalum heterophyllum and Hyssopus officinalis from Western Himalaya. Nat. Prod. Commun. 2015, 10, 133–138. [Google Scholar] [CrossRef] [PubMed]
- Khoo, H.T.; Leow, C.H. Advancements in the preparation and application of monolithic silica columns for efficient separation in liquid chromatography. Talanta 2021, 224, 121777. [Google Scholar] [CrossRef]
- Gulcin, İ. Antioxidants and antioxidant methods: An updated overview. Arch. Toxicol. 2020, 94, 651–715. [Google Scholar] [CrossRef]
- Zhang, X.W.; Bian, G.L.; Kang, P.Y.; Cheng, X.J.; Yan, K.; Liu, Y.L.; Gao, Y.X.; Li, D.Q. Recent advance in the discovery of tyrosinase inhibitors from natural sources via separation methods. J. Enzyme Inhib. Med. Chem. 2021, 36, 2104–2117. [Google Scholar] [CrossRef] [PubMed]
- Crampon, K.; Giorkallos, A.; Deldossi, M.; Baud, S.; Steffenel, L.A. Machine-learning methods for ligand-protein molecular docking. Drug Discov. Today 2022, 27, 151–164. [Google Scholar] [CrossRef]
- Ballante, F.; Kooistra, A.J.; Kampen, S.; de Graaf, C.; Carlsson, J. Structure-Based Virtual Screening for Ligands of G Protein-Coupled Receptors: What Can Molecular Docking Do for You? Pharmacol. Rev. 2021, 73, 527–565. [Google Scholar] [CrossRef]
- Batool, M.; Ahmad, B.; Choi, S. A Structure-Based Drug Discovery Paradigm. Int. J. Mol. Sci. 2019, 20, 2783. [Google Scholar] [CrossRef]
- Tacke, F.; Zimmermann, H.W. Macrophage heterogeneity in liver injury and fibrosis. J. Hepatol. 2014, 60, 1090–1096. [Google Scholar] [CrossRef]
- Parola, M.; Pinzani, M. Liver fibrosis: Pathophysiology, pathogenetic targets and clinical issues. Mol. Asp. Med. 2019, 65, 37–55. [Google Scholar] [CrossRef] [PubMed]
- Schwabe, R.F.; Tabas, I.; Pajvani, U.B. Mechanisms of Fibrosis Development in Nonalcoholic Steatohepatitis. Gastroenterology 2020, 158, 1913–1928. [Google Scholar] [CrossRef] [PubMed]
- Higashi, T.; Friedman, S.L.; Hoshida, Y. Hepatic stellate cells as key target in liver fibrosis. Adv. Drug Deliv. Rev. 2017, 121, 27–42. [Google Scholar] [CrossRef]
- Wen, Y.; Lambrecht, J.; Ju, C.; Tacke, F. Hepatic macrophages in liver homeostasis and diseases-diversity, plasticity and therapeutic opportunities. Cell. Mol. Immunol. 2021, 18, 45–56. [Google Scholar] [CrossRef] [PubMed]
- Wang, C.; Ma, C.; Gong, L.; Guo, Y.; Fu, K.; Zhang, Y.; Zhou, H.; Li, Y. Macrophage Polarization and Its Role in Liver Disease. Front. Immunol. 2021, 12, 803037. [Google Scholar] [CrossRef]
- Mohammadi, A.; Blesso, C.N.; Barreto, G.E.; Banach, M.; Majeed, M.; Sahebkar, A. Macrophage plasticity, polarization and function in response to curcumin, a diet-derived polyphenol, as an immunomodulatory agent. J. Nutr. Biochem. 2019, 66, 1–16. [Google Scholar] [CrossRef] [PubMed]
- Yamate, J.; Izawa, T.; Kuwamura, M. Histopathological Analysis of Rat Hepatotoxicity Based on Macrophage Functions: In Particular, an Analysis for Thioacetamide-induced Hepatic Lesions. Food Saf. 2016, 4, 61–73. [Google Scholar] [CrossRef]
- Lin, C.C.; Yang, H.M. Fibrolamellar Carcinoma: A Concise Review. Arch. Pathol. Lab. Med. 2018, 142, 1141–1145. [Google Scholar] [CrossRef]
- Xie, L.; Lee, D.Y.; Shang, Y.; Cao, X.; Wang, S.; Liao, J.; Zhang, T.; Dai, R. Characterization of spirostanol glycosides and furostanol glycosides from anemarrhenae rhizoma as dual targeted inhibitors of 5-lipoxygenase and Cyclooxygenase-2 by employing a combination of affinity ultrafiltration and HPLC/MS. Phytomedicine 2020, 77, 153284. [Google Scholar] [CrossRef]
- Yang, H.; Xuefeng, Y.; Shandong, W.; Jianhua, X. COX-2 in liver fibrosis. Clin. Chim. Acta 2020, 506, 196–203. [Google Scholar] [CrossRef]
- Dang, J.; Ma, J.; Du, Y.; Dawa, Y.; Wang, Q.; Chen, C.; Wang, Q.; Tao, Y.; Ji, T. Large-scale preparative isolation of bergenin standard substance from Saxifraga atrata using polyamide coupled with MCI GEL® CHP20P as stationary phases in medium pressure chromatography. J. Chromatogr. B 2021, 1170, 122617. [Google Scholar] [CrossRef]
- Yuan, C.; Dang, J.; Han, Y.; Liu, C.; Yu, S.; Lv, Y.; Cui, Y.; Wang, Z.; Li, G. Preparative isolation of maltol glycoside from Dianthus superbus and its anti-inflammatory activity in vitro. RSC Adv. 2022, 12, 5031–5041. [Google Scholar] [CrossRef]
- Dapkevicius, A.; van Beek, T.A.; Lelyveld, G.P.; van Veldhuizen, A.; de Groot, A.; Linssen, J.P.; Venskutonis, R. Isolation and structure elucidation of radical scavengers from Thymus vulgaris leaves. J. Nat. Prod. 2002, 65, 892–896. [Google Scholar] [CrossRef] [PubMed]
- Panzitt, K.; Wagner, M. FXR in liver physiology: Multiple faces to regulate liver metabolism. Biochim. Biophys. Acta Mol. Basis Dis. 2021, 1867, 166133. [Google Scholar] [CrossRef] [PubMed]
- Filali-Mouncef, Y.; Hunter, C.; Roccio, F.; Zagkou, S.; Dupont, N.; Primard, C.; Proikas-Cezanne, T.; Reggiori, F. The ménage à trois of autophagy, lipid droplets and liver disease. Autophagy 2022, 18, 50–72. [Google Scholar] [CrossRef] [PubMed]
- Wang, B.; Tontonoz, P. Liver X receptors in lipid signalling and membrane homeostasis. Nat. Rev. Endocrinol. 2018, 14, 452–463. [Google Scholar] [CrossRef]
- Lu, M.C.; Ji, J.A.; Jiang, Z.Y.; You, Q.D. The Keap1-Nrf2-ARE Pathway As a Potential Preventive and Therapeutic Target: An Update. Med. Res. Rev. Sep. 2016, 36, 924–963. [Google Scholar] [CrossRef]
- Bhattacharjee, S.; Dashwood, R.H. Epigenetic Regulation of NRF2/KEAP1 by Phytochemicals. Antioxidants 2020, 9, 865. [Google Scholar] [CrossRef]
- Alhouayek, M.; Muccioli, G.G. COX-2-derived endocannabinoid metabolites as novel inflammatory mediators. Trends Pharmacol. Sci. 2014, 35, 284–292. [Google Scholar] [CrossRef]
- Lin, S.; Li, X.; Zhang, J.; Zhang, Y. Omentin-1: Protective impact on ischemic stroke via ameliorating atherosclerosis. Clin. Chim. Acta 2021, 517, 31–40. [Google Scholar] [CrossRef]
- Yahfoufi, N.; Alsadi, N.; Jambi, M.; Matar, C. The Immunomodulatory and Anti-Inflammatory Role of Polyphenols. Nutrients 2018, 10, 1618. [Google Scholar] [CrossRef]


Publisher’s Note: MDPI stays neutral with regard to jurisdictional claims in published maps and institutional affiliations. |
© 2022 by the authors. Licensee MDPI, Basel, Switzerland. This article is an open access article distributed under the terms and conditions of the Creative Commons Attribution (CC BY) license (https://creativecommons.org/licenses/by/4.0/).