Abstract
Gold (Au) and palladium (Pd) are platinum group metals (PGMs) that are considered critical in society because they are required in several industrial applications. Their shortage has caused the urgent need for their recovery from secondary resources. Therefore, there is a need to develop functional materials with high adsorption capacity and selectivity for recovery of PGMs from various secondary sources. In this study, a Zn-Al-layered double hydroxide@zeolitic imidazolate framework-8 (Zn–Al–LDH@ZIF–8) nanocomposite was used as an adsorbent for the recovery of Au and Pd from ore concentrates. The Zn–Al–LDH@ZIF–8 nanocomposite was characterised using scanning electron microscopy (SEM), energy-dispersive X-ray spectroscopy (EDS), transmission electron spectroscopy, Fourier-transform infrared (FTIR) spectroscopy, zeta potential, and X-ray diffraction (XRD) spectroscopy. The recovery of Au(III) and Pd(II) was achieved using ultrasound-assisted dispersive µ-solid-phase extraction (UA-D-µ-SPE) and their quantification was attained using an inductively coupled plasma mass spectrometer (ICP-MS). The results showed that the surface of the adsorbent remained positively charged in a wide pH range, which endowed the nanocomposite with high adsorption affinity towards Au(III) and Pd(II). Under optimised conditions, the equilibrium studies revealed that the adsorption of Au(III) and Pd(II) ions followed the Langmuir isotherm model with maximum sorption capacities of 163 mg g−1 and 177 mg g−1 for Au(III) and Pd(II), respectively. The nanocomposite possessed relatively good regeneration, reusability, and stability characteristics, with its performance decreasing by only 10% after five adsorption–desorption cycles.
1. Introduction
Owing to the unique properties of PGMs such as nobility and catalytic activity, their recovery from different sources is of economic importance. These remarkable features have resulted in wide applications of PGMs [1]. Palladium and Au, as with other precious metals, have a wide range of applications that are not limited to jewellery and electronic devices [2,3]. However, their limited resources are becoming worrisome to various sectors [4]. For instance, compounds of Pd and Au are widely used in the catalysis industry for different applications in various manufacturing processes [5,6,7]. Therefore, recovery of Au and Pd from waste has received significant attention from many researchers [8]. As a possible plan to meet the future demand and to convert disposable material into a valuable renewable resource, it is necessary to recover these precious metals from waste. There are conventional hydrometallurgical processes that have been used for the recovery of Au and Pd. These include solvent extraction [9,10], ion-exchange [11,12], co-precipitation [13], reverse osmosis [14], and membrane filtration [15,16]. However, these conventional hydrometallurgical processes suffer from numerous drawbacks such as being laborious, having incomplete recovery, and the generation of toxic sludge or by-products [17,18]. Therefore, adsorption-based techniques have been used as alternative hydrometallurgical methods to address the above-mentioned limitations [17,18,19]. Adsorptive recovery of precious metals has gained more attention due to its simplicity, high efficiency, and wide-range availability. As a result, various adsorbents have been used for the recovery of precious metals. These include metal–organic frameworks [19], chitosan derivatives [7], activated carbon [20], HS-PAN fibres [21], direct-contact membrane distillation (DCMD) [22], Mo–Co–Ni/Al2O3 [23], and Fe3O4 nanoparticles [1,24].
Layered double hydroxides (LDHs) are evolving as effective adsorbent materials for various applications [25,26,27]. LDHs are a class of two-dimensional nanostructured anionic clays [28]. They have wide applications due to their properties such as stability, simple preparation, low cost, high specific area, high adsorption affinity, high exchange capacity, and negatively charged surface [25,29,30]. In spite of the above properties, there are problems associated with layered double hydroxide, which need to be resolved [31]: first, to enhance its adsorption capacity and other features; secondly, to meet specific requirements for wider applications such as extraction, adsorption, and recovery of metals or efficient separation of biomaterials [32,33]. To attain the above-mentioned requirements, incorporation of other functional materials during their synthesis is needed. Metal–organic frameworks (MOFs) have been favoured among many other materials for modification of LDH due to their thermal and hydrothermal stability [34]. Amongst numerous types of MOFs that have been reported in the literature, zeolite imidazolate frameworks (ZIFs) have been favoured compared with other types of MOFs because of their attractive properties. These include porous crystalline structures, and chemical and thermal stability [35,36,37]. Therefore, it is expected that the combination of LDHs and MOFs could enhance the performance of the resulting composite.
In this paper, a simple and rapid µ-solid-phase extraction (µSPE) method based on a Zn–Al–LDH@ZIF–8 nanocomposite was developed to recover gold and palladium from GM ore and concentrates. The objectives were to: (1) prepare and characterise the Zn–Al–LDH@ZIF–8 nanocomposite and (2) apply the nanocomposite for the recovery of gold and palladium prior to their determination using ICP-MS. The choice of adsorbent was based on advantages possessed by both LDH and ZIF-8, which are the large surface area, ion exchange, porous crystalline structure, and better thermal, hydrothermal, and chemical stabilities. In addition, considering the attractive properties of LDH, we reasoned that Zn–Al–LDH nanostructures are expected to be a superior support material for in situ growth of ZIF-8, thus increasing the affinity of Au and Pd ions towards the nanocomposite. Even though LDH/MOF composites have been reported in the literature, the application of the Zn–Al–LDH@ZIF–8 nanocomposite for extraction and recovery of Au and Pd has not been reported. Finally, the effectiveness of the Zn–Al–LDH@ZIF–8 nanocomposite was investigated by applying the developed method in the recovery of gold and palladium from mine soil waste and reference materials.
2. Materials and Methods
2.1. Materials
All reagents used were of analytical grade unless stated otherwise in the methods, and ultra-pure deionised water (type 1 with 18 MΩ cm−1 resistivity) were used for the entire study. Sodium hydroxide solution was obtained from Associated Chemical Enterprises, (Pty) Ltd. (Johannesburg, South Africa) and was used in pH adjustments. Zinc nitrate hexahydrate (Zn(NO3)2·6H2O), sodium chloride (NaCl), potassium bromide (KBr), aluminium nitrate (Al(NO3)3), 2-methylimidazole, nitric acid (HNO3, Trace SELECT, for trace analysis, 69.0% wt), hydrochloric acid (HCl, Trace SELECT, for trace analysis, fuming, ≥37%), absolute ethanol, and sodium formate (HCOONa) were used for the synthesis of the Zn–Al–LDH@ZIF–8 nanocomposite, acquired from Sigma-Aldrich (St. Louis, MO, USA).
2.2. Instrumentation
The sample pH was measured using the H1 9811–5 pH meter (HANNA Instruments Ltd, Smithfield, RI, USA) and adjusted using 1 mol L−1 of HCl or NaOH solutions. The porosity and surface area of the nanocomposite were investigated using the Surface Area and Porosity Analyzer (ASAP2020 V3. 00H, Micrometrics Instrument Corporation, Norcross, GA, USA). The nitrogen adsorption/desorption isotherm (Brunauer, Emmett, and Teller (BET)) was used for the determination of surface properties of the adsorbent. During the analysis, the Zn–Al–LDH@ZIF–8 nanocomposite was degassed with nitrogen gas at 90 °C for 12 h. The surface properties measurements were recorded at 195.8 °C and the adsorption curves with the BJH model were used to calculate the pore volumes and sizes. The morphological characteristics and elemental composition of the adsorbent were assessed using SEM (TESCAN VEGA 3 XMU, LMH instrument, Brno, Czech Republic) coupled with EDS. The SEM instrument was operated at a 20 kV accelerating voltage and the working distance of 15 cm. The images were recorded using a secondary electron detector (SED). Before analysis, the SEM specimens were fixed with a double-coated carbon tap followed by the addition of small amounts of the samples. To improve the conductivity of the material, the samples were carbon-coated using the Agar Turbo Carbon coater.
A PerkinElmer spectrum 100 FTIR (Waltham, MA, USA) was used to investigate the functional groups on the surface of the adsorbent. First, portions of the adsorbents were mixed with KBr and compressed to form desired pellets. The FTIR spectra data collection was performed in the wavenumber range from 400 to 4000 cm−1. The morphology of the nanomaterials was further investigated using the Jeol JEM-2100F TEM equipped with a charge-coupled device (CCD) digital camera and LaB6 source. Before TEM analysis, small portions of the adsorbents were dispersed in ethanol using an ultrasonic bath. The suspension was then dispersed onto the TEM grid (200 mesh size Cu-grid). The TEM images of the materials were acquired by operating the instrument at 200 kV. The zeta potential of the nanocomposite was measured using a Nano ZS Zetasizer (Malvern Instruments Limited, Malvern, Worces, UK). Series of samples were prepared by placing 0.1 g of adsorbent in 100 mL of 0.10 mol L−1 of NaCl at different pH values (3–12) adjusted using 0.1 mol L−1 of HCl and NaOH solutions. The samples were shaken uninterruptedly for 24 h at room temperature. Thereafter, the samples were analysed using a Nano ZS Zetasizer.
The crystalline and XRD patterns of the Zn–Al–LDH@ZIF–8 nanocomposite were investigated using the PANayltical X’Pert Pro XRD instrument (PANalytical Company, Almelo, The Netherlands) fitted with a 10 mm programmable divergence slit, a sample spinner (Spinner PW3064 with rotation time of 1 s), and a 1D X’Celerator detector. The instrument was also equipped with a Cu Kα (λ = 0.15405 nm) X-ray radiation source operated at 40 kV and 40 mA. The fine-powdered samples were placed onto a silicon sample holder and the XRD measurements were recorded at 2θ values starting from 10 to 100°. X’Pert HighScore Plus V3 software was used for the analysis of the collected raw data. The determination of Au(III) and Pd(II) ions recovered from the sample solution was achieved using an Agilent 7900 ICP-MS (Agilent Technologies Inc., Tokyo, Japan) with the Ultra High Matrix Introduction (UHMI) option and He cell gas option. The operating parameters for each element were set as recommended by the manufacturer.
2.3. Synthesis of Zn-Al LDH and Zn–Al–LDH@ZIF–8 Nanocomposites
Zn-Al LDH was prepared by the co-precipitation method, which was previously reported in the literature with some amendments [37]. Briefly, a solution of containing Zn and Al nitrates (at a concentration of 0.15 mol L−1) was prepared in 100 mL of deionised water. The pH of the solution was adjusted and kept constant at 10.0 by the addition of dilute NaOH (2 mol L−1) solution under vigorous stirring. The resulting slurry was maintained at 70 °C for 24 h in a water bath. Then, the white precipitate was recovered by centrifugation (3400 revolution), washed with deionised water 5 times, and dried at 80 °C overnight. The obtained samples were labelled as Zn–Al–LDH.
The Zn–Al–LDH@ZIF–8 nanocomposite was prepared according to previous studies [37,38] with minor modification. To describe the method briefly, 405 mg portions of HCOONa and 750 mg of 2-methylimidazole were dissolved in 60 mL of methanol under constant stirring. A portion of dried LDH (360 mg) was added to the above solution under constant stirring for 30 min and the mixture was maintained in a water bath at 60 °C for 4 h. The product was separated by centrifugation, washed with water and methanol several times, and dried at 50 °C for 12 h. The obtained powder was denoted as the Zn–Al–LDH@ZIF–8 nanocomposite. For the synthesis of ZIF-8, the same procedure was followed without the addition of dried LDH. It should be noted that to produce larger amounts of the nanocomposite, the starting materials were upscaled.
2.4. Dispersive µ-Solid-Phase Extraction Method for Recovery of Au and Pd Ions
The extraction and recovery of Au(III) and Pd(II) ions were carried out by placing different masses of the adsorbent (50–200 mg) in sample bottles containing 50 mL of 500 µg L−1 of Pd and Au solution (pH 2–9, adjusted with 0.01 mol L−1 of HCl or NaOH). The adsorption process was achieved by ultrasonication for 5–30 min. The adsorbed analytes were recovered using 0.5–3.0 mol L−1 of HNO3-HCl (equimolar) mixture and analysed with ICP-MS. The optimisation of the extraction and recovery process was achieved using a central composite design. The most influential variables were mass of adsorbent (MA), sample pH, and extraction time (ET), where their minimum (-), central (0), and higher (+) levels are presented in Table 1. The experiments were carried out in a random manner to eliminate systematic errors.

Table 1.
Range of independent variables.
2.5. Batch Adsorption Experiments
To understand the type of adsorption occurring in the recovery of Pd and Au, equilibrium studies were conducted. This was performed by adding 150 mg of the Zn–Al–LDH@ZIF–8 nanocomposite into a 250 mL solution (pH = 3.5) containing Pd(II) and Au(III) at accurate initial concentrations in the range of 1–100 mg L−1. The mixture was sonicated for 20 min. After equilibrium was reached, the samples were filtered, and the unadsorbed analytes were analysed by ICP-MS after appropriate accurate dilutions. The adsorption capacity (qe) was calculated using Equation (1).
The equilibrium data explained two commonly used adsorption isotherms, that is, Langmuir and Freundlich models. The linearised mathematical expression was adopted from the literature [26,35].
2.6. Regeneration and Stability Studies
The desorption of metal ions adsorbed on the surface of the adsorbent was achieved using 2 mol L−1 of HCl-HNO3 (2.0 mL). Ten millilitres of desorption solution were added to 50 mL reagent bottles containing the adsorbent loaded with Au(III) and Pd(II). The samples were sonicated for 10 min. The desorbed metal ions from the adsorbent were analysed by ICP-MS. All the experiments were carried out in triplicate.
2.7. Application to Real Samples
An amount of 1.0 g of soil sample was accurately weighed and placed in a 50 mL digestion tube. Then, 10 mL of aqua regia (1 mol HNO3: 3 mol HCl) and 5 mL of the concentrated H2O2 were added. The sample was then digested for 60 min at 120 °C using the Digi block. The resulting solution was diluted to 50 mL using deionised water. The explained recovery procedure was carried out using the optimised method.
3. Results and Discussion
3.1. Characterisation of the Nanocomposite
3.1.1. X-ray Diffraction (XRD) Analysis
Figure 1 displays XRD patterns corresponding to Zn−Al−LDH, ZIF−8, and Zn–Al–LDH@ZIF–8 nanocomposites. As can be seen in Figure 1A, the XRD patterns display diffraction peaks of Zn–Al–LDH at 2θ = 11.6°, 23.4°, 34.8°, and 60.4° [39,40], belonging to (003), (006) (009), and (110) planes, respectively. These diffraction peaks are characteristic of a crystalline Zn–Al–LDH material [39]. Figure 1B shows the diffraction peaks at 2θ = 9.81°, 10.27°, and 12.67° corresponding to (011), (002), and (112) planes, respectively, which confirmed the formation of highly crystalline ZIF-8 [37,41,42,43]. This is in agreement with the previous studies [34]. The XRD pattern of the Zn–Al–LDH@ZIF–8 nanocomposite is shown in Figure 1C, with peaks corresponding to those of Zn–Al–LDH and ZIF-8, which reveal evidence for the prepared composite and are in agreement with the literature [37,38,39].
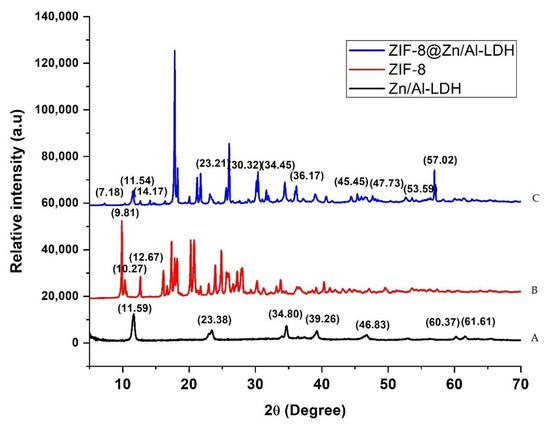
Figure 1.
XRD pattern of (A) Zn–Al–LDH, (B) ZIF-8, and (C) Zn–Al–LDH@ZIF–8 nanocomposites.
3.1.2. Fourier-Transform Infrared Spectroscopy
Figure 2 shows the FTIR spectra of Zn−Al−LDH, ZIF−8, and Zn–Al–LDH@ZIF–8 nanocomposites. Figure 2A shows four characteristic peaks of ZIF-8 at 2926 cm−1, 1600 cm−1, 1145 cm−1, and 995 cm−1, which were assigned to vibrations of C=H, C−N, and C−N in the imidazole ring, respectively [34,41]. In Figure 2B, a broad and strong peak at 3426 cm−1 associated with the stretching vibration of OH groups of LDH and interlayer molecules was observed [44]. Furthermore, other characteristics peaks confirming the successful synthesis of Zn−Al−LDH were observed at 1635 cm−1 (bending vibration mode of water molecules), 1360 cm−1 (stretching vibration of the interlayer nitrate ions), and 800–400 cm−1 (M−O stretching modes and M−O−H bending vibrations, M = metal) [30,44,45].
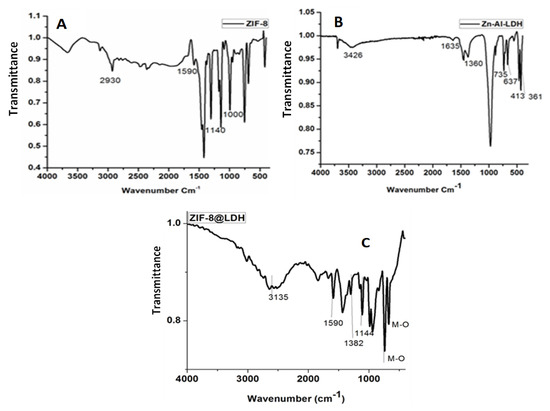
Figure 2.
The FTIR spectrum of (A) ZIF–8, (B) Zn–Al–LDH, and (C) Zn–Al-LDH@ZIF–8 nanocomposite.
The FT-IR spectrum of the nanocomposite is shown in Figure 2C. The broad intense peak between 3500 and 3000 cm−1 is related to the overlapping stretching vibration of the OH and N-H bond [42,46,47]. The peaks at 1590 cm−1 and 1457 cm−1 are assigned to the C-N stretching mode and entire ring stretching [43]. These findings confirmed the incorporation of ZIF−8 in the LDH matrix. The weak peak between 2000 and 1600 cm−1 can be attributed to bending vibration of the interlayer LDH [47]. The absorption at 1381 cm−1 is attributed to the asymmetric stretching nitrate ions of the interlayer, confirming the presence of the LDH structure in the nanocomposite [42]. Furthermore, the peaks observed between 1200 and 900 cm−1 are associated with aromatic sp2 C-H bending and the anti-symmetric deformation mode of NO3− anions, respectively [39]. Finally, the peaks located at 500 cm−1 and lower are attributed to the metal oxide bonds (Al−O, Zn-Al−OH translation, and the Al−OH deformation) [42,43,47].
3.1.3. Scanning Electron Microscopy/Energy-Dispersive X-ray Spectroscopy
The morphological features and elemental composition of the Zn–Al–LDH@ZIF–8 nanocomposite and ZIF-8 were investigated using SEM and EDS. Figure 3A illustrates the SEM image and EDS spectrum of the Zn–Al–LDH@ZIF–8 nanocomposite. The SEM image of the nanocomposite revealed semi-spherical structures with rough surfaces confirming the in situ growth of ZIF−8 onto the Zn−Al−LDH material. In addition, the EDS spectrum shows that the nanocomposite was composed of Zn, N, C, O, and Al, which could be attributed to the elemental composition of LDH and ZIF−8. In contrast, Figure 3B shows smooth ZIF-8 crystalline structures. These observations suggest the successful synthesis of the nanocomposite and they are in agreement with the previously reported results by [43].
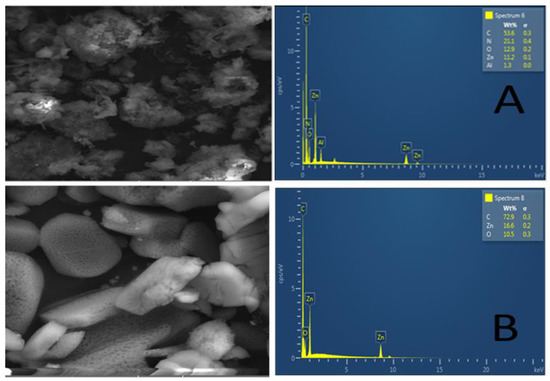
Figure 3.
SEM and EDX images of (A) Zn–Al–LDH@ZIF–8 nanocomposite and (B) ZIF-8.
3.1.4. Transmission Electron Microscopy (TEM) Image of Zn–Al–LDH@ZIF–8 Nanocomposite
The morphology of the synthesised nanocomposite was investigated using TEM. As presented in Figure 4, there were spherical-shaped nanoparticles on the surface of Zn–Al–LDH after the in situ growth of ZIF-8 onto the surface of Zn–Al–LDH. The TEM image (scale = 200 nm and 100 nm) reveals that the surface of the LDH was mostly covered with ZIF-8. However, with a different magnification (scale = 50 nm), the TEM image reveals that some part of the Zn–Al–LDH surface was naked, suggesting that ZIF-8 was not uniformly distributed. This observation might be due to some reaction conditions or the formation of side products that could affect the growth of ZIF-8 nanostructures onto the surface of Zn–Al–LDH. Despite these observations, the TEM images confirmed the formation of the Zn–Al–LDH@ZIF–8 nanocomposite and the results are in agreement with the literature [37].
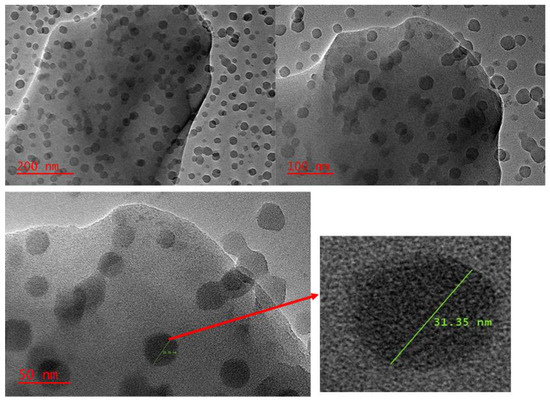
Figure 4.
TEM image of ZIF-8@LDH nanocomposite at different scales.
3.1.5. N2-Adsorption/Desorption Analysis
The specific surface area and pore volume of the Zn–Al–LDH, ZIF-8, and Zn–Al–LDH@ZIF–8 nanocomposite are presented in Table 2. As seen, the surface area of the composite had a noticeably high specific surface area, with a value of 1032 m2/g suggesting that the prepared composite is a good candidate for the adsorption recovery of Au and Pd. The surface area was slightly lower than that of pristine ZIF-8 and significantly higher than that of Zn–Al–LDH. These finding confirmed the successful combination of ZIF-8 and LDH. These surface characteristics are comparable to those reported by [37,48].
Table 2.
Porosity characteristics of Zn–Al–LDH, ZIF–8, and Zn–Al–LDH@ZIF–8 nanocomposites.
The nitrogen adsorption/desorption isotherms of ZIF-8 and Zn–Al–LDH@ZIF–8 nanocomposite are presented in Figure 5. This figure revealed that both materials displayed a long and narrow hysteresis loop at P/P0 ranging from 0.4 to 1.0, which is a typical type IV isotherm as defined by the IUPAC classification [37]. These findings confirm the existence of mesopores [37,48]).
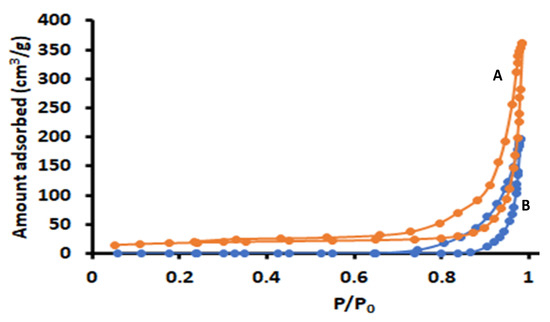
Figure 5.
Nitrogen adsorption/desorption isotherms of (A) ZIF-8 and (B) Zn–Al–LDH@ZIF–8.
3.1.6. Zeta Potential Experiments
Zeta potential experiments were carried out to gain more insight about the surface science of the prepared Zn–Al–LDH@ZIF–8 nanocomposite. The zeta potential results against the pH of the solution, between pH 3 and 12, are presented in Figure 6. As seen, the surface charge of the Zn–Al–LDH@ZIF–8 nanocomposite was positively charged from low pH values up to about pH 8.2, which is the pHpzc of the adsorbent. In addition, the surface remained negative at pH > 8.2. The pHpzc values for the individual components (that is, ZIF-8 and Zn-Al–LDH) were 8.5 and 10.3. According to Figure 6, the unmodified Zn–Al–LDH exhibited a positive surface in a wide pH range as compared to ZIF-8 and the nanocomposite. This was attributed to a positively charged LDH structure as well as hydroxide groups on its surface. The decrease in the structural charge of the Zn–Al–LDH@ZIF–8 nanocomposite could be due to the neutralisation process that took place after in situ growth of ZIF-8 onto Zn–Al–LDH. This significant change in the pHpzc value of the nanocomposite is the indication that ZIF-8 significantly changed the surface charge of Zn–Al–LDH, thus forming a new material with different surface properties.
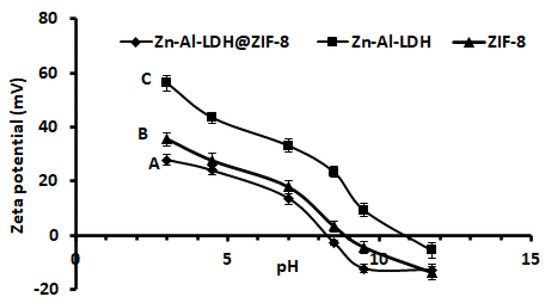
Figure 6.
Graph of pH vs. zeta potential for (A) Zn–Al–LDH@ZIF–8 nanocomposite, (B) ZIF–8 and (C) Zn–Al–LDH.
3.2. Optimisation
3.2.1. Selection of an Adsorbent
The selection of a suitable adsorbent for the adsorption of Au and Pd from acidic solutions was investigated. Figure 7 demonstrates that the adsorption capacities of Zn–Al–LDHs and ZIF-8 for Au and Pd were around 31–37 mg g−1 and 45–51 mg g−1, respectively, which were considerably lower than that of the Zn–Al–LDH@ZIF–8 nanocomposite (Figure 7). The increase in the adsorption capacity of Zn–Al–LDH@ZIF–8 could be due to the combination of ZIF-8 and Zn/Al-LDH.
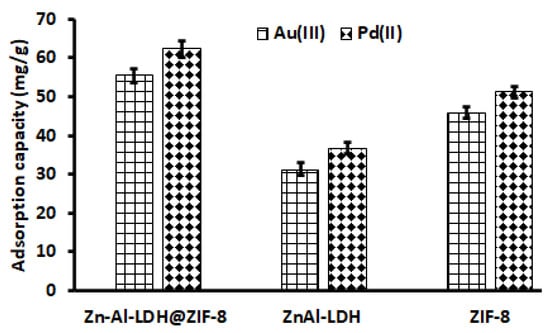
Figure 7.
Selection of adsorbent. Experimental conditions: Mass of adsorbent, 100 mg; eluent concentration, 2 mol L−1; initial concentration, 500 µg L−1; eluent volume, 10 mL; extraction time, 20 min; desorption time, 5 min; sample pH, 3.5; sample volume, 25 mL.
3.2.2. Choice of Elution Solution
The selection of elution solution for the desorption of analytes on the adsorbent is one of the most important factors in the recovery of Au(III) and Pd(II) ions. Therefore, the suitability of HNO3, HCl, and a mixture of the two acids at 2.0 mol L−1 was assessed for the desorption of adsorbed Au(III) and Pd(II) onto the Zn–Al–LDH@ZIF–8 nanocomposite. As seen in Figure 8, the percentage recoveries of target analytes were higher when using HCl (≥75%) as compared to HNO3 (except for Au). However, quantitative desorption (≥90%) was achieved for the HNO3-HCl mixture. Therefore, the HNO3-HCl mixture was used for further studies.
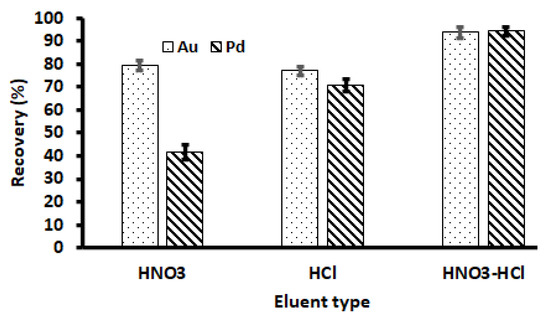
Figure 8.
Selection of eluent type. Experimental conditions: mass of adsorbent, 100 mg; eluent concentration, 2 mol L−1; initial concentration, 500 µg L−1; eluent volume, 10 mL; extraction time, 20 min; desorption time, 5 min; sample pH, 3.5; sample volume, 25 mL.
3.2.3. Response Surface Methodology (RSM) Based on Central Composite Design (CCD)
A central composite design (CCD) was used for the optimisation of most influential factors affecting the adsorption of Au(III) and Pd(II) ions onto the nanocomposite and their desorption from the adsorbent. The independent parameters include sample pH, extraction time (ET), mass of adsorbent (MA), and eluent concentration (EC). These parameters were investigated at five levels, that is, from lowest to highest (Table S1). The resulting design matrix was composed of sixteen factorial design points, two central points, and eight axial points (Table S1). The results in Table S1 were computed using Statistica software (Version 13.5) and analysis of variation (ANOVA) was used to evaluate the statistical significance of each independent variable. The linear form of the main variables and their interactions were evaluated using a 95% confidence level.
The ANOVA results were presented in the form of a Pareto chart (Figure 9). In the Pareto chart, the red line represents the 95% confidence limit, while the bars represent the independent parameters and their interaction [35]. As seen in Figure 9B, MA, ET, and EC were significant for the extraction of Au(III) ions, while Figure 9B reveals that only MA was statistically significant for the adsorption of Pd(II). Furthermore, Figure 9 shows that EC, ET, and MA had a positive effect, implying that, for the better adsorption, the independent variable must be increased towards the maximum level. The bar lengths for MA, ET, and EC were more prominent, suggesting that they played a major role in the adsorption process. As seen, sample pH as well as interactions were not significant at the 95% confidence level for both Au(III) and Pd(II) ions.
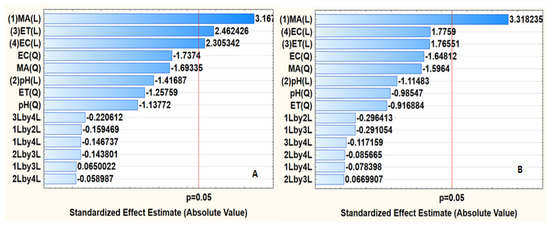
Figure 9.
Pareto chart of standardised effects: (A) Au(III) and (B) Pd(II). MA = mass of adsorbent, ET = extraction time, EC = eluent concentration, 1Lby2L = interaction between MA and pH, 1Lby3L = interaction between MA and ET, 1Lby4L = interaction between MA and EC, 2Lby3L = interaction between pH and ET, 2Lby4L = interaction between pH and EC, 3Lby4L = interaction between ET and EC, Q represents quadratic interactions.
Three-dimensional (3D) response surface plots (Figure 10) were used to study the interaction between two parameters (while the others were fixed at their central points) to obtain maximum percentage recovery. The effects of sample pH with other parameters on the adsorption of Au(III) and Pd(II) ions are observed in Figure 10A,D,E. From these plots, it is evident that the extraction efficiency increased when the sample pH was below 5.0. The adsorbent has two pHpzc values: 4.7 and 9.5. When the sample pH was less than pHpzc, the nanocomposite surface had a net positive charge, while above pHpzc, the surface of the adsorbent was negatively charged [49]. According to the literature, the main species of Au(III) and Pd(II) are AuCl4− and PdCl3− at pH values lower than 3.0 [49]. Furthermore, the increase in pH of the solution from 3.0 to 5.0 facilitates the formation of AuCl3(OH)− and AuCl2(OH)2− as well as Pd(OH)42− [49]. Therefore, high extractions of Au(III) and Pd(II) at pH values less 5.0 were attributed to electrostatic interactions between the positive surface of the adsorbent and negatively charged analytes. Figure 10A–C illustrate the 3D plots describing the effects of the mass of the adsorbent combined with other variables: the extraction and recovery of target analytes. The analytical response increased with increasing mass of the adsorbent, suggesting that more active sites were available for the adsorption of Au(III) and Pd(II) ions. The effect of contact time revealed that quantitative extraction of analytes was achieved in 20 min (Figure 10B,D,F). Lastly, Figure 10C,E,F reveal that increasing eluent concentration results in high recoveries.
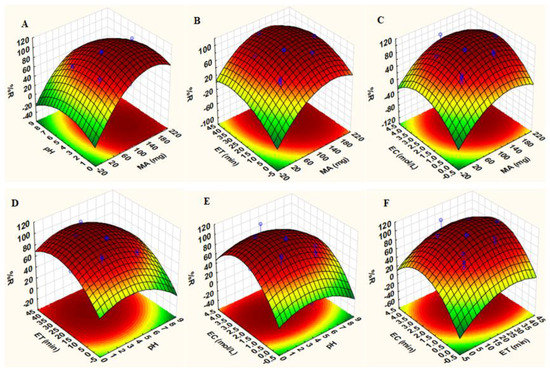
Figure 10.
3D response surface plots of precious elements: Interactions between: (A) sample pH and mass of adsorbent (MA) while fixing extraction time (ET) and eluent concentration (EC) at central points, (B) ET and MA while fixing pH and EC at central points, (C) EC and MA while fixing pH and ET at central points, (D) ET and pH while fixing MA and EC at central points, (E) EC and pH while fixing MA and ET at central points, (F) ET and EC while fixing pH and MA at central points (Table 1).
For simultaneous optimisation of independent variables, the desirability function was used. The desirability function is the optimisation method in which the predicted responses are converted into a dimensionless desirability value, D [50,51,52]. According to previous studies, the desirability function scale ranges between D = 0 (an undesired response) and D = 1 (acceptable or desired response) [50,51,52]. In this study, the optimum values for the investigated independent variables (mass of adsorbent, sample pH, extraction time, and eluent concentration) were achieved using the highest desirability, D = 1.0. As seen in Figure 11, the corresponding optimum conditions: extraction and recovery of Au(III) and Pd(II), were 100 mg, 3.5, 20 min, and 2.0 mol L−1 for mass of adsorbent, sample pH, extraction time, and eluent concentration, respectively. The obtained optimum conditions were validated experimentally to confirm the validity of the RSM model. The experimental responses (99.1 ± 1.4, n = 6) were in close agreement with the predicted % recovery (101%), suggesting that the desirability was valid. Therefore, the obtained optimum conditions were used for further studies.
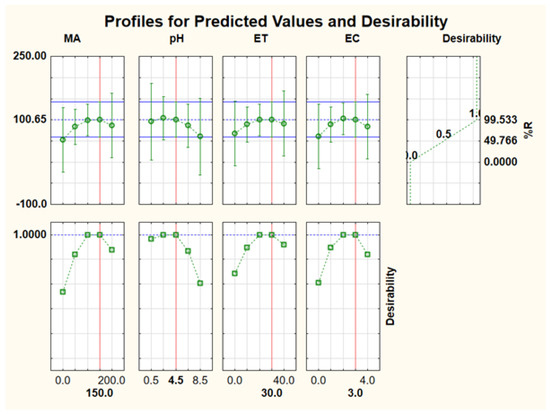
Figure 11.
Profile of predicted values and desirability for optimisation of experimental parameters affect the extraction and recovery of Au(III) and Pd(II).
3.3. Batch Adsorption Studies
Under optimum conditions, the maximum adsorption capacity of the adsorbent was investigated. This was performed to determine the amount of analyte required for quantitative extraction of Au(III) and Pd(II) ions. Following the procedure in Section 2.5, the equilibrium data (Figure S1) showed that the degree of adsorption was directly proportional to the concentration of Au(III) and Pd(II) ions until it reached the saturation point. The data were fitted to Langmuir and Freundlich isotherm models. Linearised plots of the isotherm models for adsorption of Au(III) and Pd(II) ions onto the Zn–Al–LDH@ZIF–8 nanocomposite are presented in Figures S2 and S3. The values of parameters relating to Langmuir and Freundlich isotherms were estimated using the intercept and slope of linearised isotherm plots (Table 3). It can be seen from this table that the correlation of determination values for Langmuir models was higher than those of the Freundlich isotherm. This suggested that the adsorption data were better explained by the Langmuir isotherm model. The values of maximum adsorption capacities (qmax) were found to be 163 mg g−1 and 177 mg g−1 for Au(III) and Pd(II), respectively.
Table 3.
Parameters of Langmuir and Freundlich isotherm models for adsorption of Au(III) and Pd(II) ions onto Zn–Al–LDH@ZIF–8 nanocomposite.
The adsorption capacities of the current adsorbent for the target analytes were compared with others that are reported in the literature (Table 4). As seen, the nanocomposite had a higher adsorption capacity compared to those reported elsewhere [51,53,54]. Furthermore, the Zn–Al–LDH@ZIF–8 nanocomposite had comparable adsorption capacity for Au(III) and Pd(II) with previous studies [50]. However, its capacity towards the adsorption of Au(III) and Pd(II) ions was lower than those reported in the literature [48,49,53,55,56]. The differences between the adsorption capacities might be due different physicochemical properties of the adsorbent, as well as affinity of the adsorbent towards the target analytes. This suggests that there is a need to increase the affinity of the adsorbent towards Au and Pd by incorporating suitable functional groups.
Table 4.
Comparison of the adsorption capacities of Zn–Al–LDH@ZIF–8 on different sorbents.
3.4. Effect of Interfering Ions
The selectivity of the Zn–Al–LDH@ZIF–8 nanocomposite towards the recovery of 500 μg L−1 of Au(III) and Pd(II) was investigated in the presence of base metals at different concentrations (Al, Cu, Co, Ni, Mg, Ca, Mn, Fe, K, and Zn). The results revealed that the recovery of target precious metals could be achieved even at high concentrations of base metals. This might be because the adsorption of Au and Pd was achieved when the surface of the adsorbent had a positive surface, which led to electrostatic repulsion of positively charged base metals. These results proved that the Zn–Al–LDH@ZIF–8 nanocomposite could be a good candidate for the recovery of PGMs from secondary sources.
3.5. Recovery of Au(III) and Pd(II) from PGM Ore and Concentrate
The accuracy and feasibility of the proposed method were tested using South African Reference Materials (SARM 186 and SARM 107). The SARM portion was first digested using the manufacturer’s recommended methods. This was performed to solubilise the analytes of interest. The obtained analytical results are shown in Table 5 and the concentrations of Au(III) and Pd(II) by the present method agreed with both certified values of SARM 186 and SARM 107. The recoveries ranged from 93.4 to 95.7% and from 92.7 to 99.6% for gold and palladium, respectively.
Table 5.
Analytical results (mg kg−1) of Pd(II) and Au(III) in the South African reference materials (SARM (186 and 107)).
3.6. Effect of other PGMs Present in Ore Samples on the Extraction and Recovery of Au(III) and Pd(II)
Ore samples used in this study were found to contain elements other than gold and palladium (Table 6). Therefore, the effect of these coexisting ions was on the adsorption, and the recovery of Au(III) and Pd(II) was studied using the optimised method. The results obtained are presented in Table 6. The recoveries of most coexisting ions were found to be less than 5% except for Pt (32–38%). As observed in Section 3.4, most of the base metals present in the ores were not detected, and this might be due to electrostatic repulsion between the positive sites of the adsorbent and the cations. The results for Pt(IV) suggest that there was a competition for active sites with Au and Pb, suggesting that for higher masses of the adsorbent, the simultaneous recovery of Au, Pd, and Pt is possible.
Table 6.
Effect of other PGMs present in ore samples on the extraction and recovery of Au(III) and Pd(II).
3.7. Regeneration and Stability
It is crucial to determine the regeneration and stability of a promising adsorbent for recovery of precious metals. As presented in Figure 12, no obvious drop in the recovery percentage was observed even after four conservative adsorption–desorption cycles. However, after the fifth and sixth cycle, the recovery declined by 6–9%. The slight decline could be due to partial damage of sorption sites that might occur during the regeneration process. Therefore, the excellent regeneration and stability of Zn–Al–LDH@ZIF–8 make it a potential adsorbent for the recovery of precious metals from waste materials. Other than the advantages, this adsorbent has other merits such as a simple and mild preparation process, and low adsorbent dosage as well as no secondary pollution.
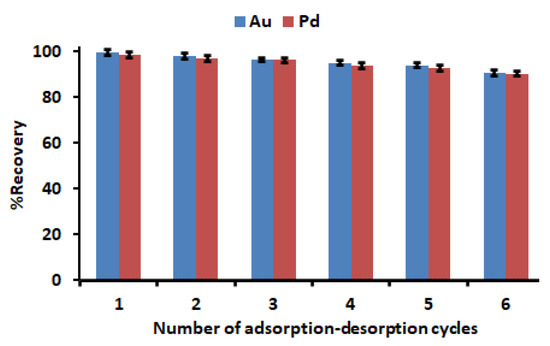
Figure 12.
Regeneration and stability studies. Experimental conditions: mass of adsorbent, 150 mg; HNO3 -HCl mixture at concentration, 2 mol L−1; initial concentration, 500 µg L−1; extraction time, 30 min; desorption time, 5 min; sample pH, 3.5; sample volume, 50 mL.
4. Conclusions
Zeolite imidazole frameworks on a layered double hydroxide (ZnAl-LDH@ZIF-8) nanocomposite were synthesised and used for extraction and recovery of Au(III) and Pd(II) from ore and concentrates. The material effectively removed >90 to 98% of trace amounts of Au(III) and Pd(III) from ore concentrates. Under optimised conditions, the equilibrium studies’ results revealed that the adsorption of Au(III) and Pd(II) ions followed the Langmuir isotherm model with the maximum sorption capacities of 163 mg g−1 and 177 mg g for Au(III) and Pd(II), respectively. The recovery percentage was observed even after three conservative adsorption desorption cycles, confirming the excellent stability of the prepared adsorbent for precious metals recovery. The material possessed relatively good regeneration and stability characteristics, with its performance decreasing by 10% after five adsorption desorption cycles. The reported results indicate that this material can be highly influential in precious metals recovery processes. Although the material presented remarkable performance, the recovery of the adsorbent from the aqueous medium was challenging. Therefore, future work will focus on the application of highly porous magnetic materials based on ZnAl-LDH@ZIF-8 nanocomposites. In addition, future work will also focus on the conversion of recovered Au and Pd into solid form, and the purity of the sold materials will be studied extensively. Finally, the results obtained in this study form a basis for future work on devising new scalable, selective, and eco-friendly adsorbents that can be used on large scales for the recovery of PGMs from secondary resources.
Supplementary Materials
The following supporting information can be downloaded at: https://www.mdpi.com/article/10.3390/separations9100274/s1, Figure S1: Effect of initial Au and Pd concentration on the adsorption capacity of Zn–Al–LDH@ZIF–8 nanocomposite. Experimental conditions: mass of adsorbent dosage = 100 mg, contact time = 20 min, pH = 3.5); Figure S2: Langmuir isotherm model plots for adsorption of Au and Pd onto Zn–Al–LDH@ZIF–8 nanocomposite; Figure S3: Freundlich isotherm model plots for adsorption of Au and Pd onto Zn–Al–LDH@ZIF–8 nanocomposite; Table S1: Central composite design matrix and %recoveries efficiency as an analytical response.
Author Contributions
N.R.B.: Conceptualization, methodology, data curation, formal analysis, validation, writing—original draft, editing. S.J.: methodology, data curation, writing—review and editing. A.M.: writing—review and editing. P.N.N. and R.M.M.: supervision, project administration, funding acquisition, software, data curation, formal analysis, writing—review and editing, supervision, resources. All authors have read and agreed to the published version of the manuscript.
Funding
This project was funded by the Department of Science and Innovation-National Research Foundation South African Research Chair Initiative (NRF-DSI SARChI) funding instrument, grant no. 91230.
Institutional Review Board Statement
Not applicable.
Informed Consent Statement
Not applicable.
Data Availability Statement
The data are included as Supplementary Materials. However, the raw data will be available upon request.
Acknowledgments
The authors wish to acknowledge the financial support from the Department of Science and Innovation-National Research Foundation South African Research Chair Initiative (DSI-NRF SARChI) funding instrument, as well as the University of Johannesburg, Faculty of Science, and Department of Chemical Sciences for laboratory space.
Conflicts of Interest
The authors have no conflict to declare.
References
- Nancharaiah, Y.V.; Mohan, S.V.; Lens, P.N.L. Biological and Bioelectrochemical Recovery of Critical and Scarce Metals. Trends Biotechnol. 2016, 34, 137–155. [Google Scholar] [CrossRef] [PubMed]
- Aghaei, E.; Alorro, R.D.; Encila, A.N.; Yoo, K. Magnetic adsorbents for the recovery of precious metals from leach solutions and wastewater. Metals 2017, 7, 529. [Google Scholar] [CrossRef]
- Cieszynska, A.; Wieczorek, D. Extraction and separation of palladium(II), platinum(IV), gold(III) and rhodium(III) using piperidine-based extractants. Hydrometallurgy 2018, 175, 359–366. [Google Scholar] [CrossRef]
- Jha, M.K.; Lee, J.; Kim, M.; Jeong, J.; Kim, B.-S.; Kumar, V. Hydrometallurgical recovery/recycling of platinum by the leaching of spent catalysts: A review. Hydrometallurgy 2013, 133, 23–32. [Google Scholar] [CrossRef]
- Souza, E.J.D.S.; Amaral, C.D.B.D.; Nagata, N.; Grassi, M.T. Cloud point extractors for simultaneous determination of Pd and Pt in water samples by ICP OES with multivariate optimisation. Microchem. J. 2020, 152, 104309. [Google Scholar] [CrossRef]
- Rzelewska-Piekut, M.; Regel-Rosocka, M. Separation of Pt(IV), Pd(II), Ru(III) and Rh(III) from model chloride solutions by liquid-liquid extraction with phosphonium ionic liquids. Sep. Purif. Technol. 2019, 212, 791–801. [Google Scholar] [CrossRef]
- Chassary, P.; Vincent, T.; Marcano, J.S.; Macaskie, L.E.; Guibal, E. Palladium and platinum recovery from bicomponent mixtures using chitosan derivatives. Hydrometallurgy 2005, 76, 131–147. [Google Scholar] [CrossRef]
- Das, N. Recovery of precious metals through biosorption—A review. Hydrometallurgy 2010, 103, 180–189. [Google Scholar] [CrossRef]
- Hasegawa, H.; Barua, S.; Wakabayashi, T.; Mashio, A.; Maki, T.; Furusho, Y.; Rahman, I.M.M. Selective recovery of gold, palladium, or platinum from acidic waste solution. Microchem. J. 2018, 139, 174–180. [Google Scholar] [CrossRef]
- Othman, N.; Fatiha, N.; Noah, M.; Norimie, R.; Sulaiman, R.; Abdullah, N.A.; Bachok, S.K. Jurnal Teknologi Full paper Liquid-Liquid Extraction of Palladium from Simulated Liquid Waste using Phosphinic Acid as a Carrier. J. Teknol. 2014, 5, 41–45. [Google Scholar]
- Hubicki, Z.; Wołowicz, A.; Leszczyńska, M. Studies of removal of palladium(II) ions from chloride solutions on weakly and strongly basic anion exchangers. J. Hazard. Mater. 2008, 159, 280–286. [Google Scholar] [CrossRef]
- Murakami, H.; Nishihama, S.; Yoshizuka, K. Separation and recovery of gold from waste LED using ion exchange method. Hydrometallurgy 2015, 157, 194–198. [Google Scholar] [CrossRef]
- Mpinga, C.N.; Eksteen, J.J.; Aldrich, C.; Dyer, L. Direct leach approaches to Platinum Group Metal (PGM) ores and concentrates: A review. Miner. Eng. 2015, 78, 93–113. [Google Scholar] [CrossRef]
- Gwak, G.; Kim, D.I.; Hong, S. New industrial application of forward osmosis (FO): Precious metal recovery from printed circuit board (PCB) plant wastewater. J. Membr. Sci. 2018, 552, 234–242. [Google Scholar] [CrossRef]
- Sharma, R.K.; Pandey, A.; Gulati, S.; Adholeya, A. An optimized procedure for preconcentration, determination and on-line recovery of palladium using highly selective diphenyldiketone-monothiosemicarbazone modified silica gel. J. Hazard. Mater. 2012, 209–210, 285–292. [Google Scholar] [CrossRef]
- Soylak, M.; Tuzen, M. Coprecipitation of gold(III), palladium(II) and lead(II) for their flame atomic absorption spectrometric determinations. J. Hazard. Mater. 2008, 152, 656–661. [Google Scholar] [CrossRef]
- Fungene, T. Effluent treatment: What role can modified waste/biomass play in the local platinum industry—A review. In Proceedings of the 4th International Platinum Conference, Sun City, South Africa, 11–14 October 2010. [Google Scholar]
- Devi, A.; Singhal, A.; Gupta, R.; Panzade, P. A study on treatment methods of spent pickling liquor generated by pickling process of steel. Clean Technol. Environ. Policy 2014, 16, 1515–1527. [Google Scholar] [CrossRef]
- Lim, C.-R.; Lin, S.; Yun, Y.-S. Highly efficient and acid-resistant metal-organic frameworks of MIL-101(Cr)-NH2 for Pd(II) and Pt(IV) recovery from acidic solutions: Adsorption experiments, spectroscopic analyses, and theoretical computations. J. Hazard. Mater. 2020, 387, 121689. [Google Scholar] [CrossRef]
- Di Natale, F.; Orefice, M.; la Motta, F.; Erto, A.; Lancia, A. Unveiling the potentialities of activated carbon in recovering palladium from model leaching solutions. Sep. Purif. Technol. 2017, 174, 183–193. [Google Scholar] [CrossRef]
- Liu, J.; Jin, C.; Wang, C. Hyperbranched thiourea-grafted electrospun polyacrylonitrile fibers for efficient and selective gold recovery. J. Colloid Interface Sci. 2020, 561, 449–458. [Google Scholar] [CrossRef]
- Chen, G.; Tan, L.; Xie, M.; Liu, Y.; Lin, Y.; Tan, W.; Huang, M. Direct contact membrane distillation of refining waste stream from precious metal recovery: Chemistry of silica and chromium (III) in membrane scaling. J. Membr. Sci. 2020, 598, 117803. [Google Scholar] [CrossRef]
- Arslanoğlu, H.; Yaraş, A. Recovery of precious metals from spent Mo–Co–Ni/Al2O3 catalyst in organic acid medium: Process optimization and kinetic studies. Pet. Sci. Technol. 2019, 37, 2081–2093. [Google Scholar] [CrossRef]
- Uheida, A.; Iglesias, M.; Fontàs, C.; Hidalgo, M.; Salvadó, V.; Zhang, Y.; Muhammed, M. Sorption of palladium(II), rhodium(III), and platinum(IV) on Fe3O4 nanoparticles. J. Colloid Interface Sci. 2006, 301, 402–408. [Google Scholar] [CrossRef] [PubMed]
- Daud, M.; Kamal, M.S.; Shehzad, F.; Al-Harthi, M.A. Graphene/layered double hydroxides nanocomposites: A review of recent progress in synthesis and applications. Carbon 2016, 104, 241–252. [Google Scholar] [CrossRef]
- Kumar, N.; Reddy, L.; Parashar, V.; Ngila, J.C. Controlled synthesis of microsheets of ZnAl layered double hydroxides hexagonal nanoplates for efficient removal of Cr(VI) ions and anionic dye from water. J. Environ. Chem. Eng. 2017, 5, 1718–1731. [Google Scholar] [CrossRef]
- Mishra, G.; Dash, B.; Pandey, S. Layered double hydroxides: A brief review from fundamentals to application as evolving biomaterials. Appl. Clay Sci. 2018, 153, 172–186. [Google Scholar] [CrossRef]
- Sajid, M.; Basheer, C. Layered double hydroxides: Emerging sorbent materials for analytical extractions. TrAC Trends Anal. Chem. 2016, 75, 174–182. [Google Scholar] [CrossRef]
- Kumar, P.; Gill, K.; Kumar, S.; Ganguly, S.K.; Jain, S.L. Magnetic Fe3O4@MgAl–LDH composite grafted with cobalt phthalocyanine as an efficient heterogeneous catalyst for the oxidation of mercaptans. J. Mol. Catal. A Chem. 2015, 401, 48–54. [Google Scholar] [CrossRef]
- Shan, R.; Yan, L.; Yang, K.; Yu, S.; Hao, Y.; Yu, H.; Du, B. Magnetic Fe3O4/MgAl-LDH composite for effective removal of three red dyes from aqueous solution. Chem. Eng. J. 2014, 252, 38–46. [Google Scholar] [CrossRef]
- Serdechnova, M.; Mohedano, M.; Kuznetsov, B.; Mendis, C.L.; Starykevich, M.; Karpushenkov, S.; Tedim, J.; Ferreira, M.G.S.; Blawert, C.; Zheludkevich, M.L. PEO coatings with active protection based on in-situ formed LDH-nanocontainers. J. Electrochem. Soc. 2017, 164, C36–C45. [Google Scholar] [CrossRef]
- Qu, B.; Luo, Y. Chitosan-based hydrogel beads: Preparations, modifications and applications in food and agriculture sectors—A review. Int. J. Biol. Macromol. 2020, 152, 437–448. [Google Scholar] [CrossRef]
- Zhao, Y.; Wang, Y.; Xiao, G.; Su, H. Fabrication of biomaterial/TiO2 composite photocatalysts for the selective removal of trace environmental pollutants. Chin. J. Chem. Eng. 2019, 27, 1416–1428. [Google Scholar] [CrossRef]
- Kaur, H.; Mohanta, G.C.; Gupta, V.; Kukkar, D.; Tyagi, S. Synthesis and characterization of ZIF-8 nanoparticles for controlled release of 6-mercaptopurine drug. J. Drug Deliv. Sci. Technol. 2017, 41, 106–112. [Google Scholar] [CrossRef]
- Nqombolo, A.; Mpupa, A.; Gugushe, A.S.; Moutloali, R.M.; Nomngongo, P.N. Adsorptive removal of lead from acid mine drainage using cobalt-methylimidazolate framework as an adsorbent: Kinetics, isotherm, and regeneration. Environ. Sci. Pollut. Res. 2019, 26, 3330–3339. [Google Scholar] [CrossRef]
- Zhang, T.; Zhang, X.; Yan, X.; Kong, L.; Zhang, G.; Liu, H.; Qiu, J.; Yeung, K.L. Synthesis of Fe3O4@ZIF-8 magnetic core–shell microspheres and their potential application in a capillary microreactor. Chem. Eng. J. 2013, 228, 398–404. [Google Scholar] [CrossRef]
- Yang, Y.; Yan, X.; Hu, X.; Feng, R.; Zhou, M. In-situ growth of ZIF-8 on layered double hydroxide: Effect of Zn/Al molar ratios on their structural, morphological and adsorption properties. J. Colloid Interface Sci. 2017, 505, 206–212. [Google Scholar] [CrossRef]
- Liu, J.; Song, J.; Xiao, H.; Zhang, L.; Qin, Y.; Liu, D.; Hou, W.; Du, N. Synthesis and thermal properties of ZnAl layered double hydroxide by urea hydrolysis. Powder Technol. 2014, 253, 41–45. [Google Scholar] [CrossRef]
- Seftel, E.M.; Popovici, E.; Mertens, M.; de Witte, K.; van Tendeloo, G.; Cool, P.; Vansant, E.F. Zn–Al layered double hydroxides: Synthesis, characterization and photocatalytic application. Microporous Mesoporous Mater. 2008, 113, 296–304. [Google Scholar] [CrossRef]
- Li, H.; Deng, Q.; Liu, J.; Hou, W.; Du, N.; Zhang, R.; Tao, X. Synthesis, characterization and enhanced visible light photocatalytic activity of Bi2MoO6/Zn–Al layered double hydroxide hierarchical heterostructures. Catal. Sci. Technol. 2014, 4, 1028–1037. [Google Scholar] [CrossRef]
- Wu, C.; Liu, Q.; Chen, R.; Liu, J.; Zhang, H.; Li, R.; Takahashi, K.; Liu, P.; Wang, J. Fabrication of ZIF-8@SiO2 Micro/Nano Hierarchical Superhydrophobic Surface on AZ31 Magnesium Alloy with Impressive Corrosion Resistance and Abrasion Resistance. ACS Appl. Mater. Interfaces 2017, 9, 11106–11115. [Google Scholar] [CrossRef]
- Mahjoubi, F.Z.; Khalidi, A.; Abdennouri, M.; Barka, N. Zn–Al layered double hydroxides intercalated with carbonate, nitrate, chloride and sulphate ions: Synthesis, characterisation and dye removal properties. J. Taibah Univ. Sci. 2017, 11, 90–100. [Google Scholar] [CrossRef]
- Wang, F.; Guo, Z. Insitu growth of ZIF-8 on CoAl layered double hydroxide/carbon fiber composites for highly efficient absorptive removal of hexavalent chromium from aqueous solutions. Appl. Clay Sci. 2019, 175, 115–123. [Google Scholar] [CrossRef]
- Zhang, F.; Du, N.; Zhang, R.; Hou, W. Mechanochemical synthesis of Fe3O4@(Mg-Al-OH LDH) magnetic composite. Powder Technol. 2012, 228, 250–253. [Google Scholar] [CrossRef]
- Ghiasi Moaser, A.; Khoshnavazi, R. Facile synthesis and characterization of Fe3O4@MgAl-LDH@STPOM nanocomposites for highly enhanced and selective degradation of methylene blue. New J. Chem. 2017, 41, 9472–9481. [Google Scholar] [CrossRef]
- Liu, J.; He, J.; Wang, L.; Li, R.; Chen, P.; Rao, X.; Deng, L.; Rong, L.; Lei, J. NiO-PTA supported on ZIF-8 as a highly effective catalyst for hydrocracking of Jatropha oil. Sci. Rep. 2016, 6, 23667. [Google Scholar] [CrossRef]
- Shou, J.; Jiang, C.; Wang, F.; Qiu, M.; Xu, Q. Fabrication of Fe3O4/MgAl-layered double hydroxide magnetic composites for the effective decontamination of Co(II) from synthetic wastewater. J. Mol. Liq. 2015, 207, 216–223. [Google Scholar] [CrossRef]
- Fan, R.; Min, H.; Hong, X.; Yi, Q.; Liu, W.; Zhang, Q.; Luo, Z. Plant tannin immobilized Fe3O4@SiO2 microspheres: A novel and green magnetic bio-sorbent with superior adsorption capacities for gold and palladium. J. Hazard. Mater. 2019, 364, 780–790. [Google Scholar] [CrossRef]
- Liu, L.; Li, C.; Bao, C.; Jia, Q.; Xiao, P.; Liu, X.; Zhang, Q. Preparation and characterization of chitosan/graphene oxide composites for the adsorption of Au(III) and Pd(II). Talanta 2012, 93, 350–357. [Google Scholar] [CrossRef]
- Neyestani, M.R.; Shemirani, F.; Mozaffari, S.; Alvand, M. A magnetized graphene oxide modified with 2-mercaptobenzothiazole as a selective nanosorbent for magnetic solid phase extraction of gold(III), palladium(II) and silver(I). Microchim. Acta 2017, 184, 2871–2879. [Google Scholar] [CrossRef]
- Awual, M.R. Solid phase sensitive palladium(II) ions detection and recovery using ligand based efficient conjugate nanomaterials. Chem. Eng. J. 2016, 300, 264–272. [Google Scholar] [CrossRef]
- Liu, F.; Wang, S.; Chen, S. Adsorption behavior of Au(III) and Pd(II) on persimmon tannin functionalized viscose fiber and the mechanism. Int. J. Biol. Macromol. 2020, 152, 1242–1251. [Google Scholar] [CrossRef] [PubMed]
- Trieu, Q.A.; Pellet-Rostaing, S.; Arrachart, G.; Traore, Y.; Kimbel, S.; Daniele, S. Interfacial study of surface-modified ZrO2 nanoparticles with thioctic acid for the selective recovery of palladium and gold from electronic industrial wastewater. Sep. Purif. Technol. 2020, 237, 116353. [Google Scholar] [CrossRef]
- Shafizadeh, F.; Taghizadeh, M.; Hassanpour, S. Preparation of a novel magnetic Pd(II) ion-imprinted polymer for the fast and selective adsorption of palladium ions from aqueous solutions. Environ. Sci. Pollut. Res. 2019, 26, 18493–18508. [Google Scholar] [CrossRef] [PubMed]
- Feng, B.; Yao, C.; Chen, S.; Luo, R.; Liu, S.; Tong, S. Highly efficient and selective recovery of Au(III) from a complex system by molybdenum disulfide nanoflakes. Chem. Eng. J. 2018, 350, 692–702. [Google Scholar] [CrossRef]
- Kasmiarno, L.D.; Chang, J.S. Adsorption of gold from aqueous systems using microbial thermophilic proteins. J. Eng. Technol. Sci. 2020, 52, 121–135. [Google Scholar] [CrossRef]


Publisher’s Note: MDPI stays neutral with regard to jurisdictional claims in published maps and institutional affiliations. |
© 2022 by the authors. Licensee MDPI, Basel, Switzerland. This article is an open access article distributed under the terms and conditions of the Creative Commons Attribution (CC BY) license (https://creativecommons.org/licenses/by/4.0/).