Abstract
In many countries, thiabendazole is used as a fungicide to prevent the decay of food and to lengthen storage periods. However, in Korea, thiabendazole is unauthorised and does not have standards or specifications for use as a food additive. In this study, a simple analytical method was developed and validated using the HPLC–PDA method to detect thiabendazole in foods frequently consumed in South Korea. The calibration curve was obtained using samples of solid and liquid foods containing banana and citrus fruits containing concentrations in the range of 0.31–20.00 μg/mL with a satisfactory coefficient of determination (R2) of 0.999. The limit of detection (LOD) values for the solid and liquid food samples were 0.009 and 0.017 μg/mL, respectively, and the limit of quantification (LOQ) values were 0.028 and 0.052 μg/mL. The intra-day and inter-day precision values were less than 1.33% (relative standard deviation), and the recoveries of thiabendazole from spiked solid and liquid food samples ranged from 93.61 to 98.08% at concentration levels of 2.5, 5, and 10 μg/mL. In addition, the expanded uncertainties of the measu-rements ranged from 0.57 to 3.12%. These results showed that the developed method was appropriate for the quantitative analysis of thiabendazole in solid and liquid foods containing banana and citrus fruits.
1. Introduction
As the food industry develops, demands for nutritional value, palatability, and convenience are increasing and the consumption of processed foods has increased in tandem [1]. Food additives are used for various purposes in manufacturing, processing, and preserving processed foods [2]. Food additives are substances used in food for sweetening, colouring, bleaching, or preventing oxidation during manufacturing, processing, cooking, or preservation, according to the Ministry of Food and Drug Safety (MFDS) of the Republic of Korea [3]. They also include substances that can be indirectly transferred to food through the disinfection of utensils, containers, and packaging. There are several definitions of food additives given by the US Food and Drug Administration (FDA) [4], the European Parliament and Council, and Codex Alimentarius [5], but food additives are basically substances added to food products to produce a desired technical effect. In Europe, substances are classified according to E numbers [6]. Considering that food additives are frequently used through direct addition to food, it is essential to evaluate their safety [7]. The harmful effects of certain food additives have been reported, and each country designates usable food additives and regulates the amounts used [8].
Fruits are sprayed or immersed in a mixture containing thiabendazole and wax [9]. In most countries, thiabendazole has been designated as a pesticide residue and its residue tolerance levels have been established. In Korea, the residual level of thiabendazole in food is limited to 3 and 10 mg/kg in bananas and citrus fruits, respectively [10]. According to the USA regulation CFR 180.242, the residual level of thiabendazole in food is limited to 3 and 35 mg/kg in bananas and citrus, respectively [11]. The Japan Ministry of Health, Labour, and Welfare (MHLW) restricted the residual level of thiabendazole in food to 3 and 10 mg/kg in bananas and citrus fruits, respectively [12]. Furthermore, post-harvest fungicides are defined as food additives in the Food Sanitation Law of Japan [13]. The types of and usage criteria for food additives differ according to the food culture and industry of each country; therefore, the safety of food additives must be re-evaluated for each country [14], and so a method for analysing thiabendazole residues in food matrices commonly consumed in Korea must be developed and validated.
Method validation is the process of confirming that a developed method is suitable for its intended purpose; it scientifically verifies that the test method has an acceptable probability of judgement error [15]. Regarding method validation, guidelines are provided by the FDA, the Environmental Protection Agency (EPA), Eurachem, and the International Council for Harmonisation of Technical Requirements for Pharmaceuticals for Human Use (ICH). Studies on specificity, linearity, accuracy, precision, limit of detection (LOD), and limit of quantification (LOQ) are commonly included in the guidelines [16]. Thiabendazole possesses various chromophores, such as C=C, N=C, and C-S groups [17]. In addition, Steck et al. [18] reported strong absorption in a range of 244–300 nm after measuring the absorption spectrum of certain benzimidazole derivatives by HPLC–PDA detection.
As a food additive, thiabendazole is widely used as a preservative in fruits and vegetables. Therefore, there have been many studies on thiabendazole analytical methods with respect to fruits and vegetables to classify and manage thiabendazole as residual pesticides. Thiabendazole in fruits and vegetables was analysed using HPLC–UV [19], HPLC–fluorescence [20], UV–Vis spectrophotometry [21], surface-enhanced Raman spectroscopy (SERS) [22], and flow injection tandem mass spectrometry (FIA-MS/MS) [23]. However, in many countries, thiabendazole has been designated as a pesticide residue and the analytical methods have not been applied to processed food matrices. Here, various pretreatment methods, columns, and temperatures were employed to establish an analytical method for detecting thiabendazole in processed food matrices using HPLC–PDA. The adequacy of the sample pretreatment was evaluated based on the recovery rate, and the developed analytical method was validated based on ICH guidelines. The uncertainty that may have occurred in the analytical process was measured based on the guide to the expression of uncertainty in measurement (GUM) and the Eurachem guide. To ensure the safety of foods containing citrus fruits and banana, thiabendazole, a prohibited food additive in foods distributed in Korea, was investigated using the validated analytical method.
2. Materials and Methods
2.1. Chemicals and Reagents
Thiabendazole (≥98.6%, CAS No. 148-79-8), sodium phosphate monobasic (≥98.0%, CAS No. 7558-80-7), and sodium phosphate dibasic (≥98.0%, CAS No. 7558-79-4) were obtained from Sigma-Aldrich (St. Louis, MO, USA). Anhydrous sodium sulfate (≥99.0%, CAS No. 7557-82-6) and anhydrous disodium hydrophosphate (≥99.0%, CAS No. 7647-14-5) were purchased from Samchun Pure Chemical Co. (Seoul, Korea), and acetonitrile and methanol were acquired from J.T.Baker (Phillipsburg, NJ, USA).
2.2. Food Materials
Twenty food samples including banana- and citrus fruit-containing foods were purchased from a local grocery store (Chuncheon, Korea). For food samples, 10 solid and 10 liquid samples with sufficient time until expiry were selected and stored under the storage conditions described on the product label.
2.3. Optimisation of HPLC and LC–MS/MS Analysis Conditions
Thiabendazole was analysed by HPLC. The optimal analytical conditions were chosen according to the following method. We compared different analytical methods for thiabendazole to determine the best analytical conditions [24,25,26]. In addition, parameters such as pretreatment conditions, column type, and temperature were evaluated to determine the optimal separation conditions for thiabendazole from solid and liquid foods containing banana and citrus fruits. The sensitivity of the analytical method was evaluated based on the maximum allowable level of thiabendazole as a food additive in Japan [12].
HPLC was performed according to the method suggested in the Korea Food Code [26] u a 2695 separation module HPLC system (Waters Co., Milford, MA, USA) equipped with C18 columns, including a Shiseido Capcell Pak (4.6 mm × 250 mm, 5.0 μm, Shiseido, Tokyo, Japan). The temperature of the column was maintained at 40 °C; the column was isocratically eluted at 1.0 mL/min for 30 min with a phosphoric acid buffer (pH = 7), acetonitrile, and methanol (7:2:1, v/v/v) as a mobile phase. Thiabendazole acted as a weak base. When analyzing weakly ionic compounds such as thiabendazole by HPLC, the non-ionic/ionic form moves in a mixed or mutually converted state in the column, so the sharpness and symmetry of the eluted peak tend to deteriorate [27]. Therefore, the pH composition was set to completely dissociate or inhibit ionization and phosphoric acid was used to set the pH to 7.0, considering that the thiabendazole conjugate acid has a pKa of about 4.7. In addition, in order to shorten the analysis time and improve resolution, methanol and acetonitrile were mixed and used as a mobile phase. The mobile phase was filtered through a membrane filter (0.45 μm, Whatman, Amersham, UK) and degassed under vacuum. The injection volume was set at 20 μL, and data were monitored using the PDA detector at 285 nm for the quantitative analysis. The HPLC analysis was performed using Waters Empower software (Waters Co., Milford, MA, USA).
Liquid chromatography tandem mass spectrometry (LC–MS/MS) was performed using a 4500 QTRAP LC–MS/MS system (AB Sciex, Framingham, USA), and thiabendazole was separated under the same conditions as those used for the HPLC–PDA detection. The MS/MS data of thiabendazole were collected in electrospray ionisation (ESI) positive ion mode using the following selected reaction monitoring of the following transitions (m/z): 202.00→130.90 (collision energy, 43 eV) and 202.00→175.00 (collision energy, 35 eV). The optimised ESI parameters were as follows: auxiliary gas pressure, 35 arbitrary units; sheath gas pressure, 40 arbitrary units; ion spray voltage, 3500 V; and capillary temperature, 450 °C.
2.4. Optimisation of Extraction Method and Sample Pretreatment
To optimise the method of extracting thiabendazole from the two matrices (solid and liquid food samples), an HPLC analytical method established by comparing analytical conditions, column types, and column temperatures was employed. In addition, previously reported sample pretreatment methods [24,28] were employed, and recovery rates were compared (Table 1). Samples were prepared according to the method described by Li et al. [28]. The homogenised sample (5 g) was added to methanol (20 mL) and stirred for 30 min after vortexing. After the addition of sodium chloride (2.5 g) to the stirred sample, it was allowed to settle for 30 min to precipitate. Thereafter, the supernatant was filtered through a 0.45 μm syringe filter and injected into the HPLC–PDA system for analysis.

Table 1.
The original and modified sample preparation methods.
2.5. Validation of the HPLC Method
According to the ICH guidelines [29], the HPLC method for the determination of thiabendazole was validated in terms of specificity, linearity, LOD, LOQ, precision, and accuracy. Matrix-matched calibration curves were prepared by spiking the extracted solid and liquid samples with seven concentrations of thiabendazole (0.31–20.00 μg/mL) using the optimised pretreatment method. In the process of verifying the method, analytical sensitivity and linearity were indicated through the matrix-matched calibration curves, and there was no interference by the matrix peak of the food sample in the chromatogram. In addition, the LOD and LOQ values of the developed method were calculated for thiabendazole in banana- and citrus fruit-containing food samples. The LOD and LOQ were calculated with the standard deviation (δ) and slope (S) of a standard curve and determined using signal-to-noise ratios using the following formula: LOD = 3.3(δ/S) and LOQ = 10(δ/S). The accuracy and precision of the developed method were determined using solid and liquid matrices of each food with three concentrations of thiabendazole (2.5, 5.0, and 10.0 μg/mL). The results were determined intra-day (three repeats in a day) and inter-day (three repeats on three different days). All analyses were repeated three times and the results were expressed as average values.
2.6. Measurement Uncertainty
The uncertainty of the measurement of thiabendazole in the banana- and citrus fruit-containing foods was analysed according to the method described by Kim et al. [30] using the HPLC–PDA method. Measurement uncertainty was recorded as combined standard uncertainty based on the GUM and the draft EURACHEM Guide [31,32,33]. To measure uncertainty using the metrology approach, laboratory data such as analytical process performance, precision analysis, and quantification of thiabendazole were required. Uncertainty was recorded for the sample preparation steps (Uprep), reference materials (URM), dilution of reference materials (Ustd), calibration curves (Ucal), repeatability measurement (Urep), balances, volumetric measuring devices, and instrumental factors. The expanded uncertainty (U) was calculated using the following equation, and the combined standard uncertainty was multiplied by coverage factor k = 2, which represents a confidence level of approximately 95%.
where U = Expanded uncertainty, k = Coverage factor, Veff = Effective degree of freedom, and Vi = Degree of freedom.
3. Results and Discussion
3.1. Optimisation of HPLC Conditions
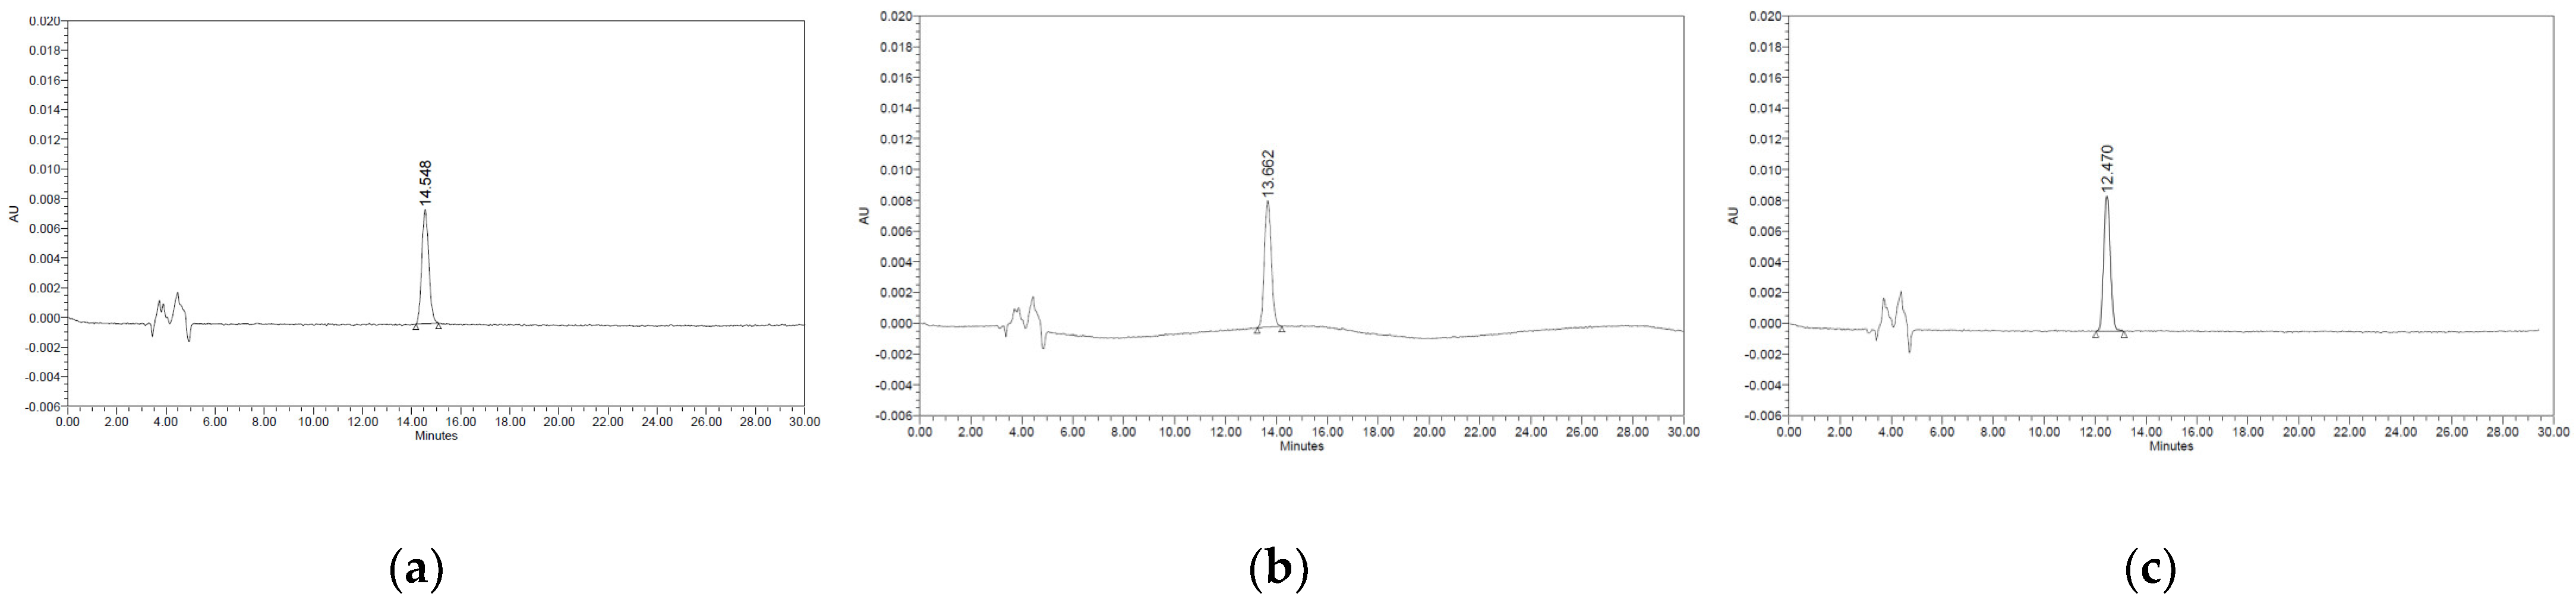
To optimise the analytical conditions for the HPLC–PDA method, the analytical method was examined and compared by varying various parameters. Reversed-phase chromatography is the most commonly used HPLC method because of its high number of theoretical plates, excellent separation properties, reproducibility, and ease of use [34]. In reversed-phase chromatography, hydrocarbons (C8 chain (n-octyl) and C18 chain (n-octadecyl)) are mainly used because the stationary phase is non-polar, and relatively polar water, methanol, acetonitrile are used as the mobile phase [35]. Here, three analytical methods were reproduced and compared with those reported in the literature on thiabendazole analysis. The HPLC–PDA maximum absorbance wavelength of thiabendazole was confirmed to be 285 nm; no peak was confirmed as a result of analysing thiabendazole using the method described by Sousa et al. [25]. The baseline and peak shape were excellent using the method described by Ito et al. [24] and MFDS [26]. The method described by the Korea Food Code, with a large peak area, was used for subsequent experiments (data not shown). To select the column with the most efficient separation under the established HPLC–PDA analytical conditions, thiabendazole standard solutions (0.15, 1.25, and 10.00 μg/mL) were analysed for three C18 columns from different manufacturers (Figure 1). There was a difference in the retention time depending on the manufacturer (Shiseido Capcell Pak C18 UG 120, 4.6 mm × 250 mm, 5.0 μm; Waters Sunfire C18, 4.6 mm × 250 mm, 5.0 μm, Waters Co., Milford, MA, USA; Phenomenex Gemini C18, 4.6 mm × 250 mm, 5.0 μm, Phenomenex, Cheshire, UK); however, there was no significant difference in the area value. For the Phenomenex column, peak splitting and peak tailing were confirmed. For the Waters column, the area value was smaller than that of the Shiseido column despite having the same concentration. Therefore, we selected the Shiseido Capcell Pak C18 UG 120, which has a relatively large peak area, a faster analyte retention time than other C18 columns, and a high correlation coefficient. Column temperature affects the separation of analytes, retention time, selectivity, and changes in peak shape [36]. Therefore, we confirmed the changes in the retention time and peak shape of the analyte according to the column temperature (Figure 2). After analysing with a temperature gradient (20, 30, and 40 °C), the retention time of thiabendazole decreased (14.548, 13.662, and 12.470 min, respectively) as the temperature increased, but no change in the peak shape was observed. The optimal temperature was 40 °C, which exhibited a high peak area. Therefore, the HPLC–PDA conditions for thiabendazole were optimised by comparing the results according to various mobile phase compositions, column types, and column temperatures.
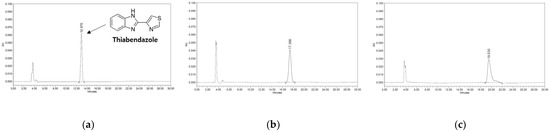
Figure 1.
Change in high-performance liquid chromatography (HPLC) chromatograms of thiabendazole using different C18 columns. (a) Shiseido column. (b) Waters column. (c) Phenomenex column.
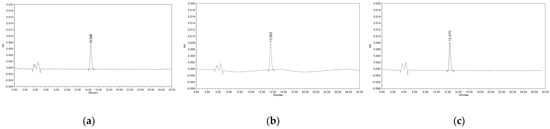
Figure 2.
High-performance liquid chromatography (HPLC) chromatograms of thiabendazole according to different column temperatures. (a) 20 °C. (b) 30 °C. (c) 40 °C.
3.2. Optimisation of the Extraction Method
Sample preparation is a pre-HPLC analysis step performed to remove interfering factors from particulate molecules and analyte-interfering matrix components to avoid sample contamination and increase analytical sensitivity [37]. To establish the optimal matrix pretreatment method, thiabendazole was added to banana- and citrus fruit-containing liquid and solid food samples at a final concentration of 10 μg/mL, and the extraction was performed according to the pretreatment method reported (Table 1). According to Ito et al., extraction was performed using ethyl acetate containing anhydrous sodium sulfate and anhydrous disodium hydrophosphate; the extract was spiked with thiabendazole. The recovery rates were 70.41 ± 0.20 and 71.95 ± 0.38% in the solid and liquid samples, respectively (Table 2). Sodium sulfate is used as a desiccant to eliminate interfering factors, such as sugar, due to moisture [38]. Therefore, the pretreatment method reported by Ito et al. was modified by increasing the quantities of the sample and of anhydrous sodium sulfate. The recovery rates were 79.82 ± 0.43 and 71.85 ± 0.75% in the solid and liquid samples, respectively. Although the recovery rate was improved in the solid sample, it was considered not suitable for the appropriate level (80–120%) of the method validation ICH guideline [39]. However, the recovery rate increased to 94.30 ± 1.02 and 92.98 ± 0.52% in the solid and liquid samples, respectively, using the chosen pretreatment method described by Li et al., which provided the highest thiabendazole recovery.
Table 2.
Analyte recovery rates using the modified sample preparation method.
3.3. Validation of the HPLC–PDA Method
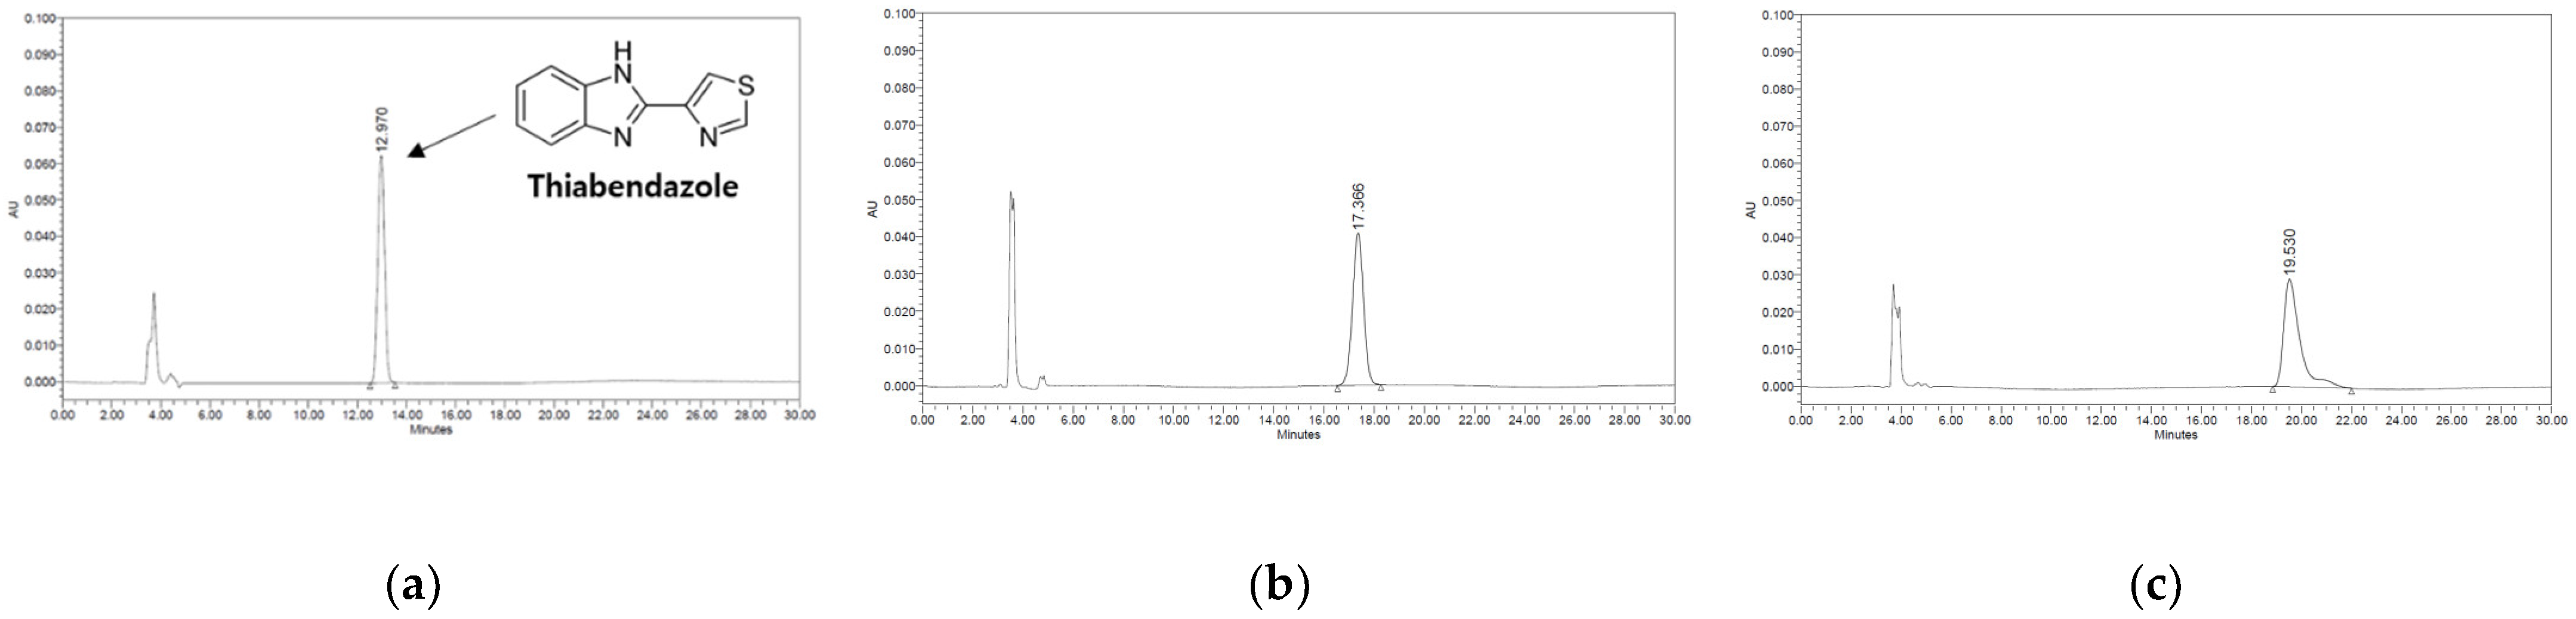
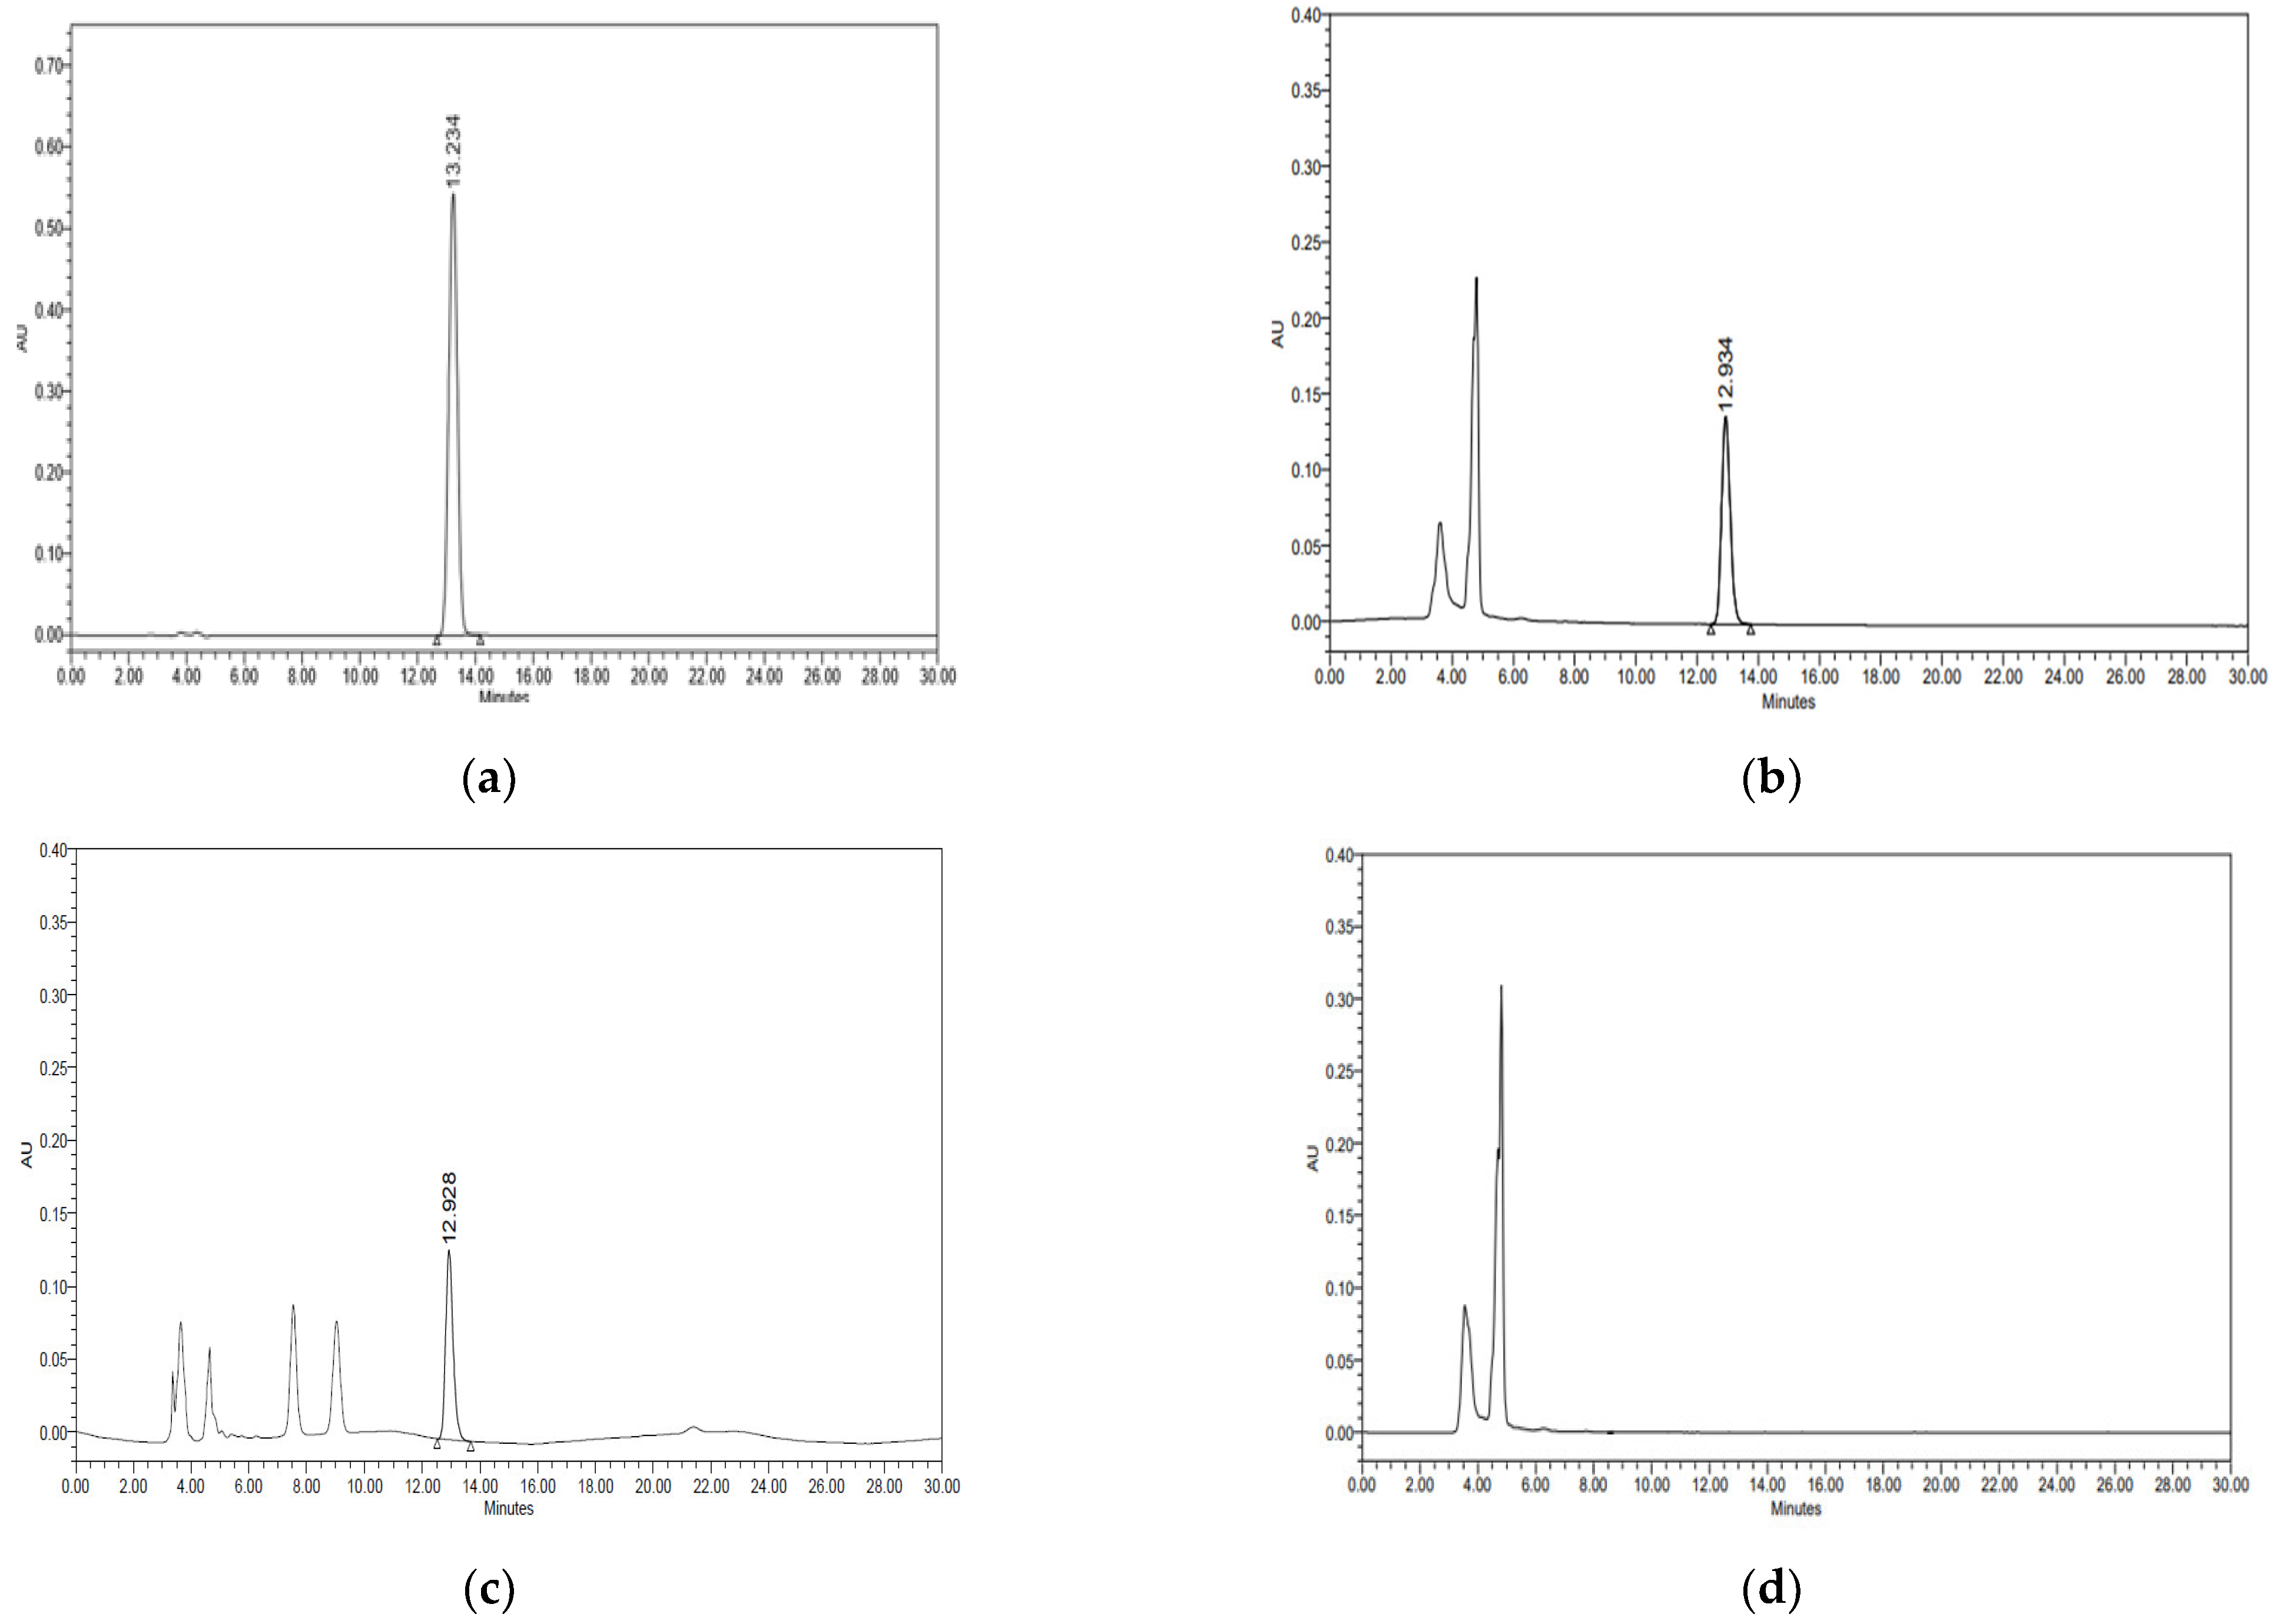
Specificity was evaluated by confirming the interference of the chromatogram in the sample and matrix, including the analyte. The solid and liquid food samples were pretreated using established methods, and thiabendazole stock solutions were added to obtain diluted sample solutions ranging from 0.31 to 20.00 μg/mL. As shown in Figure 3, thiabendazole did not exhibit co-eluted peaks and matrix interference in the solid and liquid food samples and was efficiently separated. Column types and column temperatures (20~40 °C) were changed to evaluate the robustness of the analytical method. As shown in Figure 1 and Figure 2, there was a difference in retention time depending on the column manufacturers, but there was no significant difference in the area value. In addition, the retention time of thiabendazole decreased with increasing temperature, but no change in peak shape was observed. LOD and LOQ are validation parameters for the quantitative analyses of samples containing traces of analytes, particularly for the determination of impurities and degradation products. As shown in Table 3, the R2 of the calibration curve ranged from 0.9998 to 0.9999. The LODs for the solid and liquid food samples were 0.009 and 0.017 μg/mL, respectively, and the LOQs were 0.028 and 0.052 μg/mL. Therefore, the sensitivity of the HPLC–PDA method was determined to be appropriate for the quantitative detection of thiabendazole at levels below the maximum permitted level in Japan. In quantitative analyses, accuracy and precision are the most important validation parameters. To ensure the reliability of the pretreatment method for the analysis of thiabendazole, the solid and liquid food matrices were spiked with thiabendazole solutions (2.5, 5, and 10.0 μg/mL). Accuracy and precision were analysed using the recovery and relative standard deviation (RSD), respectively. As shown in Table 4, the average intra- and inter-day recovery rates were 94.57–98.08% and 93.61–97.63%, respectively, for the solid food matrix and 95.20–97.45% and 94.88–97.37% for the liquid food matrix. Furthermore, the precisions were 0.24–0.33% and 0.43–1.33% for the solid food matrix and 0.23–0.28% and 0.23–0.33% for the liquid food matrix, respectively. The method validation guidelines presented by the ICH and US FDA allow accuracy and precision levels within the range of 80–120% and less than 5%, respectively [39,40]. Therefore, the HPLC–PDA method for thiabendazole showed excellent precision and accuracy at all concentrations in the sample matrices.
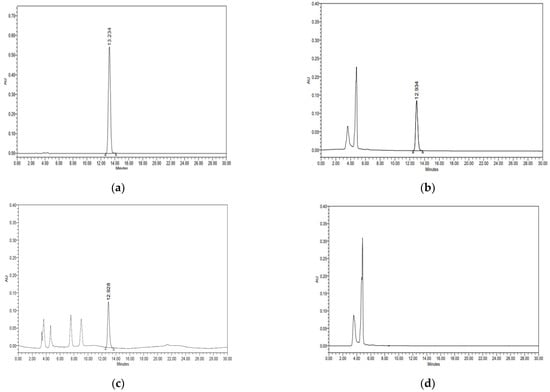
Figure 3.
Chromatogram and spectrum of thiabendazole as determined by high-performance liquid chromatography–photodiode array (HPLC–PDA) detection. (a) Thiabendazole standard. (b) Solid sample spiked with thiabendazole. (c) Liquid sample spiked with thiabendazole. (d) Blank sample.
Table 3.
Coefficient of determination (R2) of the calibration curves, limit of detection (LOD), and limit of quantification (LOQ) of the analytical method for thiabendazole in the solid and liquid food samples.
Table 4.
Precision and accuracy of the analytical method for thiabendazole in the solid and liquid food samples.
3.4. Validation of the LC–MS/MS Method
The interference caused by the food matrix effect is a typical problem due to the matrix complexity of food samples and the presence of trace amounts of target analytes [41,42]. The HPLC–PDA method is insufficient for measuring low-level food additives because of the interference of other identifiable components in food matrices [43]. Therefore, thiabendazole was analysed in liquid food samples containing banana using LC–MS/MS as a verification step. As shown in Table 5, the R2, LOD, and LOQ values determined by the LC–MS/MS method for the liquid food samples were 0.9994, 0.62 μg/mL, and 1.83 μg/mL, respectively. The validation parameters of the LC–MS/MS method yielded lower R2 values and higher LOD and LOQ values than those of the HPLC–PDA method. LC–MS/MS separates and analyses substances through ionisation; therefore, it is considered to exhibit a large peak deviation [43]. However, it was observed that the quantitative detection of thiabendazole was possible below the maximum permissible level in Japan. This suggested the possibility of using the LC–MS/MS method when the specificity is low, owing to the interference of the food matrix effect.
Table 5.
Coefficient of determination (R2) of the calibration curves, limit of detection (LOD), and limit of quantification (LOQ) for the analytical method for thiabendazole in the liquid food samples using LC–MS/MS.
3.5. Sample Collection and Monitoring of Residual Thiabendazole Levels
The residual amount of thiabendazole was confirmed in 20 banana- and citrus fruit-containing food samples distributed in Korea using the analytical method developed and verified in this study. Among products distributed in Korea, it is important to monitor distributed food samples because food and processed foods containing thiabendazole, which is prohibited as a food additive, may be imported. The chromatographic peak retention time and spectrum of the thiabendazole standard were compared, and thiabendazole was not detected in the 20 banana- and citrus fruit-containing food samples.
3.6. Measurement Uncertainty
The verification of an analytical method ensures the reliability of its results, but it is not sufficient for the accurate comparison and interpretation of results [44]. Here, the measurement uncertainty for the analysis of thiabendazole in the citrus-fruit containing food samples by HPLC–PDA detection was calculated according to the GUM and the draft EURACHEM Guide. As shown in Table 6, five individual uncertainty factors were established to calculate the thiabendazole measurement uncertainty: uncertainties related to sample preparation (Uprep), reference materials (URM), standard stock solution (Ustd), recalibration curve (Ucal), and repeatability (Urep). The uncertainties associated with analytical equipment were acquired from their respective calibration certificates and evaluated for repeated testing at room temperature (20 ± 3 °C). The Uprep value was calculated as the combined uncertainty of a 25 mL volumetric flask and a chemical balance that was regularly issued as a calibration certificate. The uncertainty in the chemical balance was determined using factors such as the stability (0.000032 g), repeatability (0.000029 g), and certificate of calibration (0.00500 g). The uncertainty of the 25 mL volumetric flask was based on the change in volume according to temperature (0.0222 mL), repeatability (0.0001 mL), and certificate of calibration (0.0065 mL). Thus, the relative standard uncertainties of the chemical balance and 25 mL volumetric flask were 0.0002 and 0.0009, respectively. The combined Uprep value was 0.0009. The URM value was determined based on a certificate provided by the manufacturer (Sigma-Aldrich) for the thiabendazole standard reagent (0.0082). The Ustd value was determined according to the uncertainties of the chemical balance (0.0026) and 25 mL volumetric flask (0.0009), and the combined Ustd was 0.0027. The Ucal value was determined for thiabendazole based on the seven concentration measurements in triplicate (0.0234). Urep was evaluated to measure the average content of thiabendazole in 5 g samples (0.0031). The expanded uncertainty (U) for a confidence level of approximately 95% and a coverage factor of 2 was 0.4975. The major contribution to uncertainty originated from the calibration curve. Furthermore, the U-value was 49.75% and this uncertainty is lower than the maximum threshold value of 50% recommended by SANCO/12571/2013 [45], which clearly demonstrates the fitness for purpose of the developed method. For the analysis of food additives and fungicides in food, it is also important to measure metabolites and degradation products of analytes. Thiabendazole is photolysed in aqueous solution to cleave the thiazole ring and form photolysis products, such as benzimidazole, benzimidazole-2-carboxamide, 5-hydroxy thiabendazole, and benzimadazole-2-carboxylic acid [46]. Therefore, we plan to develop an analytical method to determine the transformation products that are generated when thiabendazole is used as a food additive in future follow-up studies.
Table 6.
Individual uncertainties of the sample preparation (Uprep), reference material (URM), standard stock solution (Ustd), calibration curve (Ucal), repeatability (Urep), and expanded uncertainty (U) according to the EURACHEM Guide.
4. Conclusions
Thiabendazole is used as a fungicide in many countries and is not permitted as a food additive. However, post-harvest fungicides (PHF) are uniquely classified as food additives under the food sanitation law due to their use as food preservers in Japan. Therefore, it is necessary to develop and monitor analytical methods for imported foods and foods distributed in Korea. The proposed HPLC–PDA method was validated and developed for the quantification of thiabendazole in banana- and citrus fruit-containing foods. The method was optimised and the extraction method and sample pretreatment were validated in terms of specificity, linearity, LOD, LOQ, precision, accuracy, and measurement uncertainty. The obtained results showed that the developed method was suitable for the identification and quantification of thiabendazole in solid and liquid foods.
Author Contributions
Conceptualization, S.-I.C. and O.-H.L.; methodology, S.-I.C. and X.H.; software, S.-J.L. and X.M.; validation, X.M. and G.O.; formal analysis, X.M. and D.-S.L.; investigation, S.-I.C., S.-J.L., and G.O.; resources, X.H. and S.-J.L.; data curation, S.-I.C. and G.O.; writing—original draft preparation, S.-I.C.; writing—review and editing, O.-H.L.; visualization, X.H., X.M., and D.-S.L.; supervision, D.-S.L. and O.-H.L.; project administration, X.H. and S.-J.L.; funding acquisition, O.-H.L. All authors have read and agreed to the published version of the manuscript.
Funding
This research was supported by the Basic Science Research Program (2017R1D1A3B0602846915 and 2021R1A6A1A03044242) and Fostering Outstanding Universities for Research (BK21 FOUR-4299990913942) through the National Research Foundation of Korea (NRF) funded by the Ministry of Education (MOE, Korea).
Institutional Review Board Statement
Not applicable.
Informed Consent Statement
Not applicable.
Data Availability Statement
The data that support the findings of this study are available on request from the corresponding author, Ok-Hwan Lee.
Conflicts of Interest
The authors declare no conflict of interest.
References
- Knorr, D.; Watzke, H. Food processing at a crossroad. Front. Nutr. 2019, 6, 85. [Google Scholar] [CrossRef] [PubMed] [Green Version]
- Amit, S.K.; Uddin, M.; Rahman, R.; Islam, S.M.; Khan, M.S. A review on mechanisms and commercial aspects of food preservation and processing. Agric. Food Secur. 2017, 6, 1–22. [Google Scholar] [CrossRef]
- MFDS. Ministry of Food and Drug Safety (MFDS), Korea Food Additives Code. Available online: https://www.mfds.go.kr/eng/brd/m_15/view.do?seq=72432 (accessed on 10 July 2020).
- Song, Y.S.; Hepp, M.A. US Food and Drug Administration Approach to Regulating Intelligent and Active Packaging Components, 1st ed.; Elsevier: Amsterdam, The Netherlands, 2005; pp. 475–481. [Google Scholar]
- Laganà, P.; Avventuroso, E.; Romano, G.; Gioffré, M.E.; Patanè, P.; Parisi, S.; Moscato, U.; Delia, S. The Codex Alimentarius and the European Legislation on Food Additives, 1st ed.; Springer: New York, NY, USA, 2017; pp. 23–32. [Google Scholar]
- FSA. Food Standards Agency (FSA), Approved Additives and E Numbers. Available online: https://www.food.gov.uk/business-guidance/approved-additives-and-e-numbers (accessed on 15 February 2022).
- Renwick, A.G. Data-derived safety factors for the evaluation of food additives and environmental contaminants. Food Addit. Contam. 1993, 10, 275–305. [Google Scholar] [CrossRef] [PubMed]
- Lee, J.S.; Kim, Y.H.; Kim, J.M.; Kang, S.R.; Lee, C.; Shin, J.W.; Chun, H.S.; Lee, O.H. Current permitted status and management system of food additives in the inside and outside of the country. Korean J. Food Sci. Technol. 2014, 47, 46–53. [Google Scholar]
- Eckert, J.W.; Ogawa, J.M. The chemical control of postharvest diseases: Subtropical and tropical fruits. Annu. Rev. Phytopathol. 1985, 23, 421–454. [Google Scholar] [CrossRef]
- MFDS. Ministry of Food and Drug Safety (MFDS), Pesticide MRLs in Food. Available online: https://www.mfds.go.kr/eng/brd/m_15/view.do?seq=71065&srchFr=&srchTo=&srchWord=&srchTp=&itm_seq_1=0&itm_seq_2=0&multi_itm_seq=0&company_cd=&company_nm=&page=2 (accessed on 1 October 2016).
- CFR. Code of Federal Regulations (CFR) Title 40: Protection of Environment; National Archives and Records Administration, Office of the Federal Register: Washington, DC, USA, 2022. [Google Scholar]
- MHLW. Ministry of Health, Labor, and Welfare (MHLW), The Standards for Use of Food Additives. Available online: https://www.ffcr.or.jp/en/upload/StandardsforUseFeb32021.pdf (accessed on 3 February 2021).
- MHLW. Ministry of Health, Labor, and Welfare (MHLW), Regarding Establishment of Provisional Maximum Residue Limits in a Positive List System Concerning Agricultural Chemicals Residues in Food etc. Available online: https://www.mhlw.go.jp/english/topics/mrls/final/dl/mrls02.pdf (accessed on 31 May 2005).
- Jang, G.W.; Choi, S.I.; Han, X.; Men, X.; Kwon, H.Y.; Choi, Y.E.; Park, M.H.; Lee, O.H. Method validation and measurement uncertainty determination of ethoxyquin and antioxidant activity in paprika seasonings and paprika sauces frequently consumed in South Korea. Separations 2020, 7, 50. [Google Scholar] [CrossRef]
- Araujo, P. Key aspects of analytical method validation and linearity evaluation. J. Chromatogr. B 2009, 877, 2224–2234. [Google Scholar] [CrossRef]
- Taverniers, I.; Loose, M.D.; Bockstaele, E.V. Trends in quality in the analytical laboratory. II. Analytical method validation and quality assurance. Trends Anal. Chem. 2004, 23, 535–552. [Google Scholar] [CrossRef]
- Baddouh, A.; Rguiti, M.M.; Mohamed, E.; Ibrahimi, B.E.; Bazzi, L.; Hilali, M. Electrochemical degradation of Thiabendazole fungicide by anodic oxidation on the tin oxide electrode (SnO2). Appl. J. Environ. Eng. Sci. 2017, 3, 213–221. [Google Scholar]
- Steck, E.A.; Nachod, F.C.; Ewing, G.W.; Gorman, N.H. Absorption spectra of heterocyclic compounds. III. Some benzimidazole derivatives. J. Am. Chem. Soc. 1948, 70, 3406–3410. [Google Scholar] [CrossRef]
- Di Muccio, A.; Girolimetti, S.; Barbini, D.A.; Pelosi, P.; Generali, T.; Vergori, L.; Merulis, G.D.; Leonelli, A.; Stefanelli, P. Selective clean-up applicable to aqueous acetone extracts for the determination of carbendazim and thiabendazole in fruits and vegetables by high-performance liquid chromatography with UV detection. J. Chromatogr. A 1999, 833, 61–65. [Google Scholar] [CrossRef]
- Turiel, E.; Tadeo, J.L.; Cormack, P.A.G.; Martin-Esteban, A. HPLC imprinted-stationary phase prepared by precipita-tion polymerisation for the determination of thiabendazole in fruit. Analyst 2005, 130, 1601–1607. [Google Scholar] [CrossRef] [PubMed]
- Tuzen, M.; Altunay, N.; Elik, A.; Mogaddam, M.R.A.; Katin, K. Experimental and theoretical investigation for the spectrophotometric determination of thiabendazole in fruit samples. Microchem. J. 2021, 168, 106488. [Google Scholar] [CrossRef]
- Müller, C.; David, L.; Chiş, V.; Pînzaru, S.C. Detection of thiabendazole applied on citrus fruits and bananas using surface enhanced Raman scattering. Food Chem. 2014, 145, 814–820. [Google Scholar] [CrossRef] [PubMed]
- Ito, Y.; Goto, T.; Oka, H.; Matsumoto, H.; Miyazaki, Y.; Takahashi, N.; Nakazawa, H. Simple and rapid determination of thiabendazole, imazalil, and o-phenylphenol in citrus fruit using flow-injection electrospray ionization tandem mass spectrometry. J. Agric. Food Chem. 2003, 51, 861–866. [Google Scholar] [CrossRef]
- Ito, Y.; Ikai, Y.; Oka, H.; Hayakawa, J.; Kagami, T. Application of ion-exchange cartridge clean-up in food analysis: I. Simultaneous determination of thiabendazole and imazalil in citrus fruit and banana using high-performance liquid chromatography with ultraviolet detection. J. Chromatogr. A 1998, 810, 81–87. [Google Scholar] [CrossRef]
- Sousa, E.S.; Pinto, L.; Araujo, M.C.U. A chemometric cleanup using multivariate curve resolution in liquid chromatography: Quantification of pesticide residues in vegetables. Microchem. J. 2017, 134, 131–139. [Google Scholar] [CrossRef]
- MFDS. Ministry of Food and Drug Safety (MFDS), Food Code. Available online: https://www.foodsafetykorea.go.kr/foodcode/01_03.jsp?idx=4 (accessed on 16 October 2020).
- Berger, T.A.; Deye, J.F. Effect of basic additives on peak shapes of strong bases separated by packed-column supercritical fluid chromatography. J. Chromatogr. Sci. 1991, 29, 310–317. [Google Scholar] [CrossRef]
- Li, X.; Tang, C.Y.; Zhong, L.L.; Lei, X.Y.; Zhao, S.; Wei, C. Determination of 11 Preservatives in Citrus by ultra performance liquid chromatography-tandem mass spectrometry. J. Food Saf. Qual. 2019, 10, 8382–8388. [Google Scholar]
- ICH. International Council for Harmonisation of Technical Requirements for Pharmaceuticals for Human Use (ICH), Validation of Analytical Procedures: Text and Methodology Q2 (R1). Available online: https://www.ema.europa.eu/en/documents/scientific-guideline/ich-q-2-r1-validation-analytical-procedures-text-methodology-step-5_en.pdf (accessed on 1 June 1995).
- Kim, J.M.; Choi, S.H.; Shin, G.H.; Lee, J.H.; Kang, S.R.; Lee, K.Y.; Lim, H.S.; Kang, T.S.; Lee, O.H. Method validation and measurement uncertainty for the simultaneous determination of synthetic phenolic antioxidants in edible oils commonly consumed in Korea. Food Chem. 2016, 213, 19–25. [Google Scholar] [CrossRef]
- NIST. National Institute of Standards and Technology (NIST), Guidelines for Evaluating and Expressing the Uncertainty of NIST Measurement Results Cover. Available online: https://emtoolbox.nist.gov/Publications/NISTTechnicalNote1297s.pdf (accessed on 1 September 1994).
- ISO. International Organization for Standardization (ISO), Part 3: Guide to the Expression of Uncertainty in Measurement. Available online: https://www.iso.org/standard/50462.html (accessed on 1 October 2008).
- Eurachem. Quantifying Uncertainty in Analytical Measurement, 3rd ed. Available online: https://www.eurachem.org/index.php/publications/guides/quam (accessed on 8 September 2020).
- Zuvela, P.; Skoczylas, M.; Jay, L.J.; Baczek, T.; Kaliszan, R.; Wong, M.W.; Buszewski, B. Column characterization and selection systems in reversed-phase high-performance liquid chromatography. Chem. Rev. 2019, 119, 3674–3729. [Google Scholar] [CrossRef]
- Devanshu, S.; Rahul, M.; Annu, G.; Kishan, S.; Anroop, N. Quantitative bioanalysis by LC–MS/MS: A review. J. Pharm. Biomed. Sci. 2010, 7, 1–9. [Google Scholar]
- Hao, Z.; Xiao, B.; Weng, N. Impact of column temperature and mobile phase components on selectivity of hydrophilic interaction chromatography (HILIC). J. Sep. Sci. 2008, 31, 1449–1464. [Google Scholar] [CrossRef]
- Hajeb, P.; Zhu, L.; Bossi, R.; Vorkamp, K. Sample preparation techniques for suspect and non-target screening of emerging contaminants. Chemosphere 2022, 287, 132306. [Google Scholar] [CrossRef]
- Xu, X.; Zhang, X.; Duhoranimana, E.; Zhang, Y.; Shu, P. Determination of methenamine residues in edible animal tissues by HPLC–MS/MS using a modified QuEChERS method: Validation and pilot survey in actual samples. Food Control 2016, 61, 99–104. [Google Scholar] [CrossRef]
- FDA. US Food and Drug Administration (FDA), Office of Regulatory Affairs Laboratory Manual Volume II. Available online: https://www.fda.gov/media/73920/download (accessed on 4 April 2021).
- FDA. US Food and Drug Administration (FDA), Q2B Validation of Analytical Procedures: Methodology. Available online: https://www.fda.gov/regulatory-information/search-fda-guidance-documents/q2b-validation-analytical-procedures-methodology (accessed on 14 April 2020).
- Di Stefano, V.D.; Avellone, G.; Bongiorno, D.; Cunsolo, V.; Muccilli, V.; Sforza, S.; Dossena, A.; Drahos, L.; Vékey, K. Applications of liquid chromatography-mass spectrometry for food analysis. J. Chromatogr. A 2012, 1259, 74–85. [Google Scholar] [CrossRef]
- Song, X.; Xu, S.; Chen, L.; Wei, Y.; Xiong, H. Recent advances in molecularly imprinted polymers in food analysis. J. Appl. Polym. Sci. 2014, 131, 40766. [Google Scholar] [CrossRef] [Green Version]
- Jang, G.W.; Choi, S.I.; Choi, S.H.; Han, X.; Men, X.; Kwon, H.Y.; Choi, Y.E.; Lee, O.H. Method validation of 12 kinds of food dye in chewing gums and soft drinks, and evaluation of measurement uncertainty for soft drinks. Food Chem. 2021, 356, 129705. [Google Scholar] [CrossRef]
- Rozet, E.; Marini, R.D.; Ziemons, E.; Boulanger, B.; Hubert, P. Advances in validation, risk and uncertainty assessment of bioanalytical methods. J. Pharm. Biomed. Anal. 2011, 55, 848–858. [Google Scholar] [CrossRef]
- Aftab, N.F.; Ahmad, K.S.; Gul, M.M. Sorptive and degradative assessments of environmentally pestilential Benzimidazole fungicide Fuberidazole in pedosphere. Int. J. Environ. Anal. Chem. 2021, 2021, 1–18. [Google Scholar] [CrossRef]
- SANCO. European Commission Health & Consumer Protection, Guidance Document on Analytical Quality Control and Validation Procedures for Pesticide Residues Analysis in Food and Feed. Available online: https://www.eurl-pesticides.eu/library/docs/allcrl/AqcGuidance_Sanco_2013_12571.pdf (accessed on 19 November 2013).
Publisher’s Note: MDPI stays neutral with regard to jurisdictional claims in published maps and institutional affiliations. |
© 2022 by the authors. Licensee MDPI, Basel, Switzerland. This article is an open access article distributed under the terms and conditions of the Creative Commons Attribution (CC BY) license (https://creativecommons.org/licenses/by/4.0/).