
Microplastics and Heavy Metals Removal from Fresh Water and Wastewater Systems Using a Membrane


Abstract
:1. Introduction
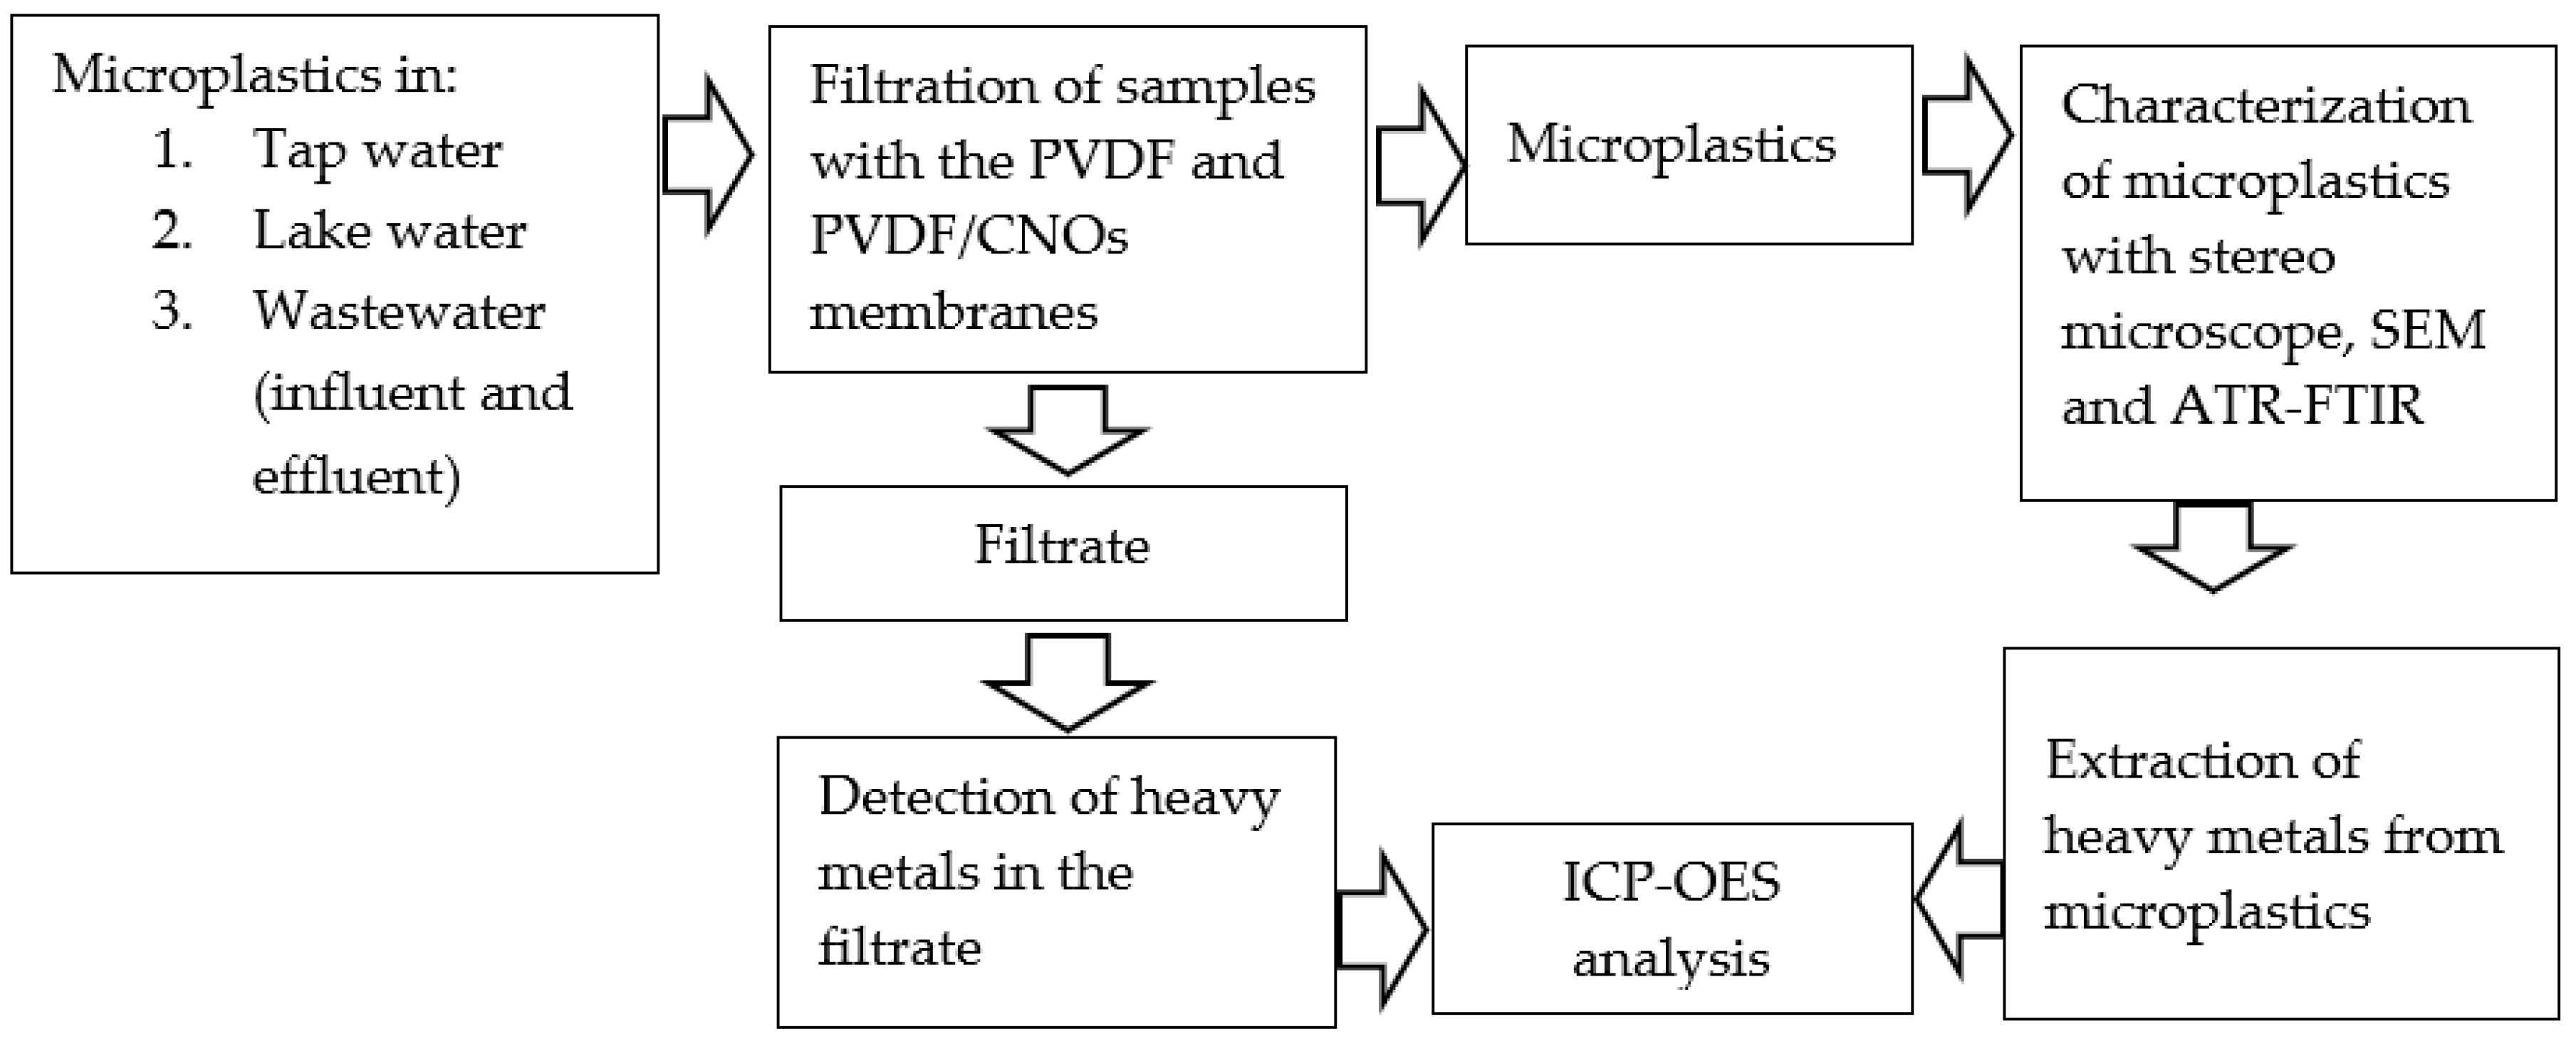
2. Methodology
2.1. Chemicals and Reagents
2.2. Sample Sites and Collection
2.3. Sample Preparation
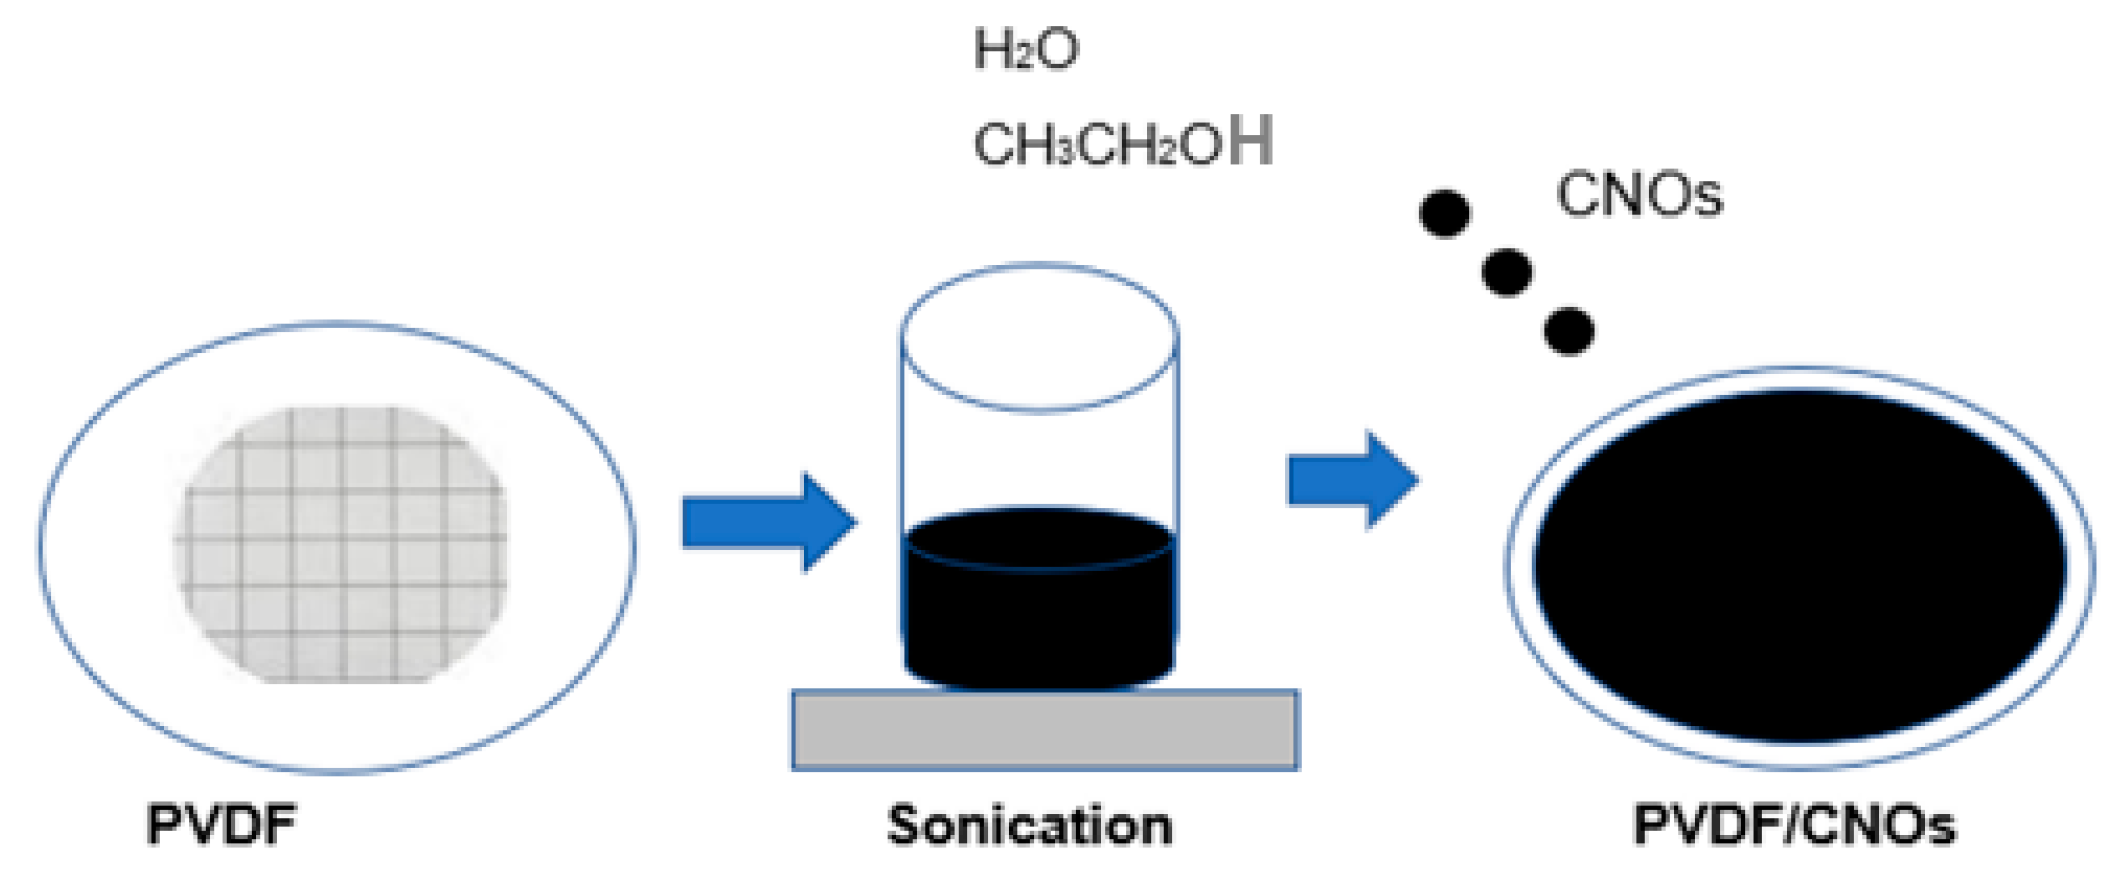
2.4. Preparation of PVDF Membrane Modified with Carbon Nano-Onions
2.5. Separation of Microplastics from Water Samples
2.6. Extraction of Heavy Metals Attached to the Microplastics Obtained from Wastewater Influent
2.7. Quality Control Analysis
2.8. Characterization Techniques
2.8.1. Membrane Performance
2.8.2. Characterization of Microplastics
2.8.3. Analytical Figures of Merit
3. Results and Discussion
3.1. Evaluation of the PVDF and PVDF/CNOs Performance
3.2. Quantification of Microplastics in Water Samples
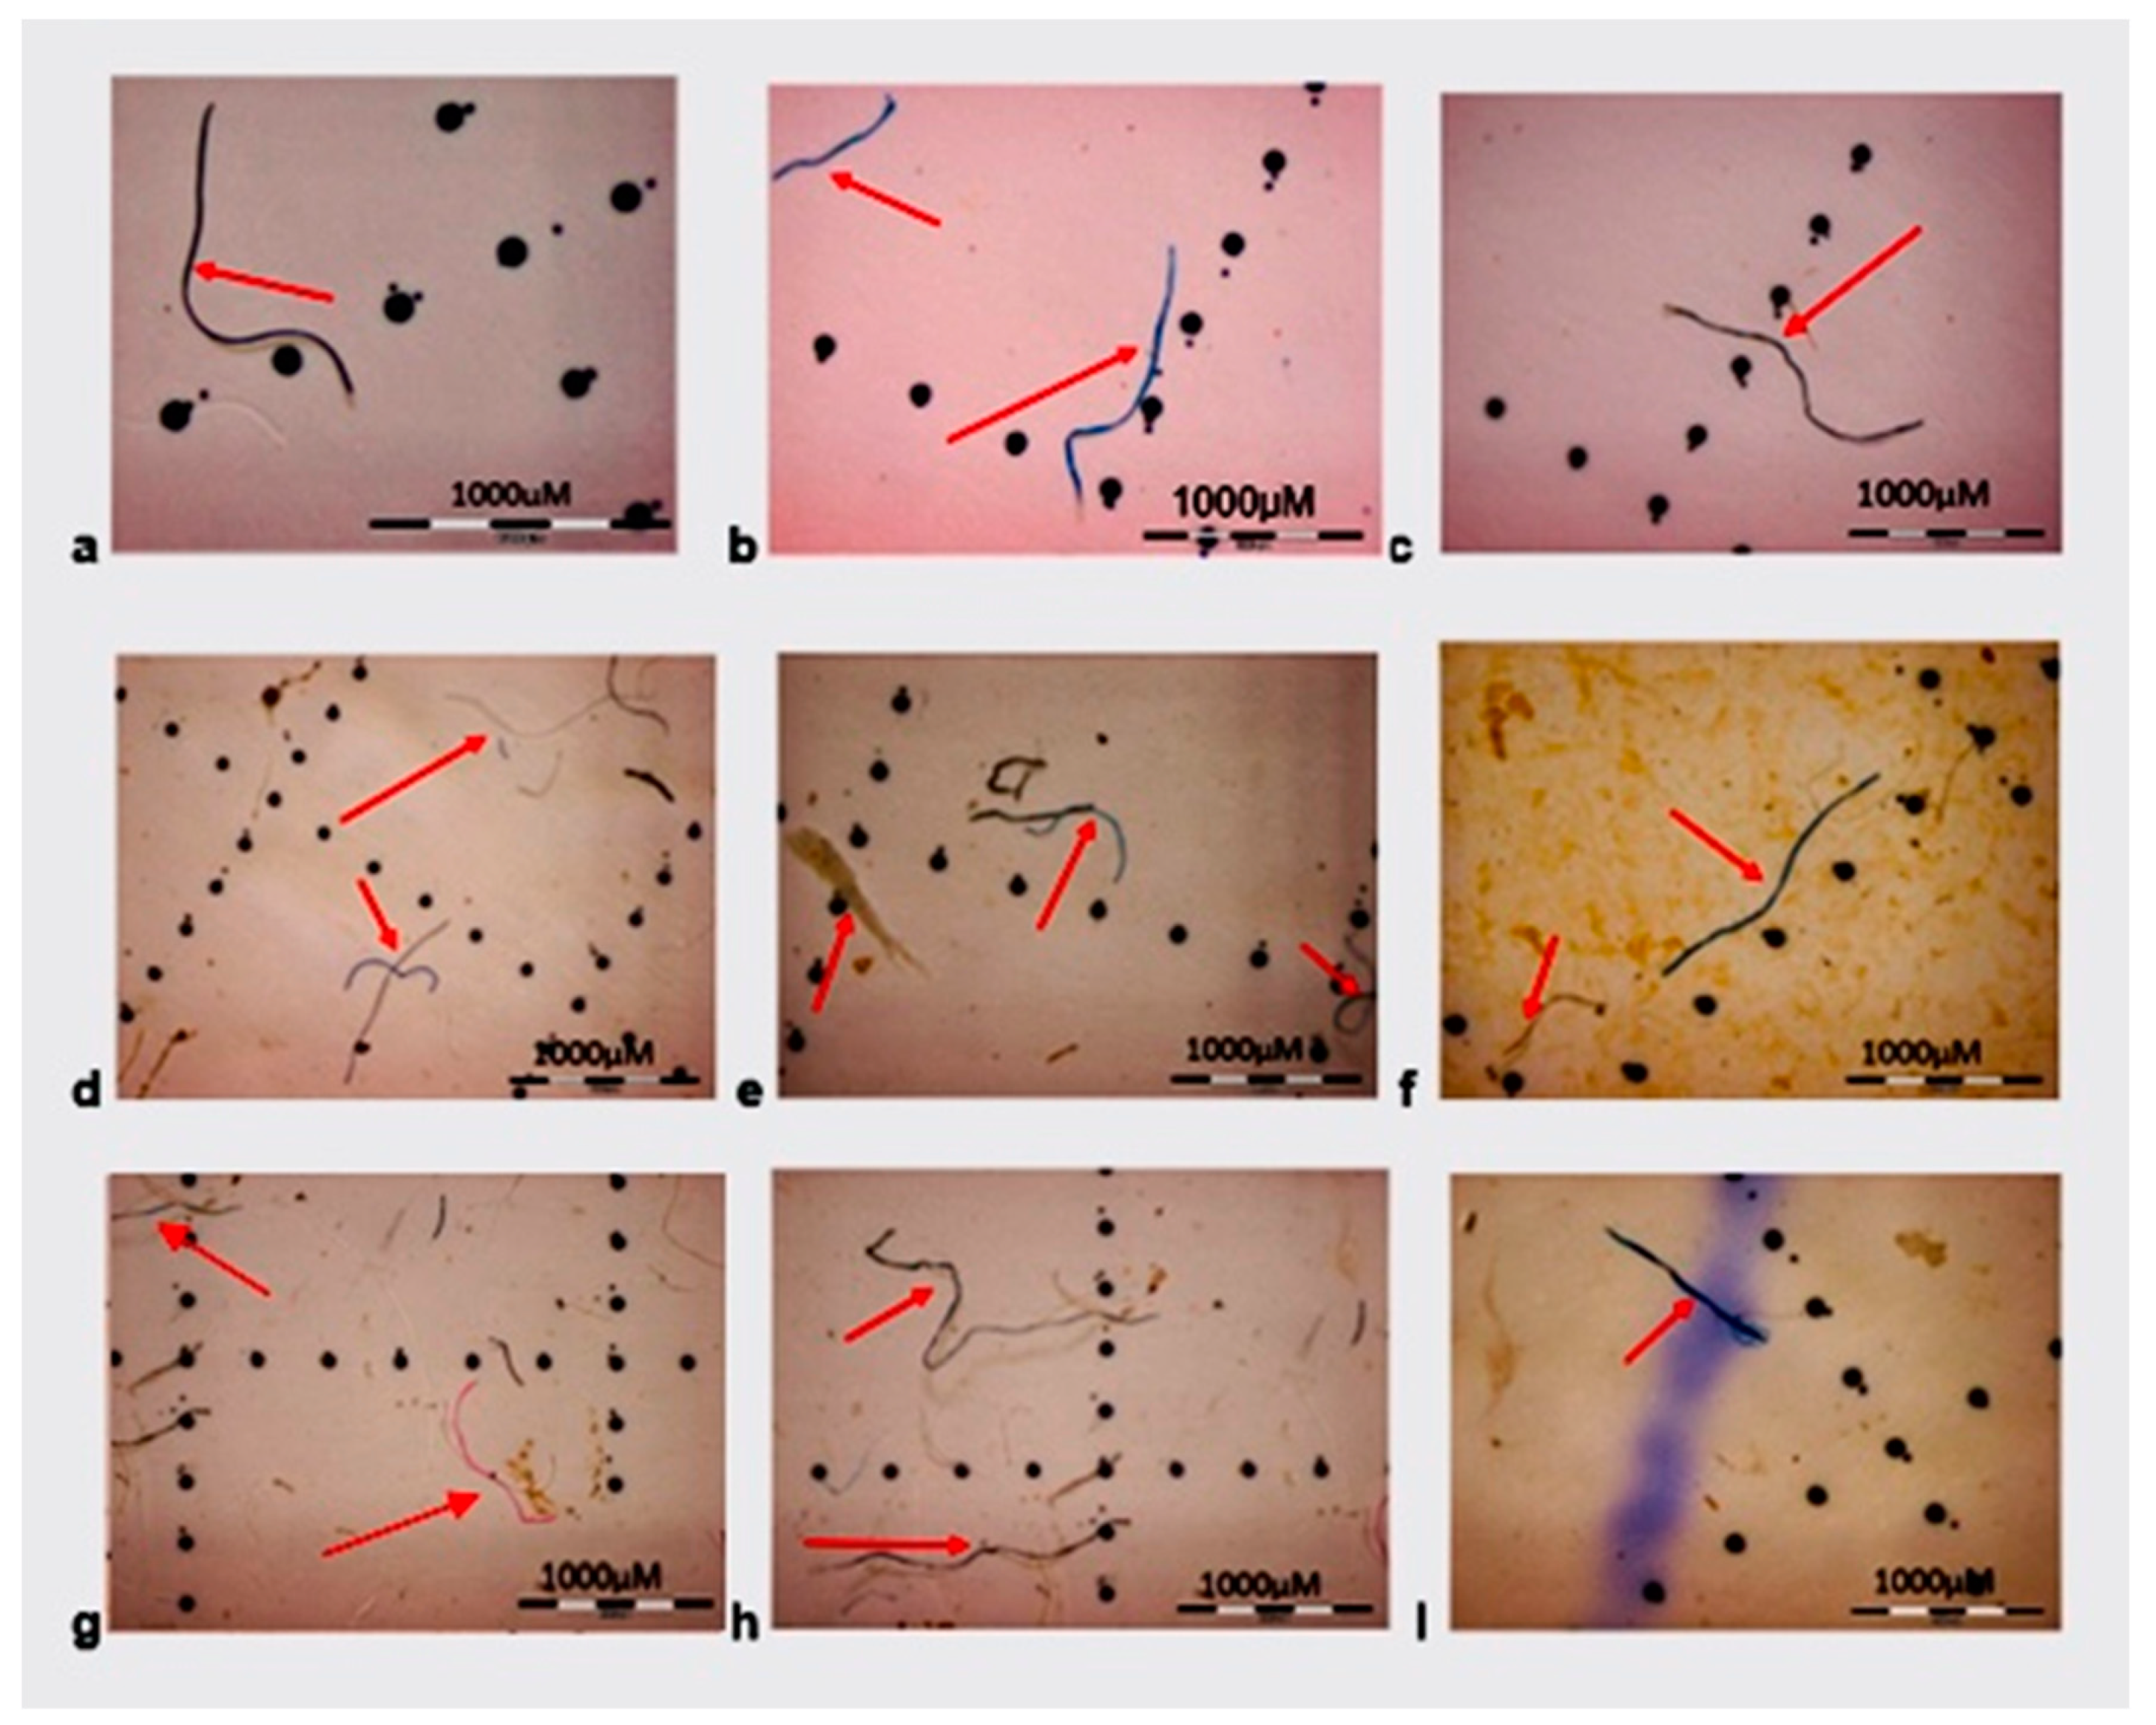
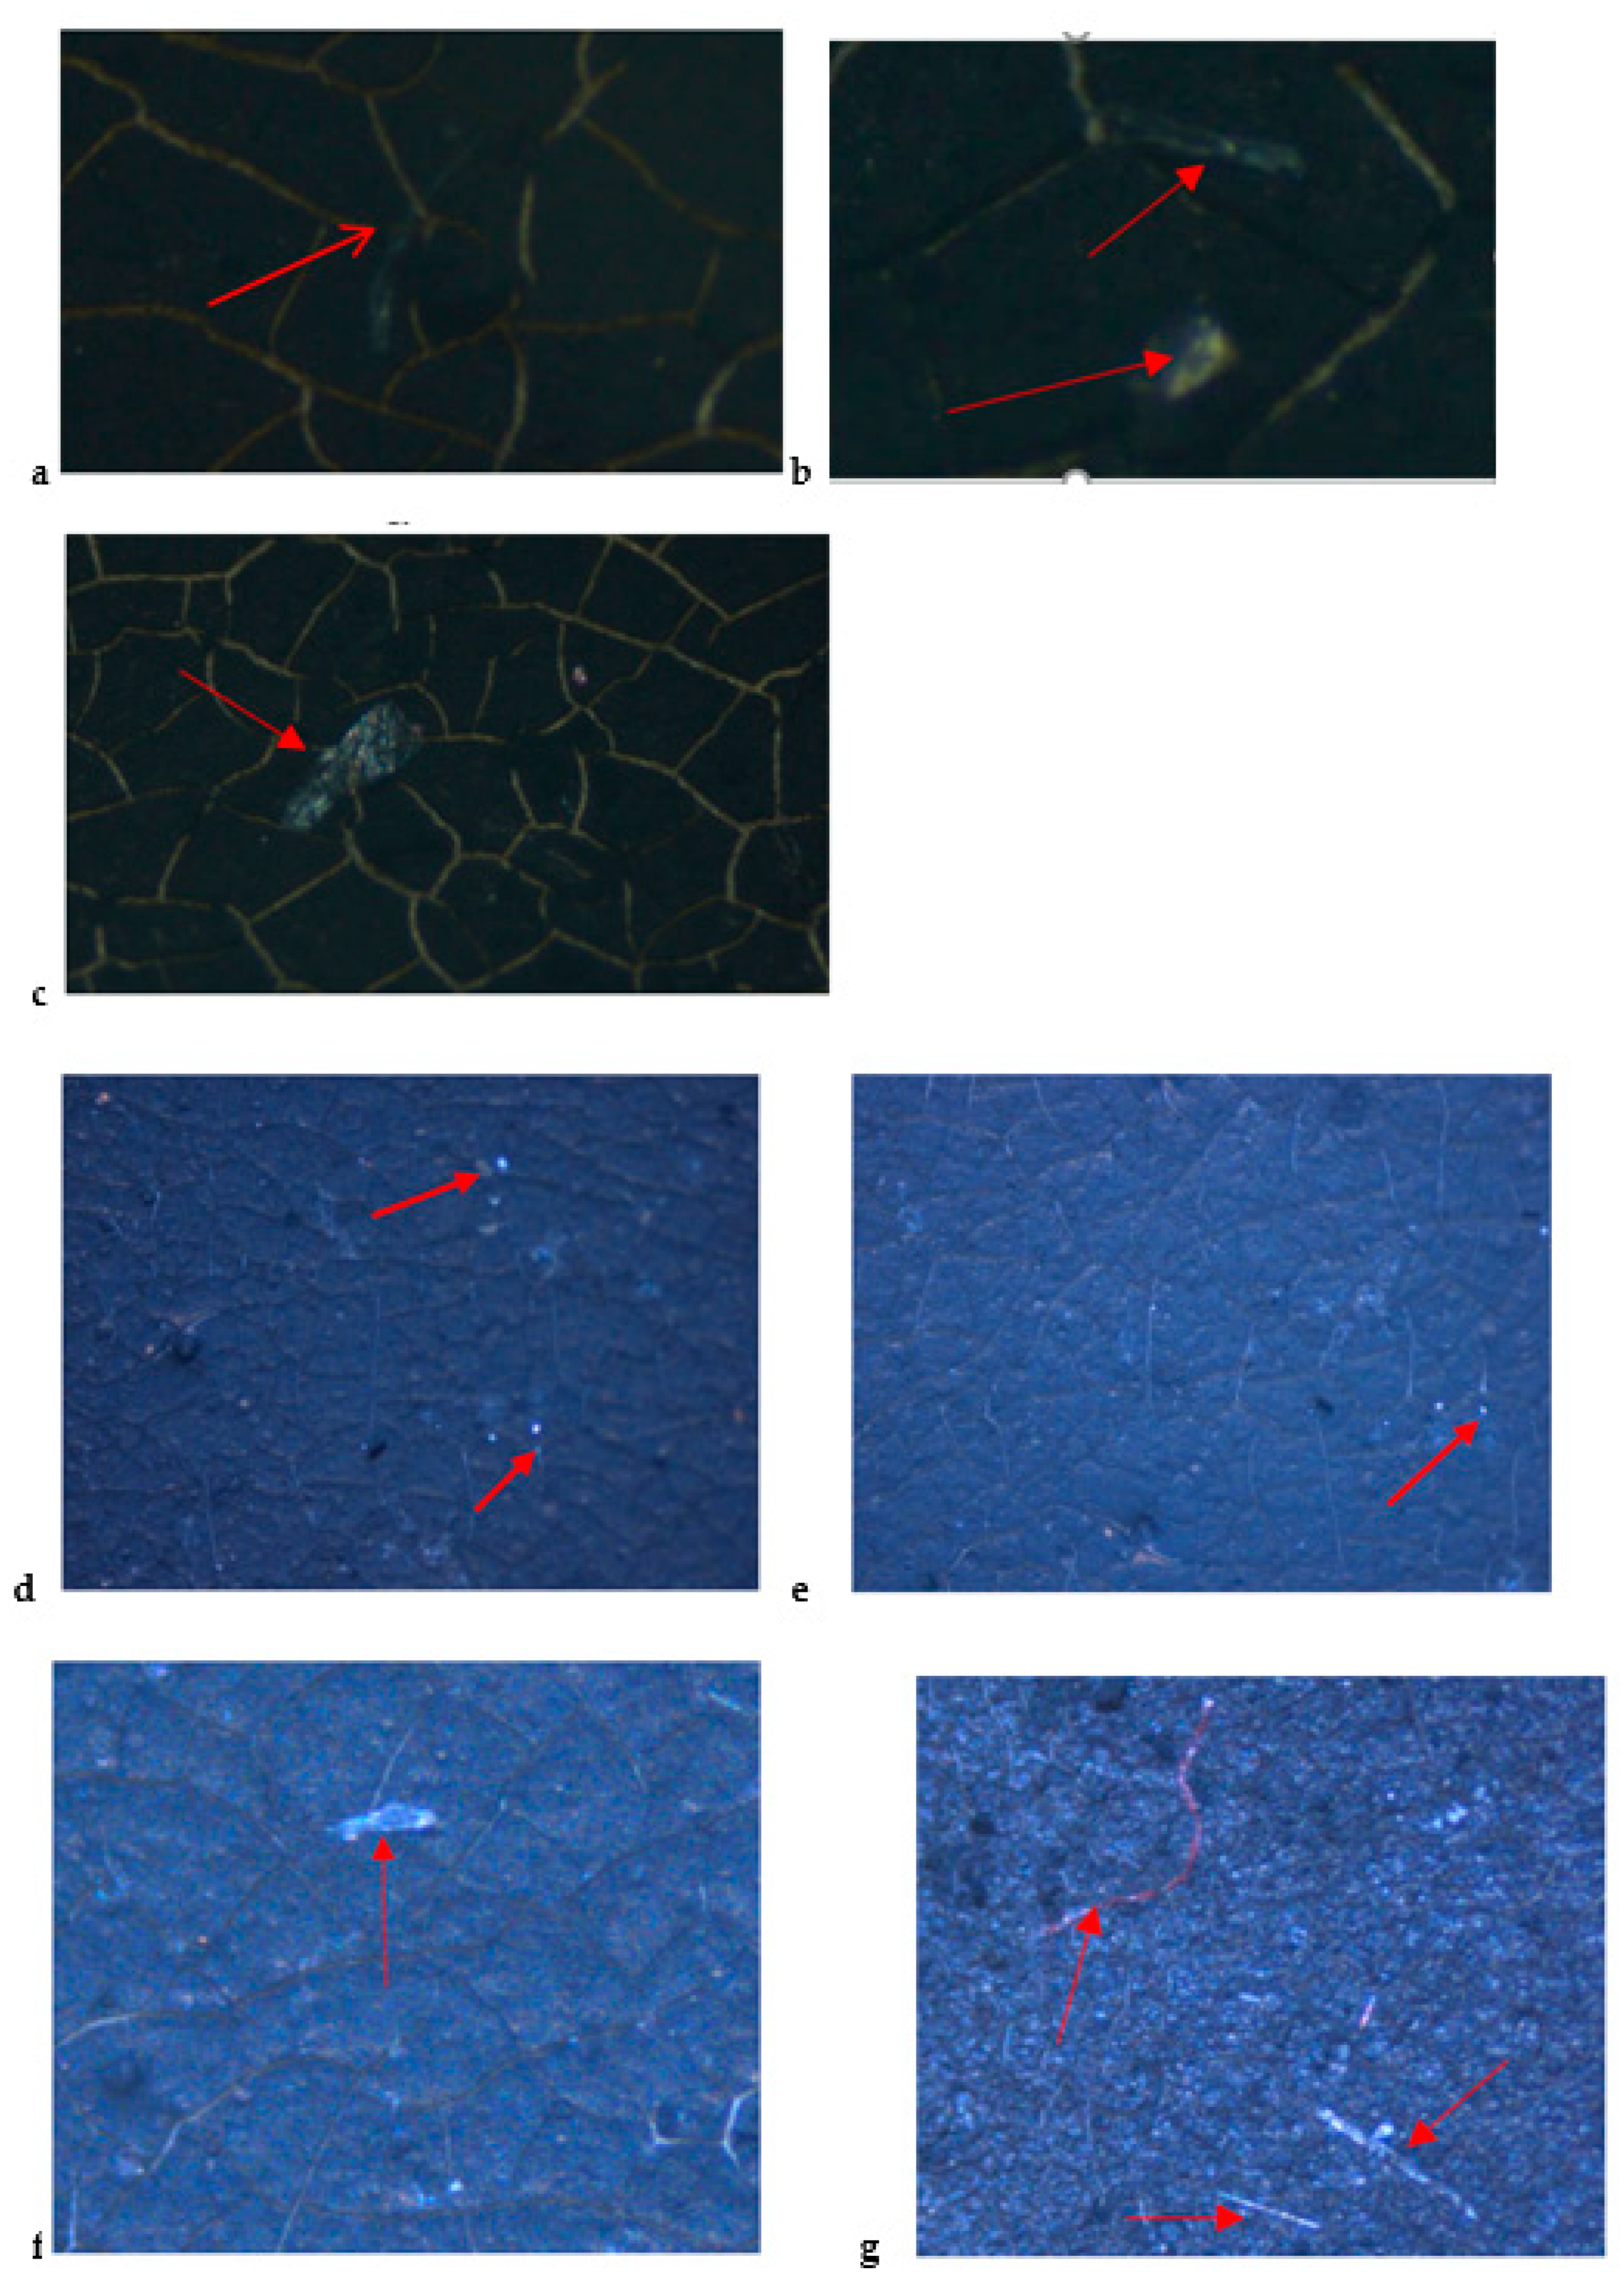
3.3. Characterization of the Filtered Microplastics
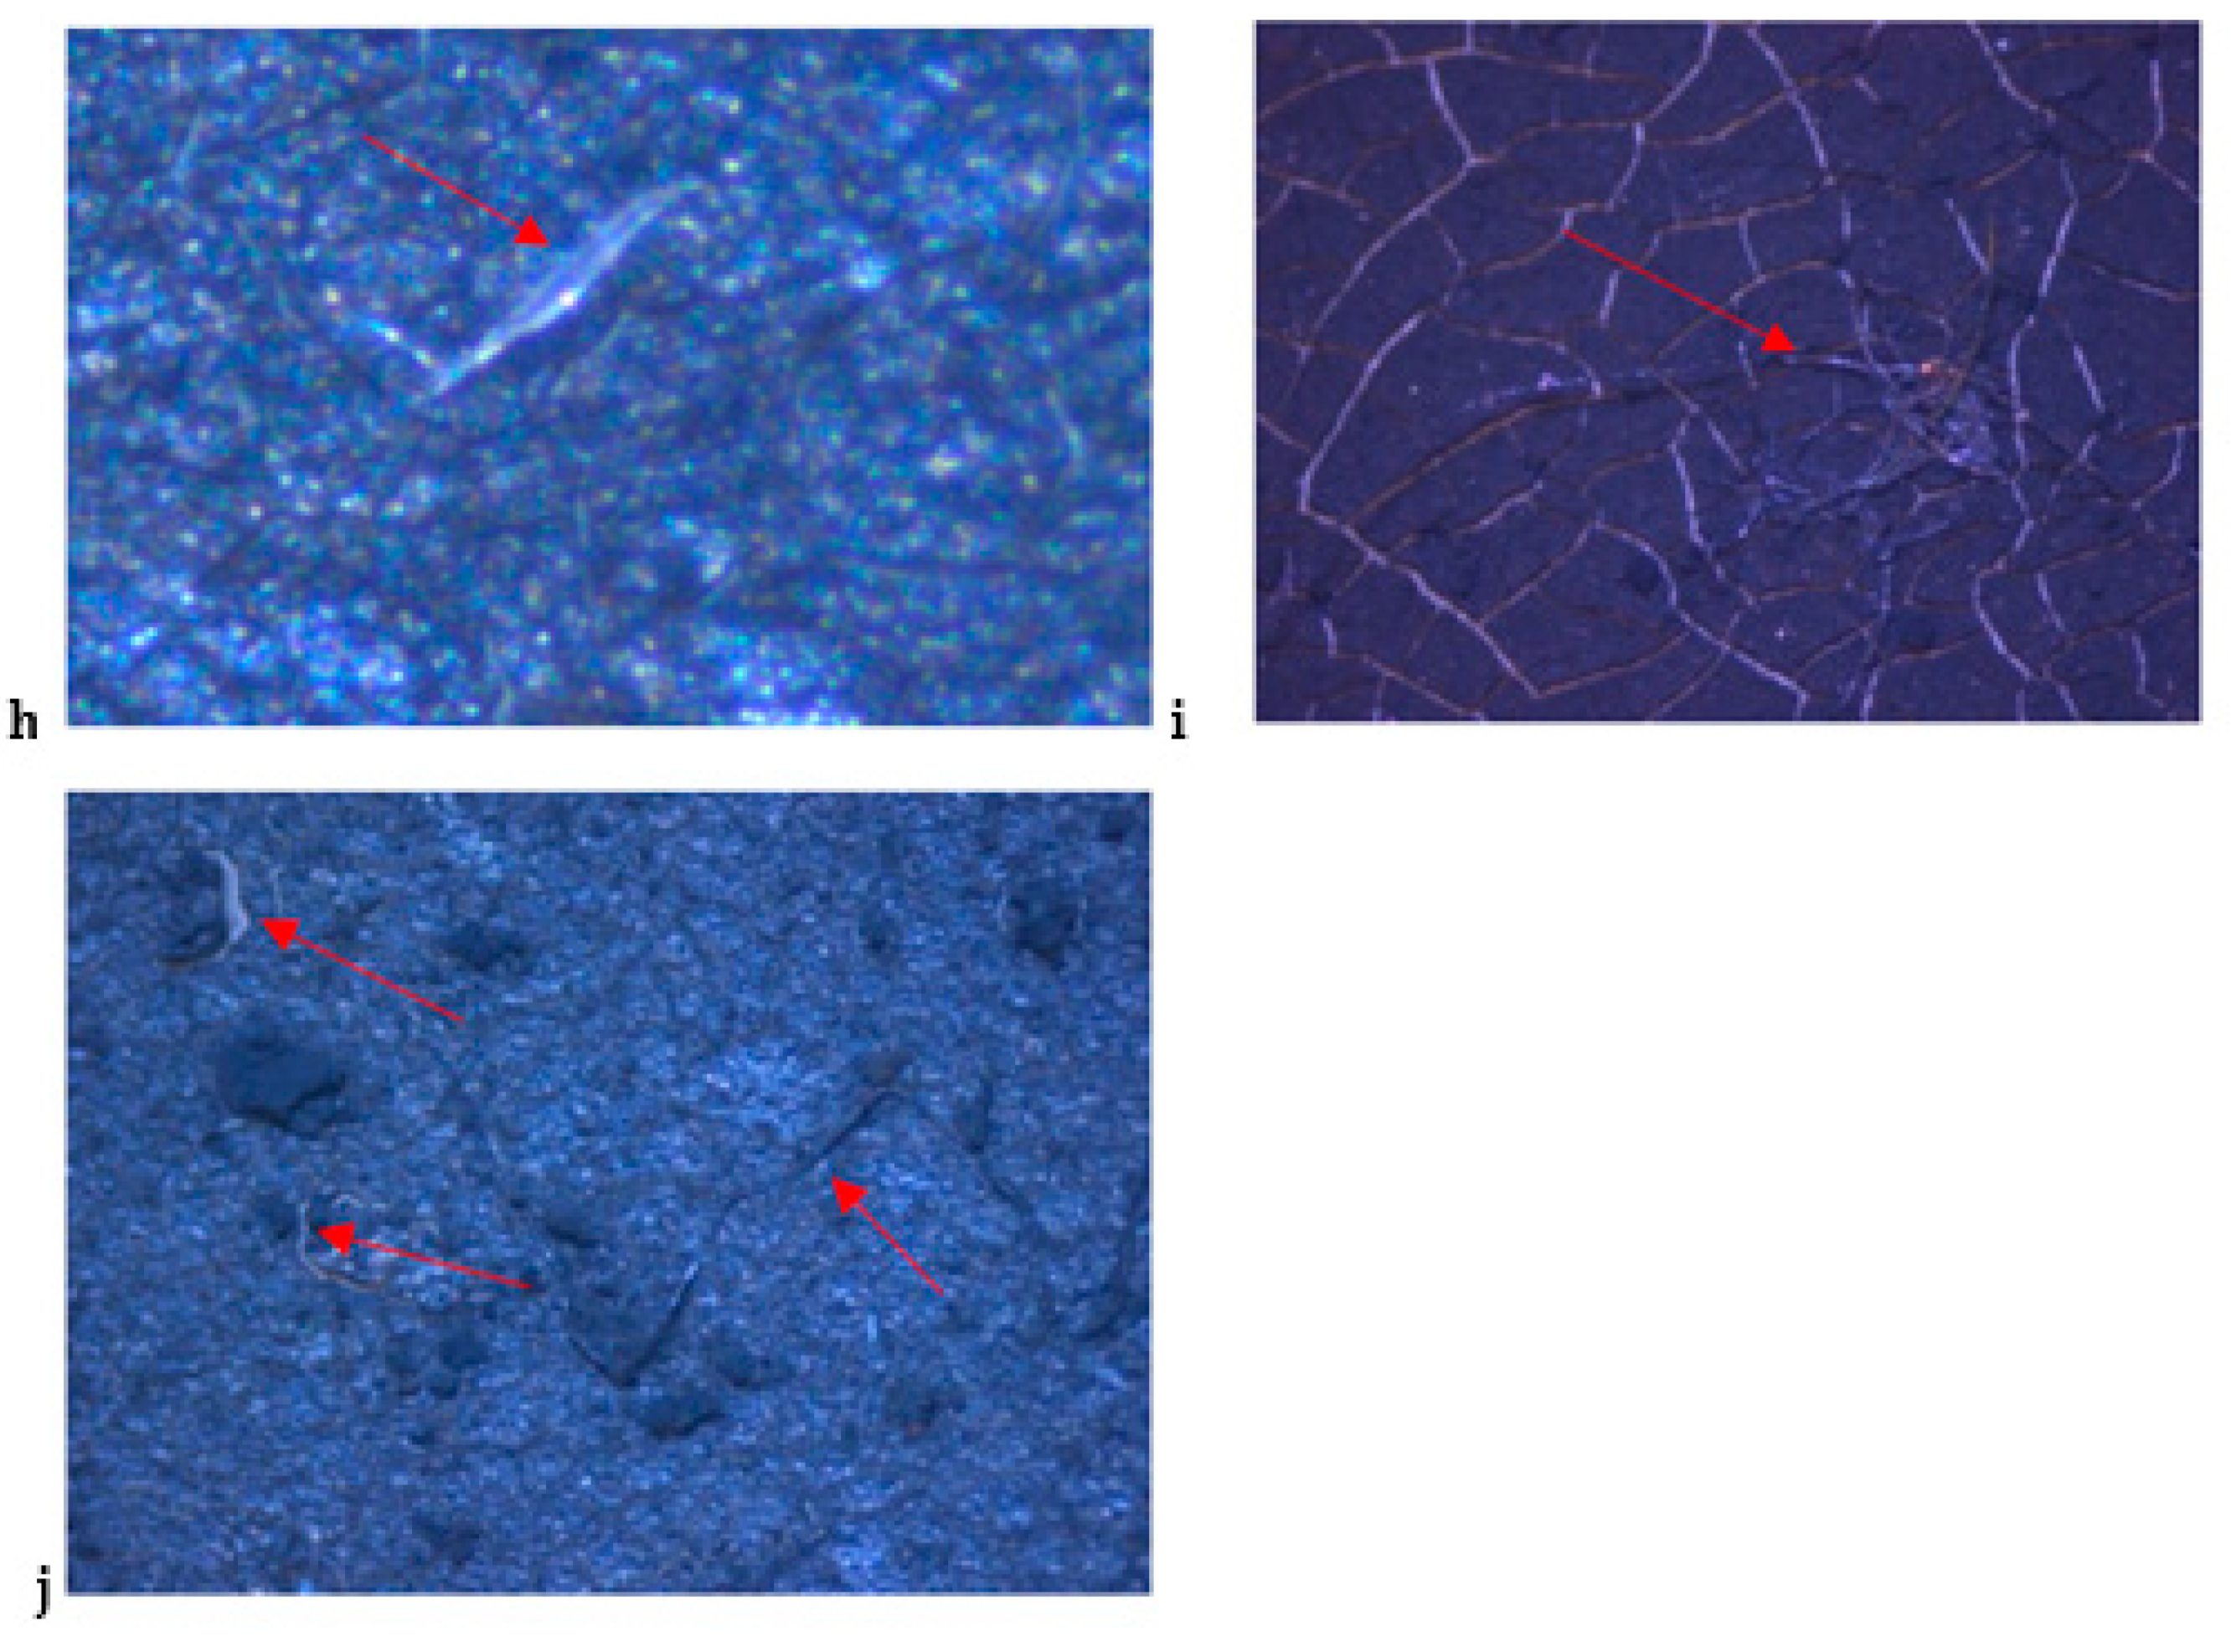
3.3.1. Visual Identification of Microplastics Using a Stereo Microscope
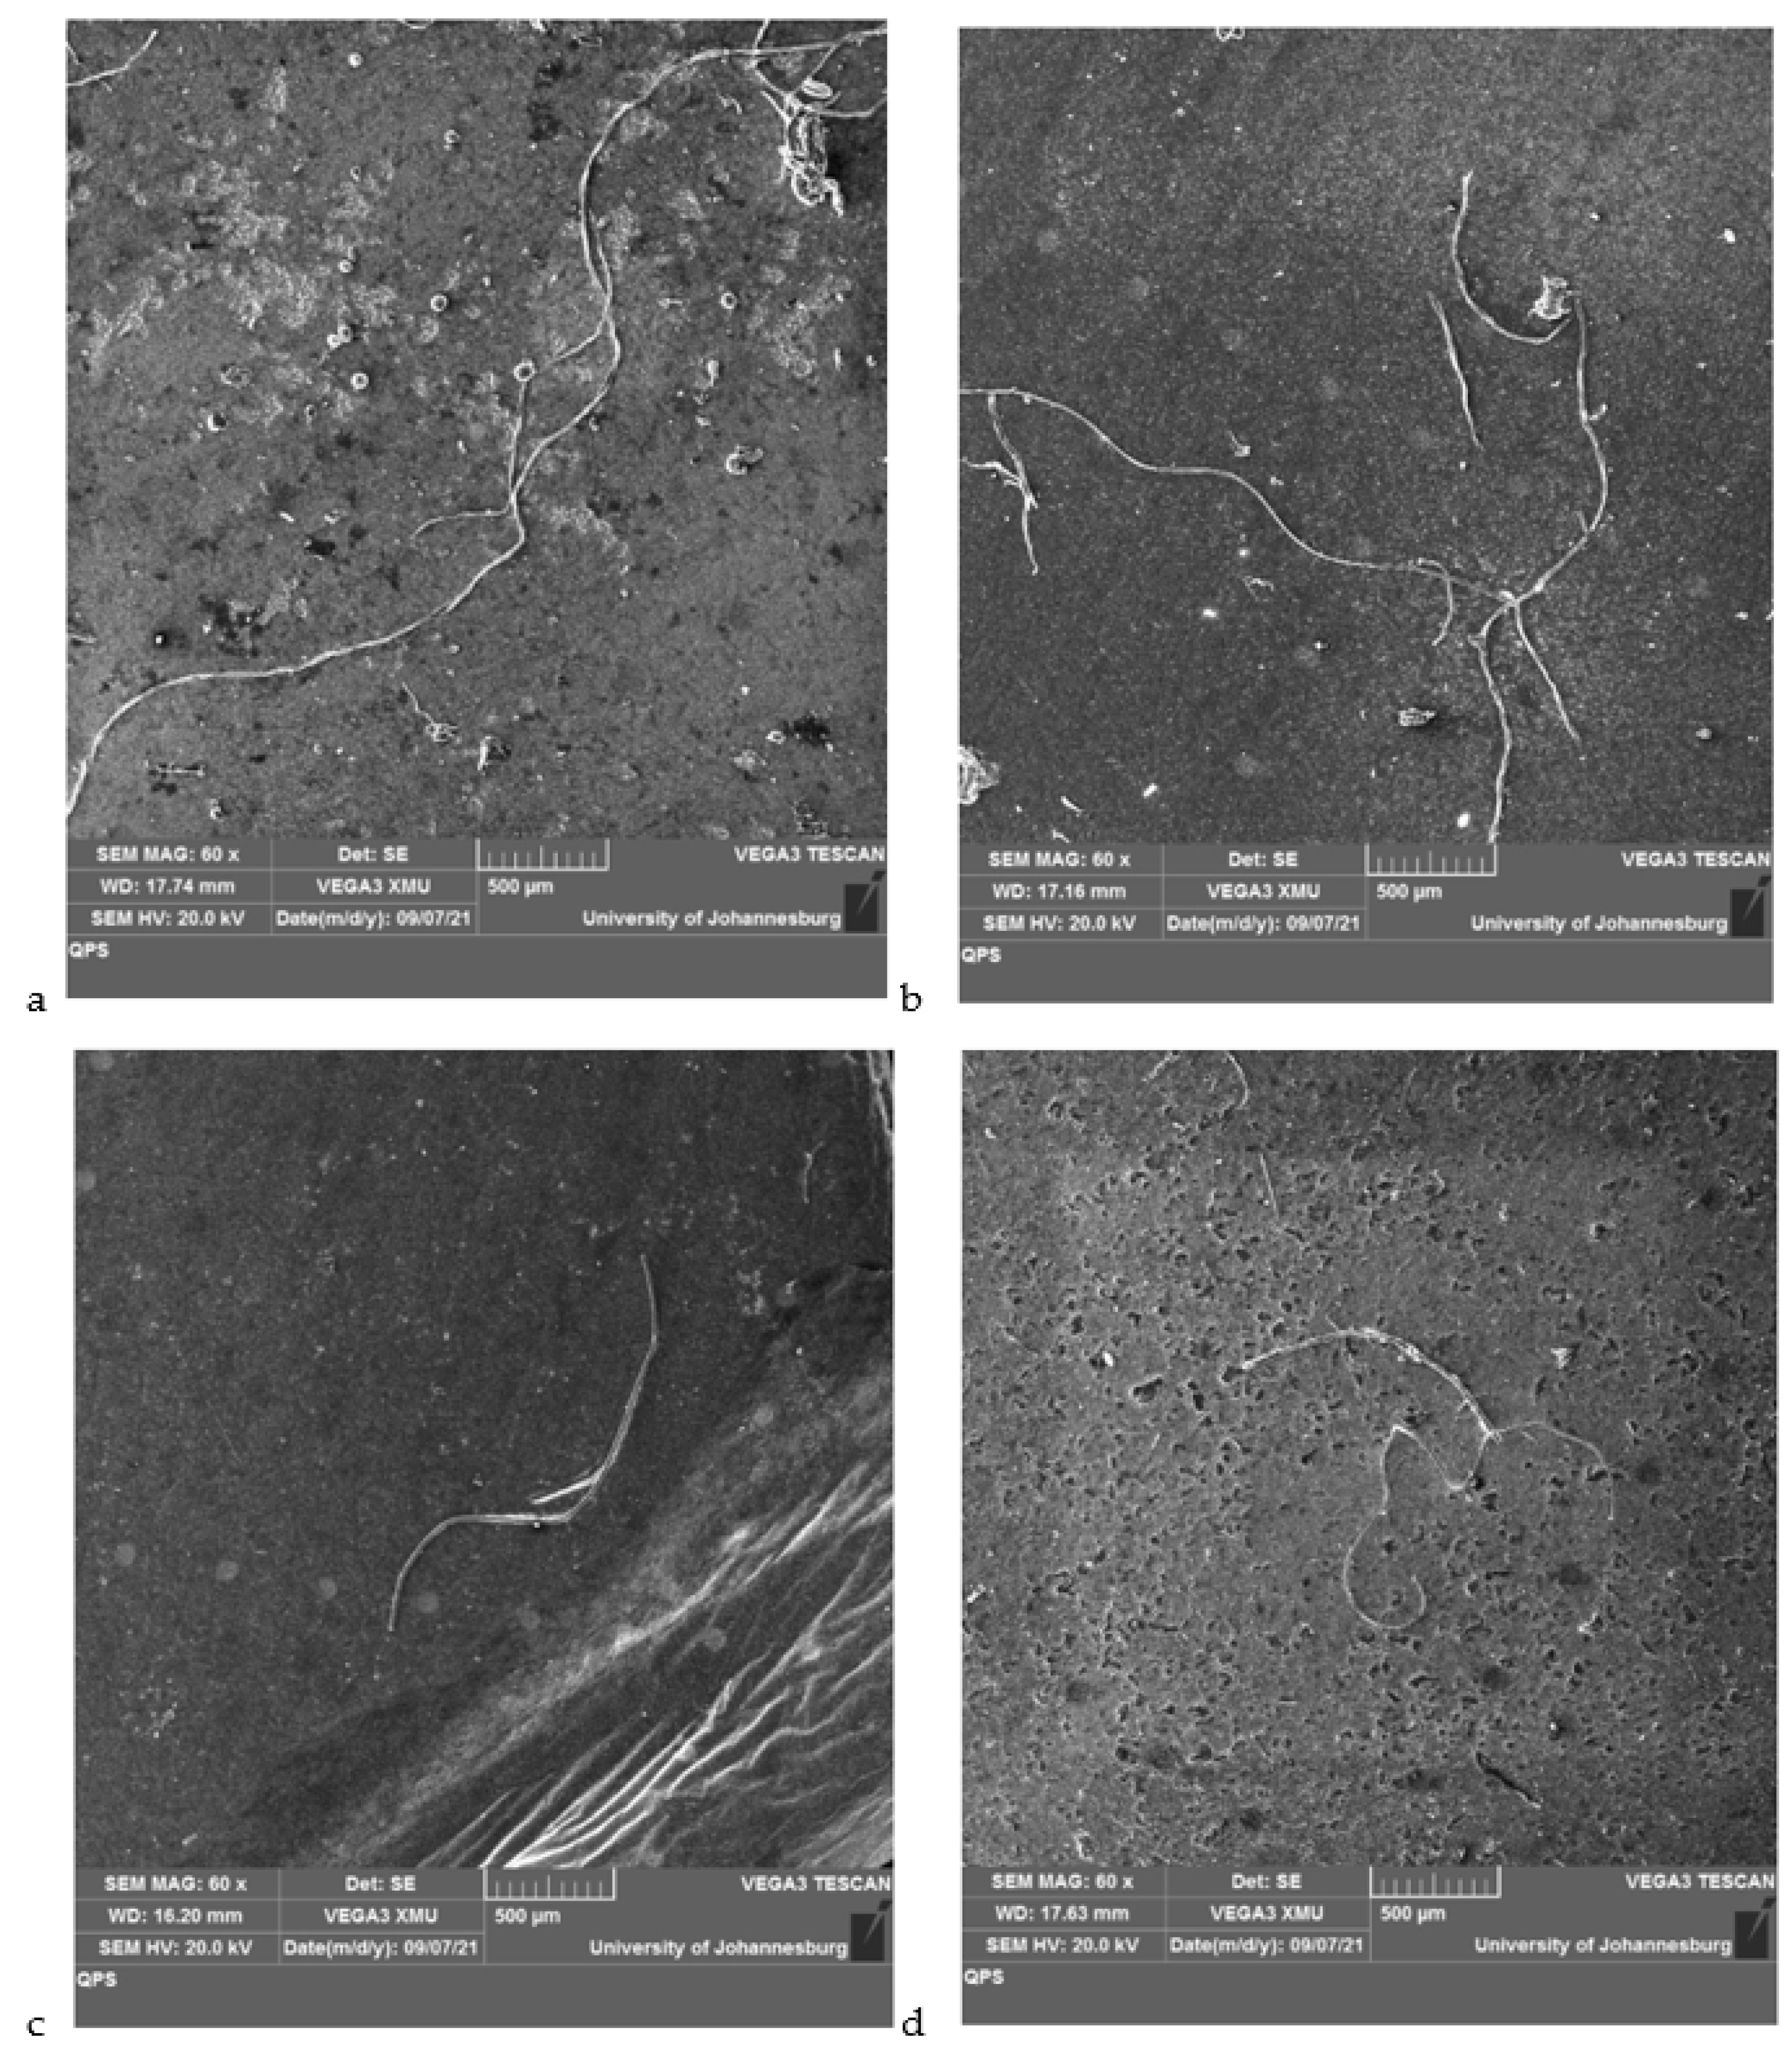
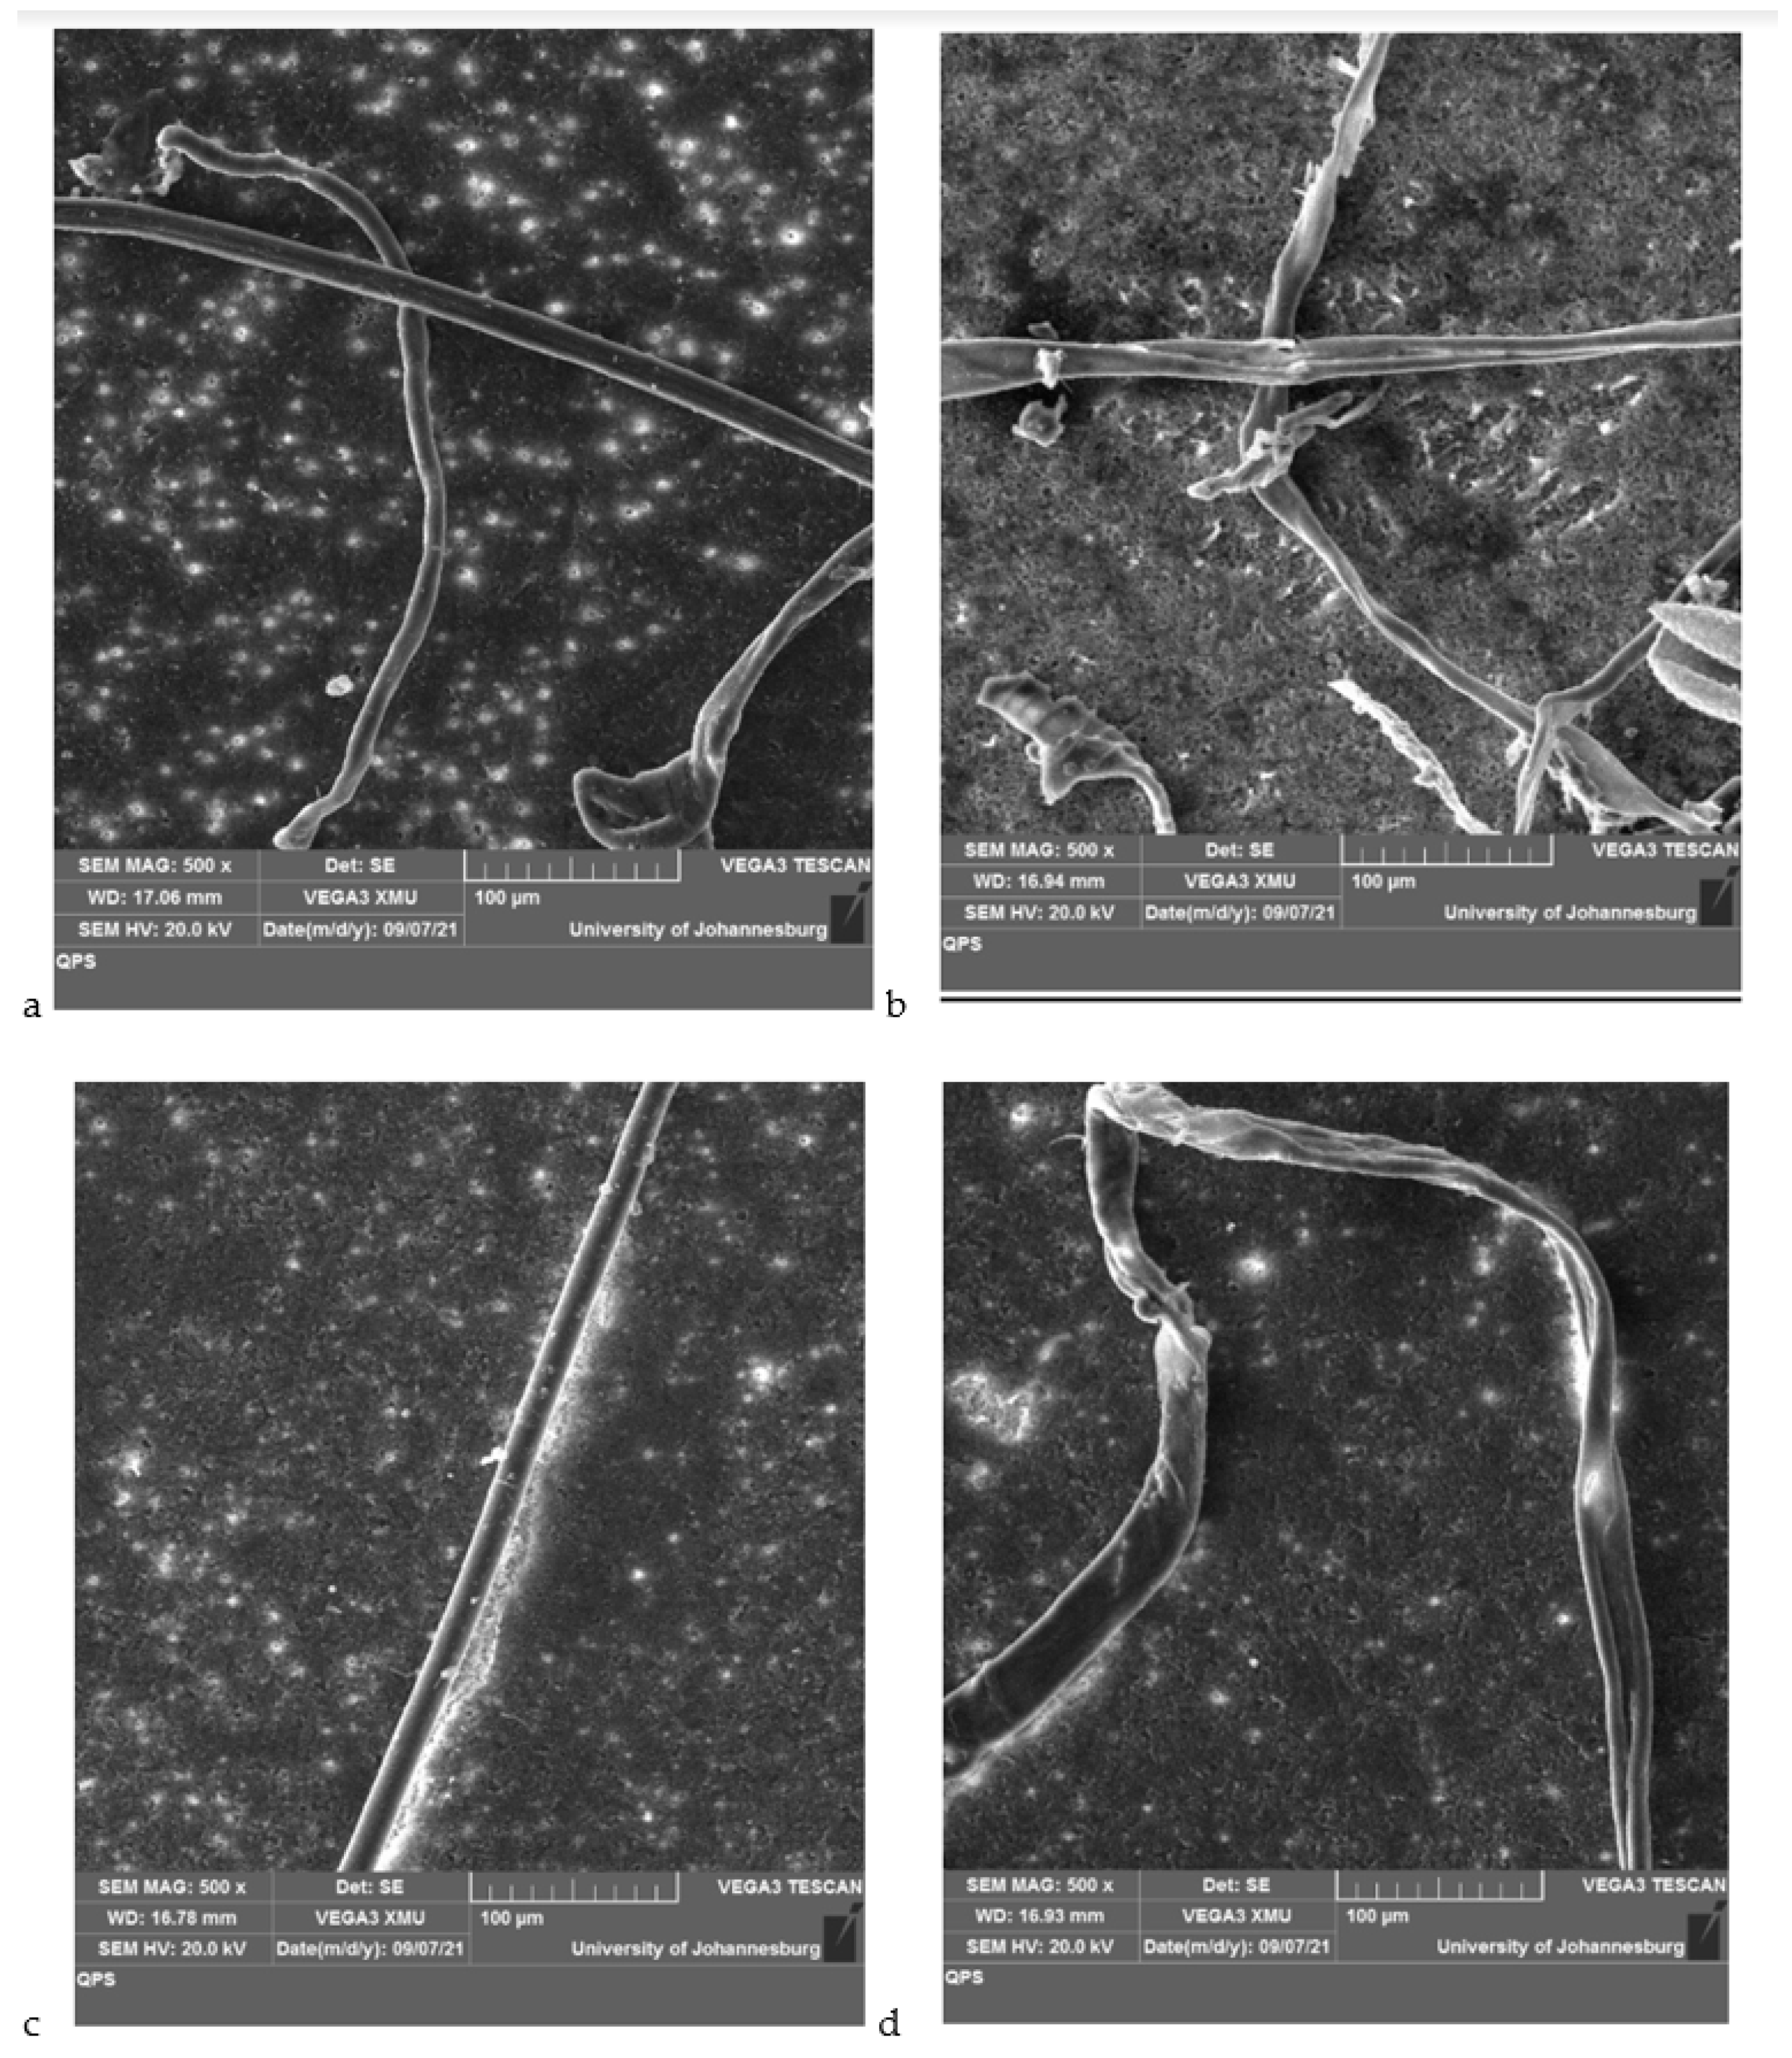
3.3.2. Morphology of Microplastics Determined by SEM
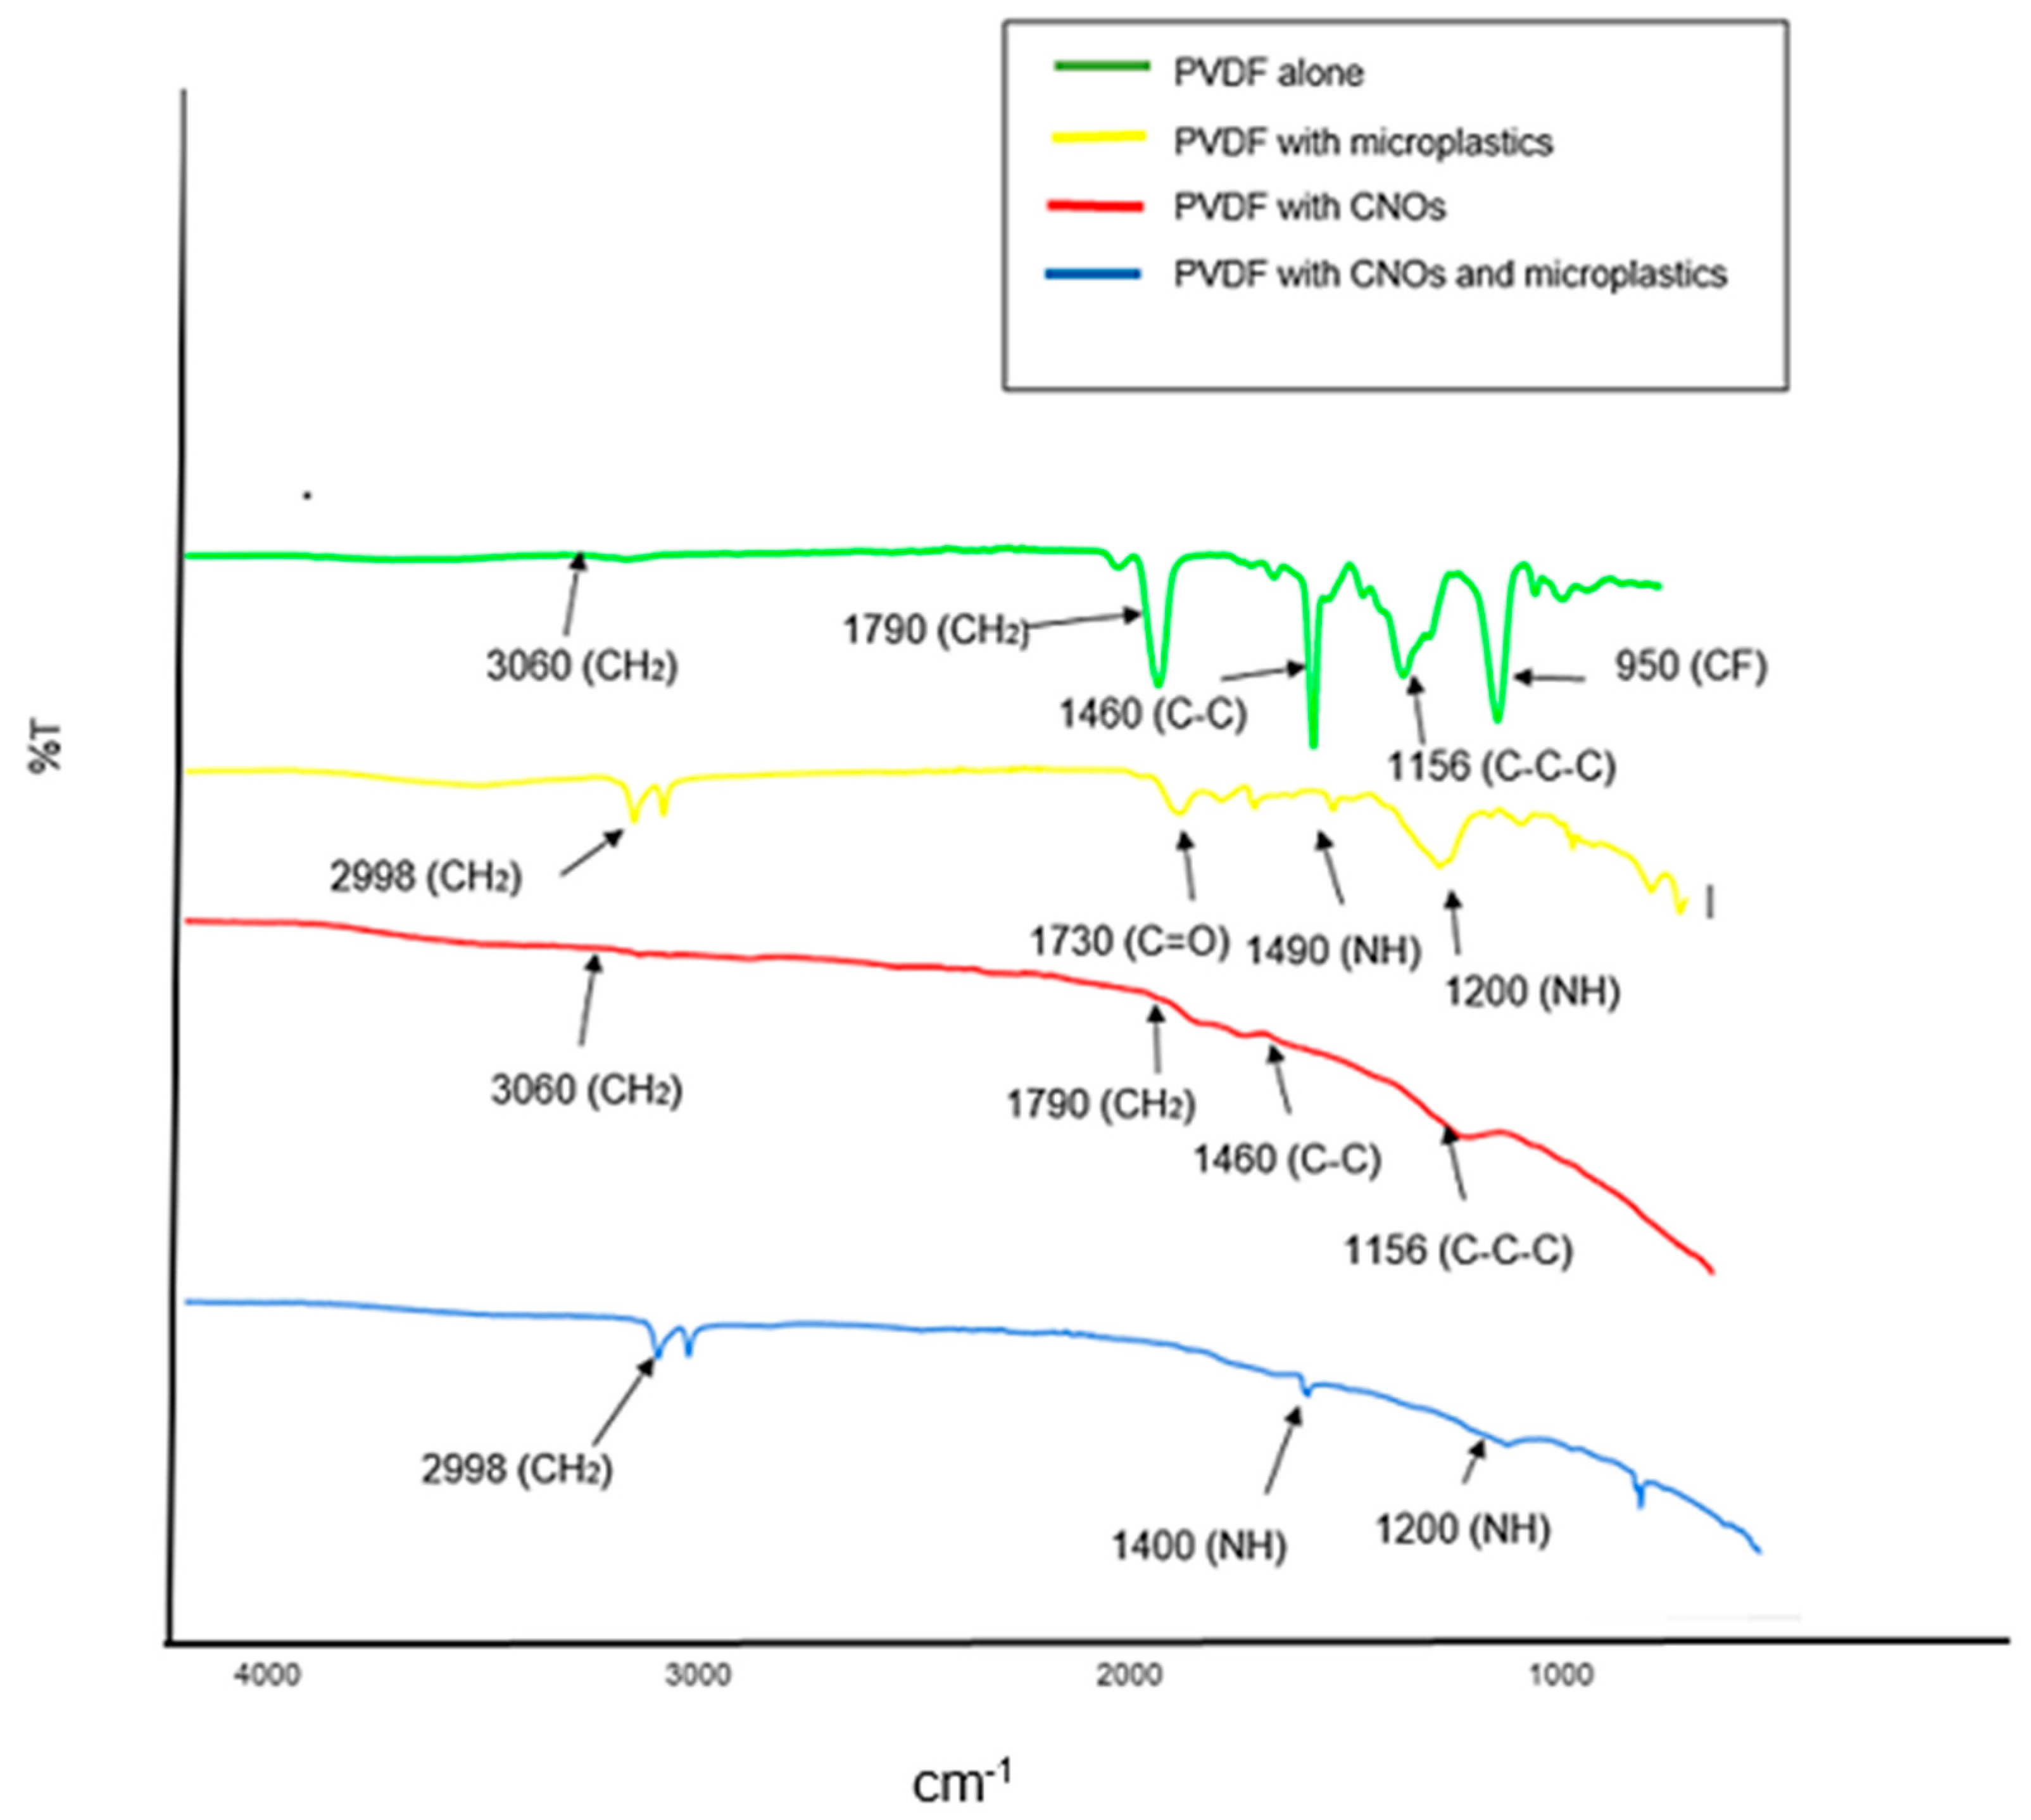
3.3.3. Composition of Microplastics Determined by ATR-FTIR
3.3.4. Characterization of Membranes before and after Filtration
3.4. Analysis of Heavy Metals Extracted from Microplastics Using ICP-OES
3.4.1. Quality Control in Analysis
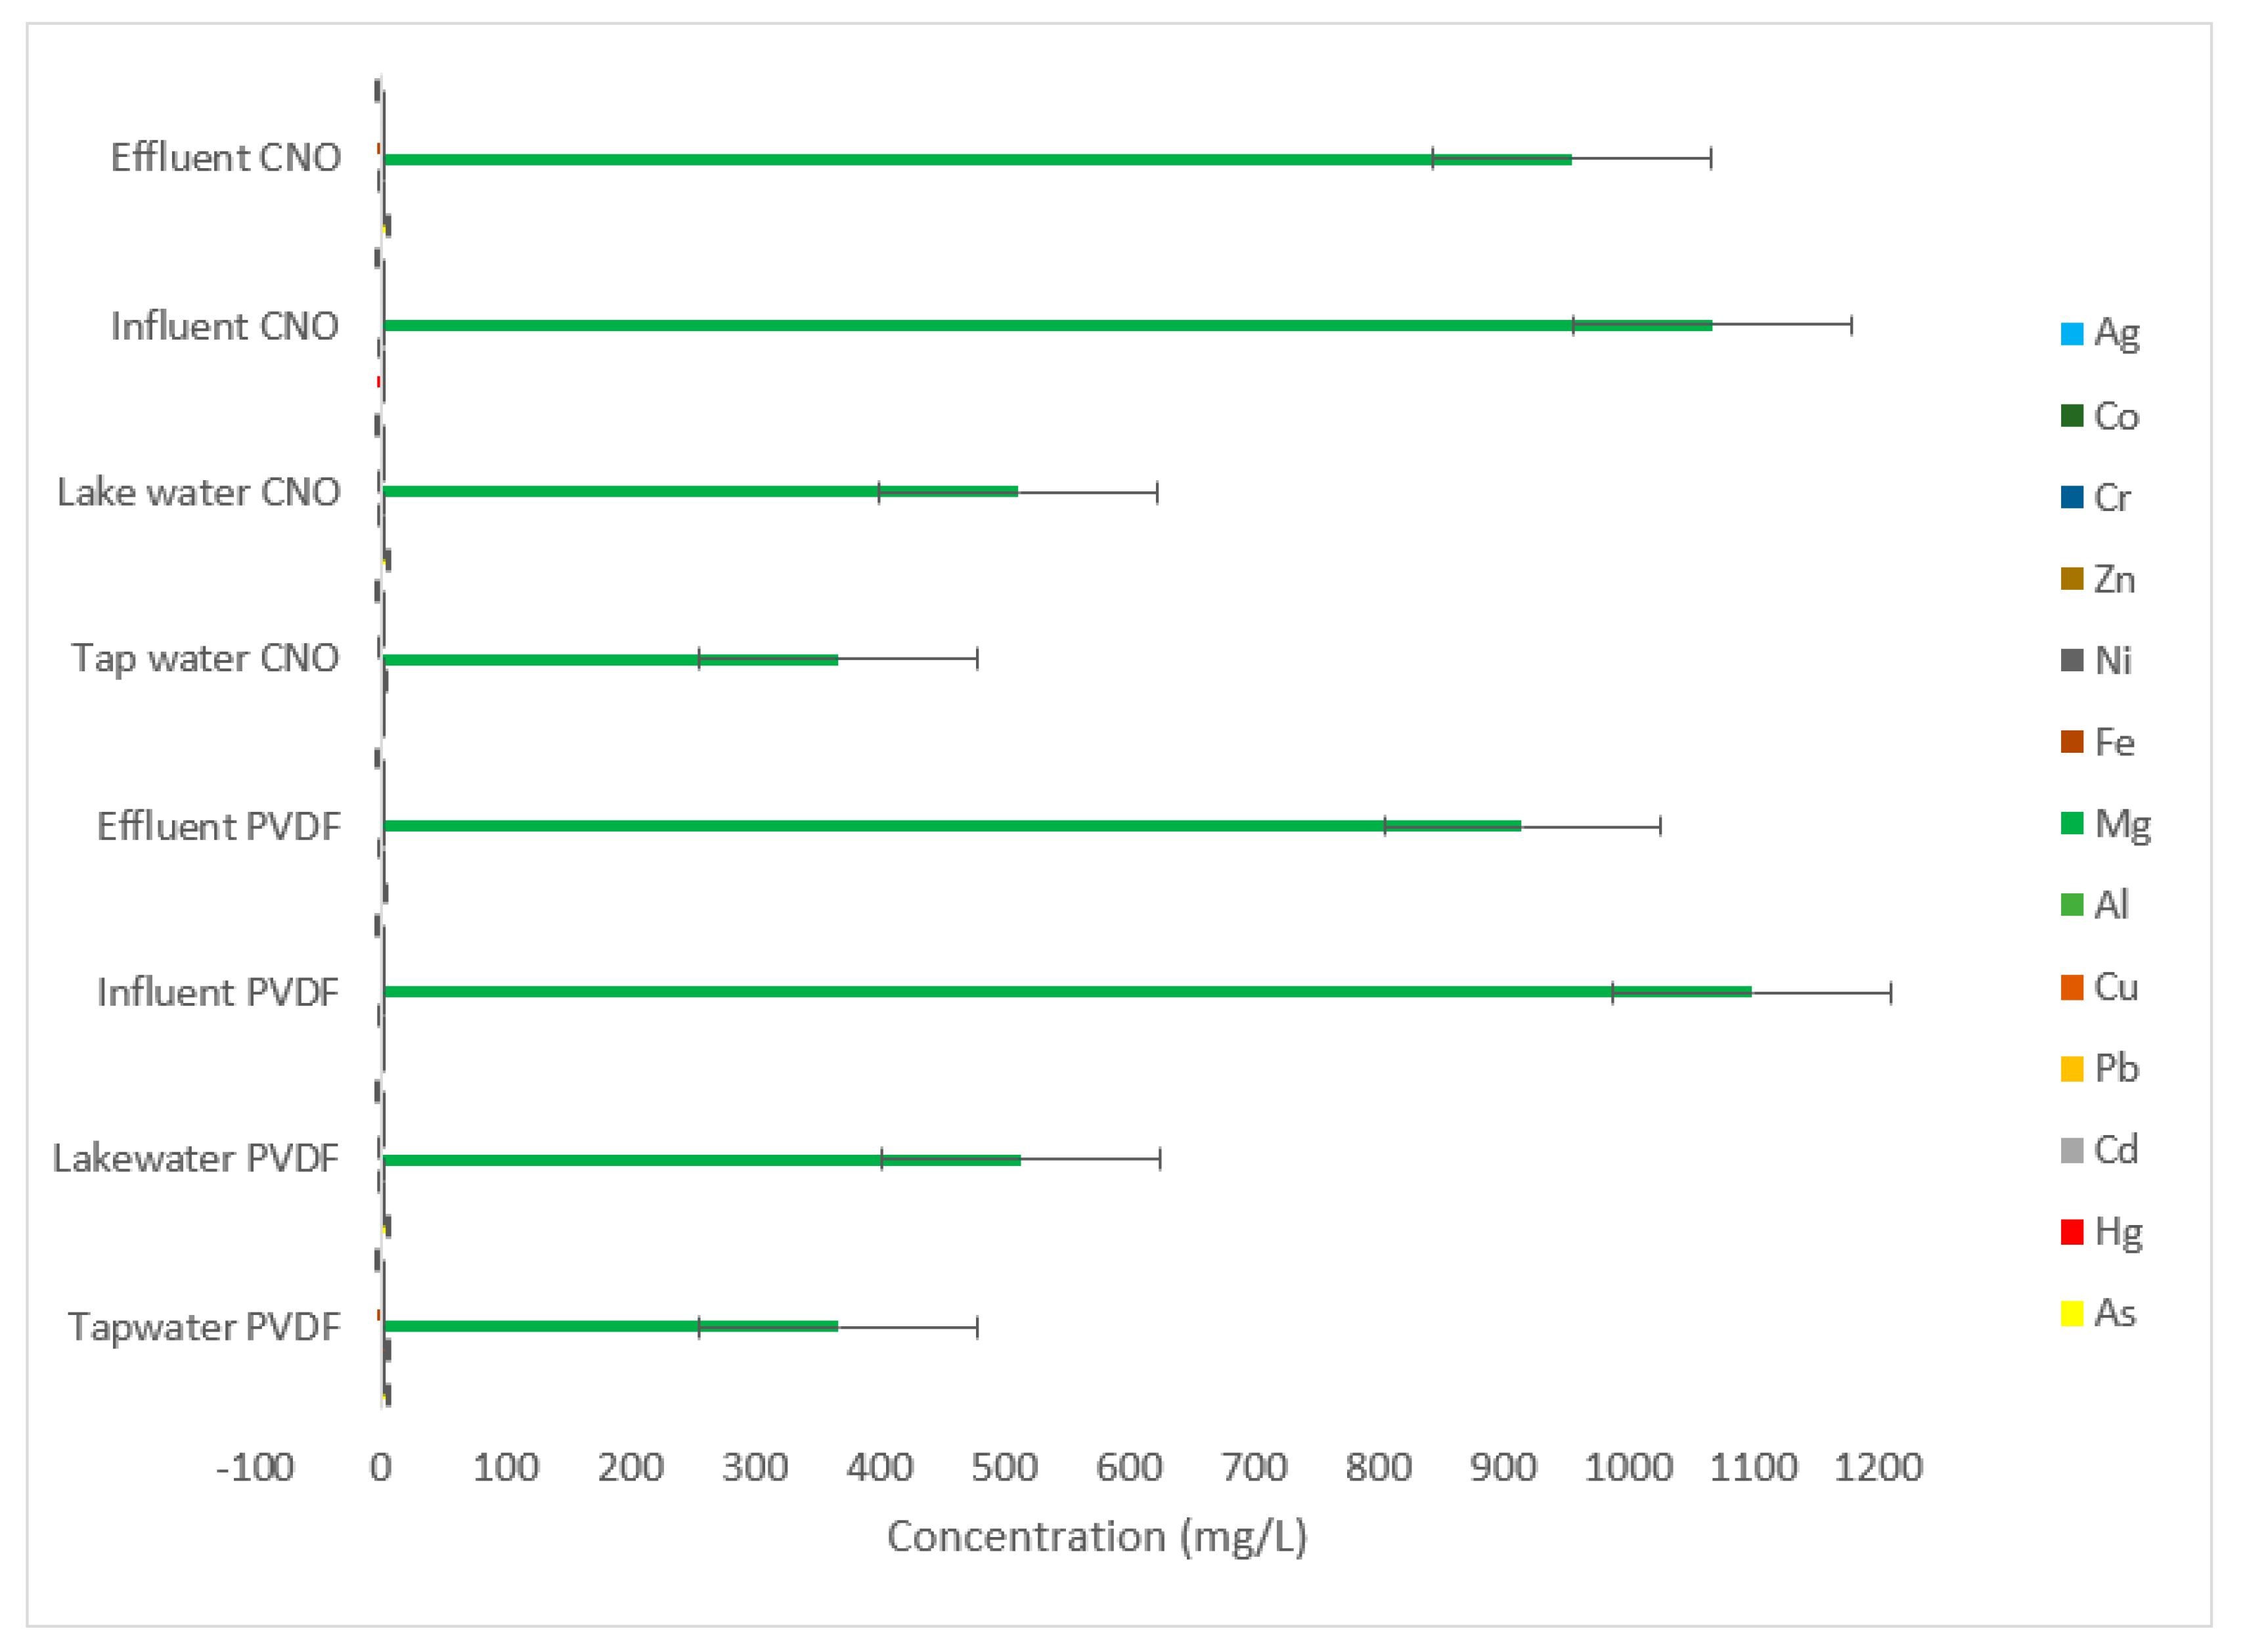
3.4.2. Concentrations of Heavy Metals in the Filtrates Obtained by ICP-OES
3.4.3. Concentrations of Heavy Metals Extracted from Microplastics in Wastewater Influent
4. Conclusions
Supplementary Materials
Author Contributions
Funding
Institutional Review Board Statement
Informed Consent Statement
Data Availability Statement
Acknowledgments
Conflicts of Interest
References
- Nabi, I.; Bacha, A.U.; Li, K.; Cheng, H.; Wang, T.; Liu, Y.; Ajmal, S.; Yang, Y.; Feng, Y.; Zhang, L. Complete photocatalytic mineralization of microplastic on TiO2 nanoparticle film. iScience 2020, 23, 101326. [Google Scholar] [CrossRef]
- Wang, L.; Kaeppler, A.; Fischer, D.; Simmchen, J. Photocatalytic TiO2 micromotors for removal of microplastics and suspended matter. ACS Appl. Mater. Interfaces 2019, 11, 32937–32944. [Google Scholar] [CrossRef]
- Uheida, A.; Mejía, H.G.; Abdel-Rehim, M.; Hamd, W.; Dutta, J. Visible light photocatalytic degradation of polypropylene microplastics in a continuous water flow system. J. Hazard. Mater. 2021, 406, 124299. [Google Scholar] [CrossRef]
- Thompson, R.C.; Moore, C.J.; Vom Saal, F.S.; Swan, S.H. Plastics, the environment and human health: Current consensus and future trends. Philos. Trans. R. Soc. B 2009, 364, 2153–2166. [Google Scholar] [CrossRef]
- Cheung, P.K.; Fok, L. Characterisation of plastic microbeads in facial scrubs and their estimated emissions in Mainland China. Water Res. 2015, 122, 53–61. [Google Scholar] [CrossRef]
- Fendall, L.S.; Sewell, M.A. Contributing to marine pollution by washing your face: Microplastics in facial cleansers. Mar. Pollut. Bull. 2009, 58, 1225–1228. [Google Scholar] [CrossRef]
- Campanale, C.; Massarelli, C.; Savino, I.; Locaputo, V.; Uricchio, V.F. A detailed review study on potential effects of microplastics and additives of concern on human health. Int. J. Environ. Res. Public Health 2020, 17, 1212. [Google Scholar] [CrossRef] [Green Version]
- Liu, S.; Shi, J.; Wang, J.; Dai, Y.; Li, H.; Li, J.; Liu, X.; Chen, X.; Wang, Z.; Zhang, P. Interactions between microplastics and heavy metals in aquatic environments: A review. Front. Microbiol. 2021, 12, 730. [Google Scholar] [CrossRef]
- Santillo, D.; Miller, K.; Johnston, P. Microplastics as contaminants in commercially important seafood species. IEAM 2017, 13, 516–521. [Google Scholar] [CrossRef]
- Anderson, J.C.; Park, B.J.; Palace, V.P. Microplastics in aquatic environments: Implications for Canadian ecosystems. Environ. Pollut. 2016, 218, 269–280. [Google Scholar] [CrossRef] [Green Version]
- Ivleva, N.P.; Wiesheu, A.C.; Niessner, R. Microplastic in aquatic ecosystems. Angew. Chem. Int. Ed. 2016, 56, 1720–1739. [Google Scholar] [CrossRef]
- Kumar, P.; Kim, K.H.; Bansal, V.; Lazarides, T.; Kumar, N. Progress in the sensing techniques for heavy metal ions using nanomaterials. J. Ind. Eng. Chem. 2017, 54, 30–43. [Google Scholar] [CrossRef]
- Verster, C.; Minnaar, K.; Bouwman, H. Marine and freshwater microplastics research in South Africa. IEAM 2017, 13, 533–535. [Google Scholar] [CrossRef]
- Ziajahromi, S.; Neale, P.; Rintoul, L.; Leusch, F.D. Wastewater treatment plants as a pathway for microplastics: Development of a new approach to sample wastewater-based microplastics. Water Res. 2017, 112, 93–99. [Google Scholar] [CrossRef]
- Napper, I.E.; Thompson, R.C. Release of synthetic microplastic plastic fibres from domestic washing machines: Effects of fabric type and washing conditions. Mar. Pollut. Bull. 2016, 112, 39–45. [Google Scholar] [CrossRef] [Green Version]
- Raju, N.S.; Carbery, M.; Kuttykattil, A.; Senathirajah, K.; Lundmark, A.; Rogers, Z.; SCB, S.; Evans, G.; Palanisami, T. Improved methodology to determine the fate and transport of microplastics in a secondary wastewater treatment plant. Water Res. 2020, 173, 115549. [Google Scholar] [CrossRef]
- Franco, A.A.; Arellano, J.M.; Albendín, G.; Rodríguez-Barroso, R.; Quiroga, J.M.; Coello, M.D. Microplastic pollution in wastewater treatment plants in the city of Cádiz: Abundance, removal efficiency and presence in receiving water body. Sci. Total Environ. 2021, 776, 145795. [Google Scholar] [CrossRef]
- Yang, Z.; Li, S.; Ma, S.; Liu, P.; Peng, D.; Ouyang, Z.; Guo, X. Characteristics and removal efficiency of microplastics in sewage treatment plant of Xi’an City, northwest China. Sci. Total Environ. 2021, 771, 145377. [Google Scholar] [CrossRef]
- Malankowska, M.; Echaide-Gorriz, C.; Coronas, J. Microplastics in marine environment: A review on sources, classification, and potential remediation by membrane technology. Environ. Sci. Water Res. Technol. 2021, 7, 243–258. [Google Scholar] [CrossRef]
- Talvitie, J.; Mikola, A.; Setala, O.; Heinonen, M.; Koistinen, A. How well is microlitter purified from wastewater?—A detailed study on the stepwise removal of microlitter in a tertiary level wastewater treatment plant. Water Res. 2017, 109, 164–172. [Google Scholar] [CrossRef] [Green Version]
- Ji, J.; Liu, F.; Hashim, N.A.; Abed, M.R.M.; Li, K. Poly(vinylidene fluoride) (PVDF) membranes for fluid separation. React. Funct. Polym. 2015, 86, 134–153. [Google Scholar] [CrossRef]
- Sikeyi, L.; Ntuli, T.; Mongwe, T.; Maxakato, N.; Carleschi, E.; Doyle, B.; Coville, N.; Maubane-Nkadimeng, M. Microwave assisted synthesis of nitrogen doped and oxygen functionalized carbon nano onions supported palladium nanoparticles as hybrid anodic electrocatalysts for direct alkaline ethanol fuel cells. Int. J. Hydrog. 2021, 46, 10862–10875. [Google Scholar] [CrossRef]
- Begum, S.; Kausar, A.; Ullah, H.; Siddiq, M. Potential of polyvinylidene fluoride/carbon nanotube composite in energy, electronics, and membrane technology: An overview. Polym.-Plast. Technol. Eng. 2016, 55, 1949–1970. [Google Scholar] [CrossRef]
- Salim, N.; Siddiqa, A.; Shahidda, S.; Qaisar, S. PVDF based Nanocomposite Membranes: Application towards Wastewater treatment. MJNN 2019, 4, 139–147. [Google Scholar] [CrossRef]
- Wastewater Treatment. Available online: https://www.wastewatertreatment.co.za/?gclid=Cj0KCQiAjJOQBhCkARIsAEKMtO2-d4UdyyJ1wci0gTLrOiUcJJNmuOuzJOE8tq2g3UZKitcuSLtiFJ8aAtkPEALw_wcB (accessed on 23 May 2022).
- Mintenig, S.M.; Int-Veen, I.; Loder, M.G.; Primpke, S.; Gerdts, G. Identification of microplastic in effluents of wastewater treatment plants using focal plane array-based micro-Fourier-transform infrared imaging. Water Res. 2017, 108, 365e372. [Google Scholar] [CrossRef]
- Xu, Z.; Zhang, J.; Shan, M.; Li, Y.; Li, B.; Niu, J.; Zhou, B.; Qian, X. Organosilane—Functionalized graphene oxide for enhanced antifouling and mechanical properties of polyvinylidene fluoride ultrafiltration membranes. J. Membr. Sci. 2014, 458, 1–13. [Google Scholar] [CrossRef]
- Espinoza, B.; Maricela, R. Microplastics in Wastewater Treatment Systems and Receiving Waters. Ph.D. Thesis, University of Glasgow, Glasgow, UK, 2019. [Google Scholar] [CrossRef]
- Kamaz, M.; Sengupta, A.; Gutierrez, A.; Chiao, Y.H.; Wickramasinghe, R. Surface modification of PVDF membranes for treating produced waters by direct contact membrane distillation. Int. J. Environ. Res. Public Health 2019, 16, 685. [Google Scholar] [CrossRef] [Green Version]
- Bartkowski, M.; Giordani, S. Supramolecular chemistry of carbon nano-onions. Nanoscale 2020, 12, 9352–9358. [Google Scholar] [CrossRef]
- Andrady, A.L. Ultraviolet radiation and polymers. In Physical Properties of Polymers Handbook; Mark, J.E., Ed.; Springer: New York, NY, USA, 2007; pp. 857–866. [Google Scholar] [CrossRef] [Green Version]
- Kershaw, P.J.; Turra, A.; Galgani, F. Guidelines or the Monitoring and Assessment of Plastic Litter in the Ocean; GESAMP Reports and Studies 99; GESAMP: London, UK, 2019. [Google Scholar] [CrossRef]
- Govender, J.; Naidoo, T.; Rajkaran, A.; Cebekhulu, S.; Bhugeloo, A.; Sershen, S. Towards characterising microplastic abundance, typology and retention in mangrove-dominated estuaries. Water 2020, 12, 2802. [Google Scholar] [CrossRef]
- Magnusson, K.; Norén, F. Screening of Microplastic Particles in and Down-Stream a Wastewater Treatment Plant. In Swedish; Environmental Protection Agency: Washington, DC, USA, 2014. Available online: http://urn.kb.se/resolve?urn=urn%3Anbn%3Ase%3Anaturvardsverket%3Adiva-2226 (accessed on 23 May 2022).
- Guerranti, C.; Martellini, T.; Perra, G.; Scopetani, C. Microplastics in cosmetics: Environmental issues and needs for global bans. Environ. Toxicol. Pharmacol. 2019, 68, 75–79. [Google Scholar] [CrossRef]
- Thomas, M.P. Calcium and magnesium in drinking-water: Public Health Significance. Int. J. Environ. Sci. 2010, 67, 612–613. [Google Scholar] [CrossRef]
- Gregory, M.R. Plastic “scrubbers” in hand cleansers: A further (and minor) source for marine pollution identified. Mar. Pollut. Bull. 1996, 32, 867–871. [Google Scholar] [CrossRef]
- Morritt, D.; Stefanoudis, P.V.; Pearce, D.; Crimmen, O.A.; Clark, P.F. Plastic in the Thames: A river runs through it. Mar. Pollut. Bull. 2014, 78, 196–200. [Google Scholar] [CrossRef] [PubMed]
- Nedzivhe-Mqehe, K.C.; Makhado, K.; Olorundare, O.F.; Arotiba, O.A.; Makhatha, E.; Nomngongo, P.N.; Mabuba, N. Bio-Adsorbents for the Removal of Heavy Metals from Water. In Arsenic-Analytical and Toxicological Studies; IntechOpen: London, UK, 2018. [Google Scholar] [CrossRef] [Green Version]
- Mohamed, F.; Guillaume, D.; Abdulwali, N.; Al-Hadrami, K.; Maqtari, M.A. ICP-OES assisted determination of the metal content of some fruit juices from Yemen’s market. Heliyon 2020, 6, e04908. [Google Scholar] [CrossRef] [PubMed]
- Andrady, A.L.; Neal, M.A. Applications and societal benefits of plastics. Philosophical Transactions of the Royal Society of London. Ser. B Biol. Sci. 2009, 364, 1977–1984. [Google Scholar] [CrossRef]


| Method Applied | Microplastic Concentration Removed (MP/L) | Reference |
|---|---|---|
| Combination of oxidation and fluorescent staining | 5.23 ± 0.25 | [16] |
| Polycarbonate filters | From 16.40 ± 7.85 to 131.35 ± 95.36 | [17] |
| Filtration with 0.45 μm filter paper | 288.50 | [18] |
| Filtration with PVDF | 140 ± 1.85 | This work |
| Sample | Mass of PVDF (g) | Mass of PVDF + Microplastics (g) | Mass of Microplastics (g) | Concentration (MP/L) | RSD (%) |
|---|---|---|---|---|---|
| Tap water | 0.0818 | 0.0844 | 0.0026 | 6.5 ± 3.77 | 58 |
| Lake water | 0.0823 | 0.0863 | 0.0040 | 10 ± 2.65 | 27 |
| Influent | 0.0831 | 0.0868 | 0.0558 | 140 ± 1.85 | 1.3 |
| Effluent | 0.0821 | 0.0856 | 0.0035 | 8.8 ± 2.10 | 23 |
| Sample | Mass of PVDF/CNOs (g) | Mass of PVDF/CNOs + Microplastics (g) | Mass of Microplastics (g) | Concentration (MP/L) | RSD (%) |
|---|---|---|---|---|---|
| Tap water | 0.1014 | 0.1017 | 0.0003 | 1.5 ± 4.20 | 280 |
| Lake water | 0.0883 | 0.0890 | 0.0007 | 3.5 ± 3.15 | 90 |
| Influent | 0.0907 | 0.0914 | 0.0009 | 4.5 ± 2.00 | 44 |
| Effluent | 0.0904 | 0.0913 | 0.0007 | 3.5 ± 2.32 | 66 |
| Metal | Wavelength (nm) | Concentration (mg/L) | RSD (%) | LOD (mg/L) | LOQ (mg/L) |
|---|---|---|---|---|---|
| Arsenic | 188.979 | 47.3 ± 0.1 | 10.4 | 3.285 | 4.989 |
| Mercury | 253.652 | 47.3 ± 0.1 | 16.9 | 0.260 | 0.449 |
| Aluminum | 396.153 | 47.3 ± 0.1 | 1.70 | 0.064 | 0.071 |
| Cadmium | 228.802 | 9.47 ± 0.03 | 1.70 | 0.095 | 0.106 |
| Chromium | 267.716 | 47.3 ± 0.1 | 3.90 | 0.137 | 1.700 |
| Cobalt | 22.616 | 9.47 ± 0.03 | 15.3 | 0.719 | 1.209 |
| Copper | 327.393 | 9.47 ± 0.03 | 0.90 | 1.206 | 1.271 |
| Iron | 238.204 | 9.47 ± 0.03 | 1.10 | 0.815 | 0.815 |
| Lead | 220.353 | 94.7 ± 0.3 | 6.80 | 0.064 | 0.089 |
| Magnesium | 285.213 | 9.47 ± 0.03 | 0.70 | 0.771 | 0.806 |
| Nickel | 231.604 | 47.3 ± 0.1 | 3.90 | 0.120 | 0.149 |
| Silver | 32.068 | 9.47 ± 0.03 | 4.00 | 3.727 | 4.610 |
| Zinc | 206.200 | 9.47 ± 0.03 | 4.80 | 1.145 | 1.463 |
| Metal | Acceptable Threshold Concentration (mg/L) | Extraction Method | Obtained Concentration (mg/L) | References |
|---|---|---|---|---|
| Magnesium | <30 | Water | 245.062 | [36,37] |
| Copper | 1.3 | Acid | 83.176 | [38] |
| Arsenic | 0.010 | Acid | 8.699 | [39] |
| Zinc | 5 | Acid | 2.538 | [40,41] |
Publisher’s Note: MDPI stays neutral with regard to jurisdictional claims in published maps and institutional affiliations. |
© 2022 by the authors. Licensee MDPI, Basel, Switzerland. This article is an open access article distributed under the terms and conditions of the Creative Commons Attribution (CC BY) license (https://creativecommons.org/licenses/by/4.0/).
Share and Cite
Nkosi, S.D.; Malinga, S.P.; Mabuba, N. Microplastics and Heavy Metals Removal from Fresh Water and Wastewater Systems Using a Membrane. Separations 2022, 9, 166. https://doi.org/10.3390/separations9070166
Nkosi SD, Malinga SP, Mabuba N. Microplastics and Heavy Metals Removal from Fresh Water and Wastewater Systems Using a Membrane. Separations. 2022; 9(7):166. https://doi.org/10.3390/separations9070166
Chicago/Turabian StyleNkosi, Simphiwe Dineo, Soraya Phumzile Malinga, and Nonhlangabezo Mabuba. 2022. "Microplastics and Heavy Metals Removal from Fresh Water and Wastewater Systems Using a Membrane" Separations 9, no. 7: 166. https://doi.org/10.3390/separations9070166
APA StyleNkosi, S. D., Malinga, S. P., & Mabuba, N. (2022). Microplastics and Heavy Metals Removal from Fresh Water and Wastewater Systems Using a Membrane. Separations, 9(7), 166. https://doi.org/10.3390/separations9070166