Article

Numerical Simulation for the Desired Compatibility between the Inside Slopes of Open Irrigation Canals, and the Used Type of Wing Walls for the Most Efficient Performance of Water Structures

by
Mohamed A. Ashour
,
Haitham M. Abueleyon
,
M. Khairy Ali
,
Abdallah A. Abdou
and
Tarek S. Abu-Zaid
*
Faculty of Engineering, Assiut University, Assiut 71515, Egypt
*
Author to whom correspondence should be addressed.
Limnol. Rev. 2024, 24(3), 192-204; https://doi.org/10.3390/limnolrev24030011
Submission received: 28 April 2024 / Revised: 20 June 2024 / Accepted: 25 June 2024 / Published: 28 June 2024

Abstract

:
The design of water structures is crucial for efficient hydraulic performance. Open irrigation canals are designed with specific inside slopes to ensure maximum stability, while the wing walls of water structures constructed across the canal are designed to maximize hydraulic performance. Therefore, ensuring compatibility between the canal inside slopes and the wing wall types used on both the upstream and downstream sides is of great importance for achieving optimum hydraulic performance. However, our literature review indicates that this necessary compatibility between the canal inside slope and the wing wall type has not been adequately researched and studied. This present study aims to numerically investigate the relationship between open canals inside slopes and wing wall types, as well as examine the impact of using different wing wall types with varying canals inside slopes on hydraulic performance efficiency. Four canal inside slope ratios (Z) (H: V = 2:1, 1.5:1, 1:1, and 0.75:1) are simulated using the HEC-RAS program, along with two types of water structure wing walls (box and broken). The HEC-RAS numerical model provides accurate and reliable estimations of the hydraulic characteristics of flowing water through the structure, and the results are verified using previous experimental measurements available in the literature. The variation (ε%) between the measured and computed results is consistent for estimating specific energy, velocity, heading (afflux), and water depths. The simulation results demonstrate that changing the canal inside slope (Z) from 0.75:1 to 2:1 results in a relative increase of approximately 27.84% in heading up and 15.06% in velocity. Additionally, the broken wing wall proves to be more effective than the box type. The study confirms that the optimal configuration for the most efficient performance of water structures involves utilizing broken-type wing walls on the upstream side, along with a 1H:1V canal inside slope. This configuration reduces the relative velocity and relative heading by approximately 12% and 20%, respectively, which is considered highly favorable.

1. Introduction

The performance efficiency of water structures refers to how effectively these structures achieve their intended functions. Evaluating velocity, afflux, energy loss, heading up, flow uniformity, and water surface profile is crucial to ensure the effective functioning of water structures. These technical parameters play a significant role in reflecting the performance efficiency of the structures.
The main geometric parameters that affect the flow of water through water structures are the geometry of the upstream and downstream wing walls and the ratio between the original and designed canal bed widths. While previous studies have covered this aspect, there is a lack of research on parameters such as the canal inside slope upstream and downstream of the artificial structure and its relationship with the wing walls. While researchers have studied the stability of the canal inside slope from a geotechnical perspective, there is limited research on the relationship between the canal inside slope and the approach of water structures and how it affects the hydraulic characteristics of the flowing water. Therefore, the current study focuses on studying this relationship in a trial to close this research gap.
Many researchers have studied the stability of the canal inside slope from a geotechnical perspective. The internal slope of canals primarily depends on soil properties. Slope stability refers to the ability of inclined soil slopes to withstand or undergo movement. Factors that affect slope stability include soil cohesion, soil friction angle, existing stresses, and water surface level. Geotechnical researchers have extensively studied these factors of slope stability [1,2,3], while only a few of them studied individually the effect of using some types of wing walls, and the effect of different inside slopes of open canals, on the performance hydraulic efficiency [4,5,6,7,8,9,10,11,12,13], as mentioned below.
Abdel-Aal et al. [4] investigated the effect of side slopes of the trapezoidal channel on the maximum scour depth downstream of the transition. They tested different side slopes of the channel section ranging from 0:1 to 0.35:1. The study revealed that the various scour parameters, such as relative scour depth and relative scour length, increase with the increase in the upstream Froude number (F1). Moreover, the cross section with a side slope of S = 0.29, in the presence of guide walls (bo/b = 0.31 and t/b = 3.1%), minimized the relative scour parameters.
Afzalimehr et al. [5] conducted a study on the flow field around semi-elliptical wing wall abutments. They tested four different ratios between the length of the abutment along the stream direction and the width of the abutment across the flow. The results demonstrated that abutments with smaller dimensions produced stronger vortices and downflow compared to those with larger dimensions, as the force of water movement around the small abutment generated a stronger vortex trail. Bridge afflux on channels was experimentally and numerically studied using HEC-RAS by [6]. The results indicated that as the opening ratio increased, the distances where maximum affluxes were observed also shifted further upstream in the channel.
Setyandito et al. [7] investigated the effect of bridge abutment shape variation on flow velocity characteristics. They conducted experimental and numerical modeling studies on semicircular end abutments, wing wall abutments, and spill-through abutments. The research results suggested that the spill-through abutment was the most effective model for maintaining flow velocity stability around the abutment.
Mulahasan et al. [8] conducted numerical simulations of the flow field around a vertical side-wall abutment. The results showed good agreement between the experimental and numerical results for the water surface profile. The velocity surrounding the structure increased to twice the mean flow velocity. As discharge increased, the maximum pressure was observed in front of the contraction, and the maximum turbulence kinetic energy was found in the separation zone when the flow passed around the nose with high velocity.
Barbhuiya and Dey [9] conducted experimental research on the 3D turbulent flow field surrounding a 45-degree wing wall abutment situated on a rough, stiff bed. They presented profiles of time-averaged velocity components, turbulent intensity components, turbulent kinetic energy, and Reynolds stresses at different azimuthal planes. Vector plots of flow fields at azimuthal and horizontal planes revealed the presence of a primary vortex associated with the downflow on the upstream side of the abutment and a wake vortex on the downstream side.
Barbhuiya and Dey [10] studied the three-dimensional turbulent flow field around a vertical semicircular cylinder attached to the flume wall using an ADV. They discovered that strong circulation occurs upstream of the cylinder and diminishes as the flow depth increases. The circulation weakens and disappears at 90 degrees. Beyond 90 degrees, the flow is directed outward downstream with an additional increase in flow depth. The flow characteristics are dominated by the wake vortex at 170 degrees, and suction is induced by an upward flow close to the cylinder.
Atabay et al. [11] utilized the HEC-RAS software to investigate the effects of a single-opening straight deck bridge, semicircular arch, and semi-elliptical arch on the backwater level. The findings revealed that the backwater level is significantly influenced by the Froude number, opening ratio, discharge, and roughness coefficient. Furthermore, recent studies [12,13,14,15,16,17] have utilized the HEC-RAS software to analyze the scour, heading up (afflux), number of vents, contraction ratio, and flow regimes through the water structures that are constructed in the irrigation water canals. Nearly all findings consistently demonstrated that the HEC-RAS numerical model effectively predicted the hydraulic characteristics of the tested water structure, thereby improving design criteria and assessment of functional efficiency.
Ashour et al. [18] conducted experimental research on the effect of wing wall transition angles on the hydraulic parameters of water structures. They examined six models with transition angles of 90, 60, 45, 30, 20, and 15 degrees. The results indicated that the optimum transition angle from a hydraulic and cost perspective is 30 degrees. They also concluded that the relative upstream energy loss increases with an increase in the upstream Froude number, and at any value of the upstream Froude number, the relative upstream energy loss increases with an increase in the transition angle.
Fakhimjoo et al. [19] experimentally studied and analyzed the flow around a pier and abutment. The experiments involved three types of piers and two types of abutments (wing wall abutment and semicircular abutment). The results demonstrated that the velocity near the pier and abutment increased by up to 80%. When the measurement height for flow velocity was increased, the velocity magnitude was found to increase by 30%.
Reviewing the previous works reveals the following:
The optimal transition angle (θ) for broken-type wing walls in water structures is 30 degrees.
Wing walls and abutments with smaller dimensions (width and length) generate stronger vortices and downflow compared to those with larger dimensions.
There is a lack of studies exploring the relationship between the inside slope of the canal and the wing wall of water structures.
Only a few authors have investigated a complete model of water structures, such as the U.S. wing wall, abutment, and D.S. wing wall, which represents a practical model closer to reality.
The present study aims to investigate the desired compatibility between the canal inside slopes and different types of wing walls of water structures through a numerical study using the 1D HEC-RAS model. The study is divided into two stages: first, the validation of the numerical simulations against experimental measurements available in the literature to ensure the accuracy of the obtained results, and second, the simulation using the HEC-RAS model for different canal inside slopes with two selected types of wing walls (box type and broken type) on the upstream and downstream sides of the structure.

2. Methods

2.1. Methodology

The HEC-RAS program is used to analyze the relationship between the inside slope of a canal and the type of wing wall used in water structures. To ensure the accuracy of the program’s results, it is necessary to investigate experimental works and compare them with the program’s outputs. Therefore, a study methodology was implemented, as shown in Figure 1, which involved collecting and reviewing research related to the study subject and extracting the most important findings. Subsequently, one of the previous experimental studies was selected, and modeling was performed using HEC-RAS 6.5. The simulation results were then compared with the previous experimental findings. Once the accuracy of HEC-RAS’s outputs was confirmed, the variables to be tested were chosen, including the types of wing walls and the inside slopes of the canal. Modeling for these variables was conducted using the HEC-RAS package. Finally, the results were analyzed, discussed, and summarized.

2.2. Selection of Experimental Data from Previous Work

Ashour et al. [18] investigated the impact of transition angles on the hydraulic parameters of water structures. In this section, models with transition angles of 90 degrees (U.S. and D.S. box-type wing walls) will be simulated using the HEC-RAS package. The results obtained from the experimental tests will then be compared with those from the HEC-RAS modeling. This step serves as a pre-test to ensure and validate the HEC-RAS program’s ability to predict and assess the hydraulic characteristics of water structures, including variations in water velocity, water depths, afflux (upward flow), Froude number, and energy losses in the upstream, downstream, and through the designed section of the water structures.

2.3. Dimensional Analysis

Figure 2 represents a schematic diagram for the tested models, and all parameters affect the hydraulic characteristic of the water structure, which can be classified as follows:
  • Fluid characteristics: ρ is the water density (kg/m3); μ is the dynamic viscosity (kg/ms) and ơ is the surface tension (kg/s2).
  • Geometry Characteristics: B is the original channel width (m); b is the design structure width (m); θ is the transition angle of the U.S. wing wall; S is the bed slope of the channel; L is the abutment length of the structure (m) and Z is the side slope of the channel (H:V), (horizontal to vertical).
  • Flow characteristics: ∆E is the total energy loss; (m); V1 is the U.S. water velocity; (m/s); V2 is the water velocity through the structure (m/s); V3 is the D.S. water velocity (m/s); g is the acceleration of gravity (m/s2); Q is the discharge (m3/s); y1 is the U.S water depth(m); y2 is the water depth through the structure (m); y3 is the D.S water depth (m); Q* is the discharge factor (dimension less) and hu is the afflux (heading up) (m).
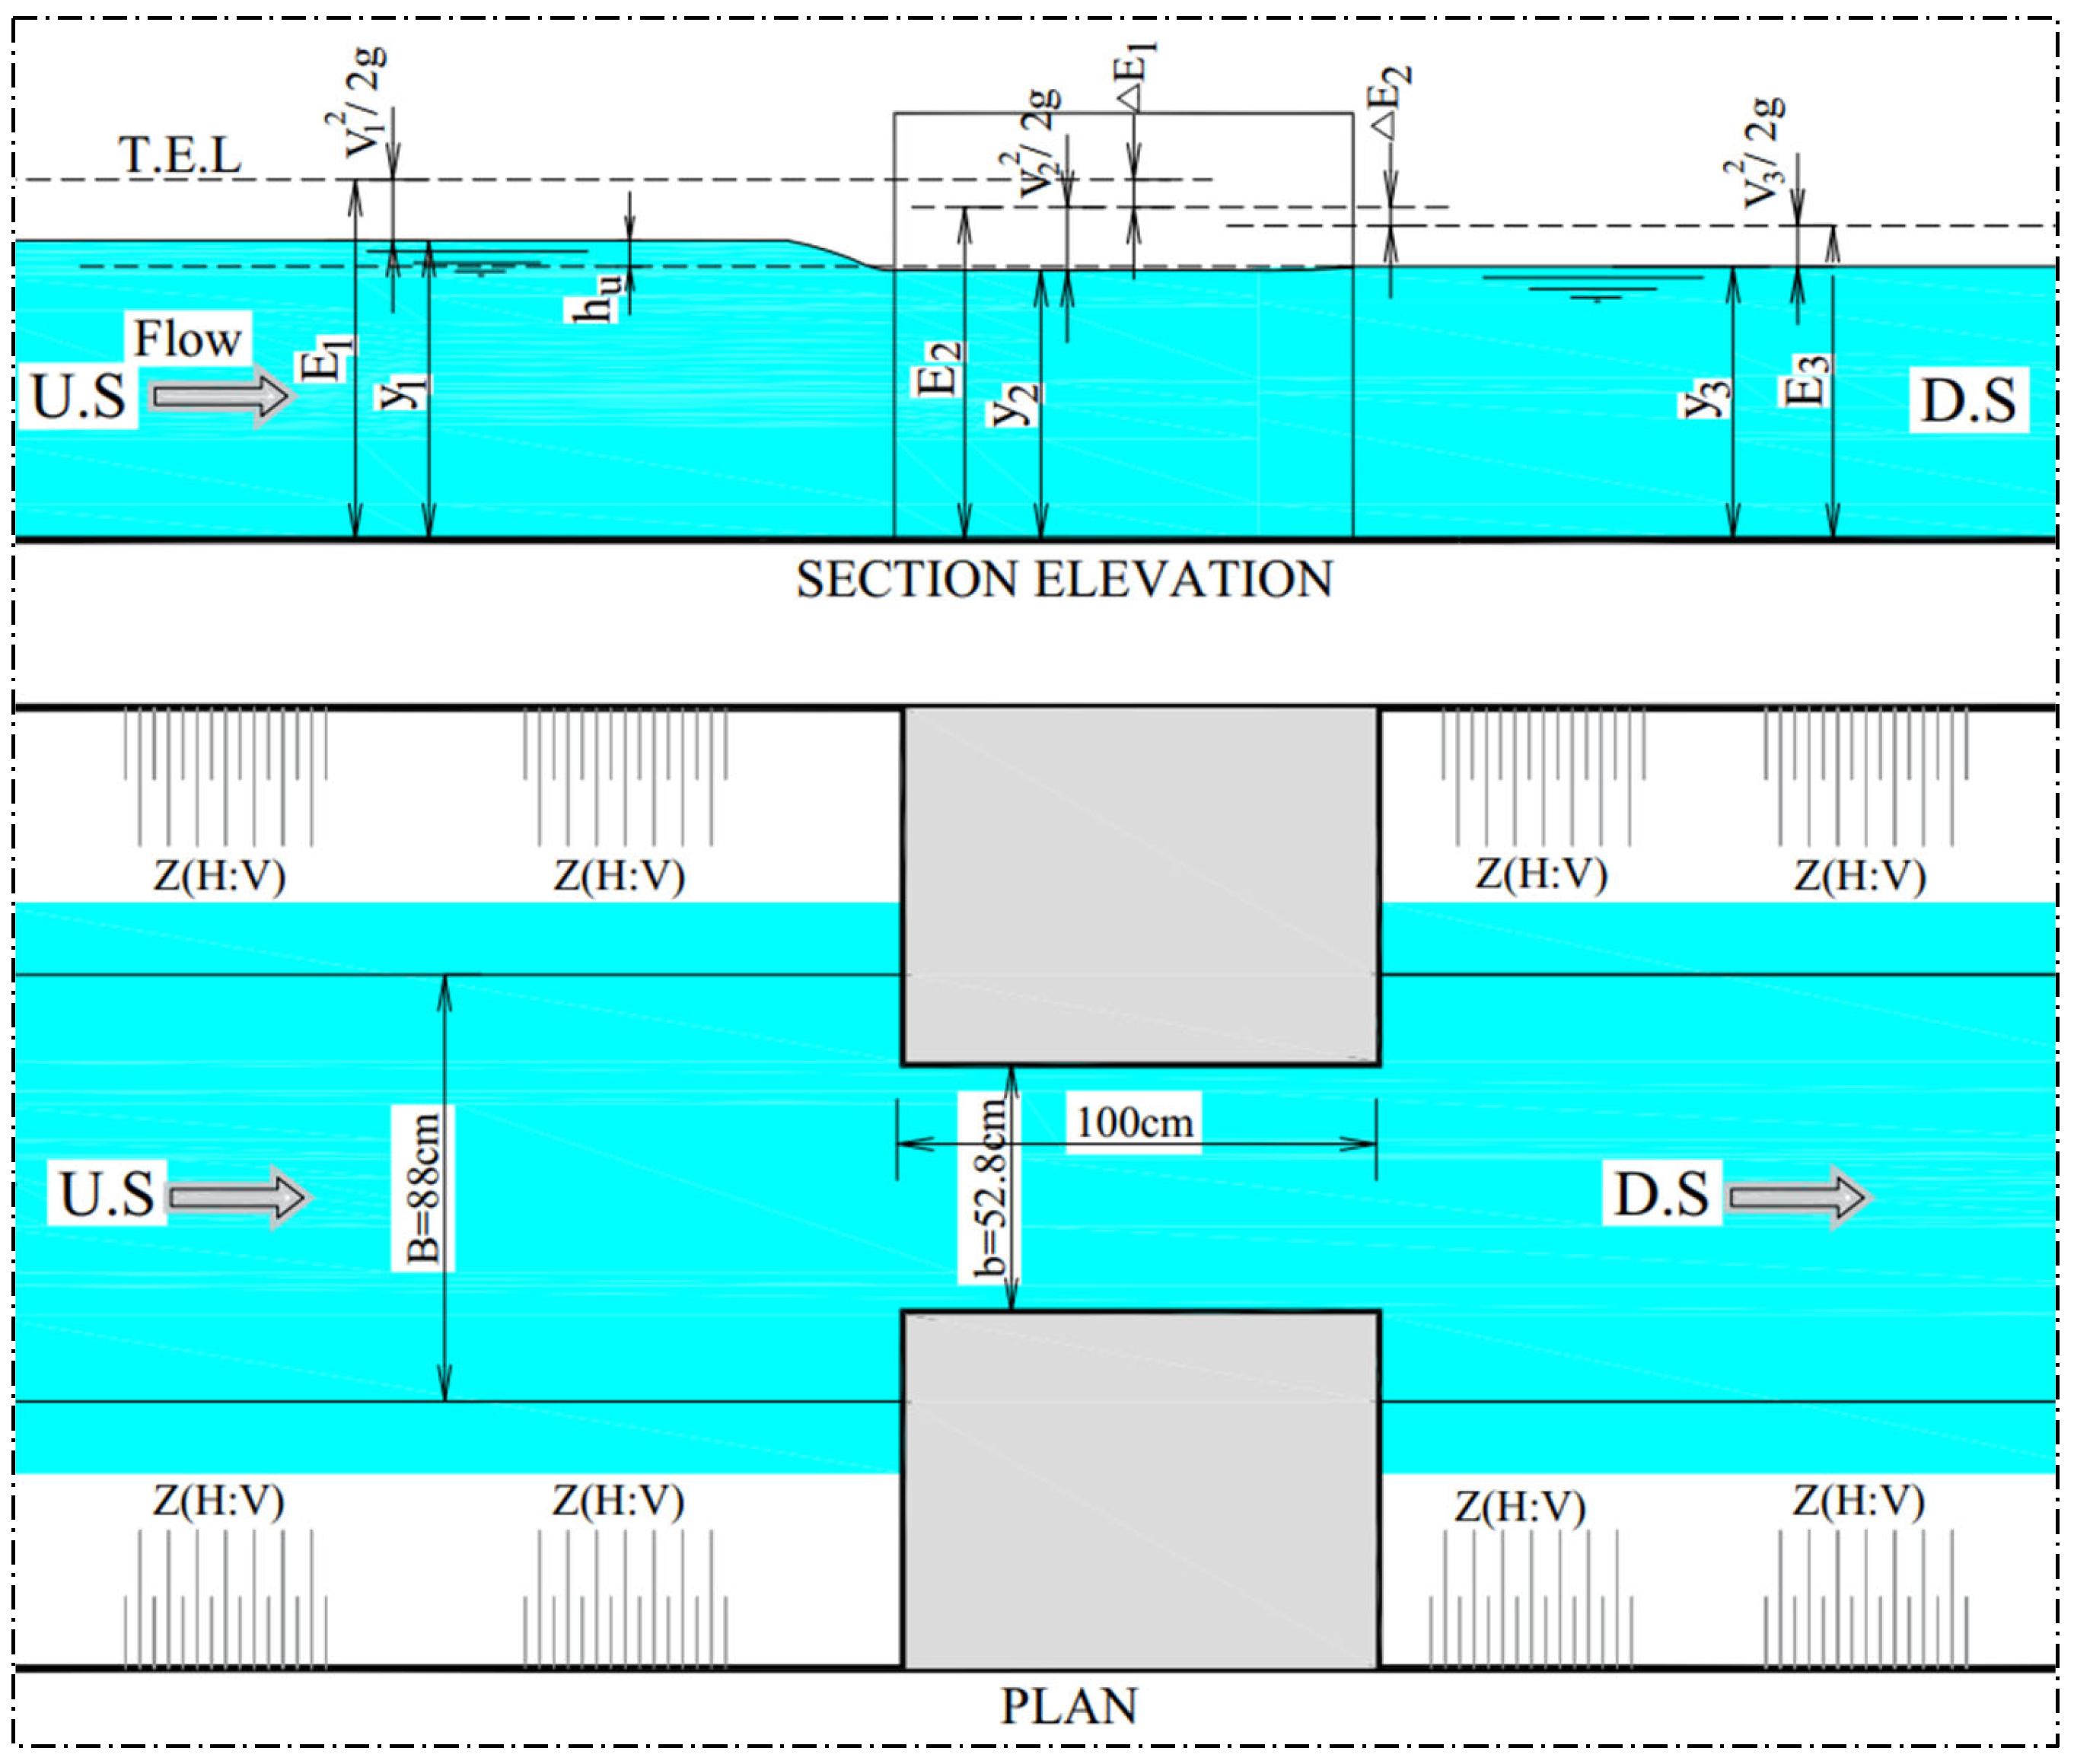
Figure 2. Definition sketch of the tested model.
Limnolrev 24 00011 g002
The general relationship of the previously mentioned variables may be written as
f ρ , μ , ơ , y 0 , y 1 , y 2 , y 3 , h u , V 1 , V 2 , V 3 , Q , g , E , E 1 , E 2 , E 3 , B , b , θ , L , z = 0
By using Buckingham’s π theorem with repeating variables ρ, v 1 and y 1 , and by removing the constant parameters and neglecting unnecessary parameters, the Equation (1) can be written as follows:
f h u y 1 , y 2 y 1 , y 3 y 1 , E 1 y 1 , E 2 y 1 , E t y 1 , v 2 v 1 , v 3 v 1 , Q g y 1 5 , z = 0
The relationship for the relative heading up ( h u y 1 ) and other parameters can be written as follows:
h u y 1 = Ø 1 y 2 y 1 , F r 1 , Q g y 1 5 , z
The relationship between the relative water depths ( y 2 y 1 ) and the upstream Froude number ( F r 1 ) can be written as follows:
y 2 y 1 = Ø 2 F r 1 , Q g y 1 5 , z
The relationship between the Froude number through the structures ( F r 2 ) and the relative water depth ( y 2 y 1 ) can be written as follows:
F r 2 = Ø 3 y 2 y 1 , F r 1 , Q g y 1 5 , z
The relationship between the relative energy loss ( E 1 y 1 ) and upstream Froude number ( F r 1 ) can be written as follows:
E 1 y 1 = Ø 4 y 2 y 1 , F r 1 , Q g y 1 5 , z

2.4. Numerical Simulations Using HEC-RAS

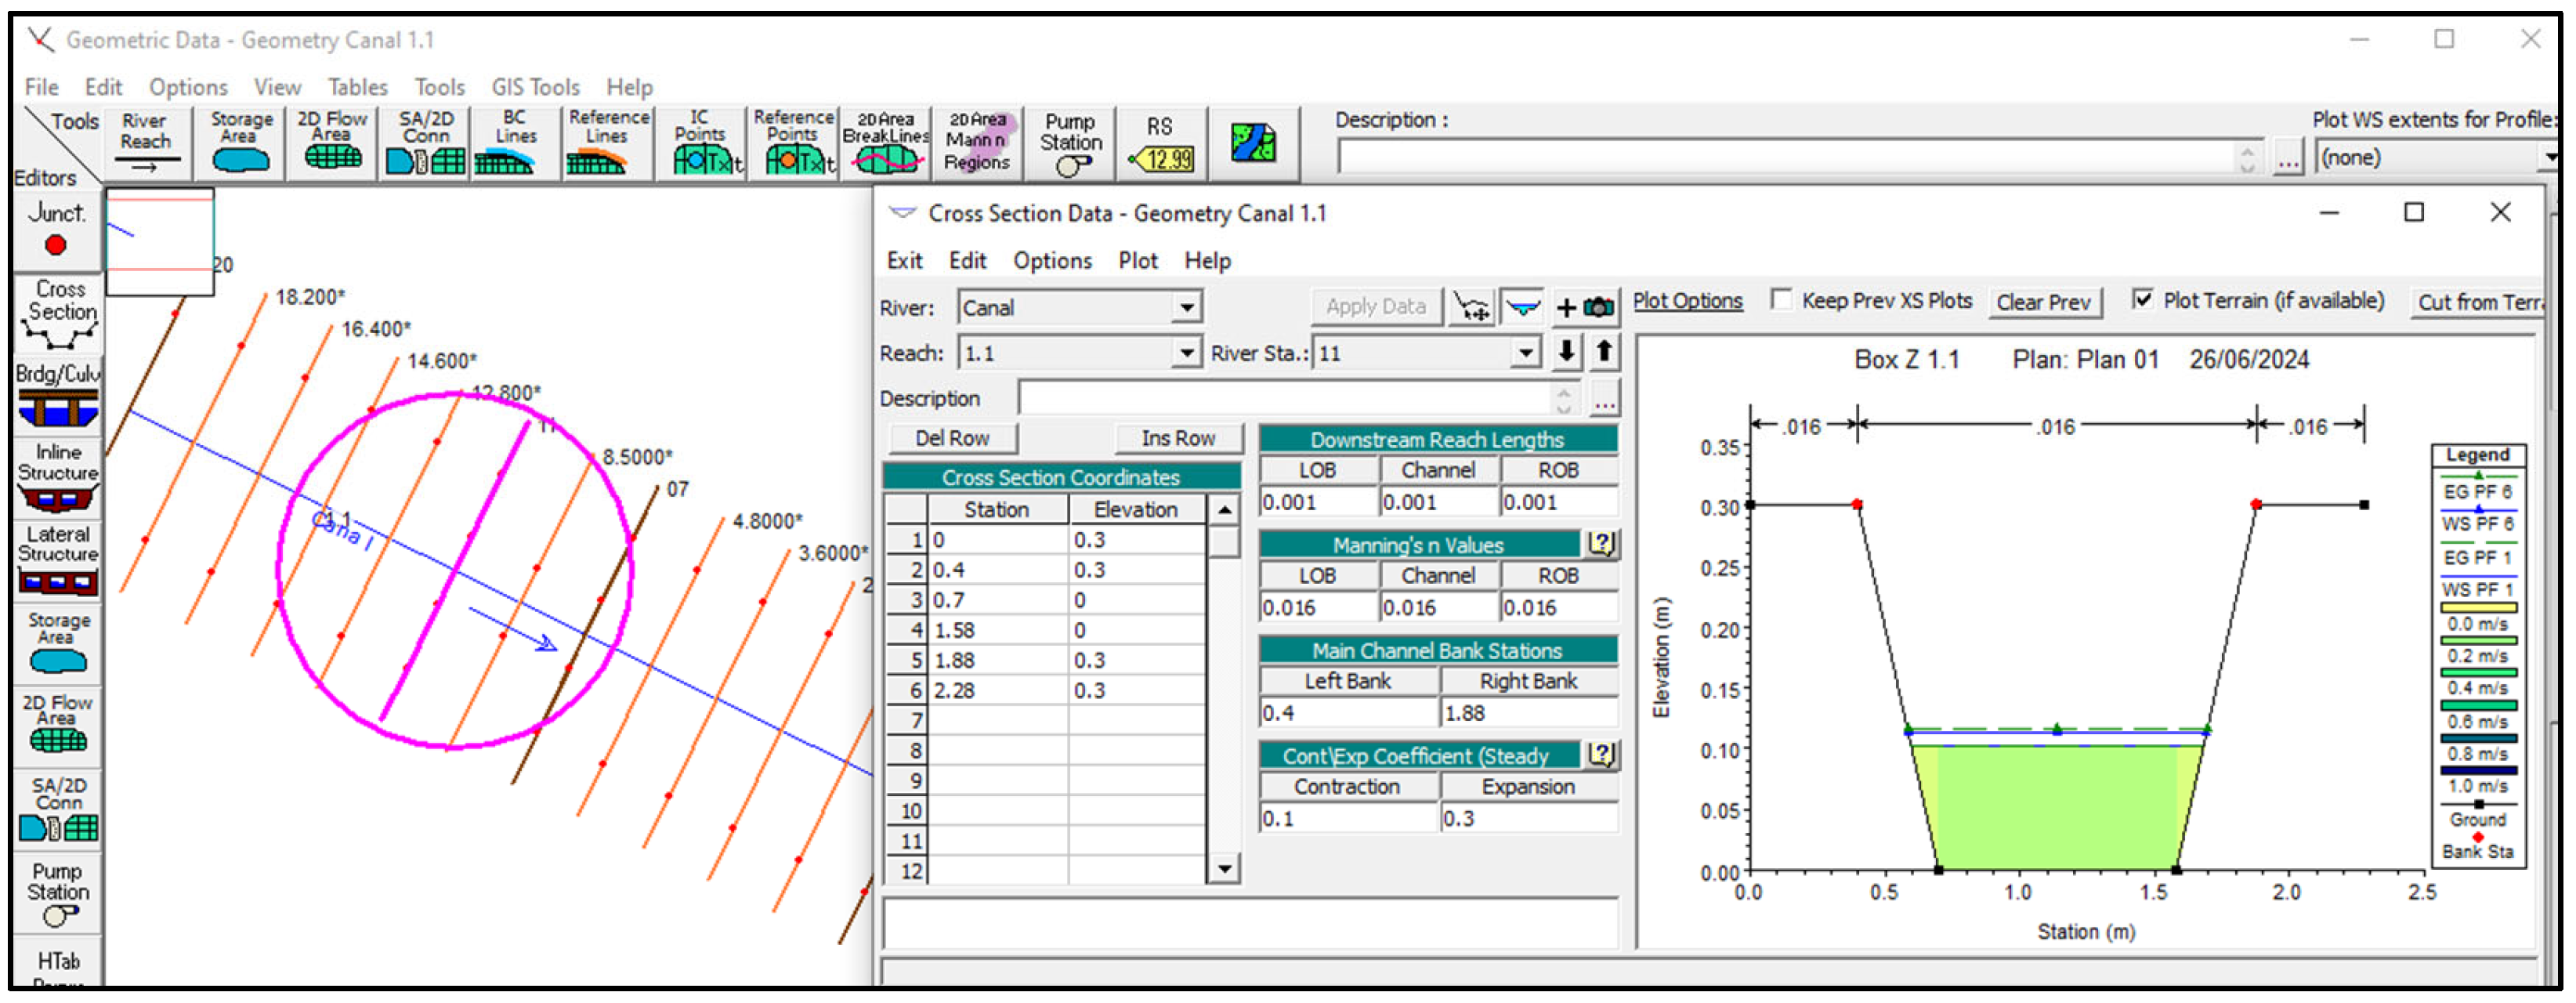
Both steady and unsteady 1D and 2D hydraulic computations can be conducted using the public domain software River Analysis System (HEC-RAS 6.0) [20]. The steps for building a 1D HEC-RAS model for steady flow in open channels are as follows: preparing the geometric data, inputting the steady flow data, performing the steady flow simulation, and finally, viewing the results. The geometric data are prepared as illustrated in Figure 3 and Figure 4. The study reach consists of 15 sections. Sections 00 to 6 and 11 to 20 are trapezoidal, while sections 07, 8.50, and 10 are rectangular. These sections represent designed sections with U.S. and D.S. box-type wing walls and a contraction ratio of 0.60. Additionally, a Manning roughness coefficient of n = 0.016 is used for a concrete open channel, following the guidelines in the HEC-RAS Hydraulic Reference Manual [21].
The steady flow data include the flow discharge and boundary conditions. The flow discharge ranged from 13.6 to 30.9 l/s, as determined in previous experiments. The boundary condition was set as normal depth in the U.S., with a longitudinal slope of 0.001, and in the D.S., it was established as a known depth of 10 cm (see Figure 5). The next step involves conducting computations under subcritical flow conditions.

2.5. Validation Study of Numerical Simulations with Previous Experimental Measurements

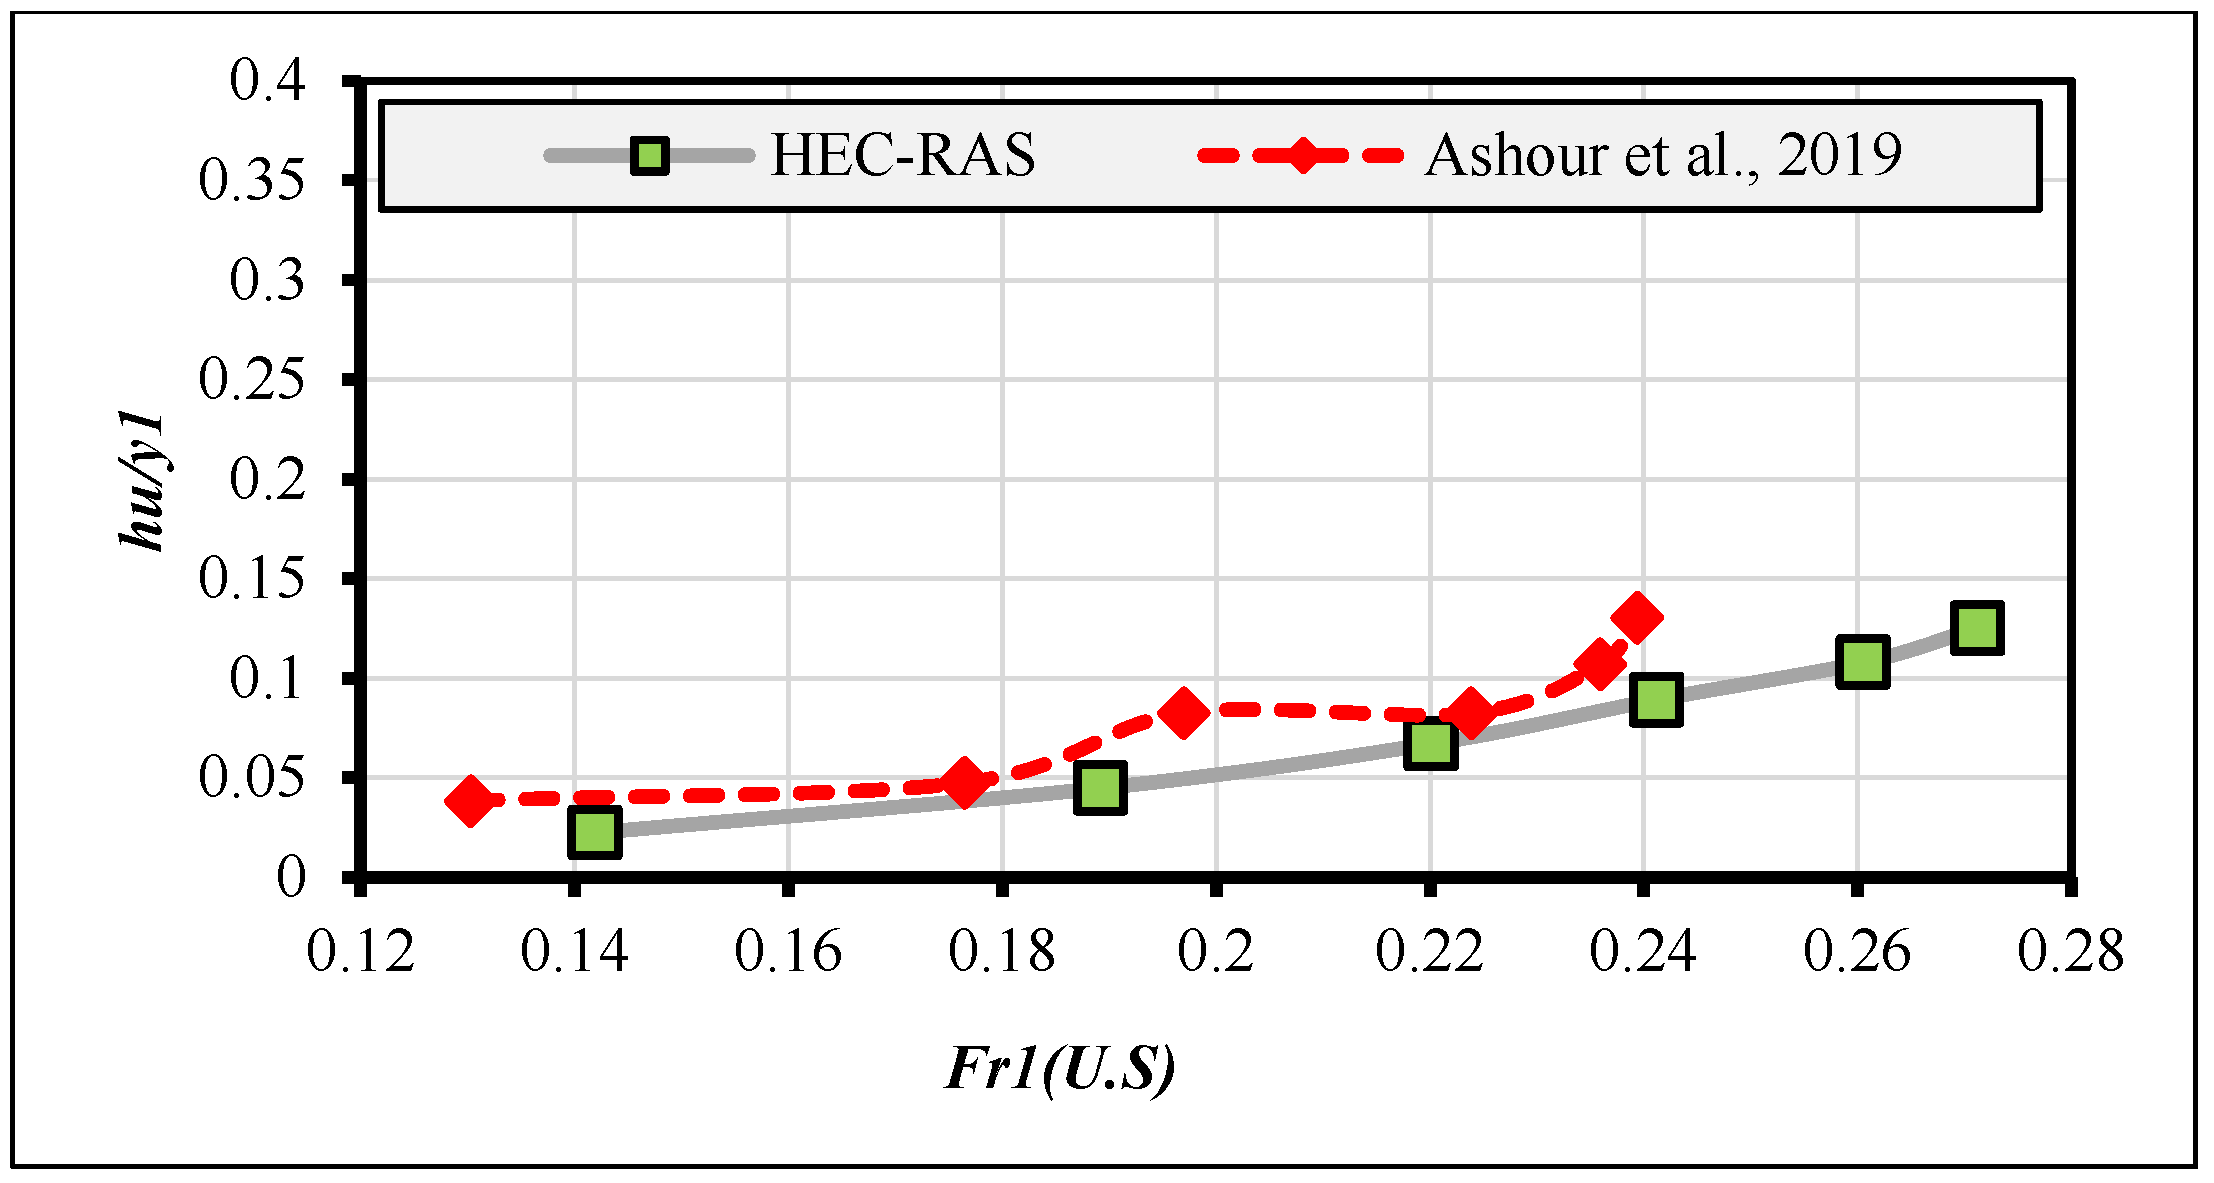
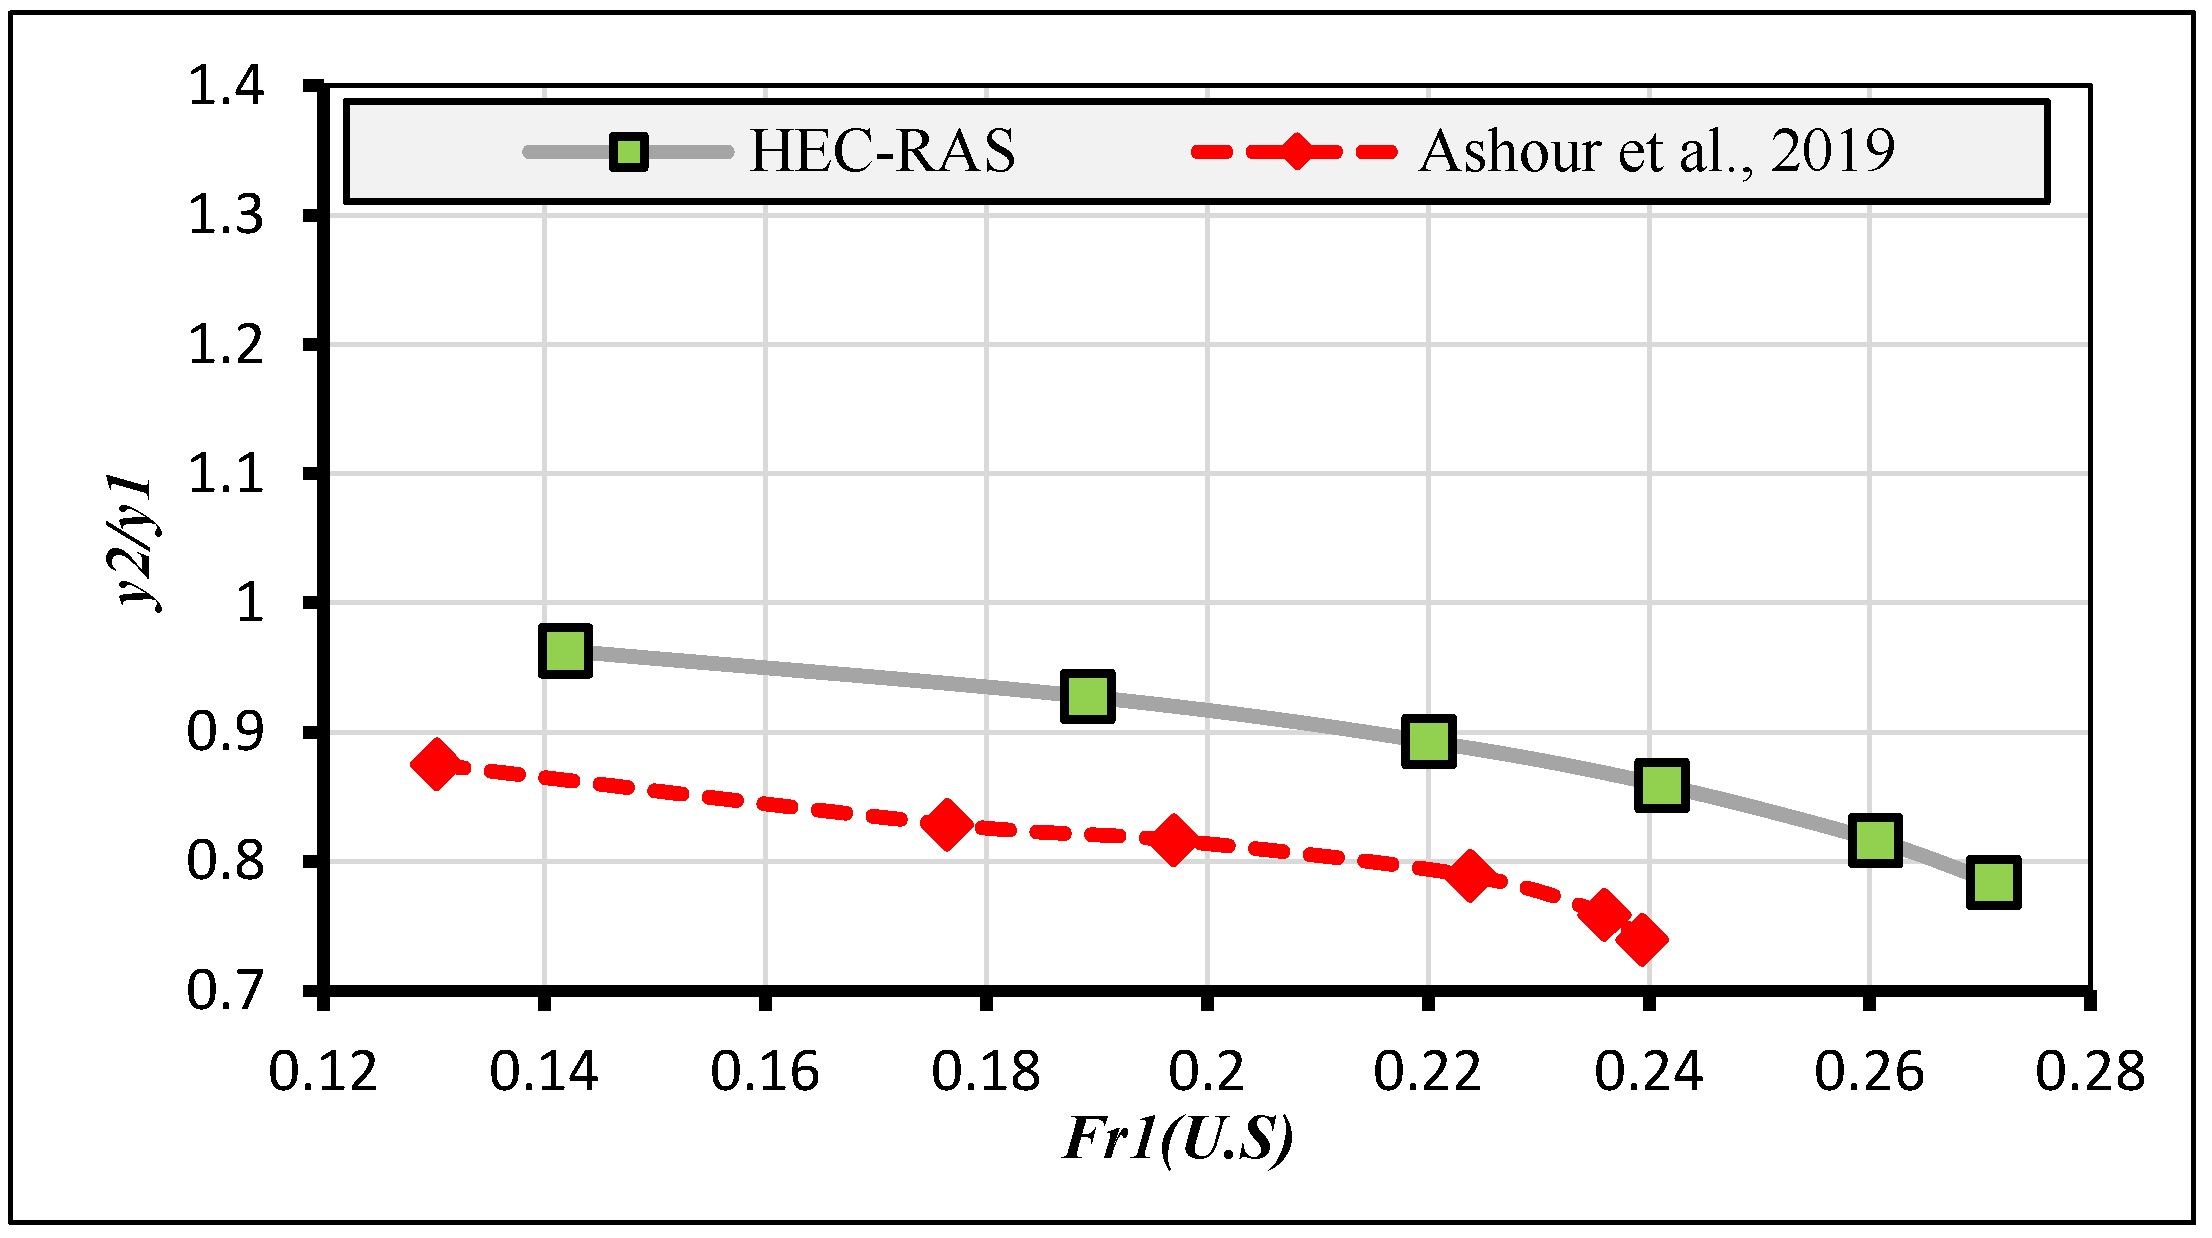
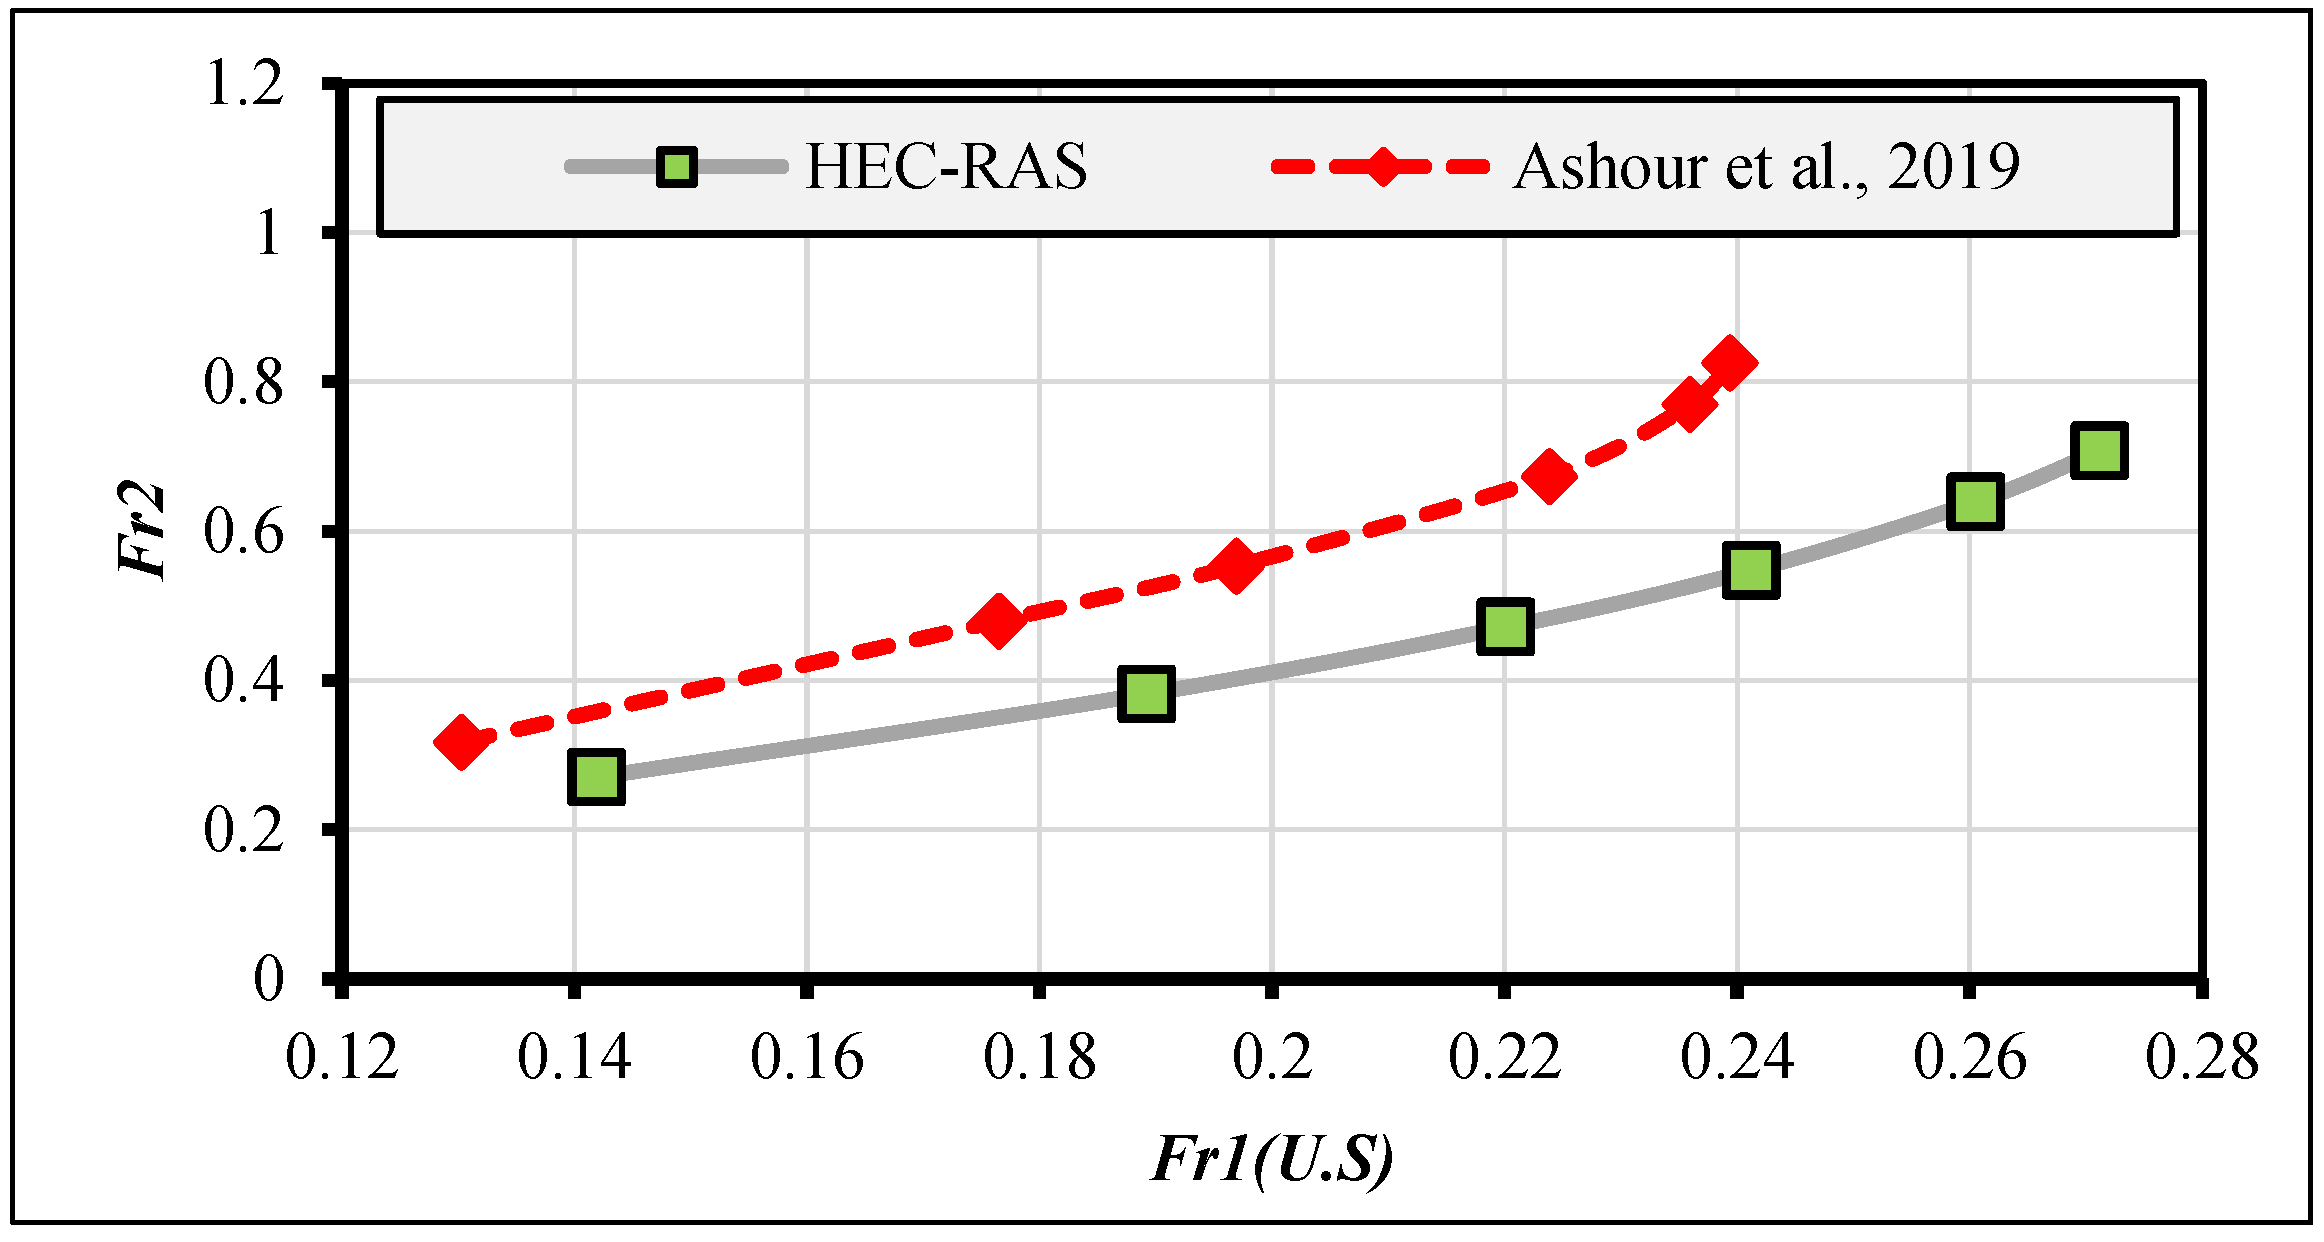
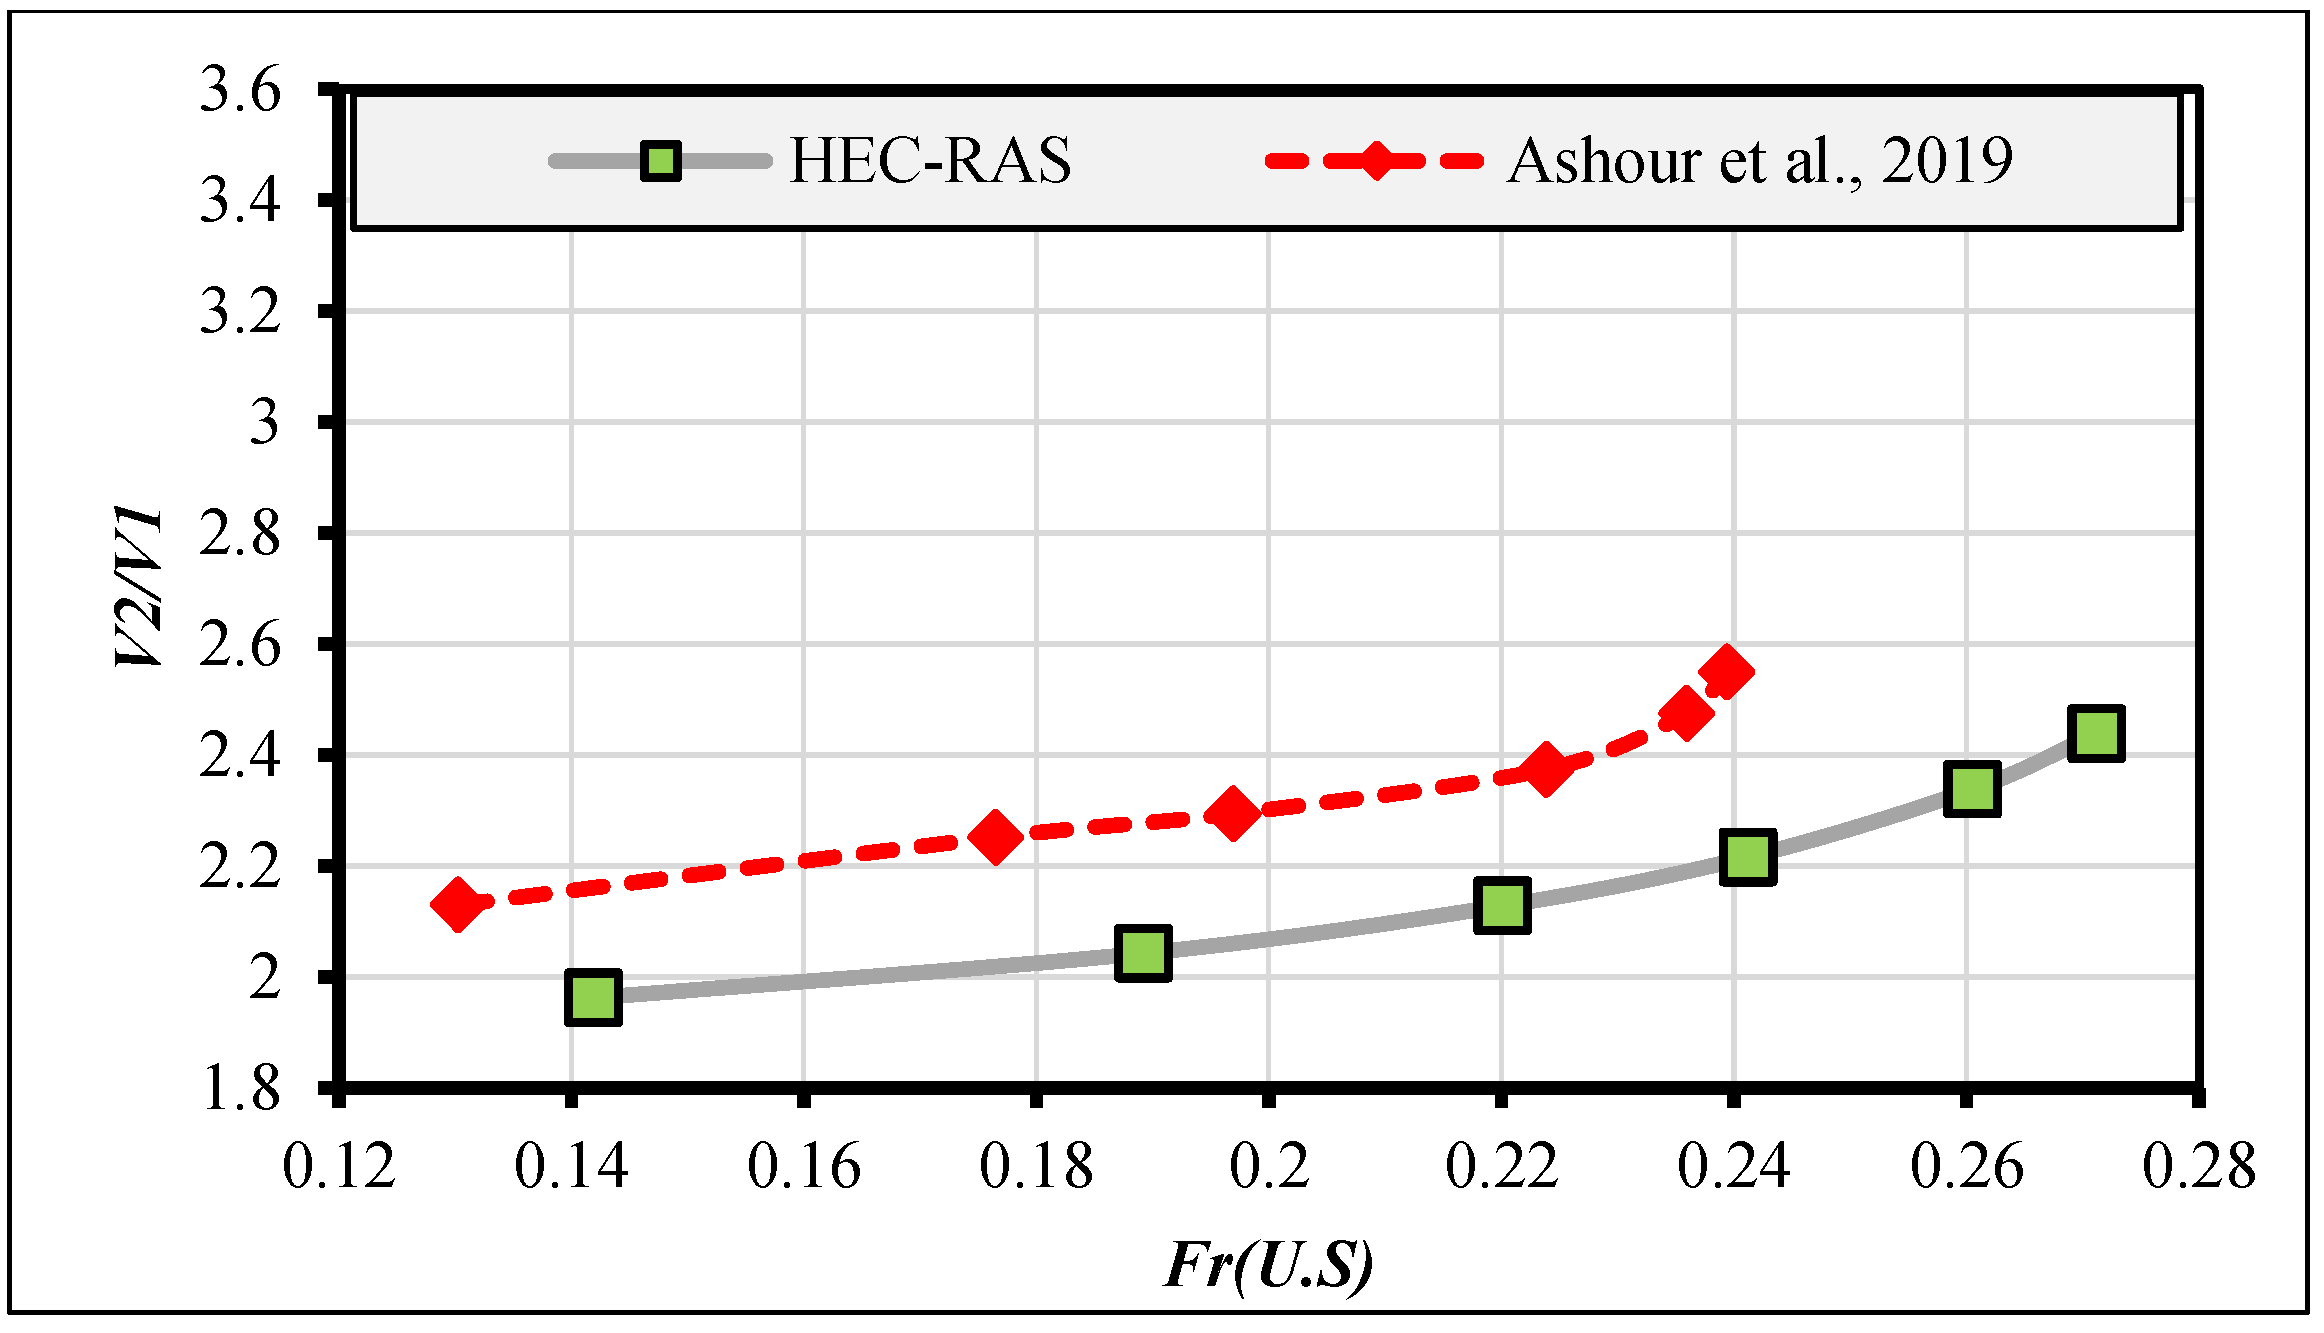
The results of laboratory measurements, as reported by [18], and from the current HEC-RAS modeling study are presented in Figure 6, Figure 7, Figure 8 and Figure 9. It is observed that the results from the HEC-RAS simulation closely align with the previous experimental measurements. The variation (ε%) between the measured and computed results ranges from 2.62% to −5.41% for estimating specific energy, velocity, afflux (heading up), and water depths, respectively. Thus, the HEC-RAS model provides accurate and reliable estimate for hydraulic parameters, such as afflux (hu), Froude number (Fr), velocity (v), and water depths at the U.S. and D.S. locations, as well as throughout the water structures. Therefore, it is applicable for establishing safe design criteria and assessing the performance efficiency of water structures, such as bridges.
variation   ( ε )   % = M e a s u r e d C o m p u t e d M e a s u r e d × 100

3. HEC-RAS Modeling for Different Canal’s Inside Slopes with Different Types of U.S Wing Wall

This section focuses on achieving the desired compatibility between the inside slopes of open irrigation canals and the type of wing walls used for optimal performance of water structures using the HEC-RAS Package. Four ratios (Z:1) (H: V = 2:1, 1.5:1, 1:1, and 0.75:1) of canal inside slopes are simulated with two different types of wing walls: upstream and box-type wing walls downstream of the water structure, as shown in Table 1. The contraction ratio between the original canal width (B) and the design section width (b) of the structure is set to 0.60 as the worst-case scenario for contraction. The 1D HEC-RAS models are constructed following the same steps outlined in the previous Section 2.2. After building the 1D HEC-RAS model for steady flow in an open channel, numerical modeling is conducted with six discharge rates ranging from 13.60 to 30.90 l/s. Table 1 presents the geometric data and the steady flow conditions used in the HEC-RAS package numerical models.

Analysis and Discussion

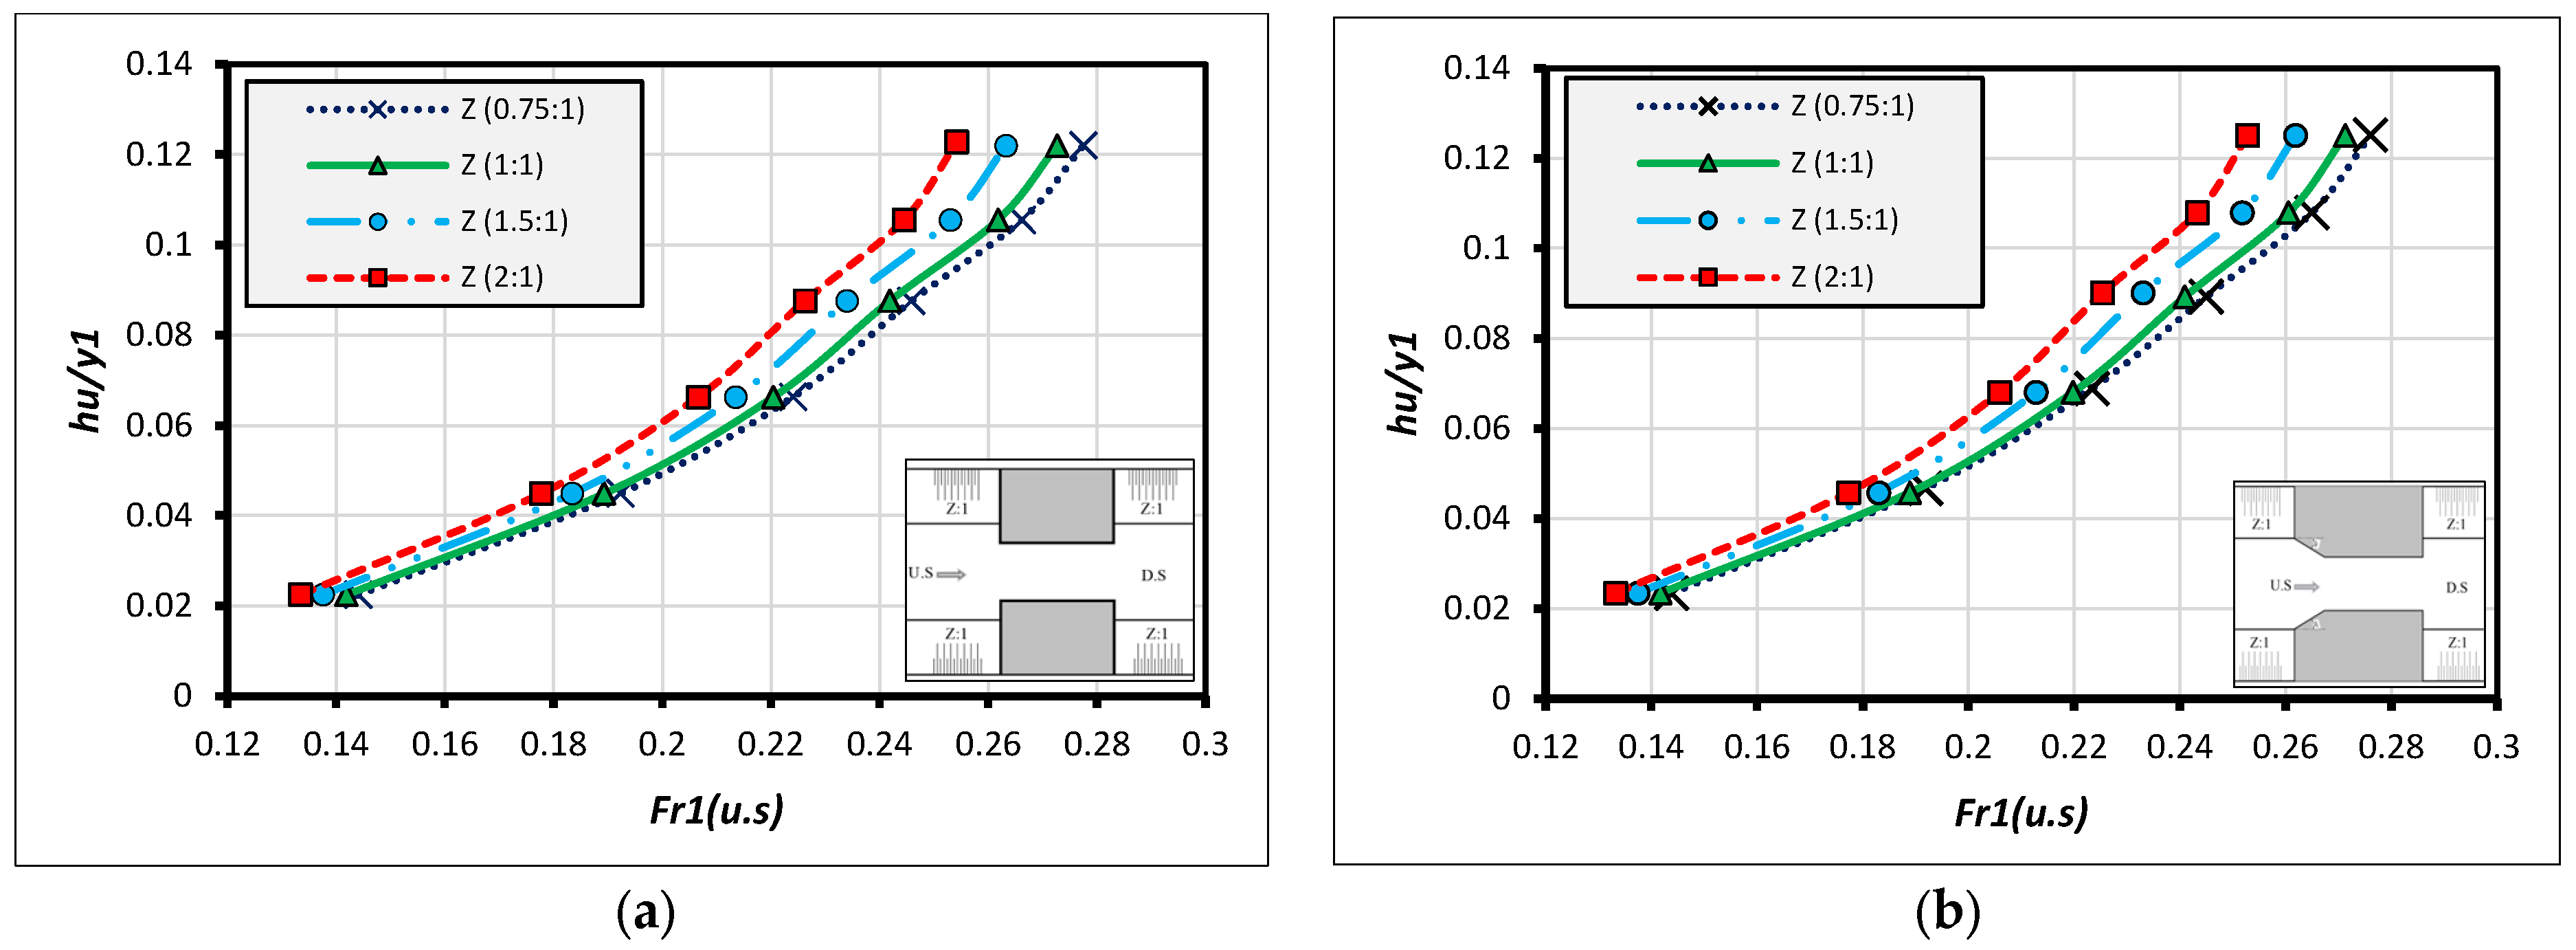
To assess the hydraulic characteristics of the water structure crossing the canal with its various inside slopes and types of wing walls, Figure 10, Figure 11, Figure 12, Figure 13, Figure 14, Figure 15, Figure 16 and Figure 17 are plotted. Figure 10a,b depict the relationship between the relative heading up (hu/y1) and the U.S. Froude number (Fr1) for U.S. box-type and broken-type wing walls, respectively. From these figures, it is observed that the relative heading up increases with an increase in the Froude number, and the relative afflux also increases with an increase in the canal inside slope, particularly with higher discharge and Froude numbers. Conversely, the relative water depths decrease with an increase in the U.S. Froude number and with an increase in the canal inside slope (Z), as shown in Figure 11a,b.
Figure 12a,b illustrate the relationship between the Froude number through the structure (Fr2) and the U.S. Froude number (Fr1) for both types of U.S. wing walls. From these figures, it can be concluded that the Froude number through the structures increases with an increase in the upstream Froude number and with an increase in the canal inside slope. Similarly, the relative velocity increases, as shown in the subsequent Figure 13a,b.
To assess the energy loss through the crossing structure with a canal of different inside slopes and various types of U.S. wing walls, Figure 14a,b plot the relationship between the relative upstream energy loss (ΔE1/y1) and the U.S. Froude number (Fr1). From the charts, it is evident that the relative energy loss increases with an increase in the Froude number for all canal inside slopes (Z). Additionally, with an increase in discharge and the canal inside slope, the relative velocity (v2/v1) also increases, as shown in Figure 15a,b.
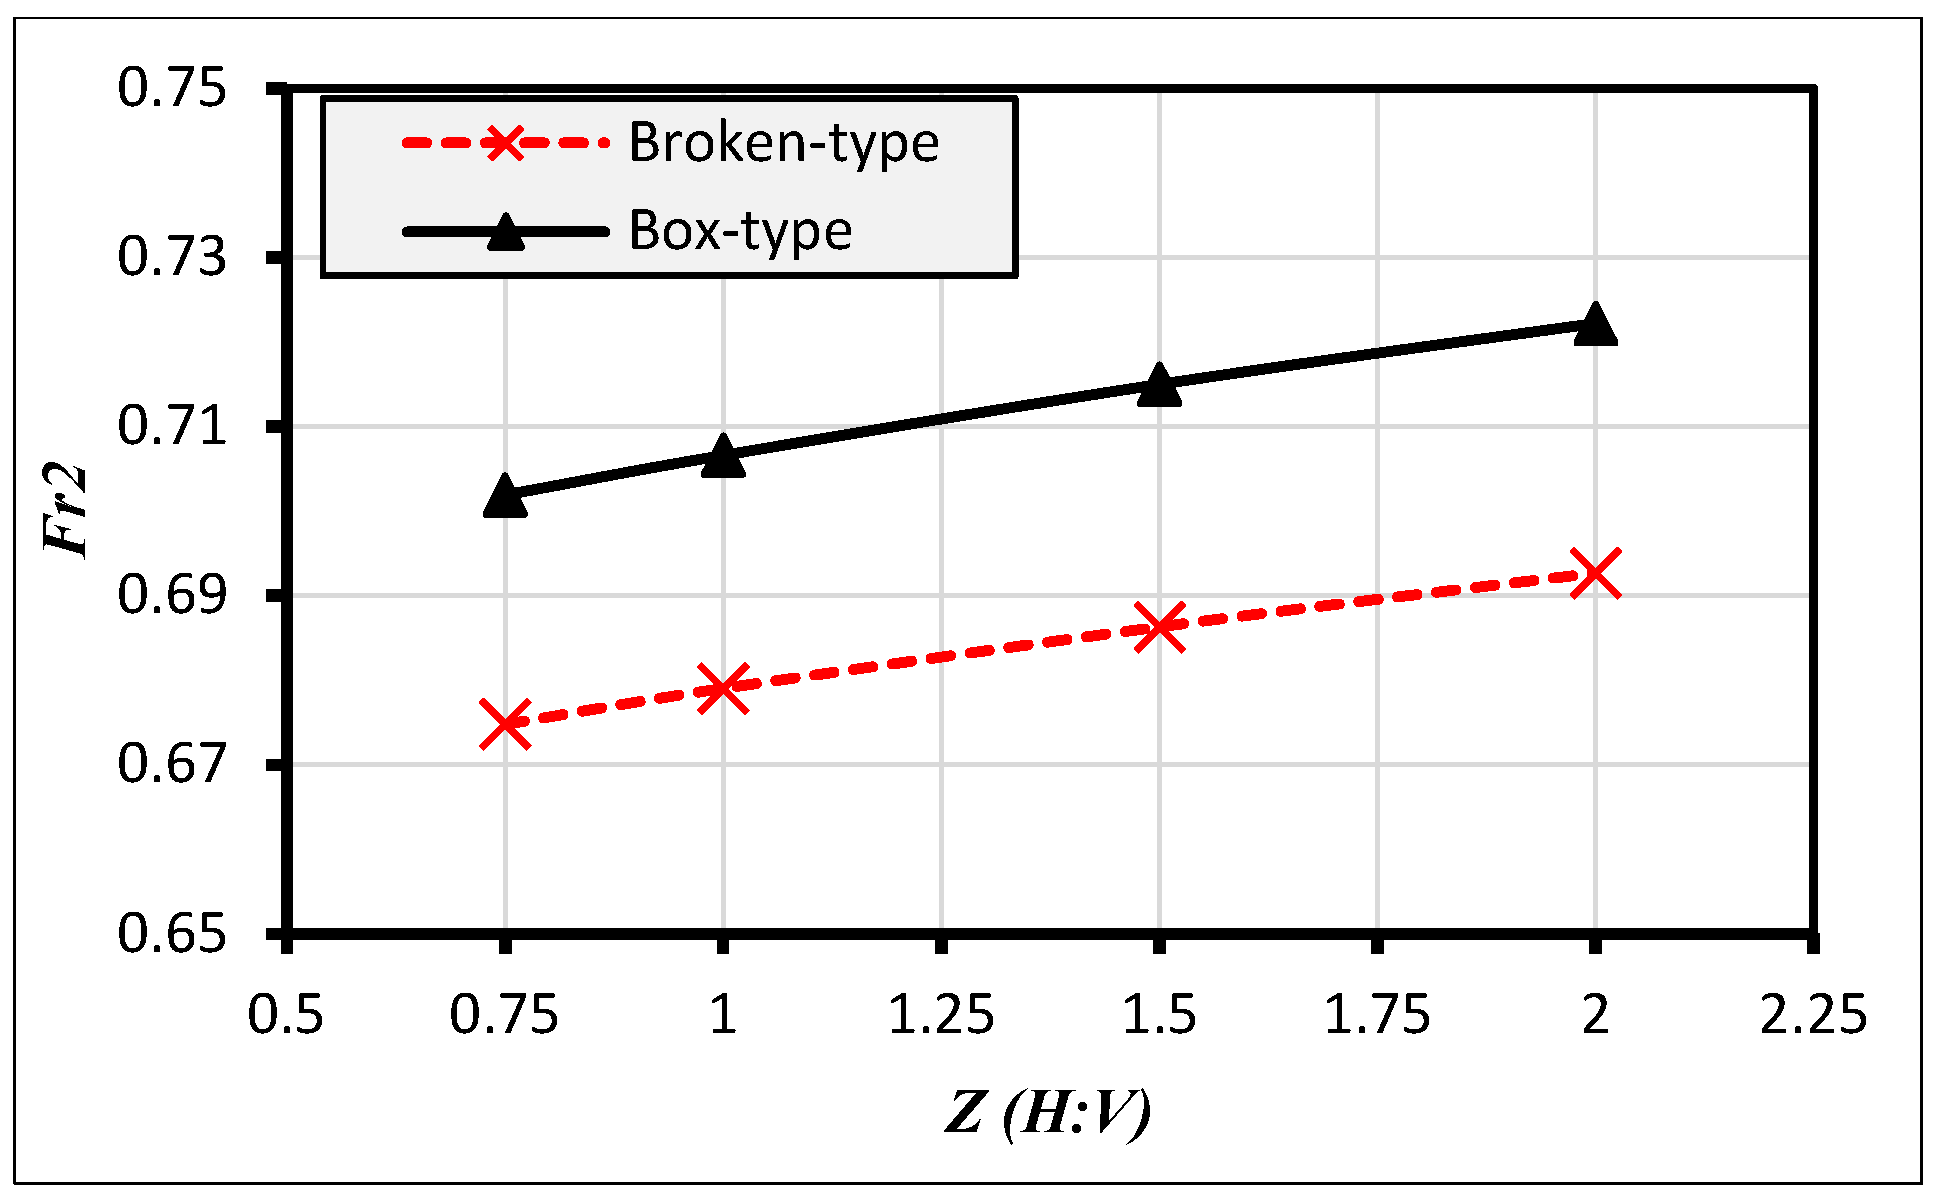
The effectiveness of different wing wall types in water structures with various canal inside slopes is compared in Figure 16 and Figure 17. From the charts, it is observed that the broken-type wing wall is more effective than the box-type across all canal inside slopes. The broken-type wing wall reduces the relative velocity, Froude number (Fr2), and relative upstream energy loss through the water structures by approximately 3%, 5%, and 20%, respectively.
Based on the previous results, the optimal configuration for the most efficient performance of water structures involves using a 1H:1V canal slope and broken-type wing walls on the upstream side, which reduces the relative velocity and relative heading by approximately 12% and 20%, respectively. Additionally, it was found that changing the canal inside slope (Z) from 0.75:1 to 2:1 results in an increase in relative heading up and relative velocity by about 27.84% and 15.06%, respectively, which is quite significant.

4. Conclusions

This applied study aims to know the interrelationship between the internal inclinations of the sides of irrigation open canals, exposed to various types of soil, and the type of wing walls used as an approach on both the upstream (U.S.) and downstream (D.S.) sides of any irrigation or water structure. The degree of compatibility between these two parameters is of great importance for the hydraulic performance efficiency of any water structure.
Using the HEC-RAS package, the most popular types of wing walls (the box type and the broken type) were simulated and tested with four open canal inside slopes. The HEC-RAS numerical model accurately estimated the hydraulic characteristics of the tested water structure, enhancing the design criteria and the assessment process of functional efficiency. The model also showed good accuracy in estimating specific energy, velocity, heading up, and water depths.
Changing the canal inside slope from 0.75H:1V to 2H:1V increases the relative heading up and velocity by approximately 27.80% and 15.06%, respectively.
Using the broken-type wing wall with a canal inside slope of 1H:1V reduced the relative velocity and heading up by 12% and 20%, respectively. Moreover, the broken-type wing wall decreased the relative velocity, Froude number, and upstream energy loss through water structures by approximately 3%, 5%, and 20%, respectively, compared to the box-type wing wall with the same canal inside slopes.

Author Contributions

Conceptualization, M.A.A., T.S.A.-Z., A.A.A. and M.K.A., methodology, M.A.A., A.A.A. and M.K.A.; software, T.S.A.-Z., A.A.A. and M.K.A.; formal analysis, M.A.A., T.S.A.-Z.; A.A.A. and M.K.A.,; investigation, M.A.A., T.S.A.-Z.; A.A.A. and M.K.A.; resources, M.A.A., T.S.A.-Z.; A.A.A. and M.K.A.; data curation, T.S.A.-Z.; A.A.A. and M.K.A.; writing—original draft preparation, M.K.A. and A.A.A.; writing—review and editing, M.A.A., T.S.A.-Z. and H.M.A.; visualization, M.A.A., T.S.A.-Z., A.A.A. and M.K.A.; supervision M.A.A., T.S.A.-Z., H.M.A. and A.A.A.; project administration, M.A.A., T.S.A.-Z., H.M.A. and A.A.A. All authors have read and agreed to the published version of the manuscript.

Funding

This research received no external funding.

Data Availability Statement

Some of the used data were extracted from [18], and the other raw data supporting the conclusions of this article will be made available by the authors on request.

Acknowledgments

We would also like to extend our deepest thanks and gratitude to Ashour, the main supervisor of this research, for generously devoting his precious time, sharing his wealth of information, and drawing upon his extensive experience. His guidance and advice have been our guiding beacon throughout our research. We pray that God Almighty rewards him with the best possible blessings.

Conflicts of Interest

The authors declare no conflicts of interest.

References

  1. Tank, Y.R.; Patel, A.S.; Patel, P.A.; Tank, A.R. Experimental Study of Ugat Canal Soil for Slope Stability. In Proceedings of the Indian Geotechnical Conference 2019: IGC-2019 Volume I; Springer: Singapore, 2021; pp. 623–634. [Google Scholar]
  2. Salunkhe, D.P.; Bartakke, R.N.; Chvan, G.; Kothavale, P.R.; Digvijay, P. An overview on methods for slope stability analysis. Int. J. Eng. Res. Technol. 2017, 6, 181–2278. [Google Scholar]
  3. Mowafy, M.H.; ELdeeb, H.M.; Salem, M.N.; ALquamhawy, A.Y. Factors affecting on stability of waterways embankments. Int. J. Eng. Res. 2015, 4, 700–705. [Google Scholar]
  4. Abdel-Aal, G.M.; Owais, T.M.; Shahin, M. Effect of side slopes of trapezoidal channel on maximum scour depth downstream of transition. In Proceedings of the ICFDP9: Ninth International Congress of Fluid Dynamics & Propulsion, Alexandria, Egypt, 18–21 December 2008. [Google Scholar]
  5. Afzalimehr, H.; Moradian, M.; Singh, V.P. Flow field around semielliptical abutments. J. Hydrol. Eng. 2018, 23, 04017057. [Google Scholar] [CrossRef]
  6. Hadi, A.M.; Ardiclioglu, M. Investigation of bridge afflux on channels by experiments and HEC-RAS package. Int. J. Eng. Technol. 2018, 7, 4829–4832. [Google Scholar]
  7. Setyandito, O.; Michael, R.D.A.; Andrew, J.P.; Wijayanti, Y. The effect of bridge abutment shape variation toward flow velocity characteristic. In IOP Conference Series: Earth and Environmental Science; IOP Publishing: Bristol, UK, 2020; p. 12035. [Google Scholar]
  8. Mulahasan, S.; Al-Osmy, S.; Alhashimi, S. Modelling of flow pattern in an open channel with sidewall obstruction. In IOP Conference Series: Materials Science and Engineering; IOP Publishing: Bristol, UK, 2021; p. 12097. [Google Scholar]
  9. Barbhuiya, A.K.; Dey, S. Velocity and turbulence at a wing-wall abutment. Sadhana 2004, 29, 35–56. [Google Scholar] [CrossRef]
  10. Barbhuiya, A.K.; Dey, S. Measurement of turbulent flow field at a vertical semicircular cylinder attached to the sidewall of a rectangular channel. Flow Meas. Instrum. 2004, 15, 87–96. [Google Scholar] [CrossRef]
  11. Atabay, S.; Haji Amou Assar, K.; Hashemi, M.; Dib, M. Prediction of the backwater level due to bridge constriction in waterways. Water Environ. J. 2018, 32, 94–103. [Google Scholar] [CrossRef]
  12. Farsirotou, E.; Xafoulis, N. Numerical simulation of scour depth variation around vertical wall abutments. World J. Res. Rev. 2017, 5, 262723. [Google Scholar]
  13. Noor, M.; Arshad, H.; Khan, M.; Khan, M.A.; Aslam, M.S.; Ahmad, A. Experimental and HEC-RAS modelling of bridge pier scouring. J. Adv. Res. Fluid Mech. Therm. Sci. 2020, 74, 119–132. [Google Scholar] [CrossRef]
  14. Mehta, D.J.; Yadav, S.M. Analysis of scour depth in the case of parallel bridges using HEC-RAS. Water Supply 2020, 20, 3419–3432. [Google Scholar] [CrossRef]
  15. Silvia, C.S.; Ikhsan, M.; Wirayuda, A. Analysis of scour depth around bridge piers with round nose shape by HEC-RAS 5.0. 7 software. In Journal of Physics: Conference Series; IOP Publishing: Bristol, UK, 2021; Volume 1764, p. 012151. [Google Scholar]
  16. Ardiclioglu, M.; Hadi, A.M.; Periku, E.; Kuriqi, A. Experimental and numerical investigation of bridge configuration effect on hydraulic regime. Int. J. Civ. Eng. 2022, 20, 981–991. [Google Scholar] [CrossRef]
  17. Nassar, M. The Afflux Calculation Under Effect of Different Number of Vents Experimentally and Using HEC-RAS. J. Eng. Sci. 2023, 51, 81–92. [Google Scholar]
  18. Ashour, M.A.; Aly, T.E.; Mostafa, M.M. Effect of canal width contraction on the hydraulic parameters and scour downstream water structures. Ain Shams Eng. J. 2019, 10, 203–209. [Google Scholar] [CrossRef]
  19. Fakhimjoo, M.S.; Ardeshir, A.; Behzadian, K.; Karami, H. Experimental investigation and flow analysis of clear-water scour around pier and abutment in proximity. Water Sci. Eng. 2023, 16, 94–105. [Google Scholar] [CrossRef]
  20. USACE HEC. HEC-RAS River Analysis System User’s Manual, Version 6.0; USACE HEC: Washington, DC, USA, 2021.
  21. Brunner, G.W. HEC-RAS 5.0 User’s Manual. US Army Corps of Engineers, Institute for Water Resources, Hydrologic Engineering Center: Washington, DC, USA, 2016. [Google Scholar]
Figure 1. Representation of methodology.
Limnolrev 24 00011 g001
Figure 3. The generated river reaches in the HEC-RAS model with cross sections of channel.
Limnolrev 24 00011 g003
Figure 4. The generated river reaches in the HEC-RAS model with cross sections through the structure.
Limnolrev 24 00011 g004
Figure 5. Input flow data conditions to the HEC-RAS model.
Limnolrev 24 00011 g005
Figure 6. Comparison between the model results and experimental results of Ashour et al., 2019 for the relation between the relative heading up (hu/y1) and the U.S Froude number (Fr1).
Limnolrev 24 00011 g006
Figure 7. Comparison between the model results and experimental results of Ashour et al., 2019 for the relation between the relative water depths (y2/y1) and the U.S Froude number (Fr1).
Limnolrev 24 00011 g007
Figure 8. Comparison between the model results and experimental results of Ashour et al., 2019 for the relation between the Froude number through the structure (Fr2) and the U.S Froude number (Fr1).
Limnolrev 24 00011 g008
Figure 9. Comparison between the model results and experimental results of Ashour et al., 2019 for the relation between the relative velocity (V2/V1) and the U.S Froude number (Fr1).
Limnolrev 24 00011 g009
Figure 10. (a) Relation between the relative heading up (hu/y1) and the U.S Froude number (Fr1) at U.S box-type wing wall. (b) Relation between the relative heading up (hu/y1) and the U.S Froude number (Fr1) at U.S broken-type wing wall.
Limnolrev 24 00011 g010
Figure 11. (a) Relation between the relative water depths (y2/y1) and the U.S Froude number (Fr1) at U.S box-type wing wall. (b) Relation between the relative water depths (y2/y1) and the U.S Froude number (Fr1) at U.S broken-type wing wall.
Limnolrev 24 00011 g011
Figure 12. (a) Relation between the Froude number through the structure (Fr2) and the U.S Froude number (Fr1) at U.S box-type wing wall. (b) Relation between the Froude number through the structure (Fr2) and the U.S Froude number (Fr1) at U.S broken-type wing wall.
Limnolrev 24 00011 g012
Figure 13. (a) Relation between the relative velocity (V2/V1) and the U.S Froude number (Fr1) at U.S box-type wing wall. (b) Relation between the relative velocity (V2/V1) and the U.S Froude number (Fr1) at U.S broken-type wing wall.
Limnolrev 24 00011 g013
Figure 14. (a) Relation between the relative upstream energy loss (ΔE1/y1) and the U.S Froude number (Fr1) at U.S box-type wing wall. (b) Relation between the relative upstream energy loss (ΔE1/y1) and the U.S Froude number (Fr1) at U.S broken-type wing wall.
Limnolrev 24 00011 g014
Figure 15. (a) Relation between the relative velocity (V2/V1) and the discharge factor (Q*= Q g y 1 5 ) at U.S box-type wing wall. (b) Relation between the relative velocity (v2/v1) and the discharge factor (Q*= Q g y 1 5 ) at U.S broken-type wing wall.
Limnolrev 24 00011 g015
Figure 16. Relation between the relative velocity (V2/V1) and the canal inside slope (Z).
Limnolrev 24 00011 g016
Figure 17. Relation between the Froude number through the structure (Fr2) and the canal inside slope (Z).
Limnolrev 24 00011 g017
Table 1. The generated geometric data and the steady flow data in HEC-RAS.
ConditionsManning
Coefficient (n)
Contraction
Ratio
(r = b/B)
Side Slope (Z) (H:V)Discharge
Q (l/s)
U.S
Water Depth
y1 (m)
D.S
Water Depth
y3 (m)
Valuen = 0.0160.600.75:1
1:1
1.5:1
2:1
13.60Normal depth
(S = 0.001)
0.01 m
18.8
22.70
25.80
28.80
30.90
SketchLimnolrev 24 00011 i001Limnolrev 24 00011 i002
Box-type wing wallBroken-type wing wall
Disclaimer/Publisher’s Note: The statements, opinions and data contained in all publications are solely those of the individual author(s) and contributor(s) and not of MDPI and/or the editor(s). MDPI and/or the editor(s) disclaim responsibility for any injury to people or property resulting from any ideas, methods, instructions or products referred to in the content.