Abstract
Understanding paleo-ice flow chronology is essential for reconstructing past ice mass dynamics, interpreting the current landscape, and identifying the sources of Quaternary sediments in deglaciated regions. A recent systematic mapping of striated bedrock and streamlined landforms south of Lake Mistassini in Canada reveals a complex sequence of five ice flows. The earliest flow was directed to the southeast (SE) and originated from a NE-SW ice divide located northwest of Lake Mistassini at the Last Glacial Maximum. A progressive clockwise rotation of this ice divide, likely triggered during the early deglaciation, appears to have generated ice flows toward the south–southeast (SSE) and then toward the south (S). During the later stages of deglaciation, the flow originated from the Québec–Labrador Dome, initially toward the south–southwest (SSW) and then toward the southwest (SW). This study presents new data on ice flows south of Lake Mistassini and shows that the southward and south–southeastward ice events occurred before the late stage of deglaciation. This interpretation contradicts some previous studies and will contribute to the discussion on the dynamics of the Laurentide Ice Sheet in the Mistassini area and support mineral exploration efforts in the region.
1. Introduction
Previous studies conducted in the Chibougamau-Mistassini area in west–central Québec, Canada, have defined a complex sequence of ice flows associated with the evolution of the Laurentide Ice Sheet during the Wisconsinan period [1,2,3,4,5]. While there is consensus among all authors that the earliest ice flow occurred in the southeastward direction, the relative ages of subsequent ice flows remain a subject of debate. Some researchers suggest a progression from southeastward to south–southeastward, southward, south–southwestward, and finally south–westward flows ([4] and this study). Others argue that the initial southeastward event was followed by divergent flows toward the southwest, south, and southeast [1,2,5,6].
In the Chibougamau-Mistassini area, detailed ice-flow studies have primarily focused on Chibougamau and its surrounding areas [2,4,7,8]. The rare studies conducted in the region south of Lake Mistassini have been limited to local research at the southern end of the lake [6,9,10]. To address this data gap, the Québec Ministry of Energy and Natural Resources conducted an extensive program of surficial geology mapping from 2015 to 2017. This initiative aimed to establish a comprehensive Quaternary framework, with a particular focus on the history of ice flow. Such information is crucial for understanding the glacial dynamics and history of the region.
The objectives of the present work are to (1) provide new data and measurements related to the ice-flow indicators south of Lake Mistassini, (2) reconstruct late Wisconsinan ice-flow patterns, and (3) compare these results to those previously reported for the surrounding areas. This will contribute to improving our understanding of the Laurentide Ice Sheet (LIS) dynamics in this heavily drift-covered area.
2. Study Area
The study area, covering 12,841 km2, is located south of Lake Mistassini in Québec, Canada. It is situated approximately 30 km northeast of Chibougamau, between latitudes 50° and 51° north, and longitudes 72° and 74° west (Figure 1). The study area features moderate relief, characterized by mountains and hills that are part of the Laurentian Highlands of the Canadian Shield [11]. The elevation in the study area ranges from 270 to 757 m above sea level, with the highest areas located in the northeastern part of the region. These areas are characterized by mountain ridges that are roughly oriented in a northeast–southwest direction in the northern part and north–south in the southern part of the area (Figure 1). Three drainage divides, oriented NNE-SSW and locally W-E, divide the area into four main watersheds (Figure 1). The majority of the area’s drainage is directed toward the south, while the northern part flows in a northwestern direction.
The bedrock of the study area is primarily situated in the Grenville Province within the Canadian Shield (Figure 1). It comprises Archean metamorphic, plutonic, metasedimentary, and metavolcanic rocks. The Proterozoic sedimentary rocks, predominantly dolostones, are exposed in the western portion of the region [12,13,14,15]. The Quaternary deposits in the region consist of various types of glacial, glaciofluvial, glaciolacustrine, and postglacial sediments of different thicknesses and extents [6,9,10,16,17,18]. Glacial and glaciofluvial deposits are extensive and often associated with landforms that are easily recognized in the landscape, such as drumlins, crag-and-tails, eskers, and terraces.

Figure 1.
Location map of the study area. Grenville Front from the geological map of Québec [19]. Hydrography data (1:20,000) from the Topographic Database of the Government of Québec available at: https://www.donneesquebec.ca/, accessed on 13 September 2022.
Figure 1.
Location map of the study area. Grenville Front from the geological map of Québec [19]. Hydrography data (1:20,000) from the Topographic Database of the Government of Québec available at: https://www.donneesquebec.ca/, accessed on 13 September 2022.

3. Materials and Methods
This study integrates data collected between 2015 and 2017 during the mapping of surficial geology in the southern region of Lake Mistassini. The field work primarily involved the use of trucks along forest roads. In areas where the roads were old or narrow, all-terrain vehicles (ATVs) were utilized. The expansion of forestry activities in recent years has led to the development of a dense network of logging roads, spanning approximately 11,450 km in total length. This extensive network has provided excellent accessibility to the region. Approximately 30 h of helicopter flight time was utilized to reach and investigate areas that were not accessible via logging roads.
3.1. Small-Scale Glacial Features
The data collected comprised multiple indicators of ice movement, including small-scale and large-scale glacial features, both of which provided valuable information about past glacial dynamics and ice-flow patterns. The small-scale features correspond to erosional marks inscribed on bedrock surfaces by rock debris embedded in the base of a moving glacier. These glacial erosion features vary in size from a few millimeters to several meters and include striae (or striations), grooves, crescentic gouges, and whaleback features.
Striae are fine, straight, and parallel scratches on bedrock surfaces that are millimeters wide and centimeters to meters in length, and oriented parallel to the direction of the ice flow [20]. Grooves refer to large and deep gouges, tens of centimeters to meters in length and tens of centimeters wide, which are generally isolated and more or less closed at the ends [20]. They are carved into the bedrock through more intense glacial erosion parallel to the direction of ice flow. Crescentic gouges are small crescent-shaped cracks, typically a few centimeters in length and a few millimeters in depth. They are rarely isolated and usually form a train in the direction of ice flow. The convex side of each crescent points towards the ice-flow direction [20,21]. Whaleback features are smooth, elongated bedrock ridges, typically one to two meters wide, one to three meters high, and five to ten meters in length. They are formed by the abrasive action of ice flowing parallel to the direction of ice flow. These streamlined features have a gentle upstream stoss slope and a steeper downstream lee slope, reflecting the ice-flow direction.
3.2. Large-Scale Glacial Features
The large-scale features (tens of meters to a few kilometers) are streamlined landforms oriented parallel to the direction of ice flow, formed by erosion and deposition at the ice–bed interface [22,23]. They include drumlins, drumlinoids, and crag-and-tail features. Drumlins are elongated, asymmetrical hills of glacial till, exhibiting a gentle slope on the upstream side and a steeper slope on the downstream side. Drumlinoids are similar in shape to drumlins, but are less pronounced and tend to be elliptical in plan [24]. Crag-and-tail features consist of a steep “crag” on the upstream side, and a more gently sloping “tail” extending downstream. These landforms are formed by the deposition of glacial till in the lee side of a bedrock obstacle.
3.3. Data Collection and Processing
The small-scale features were identified and mapped in the field (Figure 2). For each feature, the position (x, y), elevation (z), orientation, and direction were systematically measured using Garmin GPSMAP and the standard Brunton compass. The direction of ice flow on the striated bedrock surfaces was determined using small- to medium-scale movement indicators, such as rat-tail ridges, miniature whaleback forms, and stoss-and-lee forms (Figure 3). Striations were mainly observed on fresh bedrock surfaces. In the case of weathered rock outcrops, such as gneiss, striations have frequently been observed on some large crystals of quartz or feldspar.
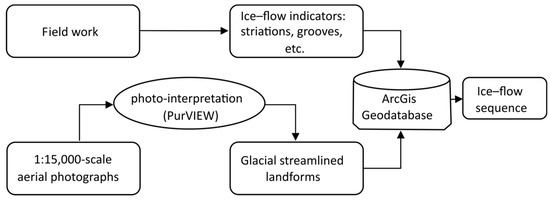
Figure 2.
Flowchart of the research process.
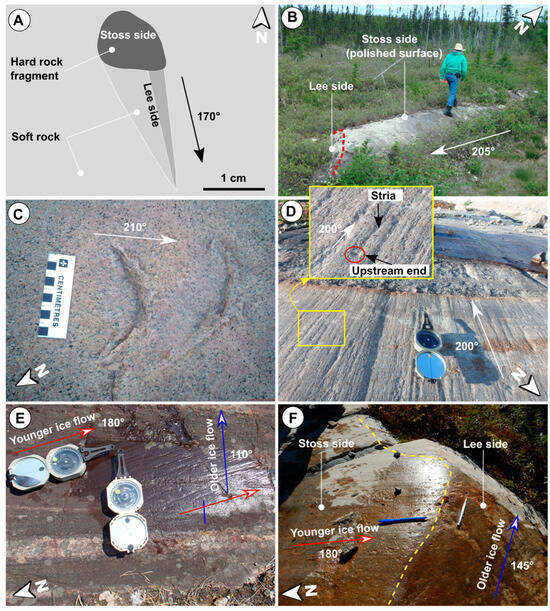
Figure 3.
Examples of small- to medium-scale ice movement indicators. (A) Illustration of a rat-tail ridge exhibiting a tapering tail in the lee side of a resistant rock fragment, indicating a south–southeastward ice flow. A hard rock fragment acts as a barrier, shielding softer rock in its lee from glacial erosion and resulting in the formation of a downstream ridge. (B) A whaleback form with a polished upstream side and a rough, plucked downstream side. (C) Crescentic gouges resulting from an ice mass moving toward the south–southwest. The steep side of each gouge faces upstream. (D) A stria with a relatively wider depression at its upstream end, marking the original position of the rock fragment that created the stria beneath a moving glacier. (E) Fine striae from an older SE-ice flow overprinted by coarse striae from a younger S-ice flow. (F) Preserved striae from an older ice flow (SE) on a lee side rock surface, sheltered from a younger ice flow (S).
The streamlined landforms were identified and mapped by examining 1:15,000-scale digital conventional aerial photographs using PurVIEW software version 2.0.0.8, which provides a stereoscopic three-dimensional visualization of the landscape. Some of these landforms have been validated during field surveys, particularly those visible from roads or during aerial traverses. Based on the analysis of aerial photographs, drumlinoids were found to be the most frequently observed landforms, while drumlins were relatively rare. The morphometric characteristics of the streamlined landforms were quantified using GIS techniques through the ESRI ArcGIS Desktop software version 10.3. Length was calculated using the Calculate Geometry tool, which computes the maximum distance along the main axis of each feature. Width was determined using the Measure Distance tool, measuring perpendicular to the long axis at the widest point. Orientation was assessed with the Linear Directional Mean tool, which calculates the azimuth of features. These measurements enabled a comprehensive analysis of landform morphology and spatial distribution, allowing for further statistical analyses and visualizations to infer the ice-flow patterns responsible for their formation across the study area.
For the purpose of the discussion, the terms ‘striations’ and ‘streamlined landforms’ are used in the following sections to refer to erosional indicators of ice flow (striae, grooves, crescentic gouges, and whaleback features), and to depositional indicators of ice flow (drumlins, drumlinoids, and crag-and-tail formations), respectively.
The relative chronology of ice flows was determined in the field by analyzing the cross-cutting relationships of striations (Figure 3E,F). Spatial relationships between streamlined landforms, such as cross-cutting and overlying were considered during the aerial photograph analysis. However, no such relationships were observed within the study area.
Till fabric analysis was conducted at two sites presenting cross-sections within a till. This widely-used technique examines the internal composition and sedimentological history of till [25,26]. The method is based on the tendency of elongated clasts within till to exhibit a preferred orientation, typically parallel to ice movement [27,28]. The analysis involves measuring the orientation of the long axis of in situ elongated clasts sampled from an area smaller than 1 m². Measurements were taken at both the lower and upper parts of each cross-section. Due to the sandy composition of the till in the study area and the limited availability of elongated clasts, the analysis was restricted to forty clasts for each site. The resulting data were visualized using rose diagrams.
The collected data were processed using ESRI ArcGIS Desktop (version 10.3) and Microsoft Excel software 2007 (version 12.0.6214.1000). All the raw data is available online through the Québec Geomining Information System (SIGÉOM) at the following address: http://sigeom.mines.gouv.qc.ca/, accessed on 9 October 2024.
4. Results
In the study area, there was a significant abundance of striations and streamlined landforms, indicating numerous widespread ice-flow events. Data on these events were collected from 1004 striated bedrock outcrops and 1784 streamlined landforms (Table 1). An analysis of the orientation of the observed features revealed a sequence of five paleo-ice flows: southeastward flow (SE), south–southeastward flow (SSE), southward flow (S), south–southwest flow (SSW), and southwest flow (SW).

Table 1.
Summary of identified ice-flow indicators south of Lake Mistassini.
4.1. Ice Flow SE
The evidence for this phase within the study area was limited to small-scale features (Figure 4), including twenty-eight striations and one groove. Most measured striations were observed in sheltered positions on the southwest sides of outcrops, which were protected from subsequent ice flows (Figure 3F and Figure 5A). The azimuths of these features ranged from 110 to 145° (or 290 to 325°), with the most common values between 126 and 130° (or 306 to 310°). Due to the field conditions, particularly the small size of the striated surfaces (<1m2), determining the direction of ice movement from these striations was challenging. Analysis of the cross-striations relationship indicated that striations from the SE-ice flow were systematically overprinted by those from other flows: SSE (2 sites), S (10 sites, Figure 3E,F), and SSW (7 sites).
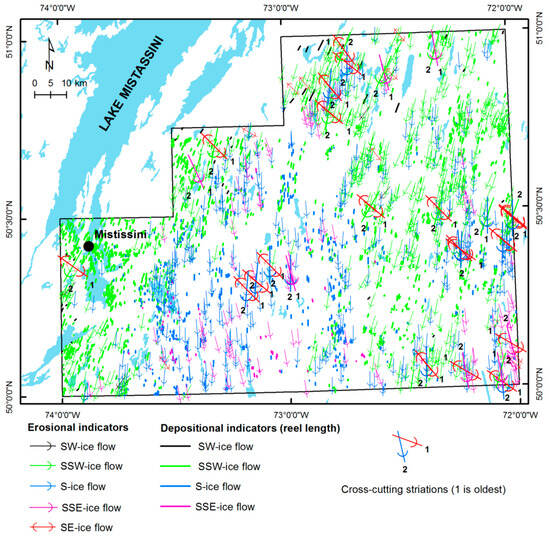
Figure 4.
Sequence of ice flows derived from the mapping of striations and streamlined landforms during this study. Hydrography data from the Topographic Database of the Government of Québec.
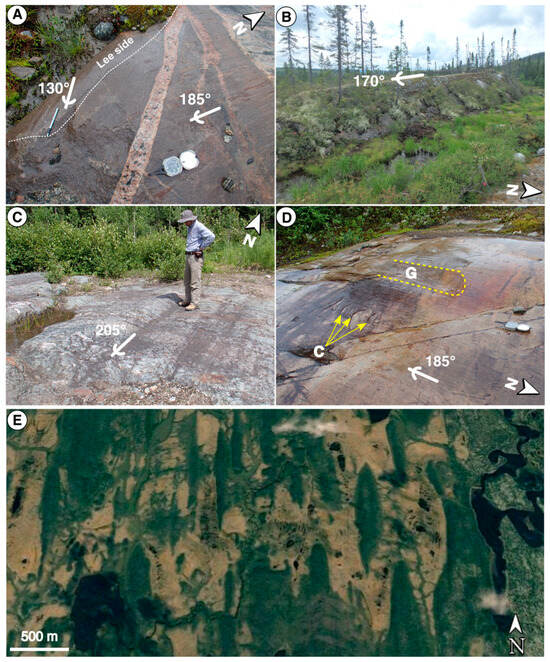
Figure 5.
Examples of ice-flow indicators mapped in the study area. (A) Striations from the oldest ice flow toward 130° (lee side surface) crossed by those of the southward ice flow (185°). (B) Whaleback feature indicating ice flow to the south–southeast (170°). (C) Groove indicating south–southwestward ice flow. (D) Striated outcrop showing groove (G) and crescentic gouges (C) of the southward ice flow (185°). (E) Image from Google Earth showing many streamlined landforms (drumlinoids) associated with the southward ice flow north of Lake Clérac (central part of the study area). Image © 2023 CNES/Airbus.
4.2. Ice Flow SSW
It is the south–southwestward flow (SSW) that shaped the present-day landscape in the study area. It was recorded by 1223 streamlined landforms (1040 drumlinoids, 77 drumlins, and 106 crag-and-tails) and 515 small-scale erosional features (483 striations, 24 grooves, 4 crescentic gouges, and 4 whaleback features). These features showed trends from 186 to 213°, with the most common azimuth ranging between 186 and 195° for both erosional and depositional indicators. Streamlined landforms varied in length from a few tens of meters up to 3275 m, with an average length of 788.5 m. The most impressive drumlins field could be seen in the western part of the region near the village of Mistissini (Figure 4). Striations from this flow overprinted those from the SE-ice flow at seven sites, the SSE-ice flow at four sites, and those from the S-ice flow at one site.
4.3. Ice Flow SW
The field evidence for southwestward (SW) ice movement was observed primarily in the westernmost part of the area and was limited to only six striated outcrops and twenty-two drumlinoids (Figure 4). Striations and drumlinoids ranged in azimuth from 215 to 230°. The relative age of this ice movement could not be determined in the field. However, indicators of this event were abundant in the Chapais region west of the study area, with cross-cutting relationships suggesting that it postdates the SSW event [4].
4.4. Ice Flow SSE
Evidence for the south–southeastward ice flow was observed at various locations throughout the study area (Figure 4). This flow was characterized by 109 erosional indicators, which included 105 striations, 2 grooves, 1 whaleback feature, and 1 rock surface with crescentic gouges. Additionally, 71 streamlined landforms from this event were observed, comprising 61 drumlinoids and 10 crag-and-tails. Striations ranged in direction between 155 and 174°, with the most common azimuth between 166 and 170°. The streamlined landforms ranged, however, from 147 to 173°, with a most frequent azimuth between 171 and 174°. These landforms ranged in length from 67 m to a maximum of 1278 m, with an average length of 506.6 m.
The cross-cutting relationships revealed that striations from the SSE-ice flow overprinted those resulting from the SE-ice flow at two sites and were, in turn, crossed by those from the SSW-ice flow at four sites and by the S-ice flow at one site (Figure 4).
4.5. Ice Flow S
This event was recorded by 371 erosional indicators (358 striations, 12 grooves, and 1 site showing crescentic gouges), and by 468 streamlined landforms, consisting of 390 drumlinoids and 78 crag-and-tails. The orientation of these features varied between 175° and 185°, with the most frequent azimuth being 175°–180° for erosional indicators and 180°–185° for depositional indicators. The streamlined landforms associated with this flow were more abundant and relatively well–developed compared to those of the south–southeastward (SSE) ice flow. They reached lengths of up to 2482 m, with an average length of 645.4 m.
Analysis of the striated outcrops revealed that striations from the S-ice flow overprinted those from the SE-ice flow at ten sites (Figure 3E,F), and those formed during the SSE-ice flow at one site. Additionally, they were crossed by striations from the south–southwestward (SSW) direction at one site. It should be noted that most of the striations from the SE, SSE, and S-ice flows were generally fine due to the erosive effects of subsequent glacial flows, making it difficult to capture photographs that clearly show the cross-cutting relationships.
4.6. Till Fabric
Analysis of till fabric for two cross-sections revealed distinct clast orientation patterns. In cross-section A, elongated clasts were predominantly oriented parallel to the SSE-ice flow (Figure 6A). The lower part of this cross-section showed frequent clasts aligned with the SE-ice flow, while the upper part exhibited a higher frequency of clasts oriented parallel to the SSW-ice flow. Cross-section B displayed more varied clast orientations, with a slight predominance of SSW-ice flow-aligned clasts in both the lower and upper parts (Figure 6B).
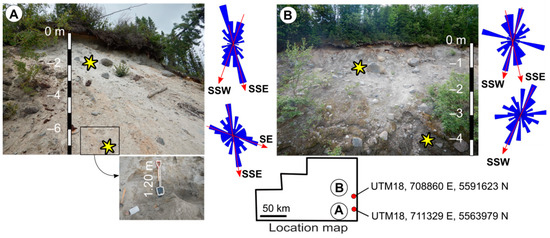
Figure 6.
Till fabric analysis from two cross-sections in the southeastern part of the study area. (A) shows the southern cross-section, (B) illustrates the northern cross-section. Yellow stars indicate sampling sites.
5. Discussion
The ice flows identified in this study were previously documented at various locations around the study area, to the north [1,3,6,29,30], west [2,4,8,31,32,33], northwest [34], southwest [7], south [35], and east [5] (Figure 7). To date, there is no absolute age for these glacial events that affected the study area. The available ages come from radiocarbon dating performed on organic matter from peat in the Chibougamau area, west of the study area [32]. The ages obtained range between 1800 ± 100 and 7600 ± 100 years BP, indicating that the Chibougamau-Mistassini region became ice-free starting approximately 7600 years BP. Despite the lack of absolute ages for ice-flow events in the Chibougamau-Mistassini region, previous studies have proposed a Late Wisconsinan age for these glacial events based on the well-preserved state of outcrop surfaces where striations were observed [4,29,36]. Similar observations in the study area support this hypothesis, with remarkably fresh basal till, and striated surfaces showing no signs of deep weathering.
Within the study area, striated surfaces observed at high elevations suggest that the ice mass associated with the SE, SSE, S, and SSW events was sufficiently thick to fill valleys and flow over hills and mountains. In some locations, the minimum ice thickness was estimated to be at least 400 m above the valley floors [37].
The observation of glacial erratics originating from the Chibougamau-Mistassini area at many southeastern locations between Lake Mistassini and St. Lawrence River [38,39,40,41] provides additional clear evidence that the southeastward ice flow occurred in the study area. The analysis of nineteen cross-striated surfaces unequivocally demonstrates that this flow predates all identified ice flows in the study area. The lack of landforms associated with this phase further supports its distinction as the oldest Quaternary glacial event mapped in the region. This event was initially thought to have originated from a local ice-dispersal center developed on the east side of James Bay during the Late Wisconsinan glacial period [29]. Later studies linked it to an NE-SW ice divide located somewhere northwest of Lake Mistassini during the Last Glacial Maximum [5,34,42].

Figure 7.
Ice-flow sequence south of Lake Mistassini and in the surrounding areas. A: This study, B [4], C [3], D [30], E [34], F [42], G [43], H [35], I [5], and J [39]. Mistassini ice divide [42,44]. Hydrography data from the Topographic Database of the Government of Québec.
Figure 7.
Ice-flow sequence south of Lake Mistassini and in the surrounding areas. A: This study, B [4], C [3], D [30], E [34], F [42], G [43], H [35], I [5], and J [39]. Mistassini ice divide [42,44]. Hydrography data from the Topographic Database of the Government of Québec.

The south–southwest ice flow (SSW), as revealed by cross-cutting relationships, represents the last glacial event that occurred within the study area. All previous studies agreed that this event occurred during deglaciation from the Québec-Labrador Dome to the northeast of the study area [2,5,6,7,32,45]. According to some researchers, this flow is part of a larger divergent flow toward the southwest, whose divergence has been attributed to the underlying topography [1,2,6] and to changes in the ice front configuration during ice retreat [6,43].
While all studies agree on the relative age of the early southeastward event, there is a disagreement regarding the relative age of the southward and south–southeastward events in relation to the most recent SSW event. Some proposed that the southward [4,43] and the south–southeastward [4] events are younger than the south–southwestward event, while others suggested the inverse chronology [2,3,5,6].
The relative ages, inferred from the interpretation of cross-striations within the study area, suggest that both southward (S) and south–southeastward (SSE) flows occurred between the south–eastward (SE) and south–southwestward (SSW) events, as already mentioned in the Chapais area [4]. In addition to cross-cutting relationships, there are other pieces of evidence that support this relative chronology. Firstly, although till fabric was not systematically analyzed across the study area, one key cross-section provides clear evidence that the SSE-ice flow preceded the SSW event. Secondly, as landforms and striations formed during an ice flow are, partially or completely, removed by subsequent ice flows, we can consider that the relative abundance of these features increases from older to younger ice flows. On this basis, in the study area, the order of the ice flows from oldest to youngest would be as follows: SE-ice flow (29 indicators), SSE-ice flow (180 indicators), S-ice flow (839 indicators), and finally SSW-ice flow (1738 indicators).
Thirdly, an analysis of the spatial distribution of ice-flow indicators revealed that numerous striae and landforms from the SSE and S-ice events were documented at elevations exceeding 600 m in various locations across the study area (Figure 8). This suggests that, at some point in their history, these two events were associated with thick ice masses capable of filling depressions and flowing over hills and mountains [37], given that the highest elevation in the region is below 757 m. This provides more evidence in favor of southward and south–southeastward ice flows occurring prior to the last deglaciation event (SSW-ice flow).
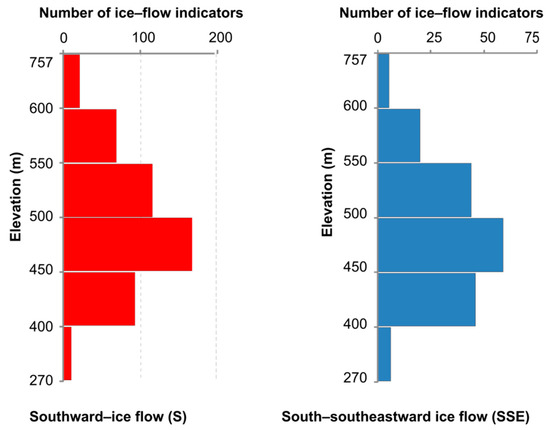
Figure 8.
Elevation-based distribution of S and SSE-ice flow indicators.
Fourthly, in both the study area and the surrounding areas to the west [7,31,32], striations and landforms resulting from the late SSW-ice flow exhibit a consistent orientation. However, a discordance between the orientations of striations and landforms was observed for both SSE and S-ice flows. A similar situation was documented in Southern Quebec along the western Appalachian border [46]. On the other hand, as striations predate the overlying till shaped into landforms [47,48], both striations and landforms associated with an event reflect continuous ice flow over time, which may indicate a range of directions associated with the same glacial event [49,50]. On this basis, the observed misalignment in orientation between the striations and the streamlined landforms of the SSE event, as well as between the striations and the streamlined landforms of the S event in the study area, could be attributed to a systematic westward deviation of ice flow. This deviation implies a progressive or gradual shift in ice-flow direction from SE to SSE to S, and finally to SSW.
Fifthly, when elongated lakes in deglaciated areas are not related to tectonic activity and have a similar orientation, they are typically attributed to glacial processes [51]. A morphometric analysis of water bodies south of the Lake Mistassini area has identified 2229 elongated lakes with a length-to-width ratio of 3 or more. The primary orientation of these lakes in a NNE-SSW direction (Figure 9) supports their association with the most recent SSW ice event and suggests that southward and south–southeastward ice events occurred before the SSW event. In the current state of knowledge about the region’s geology, the tectonic origin of some elongated lakes cannot be entirely ruled out, especially in the southwestern part of the region where NNE-SSW to NE-SW faults have been mapped (Figure 9). However, the glacial origin of most NNE-SSW elongated lakes is evident and supported by the abundance of these lakes even in areas where the regional fold axes are transverse to the NNE-SSW ice-flow direction.
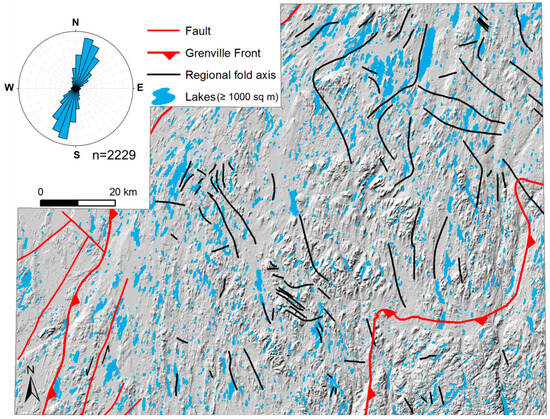
Figure 9.
Distribution and orientation of elongated lakes (length:width ≥ 3) within the study area. Shaded relief derived from ASTER Global Digital Elevation Model V003. Hydrography data from the Topographic Database of the Government of Québec, accessed on 13 September 2022. Geological data from SIGÉOM (http://sigeom.mines.gouv.qc.ca/), accessed on 9 October 2024.
Sixthly, the model of deglaciation proposed for Québec and Labrador [52] shows that the ice front south of Lake Mistassini gradually shifted from a predominant NE-SW orientation (12.7 Cal ka) to ENE-WSW (11.55 Cal ka), then to E-W (10 Cal ka), and finally to a NW-SE orientation (9.2 Cal ka). These adjustments provide additional evidence for a clockwise shift in ice flow from the early southeastward (SE) flow to a south–southeastward flow (SSE), then to a southward flow (S), and finally to a late south–southwestward flow (SSW) within the study area.
It should be noted that during the late stage of deglaciation, shortly before 7600 years BP [32], the thin ice mass was most likely constrained to flow southward locally in the southern part of the study area, where the topography is characterized by a predominant north–south orientation. Although this local flow was not revealed by cross-striations in this study, many southward striations and landforms confined to north–south valleys could have been formed during this late event. As a result, two southward flows would have occurred in the Chibougamau-Mistassini area: one before and one after the SSW event. The analysis of Quaternary lithostratigraphic units near the Icon mine south of Lake Mistassini revealed a major southward event and a more recent minor readvance, supporting this conclusion [10]. A similar situation, where striations indicative of an event are oldest at some sites, and youngest at others, has been reported in Northern Ontario [53].
In order to explain the evolution of the Laurentide Ice Sheet in the Chapais region (west of the study area), Prichonnet and Beaudry (1990) [4] suggested that a dispersion center migrated eastward from a sector located south of James Bay toward the New Quebec Dome. This model is also valid for the Chibougamau-Mistassini area as it could explain an earlier southeastward flow, followed by a south–southeastward event, a southward event, and finally, a late flow toward the SSW. Nonetheless, the presence of an ice divide oriented NE-SW in the northwest of Lake Mistassini [5,34,42] leads us to propose an alternative model where a clockwise rotation of this ice divide would successively give rise to the SSE and S-ice flows before disappearing prior to the final deglaciation event. Regardless of whether the origin of these events is a migration of a dispersal center or a rotation of an ice divide, it is interesting to emphasize a progressive or gradual movement of the dispersal center (or ice divide) as indicated by the presence of intermediate directions between the recorded ice flows in the study area. Compared to other flows, the last south–southwestward ice flow appears to have persisted for an extended period of time, providing ample time for the formation of the numerous large streamlined landforms of the present-day landscape.
Finally, it is important to note that such dynamics of ice divide or dispersal center leading to significant shifts in ice flow is not an uncommon phenomenon, as similar phenomena have been reported in other areas of Canada [54,55,56] and elsewhere in the world [57,58].
6. Conclusions
A new extensive mapping of ice movement indicators south of Lake Mistassini in Canada, an area historically overlooked by mineral explorers and Quaternary geologists, has revealed 1004 striated bedrock outcrops and 1784 streamlined landforms. The results indicate a sequence of five paleo-ice flows associated with the evolution of the Laurentide Ice Sheet during the Late Wisconsinan period, up to approximately 7600 years BP: southeastward (SE), south–southeastward (SSE), southward (S), south–southwestward (SSW), and southwestward (SW). While previous studies determined the earliest ice-flow direction as southeastward, the relative ages of subsequent ice flows remained unclear. Through meticulous analysis of cross-striations and streamlined landforms in the present study, the relative chronology of ice-flow events was reconstructed, challenging previous interpretations and highlighting the complexity of ice dynamics in the region. The results confirm that the southeastward flow (SE) represents the earliest glacial event, while recognizing the south–southwestward flow (SSW) as the final event shaping the present-day landscape. There is substantial evidence suggesting that the south–southeastward (SSE) and then southward (S) ice flows occurred between the earlier SE and the later SSW events. The southeastward flow (SE) originated from an NE-SW ice divide located northwest of Lake Mistassini during the Last Glacial Maximum. A clockwise rotation of this ice divide would successively give rise to the south–southeastward (SSE) and southward (S) ice flows. The most recent ice flow, south–southwestward (SSW), occurred from the Québec-Labrador Dome during the late deglaciation.
The results of this study provide valuable insights into the relative chronology of the south–southeastward (SSE) and southward (S) ice flows. Further fieldwork at a regional scale will be necessary to determine the extent of these two events and to uncover additional evidence to refine their relative ages. By integrating field observations with existing knowledge and landforms mapping, this research provides a comprehensive overview of the ice-flow patterns south of the Lake Mistassini area. This contribution significantly enhances our understanding of the dynamics of the Laurentide Ice Sheet, which is crucial for comprehending past glacial events and their implications for landscape evolution and natural resource exploration.
Author Contributions
Conceptualization, M.E.A. and K.D.; Data curation, M.E.A.; Formal analysis, M.E.A.; Funding acquisition, M.E.A.; Investigation, M.E.A.; Methodology, M.E.A. and K.D.; Project administration, M.E.A.; Resources, M.E.A.; Software, M.E.A.; Supervision, M.E.A.; Validation, M.E.A., K.D. and A.A.; Visualization, M.E.A.; Writing—original draft, M.E.A. and K.D.; Writing—review and editing, M.E.A., M.H.H., M.E., S.C., A.A., M.A.B.D., L.O., N.M., Y.H. and L.B. All authors have read and agreed to the published version of the manuscript.
Funding
Financial and logistical support for this research was generously provided by the Bureau de la Connaissance Géoscientifique du Québec (BCGQ) of the Ministry of Energy and Natural Resources of Québec.
Data Availability Statement
The original data presented in the study are openly available in the Québec Geomining Information System (SIGÉOM) at the following address: http://sigeom.mines.gouv.qc.ca/, accessed on 9 October 2024.
Acknowledgments
We sincerely appreciate the assistance of A. Archambeault, T.K. Gélinas, and A. Carré from Laval University, as well as H. Dubé-Loubert from BCGQ, during the fieldwork. We extend our special thanks to J.J. Veillette from the Geological Survey of Canada for his helpful comments on our initial manuscript. Additionally, we would like to express our gratitude to the anonymous reviewers for their constructive comments and suggestions, which significantly contributed to the substantial improvement of the manuscript.
Conflicts of Interest
The authors declare no conflicts of interest.
References
- Bouchard, M.A.; Cadieux, B.; Goutier, F. L’origine et les caractéristiques des lithofaciès du till dans le secteur nord du lac Albanel, Québec: Une étude de la dispersion glaciaire clastique. Can. Inst. Min. Metall. 1984, 34, 244–260. [Google Scholar]
- Martineau, G.; Bouchard, M.; Lacroix, P. Aspects de la Géologie du Quaternaire de Chibougamau; Québec MB 84-13; Ministère de l’Énergie et des Ressources: Québec, QC, Canada, 1984; p. 24.
- Bouchard, M.A. Géologie des Dépôts Meubles de la Région de Témiscamie, Territoire du Nouveau-Québec; MM 83-03; Ministère de l’Énergie et des Ressources: Québec, QC, Canada, 1986; p. 90.
- Prichonnet, G.; Beaudry, L. Évidence d’un écoulement glaciaire sud, antérieur à l’écoulement sud-ouest du Wisconsinien supérieur, région de Chapais, Québec. Rech. En Cours. Partie C. 1990, 90, 331–338. [Google Scholar]
- Veillette, J.J. Ice flow chronology and palimpsest, long-distance dispersal of indicator clasts, north of the St. Lawrence River Valley, Québec. Géographie Phys. Et Quat. 2004, 58, 187–216. [Google Scholar] [CrossRef]
- Cadieux, B. La Dispersion Glaciaire des Fragments de Roches dans la Région du lac Mistassini, Québec. Master’s Thesis, Université de Montréal, Montréal, QC, Canada, 1986; p. 167. [Google Scholar]
- DeCorta, H. Les Dépôts Quaternaires de la Région lac Rohault-Lac Boisvert (sud de Chibougamau). Aspects de la Dispersion Glaciaire Clastique. Master’s Thesis, Université du Québec à Montréal, Montréal, QC, Canada, 1988; p. 124. [Google Scholar]
- Paradis, S.J. Géologie des formations en Surface, Lac Chibougamau, Municipalité de Chibougamau, Québec; Carte 2062A, échelle 1/100000; Commission Géologique du Canada: Ottawa, ON, Canada, 2004. [CrossRef]
- Warren, B. Dépôts Meubles de la Région de la Baie-du-Poste, Comtés d’Abitibi-Est et de Roberval; DP-267; Ministère des Richesses Naturelles: Québec, QC, Canada, 1974; p. 8.
- Dilabio, R.N.W. Glacial dispersal of rocks and minerals at the south end of Lac Mistassini, Québec, with special reference to the Icon dispersal train. Geol. Surv. Can. 1981, 3, 46. [Google Scholar]
- Bostock, H.S. Physiographic Regions of Canada; “A”Series Map 1254A; Geological Survey of Canada: Ottawa, ON, Canada, 1970. [CrossRef]
- Neilson, J.M. La Région d’Albanel, Territoire de Mistassini; Ministère des Mines: Québec, QC, Canada, 1953; Volume 53, p. 38.
- Bergeron, R. Late Precambrian Rocks of the North Shore of the St. Lawrence River and of the Mistassini and Otish Mountains Areas, Quebec. In The Proterozoic in Canada; Gill, J.E., Ed.; Special Publication 2; Royal Society of Canada: Ottawa, ON, Canada, 1957; pp. 124–131. [Google Scholar] [CrossRef]
- Caty, J.L. Région du lac Mistassini, Québec: Stratigraphie et Sédimentologie de la Formation de Papaskwasati; DVP 423; Ministère de l’Énergie et des Ressources: Québec, QC, Canada, 1976; p. 270.
- Vézina, C.; Tremblay, A.; Leclerc, F.; Daoudene, Y. Analyse Structurale de la Zone de Cisaillement de la Rivière France et de ses Minéralisations Aurifères, Région de Chibougamau; MB 2015-04; Ministère de l’Énergie et des Ressources Naturelles: Québec, QC, Canada, 2015; p. 40.
- EL Amrani, M. Géologie des Dépôts de Surface au Nord-est de la Baie Abatagouche; Québec RP2018-03; Ministère de l’Énergie et des Ressources Naturelles: Québec, QC, Canada, 2018; p. 14. Available online: https://gq.mines.gouv.qc.ca/documents/examine/RP201806/RP201806RAP001.pdf (accessed on 9 October 2024).
- EL Amrani, M. Géologie des Dépôts de Surface au Sud-est de la Baie Abatagouche; Québec RP2018-02; Ministère de l’Énergie et des Ressources Naturelles: Québec, QC, Canada, 2018; p. 14. Available online: https://gq.mines.gouv.qc.ca/documents/examine/RP201802/RP201802RAP002.pdf (accessed on 9 October 2024).
- EL Amrani, M. Géologie des Dépôts de Surface au sud du lac Mistassini; Québec RP2018-01; Ministère de l’Énergie et des Ressources Naturelles: Québec, QC, Canada, 2018; p. 17.
- Thériault, R.; Beauséjour, S. Carte géologique du Québec; DV2012-06; Ministère de L’Énergie et des Ressources Naturelles: Québec, QC, Canada, 2012; p. 8.
- Laverdière, C.; Guimont, P.; Dionne, J. Les formes et les marques de l’érosion glaciaire du plancher rocheux: Signification, terminologie, illustration. Palaeogeogr. Palaeoclimatol. Palaeoecol. 1985, 51, 365–387. [Google Scholar] [CrossRef]
- Wintges, T. Studies on crescentic fractures and crescentic gouges with the help of close-range photogrammetry. J. Glaciol. 1985, 31, 340–349. [Google Scholar] [CrossRef]
- Clark, C. Mega-scale glacial lineations and cross-cutting ice-flow landforms. Earth Surf. Process. Landf. 1993, 18, 1–29. [Google Scholar] [CrossRef]
- Mckenzie, M.A.; Simkins, L.M.; Principato, S.M.; Garcia, S.M. Streamlined subglacial bedform sensitivity to bed characteristics across the deglaciated Northern Hemisphere. Earth Surf. Process. Landf. 2022, 47, 2341–2356. [Google Scholar] [CrossRef]
- Boulton, G. The origin of glacially fluted surfaces-observations and theory. J. Glaciol. 1976, 17, 287–309. [Google Scholar] [CrossRef]
- Millar, S.W. Fabric variability associated with periglacial mass-wasting at Eagle Summit, Alaska. Geomorphology 2012, 72, 222–237. [Google Scholar] [CrossRef]
- Santos, J.; Cunha, L. Till fabric analysis and origin of Portage Glacier Little Ice Age moraines, south-central Alaska. Polar Geogr. 2012, 35, 65–81. [Google Scholar] [CrossRef]
- Andrews, J. Techniques of till fabric analysis. Tech. Bull. Br. Geomorphol. Res. Group 1971, 6, 43. [Google Scholar]
- Benn, D. Fabric shape and the interpretation of sedimentary data. J. Sediment. Res. 1994, 64, 910–915. [Google Scholar]
- Bouchard, M.A.; Martineau, G. Southeastward ice flow in central Québec and its paleogeographic significance. Can. J. Earth Sci. 1985, 22, 1536–1541. [Google Scholar] [CrossRef]
- Daubois, V.; Lamarche, O. Géologie des Dépôts de Surface de la Région des Monts Otish, d’Eeyou Istchee Baie-James, Québec; BQ2020-01; Ministère de l’Énergie et des Ressources Naturelles: Québec, QC, Canada, 2020. Available online: https://gq.mines.gouv.qc.ca/bulletins-quaternaires/bq-otish/ (accessed on 9 October 2024).
- Prichonnet, G.; Martineau, G.; Bisson, L. Les dépôts quaternaires de la région de Chibougamau, Québec, Québec. Géographie Phys. Et Quat. 1984, 38, 287–304. [Google Scholar] [CrossRef]
- Bisson, L. Géologie des Dépôts Quaternaires du Canton de Scott, Chibougamau-Québec. Avec Applications à la Prospection Minérale. Master’s Thesis, Université du Québec à Montréal, Montreal, QC, Canada, 1987; p. 182. [Google Scholar]
- Levasseur, D.; Prichonnet, G. La dispersion clastique des débris rocheux dans les eskers et le till adjacent de la région de Chapais-Chibougamau (Québec) au Wisconsinien supérieur. Can. J. Earth Sci. 1995, 32, 590–602. [Google Scholar] [CrossRef]
- Paradis, S.J.; Boisvert, E. Séquence des écoulements glaciaires dans le secteur de Chibougamau-Némiscau, Québec. Curr. Res. Geol. Surv. Can. Ott. Pap. 1995, 1995-C, 259–264. [Google Scholar]
- El Amrani, M. Géologie des Dépôts de Surface dans la Partie SE de la Région de la Rivière Mistassini (SNRC 32H01, 32H02, 32H07 et 32H08); RP2019-03; Ministère de l’Énergie et des Ressources Naturelles: Québec, QC, Canada, 2019; p. 17.
- Martineau, G.; Bouchard, M.A.; Prichonnet, G. Southeastward ice flow in central Quebec and its implication for the location of the Laurentide Ice Sheet dispersal centers. Geol. Ass. Can. Program. Abstr. 1984, 9, 87. [Google Scholar]
- El Amrani, M.; Amine, A.; Courba, S.; Ousaid, L.; Diani, K.; Hahou, Y.; Boudad, L.; Mdiker, N. Integrating DEM and field data to unravel the impact of bedrock topography on Late Quaternary ice flows: A case study of the Lake Mistassini area, Canada. J. Earth Syst. Sci. 2024, 133, 40. [Google Scholar] [CrossRef]
- Dionne, J.C. Blocs de dolomie à stromatolites sur les rives de l’estuaire du Saint-Laurent, Québec. Géographie Phys. Et Quat. 1986, 40, 93–98. [Google Scholar] [CrossRef][Green Version]
- Dionne, J.C. Erratiques de dolomie au cap Colombier, sur la haute Côte-Nord du Saint-Laurent estuarien. Géographie Phys. Et Quat. 2001, 58, 101–107. [Google Scholar] [CrossRef]
- Dionne, J.C.; Bernatchez, P. Les erratiques de dolomie sur le rivage des Escoumins, Côte-Nord de l’estuaire maritime du Saint-Laurent, Québec. Atl. Geol. 2000, 36, 117–129. [Google Scholar] [CrossRef] [PubMed]
- El Amrani, M.; Gélinas, T.K.; Carré, A. Occurrence, significance and origin of banded iron formation erratics south of lake Mistassini, Quebec, Canada. Quaternaire 2018, 29, 169–176. [Google Scholar] [CrossRef]
- Veillette, J.J.; Pomares, J.S. Older ice flows in the Matagarni-Chapais area, Quebec. Curr. Res. Part C. Commission Géologique du Canada, Ottawa, Canada. Pap. 1991, 91, 143–148. [Google Scholar]
- Daubois, V.; Dubé-Loubert, H. Géologie des Dépôts de Surface de la Région de Clova, Haute-Mauricie; RP2018-03; Ministère de l’Énergie et des Ressources Naturelles: Québec, QC, Canada, 2018; p. 28.
- Veillette, J.J.; Dyke, A.S.; Roy, M. Ice-flow evolution of the Labrador Sector of the Laurentide Ice Sheet: A review, with new evidence from northern Quebec. Quat. Sci. Rev. 1999, 18, 993–1019. [Google Scholar] [CrossRef]
- Dyke, A.S.; Prest, V.K. Late Wisconsinan and Holocene history of the Laurentide Ice Sheet. Géographie Phys. Et Quat. 1987, 41, 237–263. [Google Scholar] [CrossRef]
- Prichonnet, G. Quelques données nouvelles sur les dépôts quaternaires du Wisconsinien et de l’Holocène dans le piedmont appalachien, Granby, Québec. Comm. Géologique Can. Rech. Cours 1982, 82, 225–238. [Google Scholar]
- Hart, J.K. Subglacial erosion, deposition and deformation associated with deformable beds. Prog. Phys. Geogr. 1995, 19, 173–191. [Google Scholar] [CrossRef]
- Smith, M.J.; Knight, J. Palaeoglaciology of the last Irish Ice Sheet reconstructed from striae evidence. Quat. Sci. Rev. 2011, 30, 147–160. [Google Scholar] [CrossRef]
- Kleman, J. On the use of glacial striae for reconstruction of paleo-Ice Sheet flow patterns. Geogr. Ann. Ser. A Phys. Geogr. 1990, 72, 217–236. [Google Scholar] [CrossRef]
- Catto, N.R. Comparative study of striations and basal till clast fabrics, Malpeque-Bedequeregion, Prince Edward Island, Canada. Boreas 1998, 27, 259–274. [Google Scholar] [CrossRef]
- Schiefer, E.; Klinkenberg, B. The distribution and morphometry of lakes and reservoirs in British Columbia: A provincial inventory. Can. Geogr. 2004, 48, 345–355. [Google Scholar] [CrossRef]
- Occhietti, S.; Parent, M.; Lajeunesse, P.; Robert, F.; Govare, E. Chapter 47—Late Pleistocene-Early Holocene decay of the Laurentide Ice Sheet in Québec-Labrador. In Developments in Quaternary Sciences; Ehlers, J., Gibbard, P.L., Hughes, P.D., Eds.; Quaternary Glaciations—Extent and Chronology; Elsevier: Amsterdam, The Netherlands, 2011; pp. 601–630. [Google Scholar] [CrossRef]
- Veillette, J.J.; Roy, M.; Paulen, R.C.; Menard, M.; St-Jacques, G. Uncovering the hidden part of a large ice stream of the Laurentide Ice Sheet, northern Ontario. Can. Quat. Sci. Rev. 2017, 155, 136–158. [Google Scholar] [CrossRef]
- Klassen, R.A.; Thompson, F.J. Glacial History, Drift Composition, and Mineral Exploration, Central Labrador. Bulletin 0068-7626-435; Geological Survey of Canada: Ottawa, ON, Canada, 1993; p. 76.
- McMartin, I.; Henderson, P.J. Evidence from Keewatin (Central Nunavut) for Paleo-Ice Divide Migration. Géographie Phys. Et Quat. 2004, 58, 163–186. [Google Scholar] [CrossRef]
- Rice, J.M.; Ross, M.; Paulen, R.C.; Kelley, S.E.; Briner, J.P.; Neudorf, C.M.; Lian, O.B. Refining the ice flow chronology and subglacial dynamics across the migrating Labrador Divide of the Laurentide Ice Sheet with age constraints on deglaciation. J. Quat. Sci. 2019, 34, 519–535. [Google Scholar] [CrossRef]
- Clark, C.D.; Hughes, A.L.C.; Greenwood, S.L.; Jordan, C.; Sejrup, H.P. Pattern and timing of retreat of the last British-Irish Ice Sheet. Quat. Sci. Rev. 2012, 44, 112–146. [Google Scholar] [CrossRef]
- Davies, B.J.; Livingstone, S.J.; Roberts, D.H.; Evans, D.J.A.; Gheorghiu, D.M.; ÓCofaigh, C. Dynamic ice stream retreat in the central sector of the last British-Irish Ice Sheet. Quat. Sci. Rev. 2019, 225, 105989. [Google Scholar] [CrossRef]


Disclaimer/Publisher’s Note: The statements, opinions and data contained in all publications are solely those of the individual author(s) and contributor(s) and not of MDPI and/or the editor(s). MDPI and/or the editor(s) disclaim responsibility for any injury to people or property resulting from any ideas, methods, instructions or products referred to in the content. |
© 2024 by the authors. Licensee MDPI, Basel, Switzerland. This article is an open access article distributed under the terms and conditions of the Creative Commons Attribution (CC BY) license (https://creativecommons.org/licenses/by/4.0/).