Article

Tailoring Wavelength-Selective Diffraction Efficiency Using Triple-Layer Double-Relief Blazed Gratings Incorporating Materials with Intersecting Dispersion Curves

1
Department SciTec, University of Applied Sciences Jena, Carl-Zeiss-Promenade 2, 07745 Jena, Germany
2
Institute of Nanostructure Technologies and Analytics, Technological Electronics Department, University of Kassel, Heinrich-Plett-Straße 40, 34132 Kassel, Germany
3
Fraunhofer Institute for Applied Optics and Precision Engineering, Albert-Einstein-Straße 7, 07745 Jena, Germany
*
Author to whom correspondence should be addressed.
Photonics 2023, 10(10), 1116; https://doi.org/10.3390/photonics10101116
Submission received: 13 September 2023 / Revised: 29 September 2023 / Accepted: 30 September 2023 / Published: 3 October 2023

Abstract

:
Diffractive optical elements (DOEs) fundamentally provide the possibility to simultaneously utilize multiple orders for different imaging functions within a system. However, to take advantage of this property, it is necessary to tailor the assignment of specific wavelengths or wavelength ranges with high diffraction efficiency to specific diffraction orders. To achieve this wavelength-selective assignment to different orders, simple diffractive profile shapes are not suitable; instead, multilayer DOEs are required. In this study, we conducted theoretical, scalar investigations on the diffraction efficiency of triple-layer double-relief DOEs for the purpose of tailored wavelength selectivity. Specific materials such as nanocomposites, layer materials, and high-refractive-index liquids with strong dispersion were included, in addition to inorganic glasses, to enable wide design freedom for wavelength selectivity across multiple orders. To simultaneously account for both positive and negative orders, specific material combinations featuring intersecting or touching dispersion curves were utilized. For various material combinations, we calculated significantly different efficiency profiles for multiple orders by varying the relief depths. Further, we discuss the possibility of fine-tuning the efficiency profiles by using high-index liquids as an intermediate layer between two solid profiles, whose dispersion properties can be varied continuously or at least in small steps.

1. Introduction

Imaging diffractive optical elements (DOEs) in combination with refractive optics simultaneously enable the correction of chromatic aberrations and a reduction of the size of the optical system [1,2,3]. To ensure the high imaging quality of these hybrid systems, a high diffraction efficiency across the extended polychromatic wavelength range has to be guaranteed for the selected diffraction order. This can be achieved by multilayer DOEs (MLDOEs), which consist of multiple superimposed sawtooth structures made from materials with different dispersion characteristics.
Recently, extensive research into MLDOEs has focused on high broadband efficiencies for the selected diffraction order and also on high angular efficiency tolerances. In addition to the visible wavelength range, the mid-infrared has also been addressed [4,5,6]. Furthermore, mathematical models and optimization methods for material selection and grating depth have been introduced [7,8,9,10], and the scalar versus rigorously calculated diffraction efficiencies of the optimized MLDOEs have been compared [11,12,13]. All previous studies on MLDOEs were aimed exclusively at chromatic aberration correction for these hybrid systems and focusing on maximum efficiency over a wide range of wavelengths and angles for a single diffraction order.
However, DOEs offer further advantages for imaging systems, such as wavelength selectivity, where achieving high diffraction efficiency over a wide bandwidth for a single diffraction order is not enough. Especially for wavelength selectivity, a tailored efficiency distribution in different specific diffraction orders for selected wavelengths or wavelength ranges is required. For example, a DOE of an imaging system may provide high diffraction efficiency at a particular order for a first wavelength range, while achieving high diffraction efficiency at a different order for a different wavelength range. Especially when distinct wavelength ranges are assigned to the 0th and a higher order, the wavelength selectivity enables a partial decoupling in the lens design and an almost independent correction for the two wavelengths. This approach is used, for example, in ultraviolet microscopy with an autofocus in the near-infrared range [14,15] or in an optical data storage pick-up system that allows simultaneous imaging at the 1st diffraction order at 650 nm and the 0th order at 405 nm [16].
To date, investigations on the wavelength-selective adjustment of the diffraction efficiency to different diffraction orders have been limited to double-layer single-relief blazed gratings [17]. In the present work, we extended the design freedom for wavelength- and order-dependent adjustment of diffraction efficiency by using triple-layer double-relief DOEs (TLDOEs) comprising three different materials and two relief depths. In order to attribute the diffraction efficiency to very different diffraction orders, especially also to assign to positive and negative orders, we focused on special materials, such as optical liquids with a high refractive index, nanocomposites, and layered materials with strong dispersion. A special characteristic of the TLDOEs is the intersecting dispersion curves of the materials involved.
This paper starts by motivating the need to investigate TLDOEs for the purpose of wavelength selectivity by presenting wavelength-selective application concepts of TLDOEs in detail in Section 2. Subsequently, the basic mathematical and simulation tools used to calculate the diffraction efficiency of triple-layer double-relief blazed gratings are summarized in Section 3. This is followed by the main part in Section 4, in which the calculated results of the wavelength- and order-dependent diffraction efficiency, as well as for different angles of incidence are presented for various material combinations. By engineering the relief depths of the TLDOE, highly variable efficiency profiles can be generated within a material combination, such as narrow or broadband efficiency curves or a minimum diffraction efficiency surrounded by two maxima ranging from the visible wavelength range to the near-infrared range. In addition, we demonstrate the ability to fine-tune the design wavelengths for maximum efficiency and the spectral half-width (HW) of the efficiency curve for different diffraction orders by selecting a specific high-refractive-index liquid in the second layer sandwiched between two fixed materials and adjusting the relief depths in Section 5.

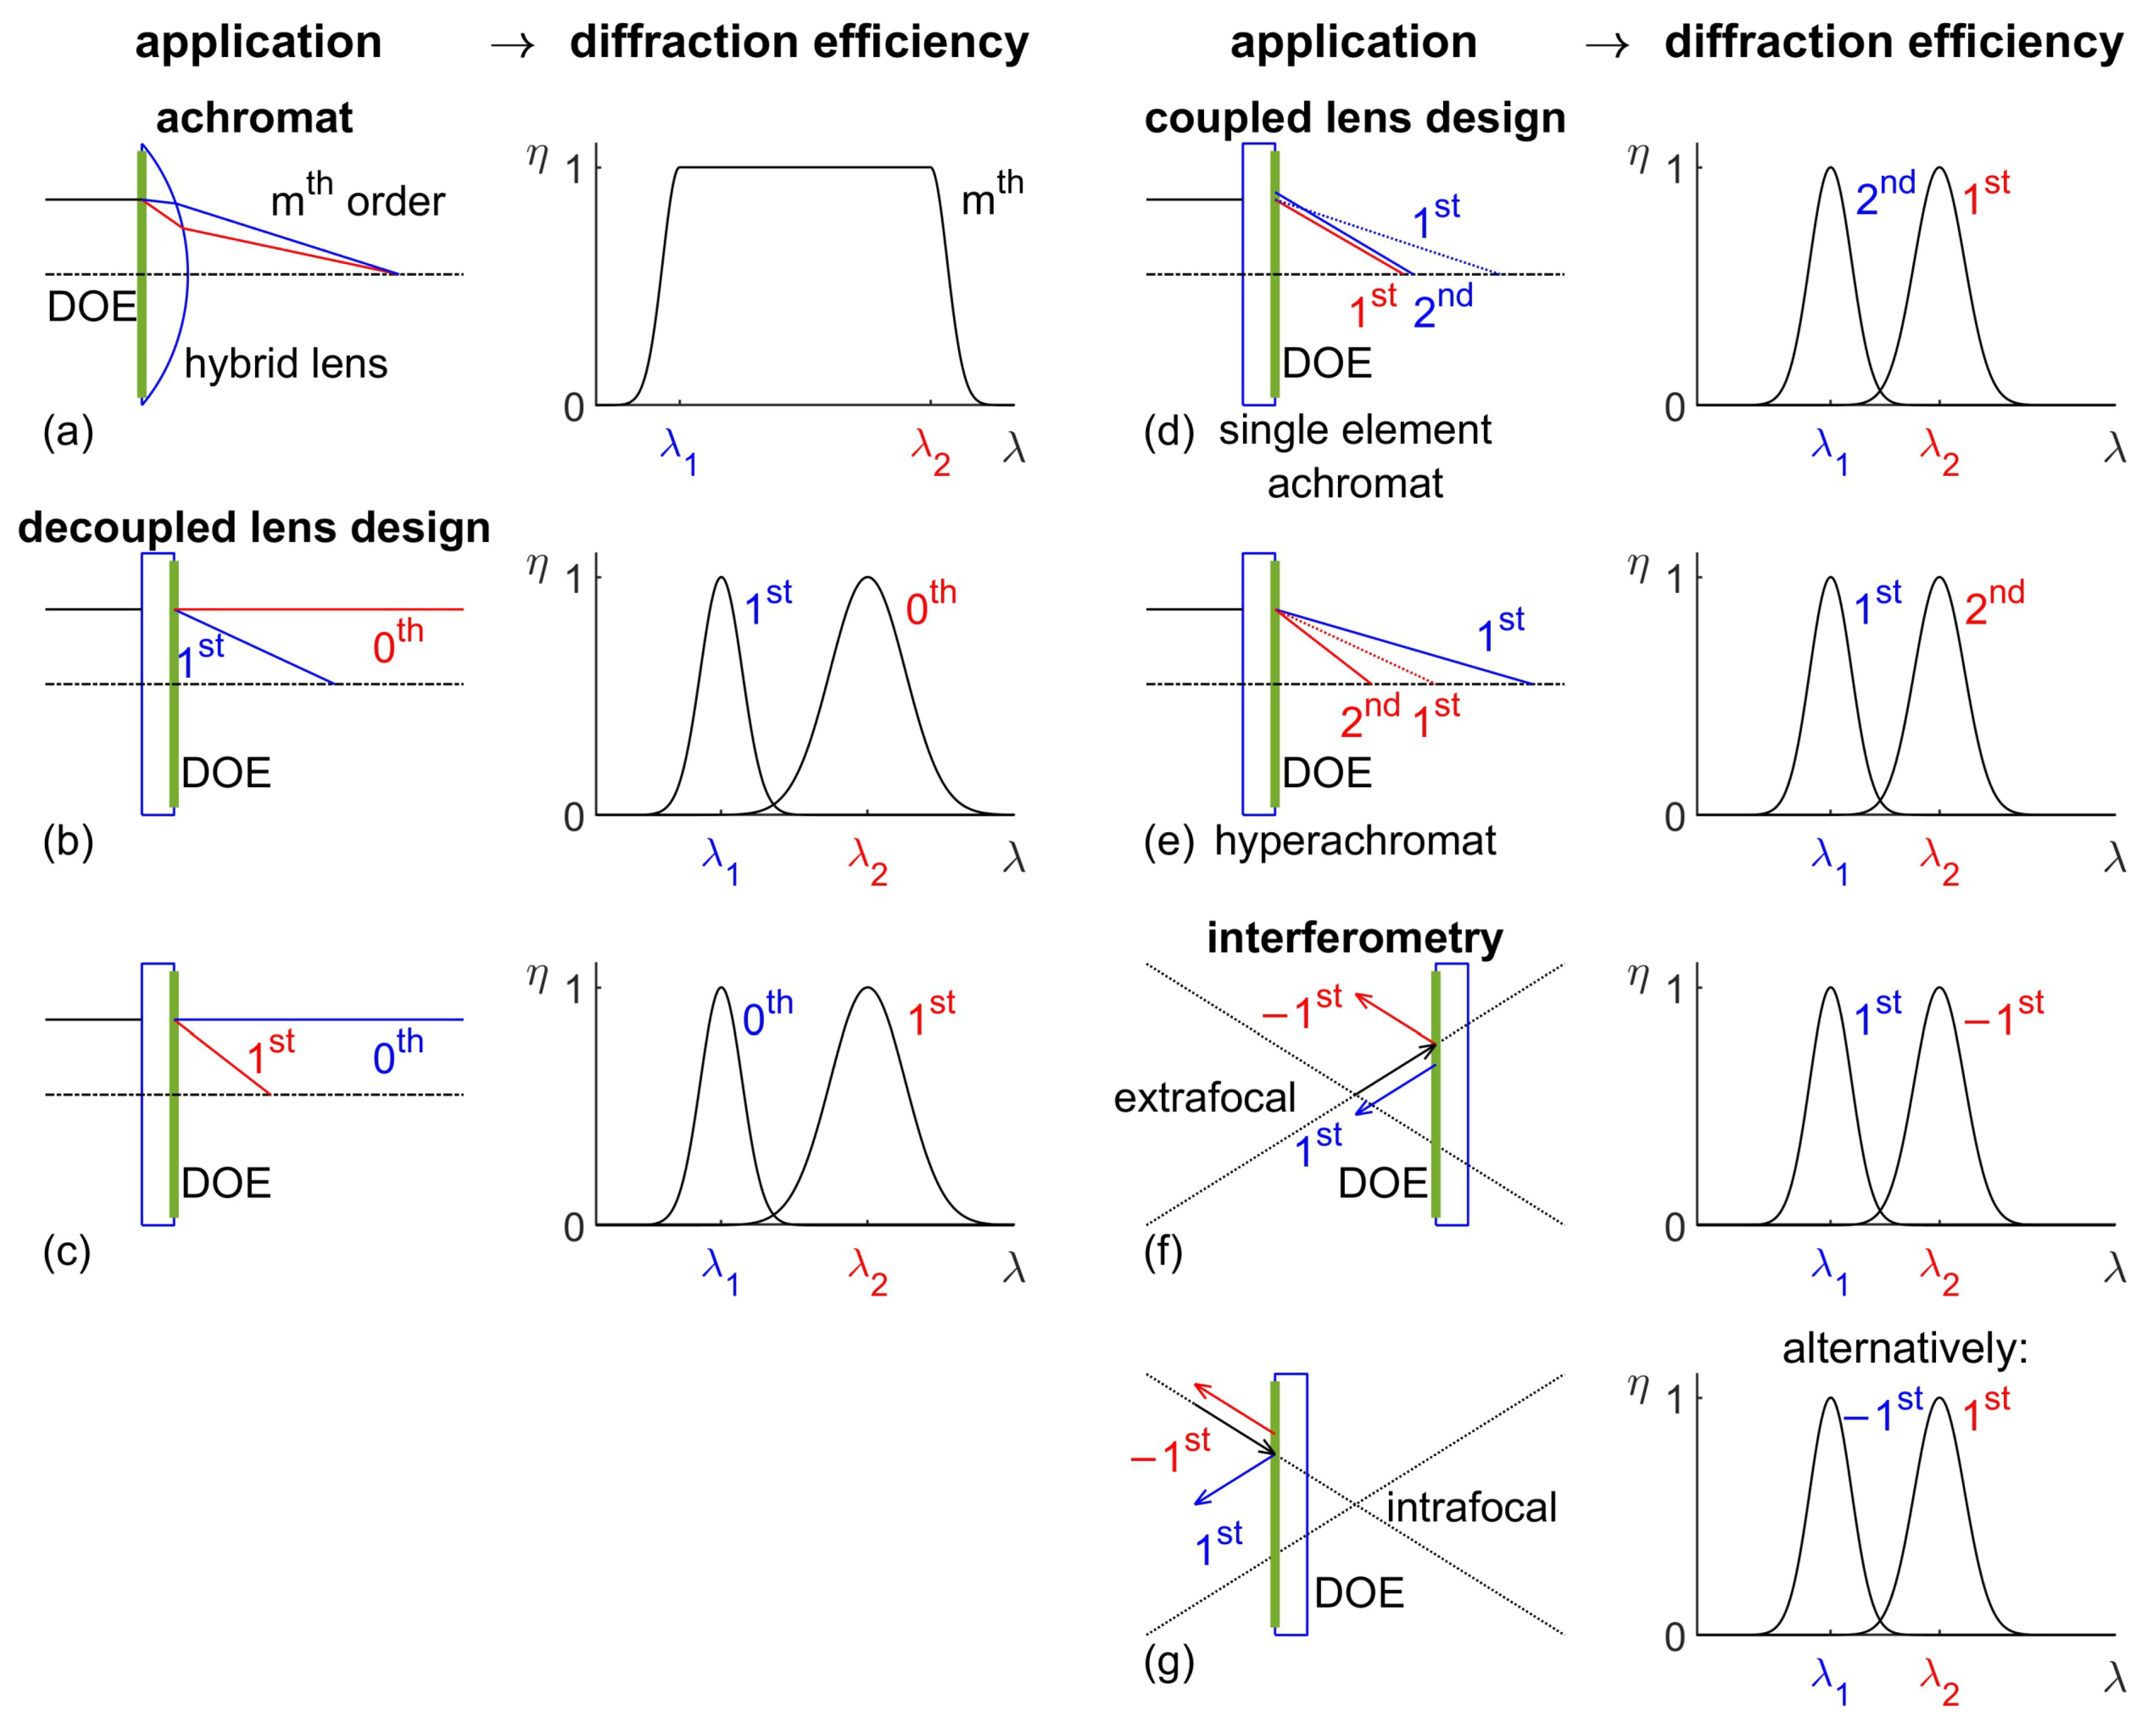
2. Basic Application Concepts for Wavelength-Selective DOEs

Before introducing the mathematical approaches to simulate the TLDOEs and the properties of the materials involved, the application concepts of the wavelength selectivity of DOEs are discussed. In principle, diffractive lenses that distribute high diffraction efficiency wavelength-selectively, e.g., between the 0th, 1st, 2nd, and −1st order, allow different focal positions, resulting in either positive, negative, or no optical power. In addition to the examples already mentioned in the Introduction, these properties of wavelength selectivity offer advantages for further possible applications.
Figure 1 schematically shows a selection of achievable optical properties and their applicability with the corresponding efficiency curves for the different wavelength bands and orders. The position of the diffractive structure is highlighted in green in Figure 1a–g. For comparison, Figure 1a shows the well-established hybrid approach of combining a refractive lens and a DOE to form an achromat with the same focus for different wavelengths (demonstrated here for red and blue). The DOE is used in a single specific order over the entire wavelength range, whereby a high diffraction efficiency is required in the selected order for all wavelengths.
Figure 1b,c show examples of wavelength selectivity, where a particular spectral region is assigned to the 0th order and a second separate region to a higher order, e.g., the 1st order. The assignment of the short or long wavelength range to the 0th or 1st order can be selected. Specifically using the 0th order for a spectral range has the advantage that this range is not affected by the grating structure of the DOE. Rather, the DOE diffracts only the wavelength range that correlates with the higher order. Thus, only the optical design of this wavelength range is controlled by the phase or period distribution of the DOE; the 0th order spectral range is unaffected. In particular, both wavelength ranges can independently be manipulated by the DOE. As already mentioned, deep-ultraviolet microscopy (248 nm) combined with an autofocus system at 785 nm [14,15] and optical data storage systems for dual use of DVD and Blu-ray [16] are examples of this beneficial approach.
If two different higher orders are addressed instead of the 0th order, the period distribution of the DOE affects both orders simultaneously, and it is no longer possible to decouple the optical design for the two wavelength ranges. This case is shown in Figure 1d,e. Here, the two possibilities are that the smaller diffraction order offers high efficiency for either the shorter or the longer wavelengths. The combination of shorter wavelengths and higher diffraction order (e.g., 2nd order) and a longer wavelength range with 1st order means that the product of the diffraction order and wavelength remains constant, resulting in the same diffraction angles. This means that, for such a single imaging DOE, an achromatic effect can be achieved for at least two wavelengths. Conversely, if shorter wavelengths and 1st order, as well as longer wavelength range with higher order are combined, a strong spreading of the focal positions occurs, which can be interpreted as a hyperchromatic effect [18,19].
DOEs used in, both, positive and negative 1st order are applied in the interferometric testing of aspherical optical surfaces, where they are used in series as the intrafocal and extrafocal reference [20]. The DOEs used for this purpose so far are binary structures with a symmetrical profile cross-section and equal diffraction efficiency for both ±1st orders, which is below 50%. The concept of wavelength selectivity also offers the possibility of selectively addressing the positive or negative 1st order with high efficiency by using two different wavelengths (see Figure 1f,g).

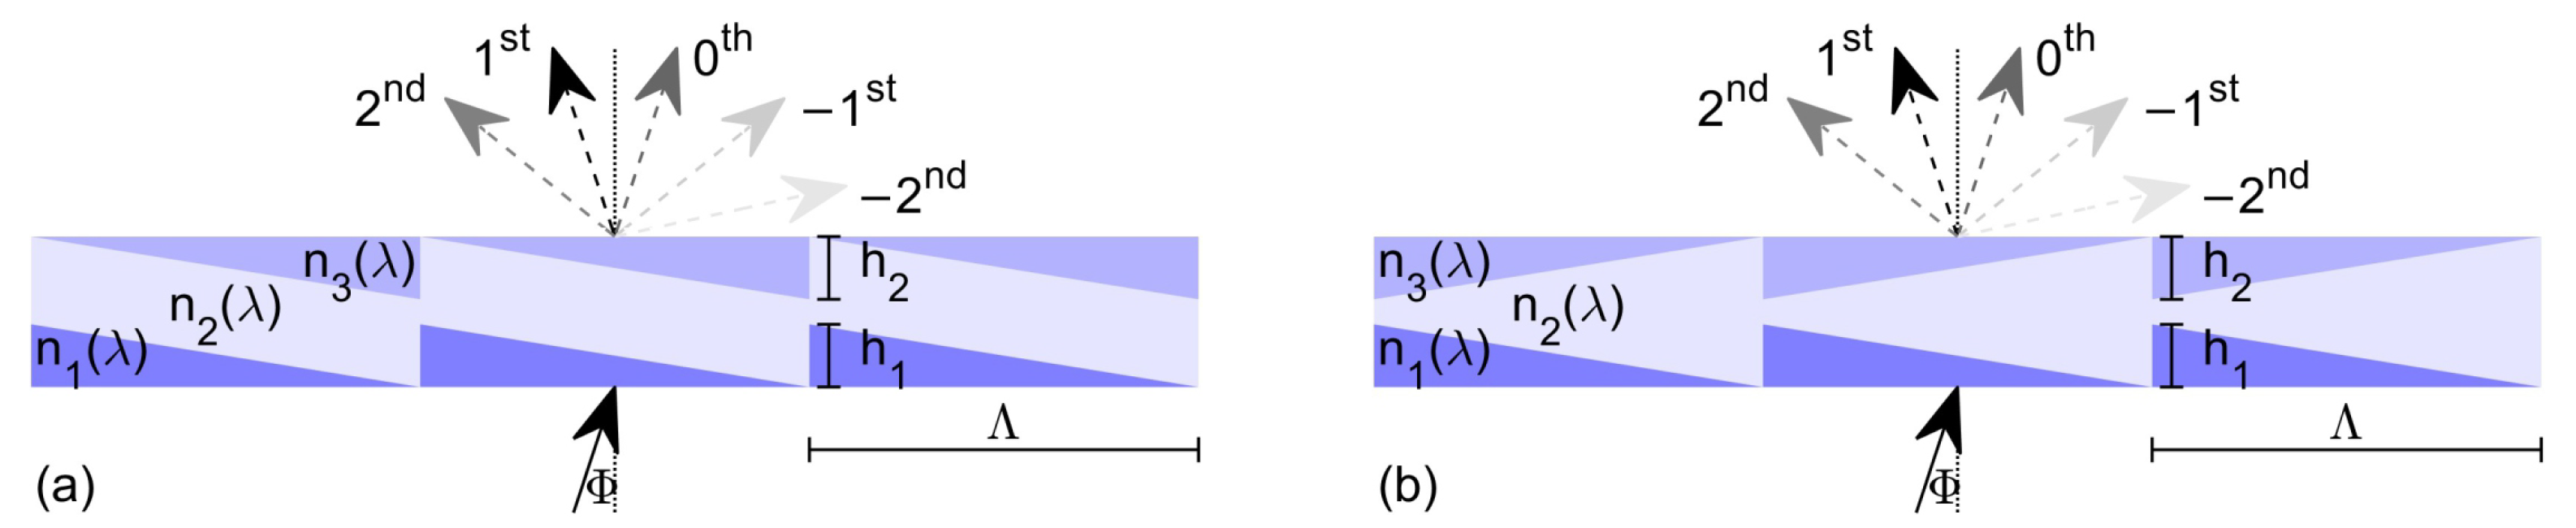
3. Fundamentals of the Diffraction Behavior of TLDOEs

For large grating periods in the range of multiples of the working wavelength and a large grating-period-to-relief-depth ratio, the diffraction efficiency of blazed gratings can be described with sufficient accuracy using scalar diffraction theory [21]. Accordingly, the diffraction efficiency η m ( λ ) in the far field, depending on the wavelength λ and the diffraction order m, can be calculated as follows [4,22]:
η m ( λ ) = sinc 2 Γ ( λ ) λ m
Here, Γ ( λ ) denotes the maximum spectral optical path difference within one grating period Λ . The approach to calculate the diffraction efficiency can be extended to TLDOEs, considering two different configurations (see Figure 2). In both configurations, the light incident from below passes through the first layer of the DOE, which has a material dispersion n 1 ( λ ) , and enters the intermediate layer with the material dispersion n 2 ( λ ) . This layer transition shows a sawtooth profile with a relief height of h 1 . Subsequently, the light enters the third layer with material dispersion n 3 ( λ ) . The transition from the intermediate layer to the third layer also shows a blazed profile with a depth of relief of h 2 .
As shown in Figure 2a,b, the two configurations differ in the relative orientation of the blazed structures of both reliefs. In the type 1 structure, the slopes of the two blazed facets are oriented identically; in type 2, their relative orientation is inverted. Due to the periodic TLDOE structure, light of different diffraction orders and wavelengths is deflected into different diffraction angles as determined by the grating equation. Depending on the dispersion properties of the materials involved, the efficiency of these diffraction orders varies for different wavelengths or wavelength ranges according to Equation (1). For type 1, the total optical path difference Γ ( λ ) is obtained by the sum of the optical path differences Γ 1 ( λ ) and Γ 2 ( λ ) of the first and second reliefs, i.e., Γ ( λ ) = Γ 1 ( λ ) + Γ 2 ( λ ) . Conversely, for type 2, the total optical path difference results from the difference of the two contributions with Γ ( λ ) = Γ 1 ( λ ) Γ 2 ( λ ) . With the relief heights, material dispersions, and angles of incidence Φ, the optical path differences Γ 1 ( λ ) and Γ 2 ( λ ) of the first and second reliefs can be determined, so that the total path difference Γ 1 ( λ ) can be calculated (see [4]):
Γ ( λ ) = Γ 1 ( λ ) ± Γ 2 ( λ ) = h 1 n 1 ( λ ) c o s ( Φ ) n 2 ( λ ) 2 n 1 ( λ ) 2 s i n 2 ( Φ ) ± h 2 n 2 ( λ ) 2 n 1 ( λ ) 2 s i n 2 ( Φ ) n 3 ( λ ) 2 n 1 ( λ ) 2 s i n 2 ( Φ )

4. Selected Material Combinations for Varying the Efficiency of TLDOEs

To achieve a high variability in efficiency behavior across different wavelength ranges and diffraction orders, combinations of materials were investigated, exhibiting very different dispersion properties in some cases. Combinations of conventional and special optical materials were selected, including inorganic glasses, nanocomposites, high-index liquids, layer materials, and optical crystals. Materials with low Abbe numbers and combinations of materials with intersecting dispersion curves were of particular interest. The dispersion data for all solids were taken from [23] and the data for high-index liquids from the commercial supplier [24]. Figure 3 shows an Abbe diagram in which the selected materials are represented as colored symbols and positioned depending on the refractive index n d and their Abbe number υ d related to the wavelength λ d = 589 nm. For reference, typical inorganic glasses are also included, symbolized by small blue dots. The red and orange dashed lines with the additional cross symbols represent nanocomposites consisting of a polymer matrix filled with varying volume fractions of nanometer-sized particles [22]. In particular, we assumed nanocomposites with a polystyrene (PS) or polymethyl methacrylate (PMMA) matrix filled with indium tin oxide (ITO) particles. Finally, the green and blue dashed lines with the crosses and the small bars as symbols represent two series of high-index liquids (Series B and M of [24]). As a quantitative measure for the dispersion of the materials, the refractive index n d and the Abbe number υ d related to the wavelength λ d = 589 nm are summarized in Table 1.
In the following sections, the efficiency behavior of the TLDOEs is examined in detail for different material combinations, and the results are presented in a summary figure with the same structure in each case. The spectral transmission range of each combination was derived from the upper short-wave and lower long-wave limits of the respective materials. In part (a) of each figure, the dispersion curves n 1 ( λ ) , n 2 ( λ ) , and n 3 ( λ ) of the three materials are shown. All efficiency graphs in parts (b) and (c) of each figure were calculated using the scalar Equation (2). In part (b) of the figure, the efficiency for perpendicular incidence is shown as a function of the relief depth h 2 and the wavelength λ for different relief depths h 1 (columns) and diffraction orders m (rows). Part (c) of the figure provides examples of the chromatic diffraction efficiencies η ( λ ) of different orders at various angles of incidence Φ and selected relief depths h 1 and h 2 . The efficiency was calculated for incidence angles up to 30° in scalar form, as the scalar diffraction theory, according to [11], is valid up to angles around 25° depending on the number of periods and layers. The ranges of relief depths and the specific relief depths were selected to provide interesting spectral efficiency profiles in the various diffraction orders for the particular combination of materials. The efficiency profiles at specific relief depths were further characterized by their HW, cut-on wavelength, or cut-off wavelength, representing the wavelength regions where efficiencies exceed 50% and wavelengths at which efficiencies reach 50%, respectively, and by the changes of these features with a varying incidence angle. All calculations and graphical representations of diffraction efficiency were performed using the Matlab software [25].

4.1. PS-ITO/N-PSK53/PMMA-ITO TLDOE Type 1 Orientation

The first material combination investigated to form a TLDOE involves the inorganic glass N-PSK53 and two nanocomposites. The nanocomposites are based on different polymer matrices (PS and PMMA) with a volume percentage of 65 and are filled with a volume fraction of 35% of ITO nanoparticles exhibiting a diameter smaller than one hundredth of the wavelength [22]. The type 1 orientation (parallel blazed facets) was chosen for this combination. This TLDOE is transparent in the wavelength range from 0.4 µm to 1 µm. Characteristic for this combination is the intersection of one flat dispersion curve with two curves showing high dispersion (see Figure 4a). The steepness of the dispersion curves of the nanocomposites is mainly caused by the ITO nanoparticles, while the different polymer matrices are responsible for the axial shift of the curves. For the following discussion, we define Δ n i , j ( λ ) as the difference of the associated refractive indices ( Δ n i , j ( λ ) = n i ( λ ) n j ( λ ) ; i , j = 1 , 2 , 3 ). At wavelengths of 0.943 µm and 0.671 µm, where the dispersion curves of the materials of the two relief transitions intersect, the sign of the refractive index difference changes. At the first transition, Δ n 1 , 2 ( λ ) changes from positive to negative with increasing wavelength; at the second transition, the opposite sign change occurs for Δ n 2 , 3 ( λ ) .
The efficiency diagrams in Figure 4b illustrate the potential for different efficiency distributions across diffraction orders and wavelengths by tuning the relief heights. For instance, at relief depths of h 1 = 5 µm and h 2 = 25 µm (indicated by (1) in Figure 4c), the efficiencies can be distributed among different narrow bands in the 0th, 1st, and −1st orders with HWs of about (0.07–0.22) µm. The decoupled 0th and 1st order or the 1st and −1st order can be used to create a decoupled lens design (c) or to provide an extrafocal and intrafocal reference in interferometry((f) and (g)), as shown in Figure 1 in Section 2. Comparing the efficiency profiles at angles of incidence of 0° and 30°, the design wavelengths and HWs of the 0th, 1st, and −1st order show changes of less than 40 nm. By adjusting h 2 while keeping h 1 constant, the wavelength ranges of the efficiency maxima can be shifted closer together or further apart.
With relief depths of h 1 = 10 µm and h 2 = 16 µm, the total optical path difference between the two reliefs relative to the wavelengths remains constant ((2) in Figure 4c). This configuration allows for achromatization of the 1st order across the entire transmission range, which can be used to correct chromatic aberrations in conjunction with refractive lenses, as described in application example (a) in Section 2. Increasing the incidence angle to 30°, the efficiency slightly decreases from 1 to 0.945 and 0.905 at the edges of the transmission range.
For relief depths of h 1 = 15 µm and h 2 = 16 µm ((3) in Figure 4c), the efficiency profile exhibits a 1st order high-pass behavior with high efficiency in the upper wavelength range with a cut-on wavelength of approximately 0.6 µm and a narrowband 2nd order efficiency maximum at lower wavelengths with an HW of about 0.17 µm. When the incidence angle is changed from 0° to 30°, the cut-off wavelength for the 1st order shifts by 94 nm and the design wavelength for the 2nd order shifts from 0.5 µm to 0.56 µm.
The TLDOE composition presented here was considered purely theoretically; possible manufacturing processes were not regarded. It should be noted that the inorganic glass could possibly be replaced by a suitable polymer, which would simplify the fabrication.

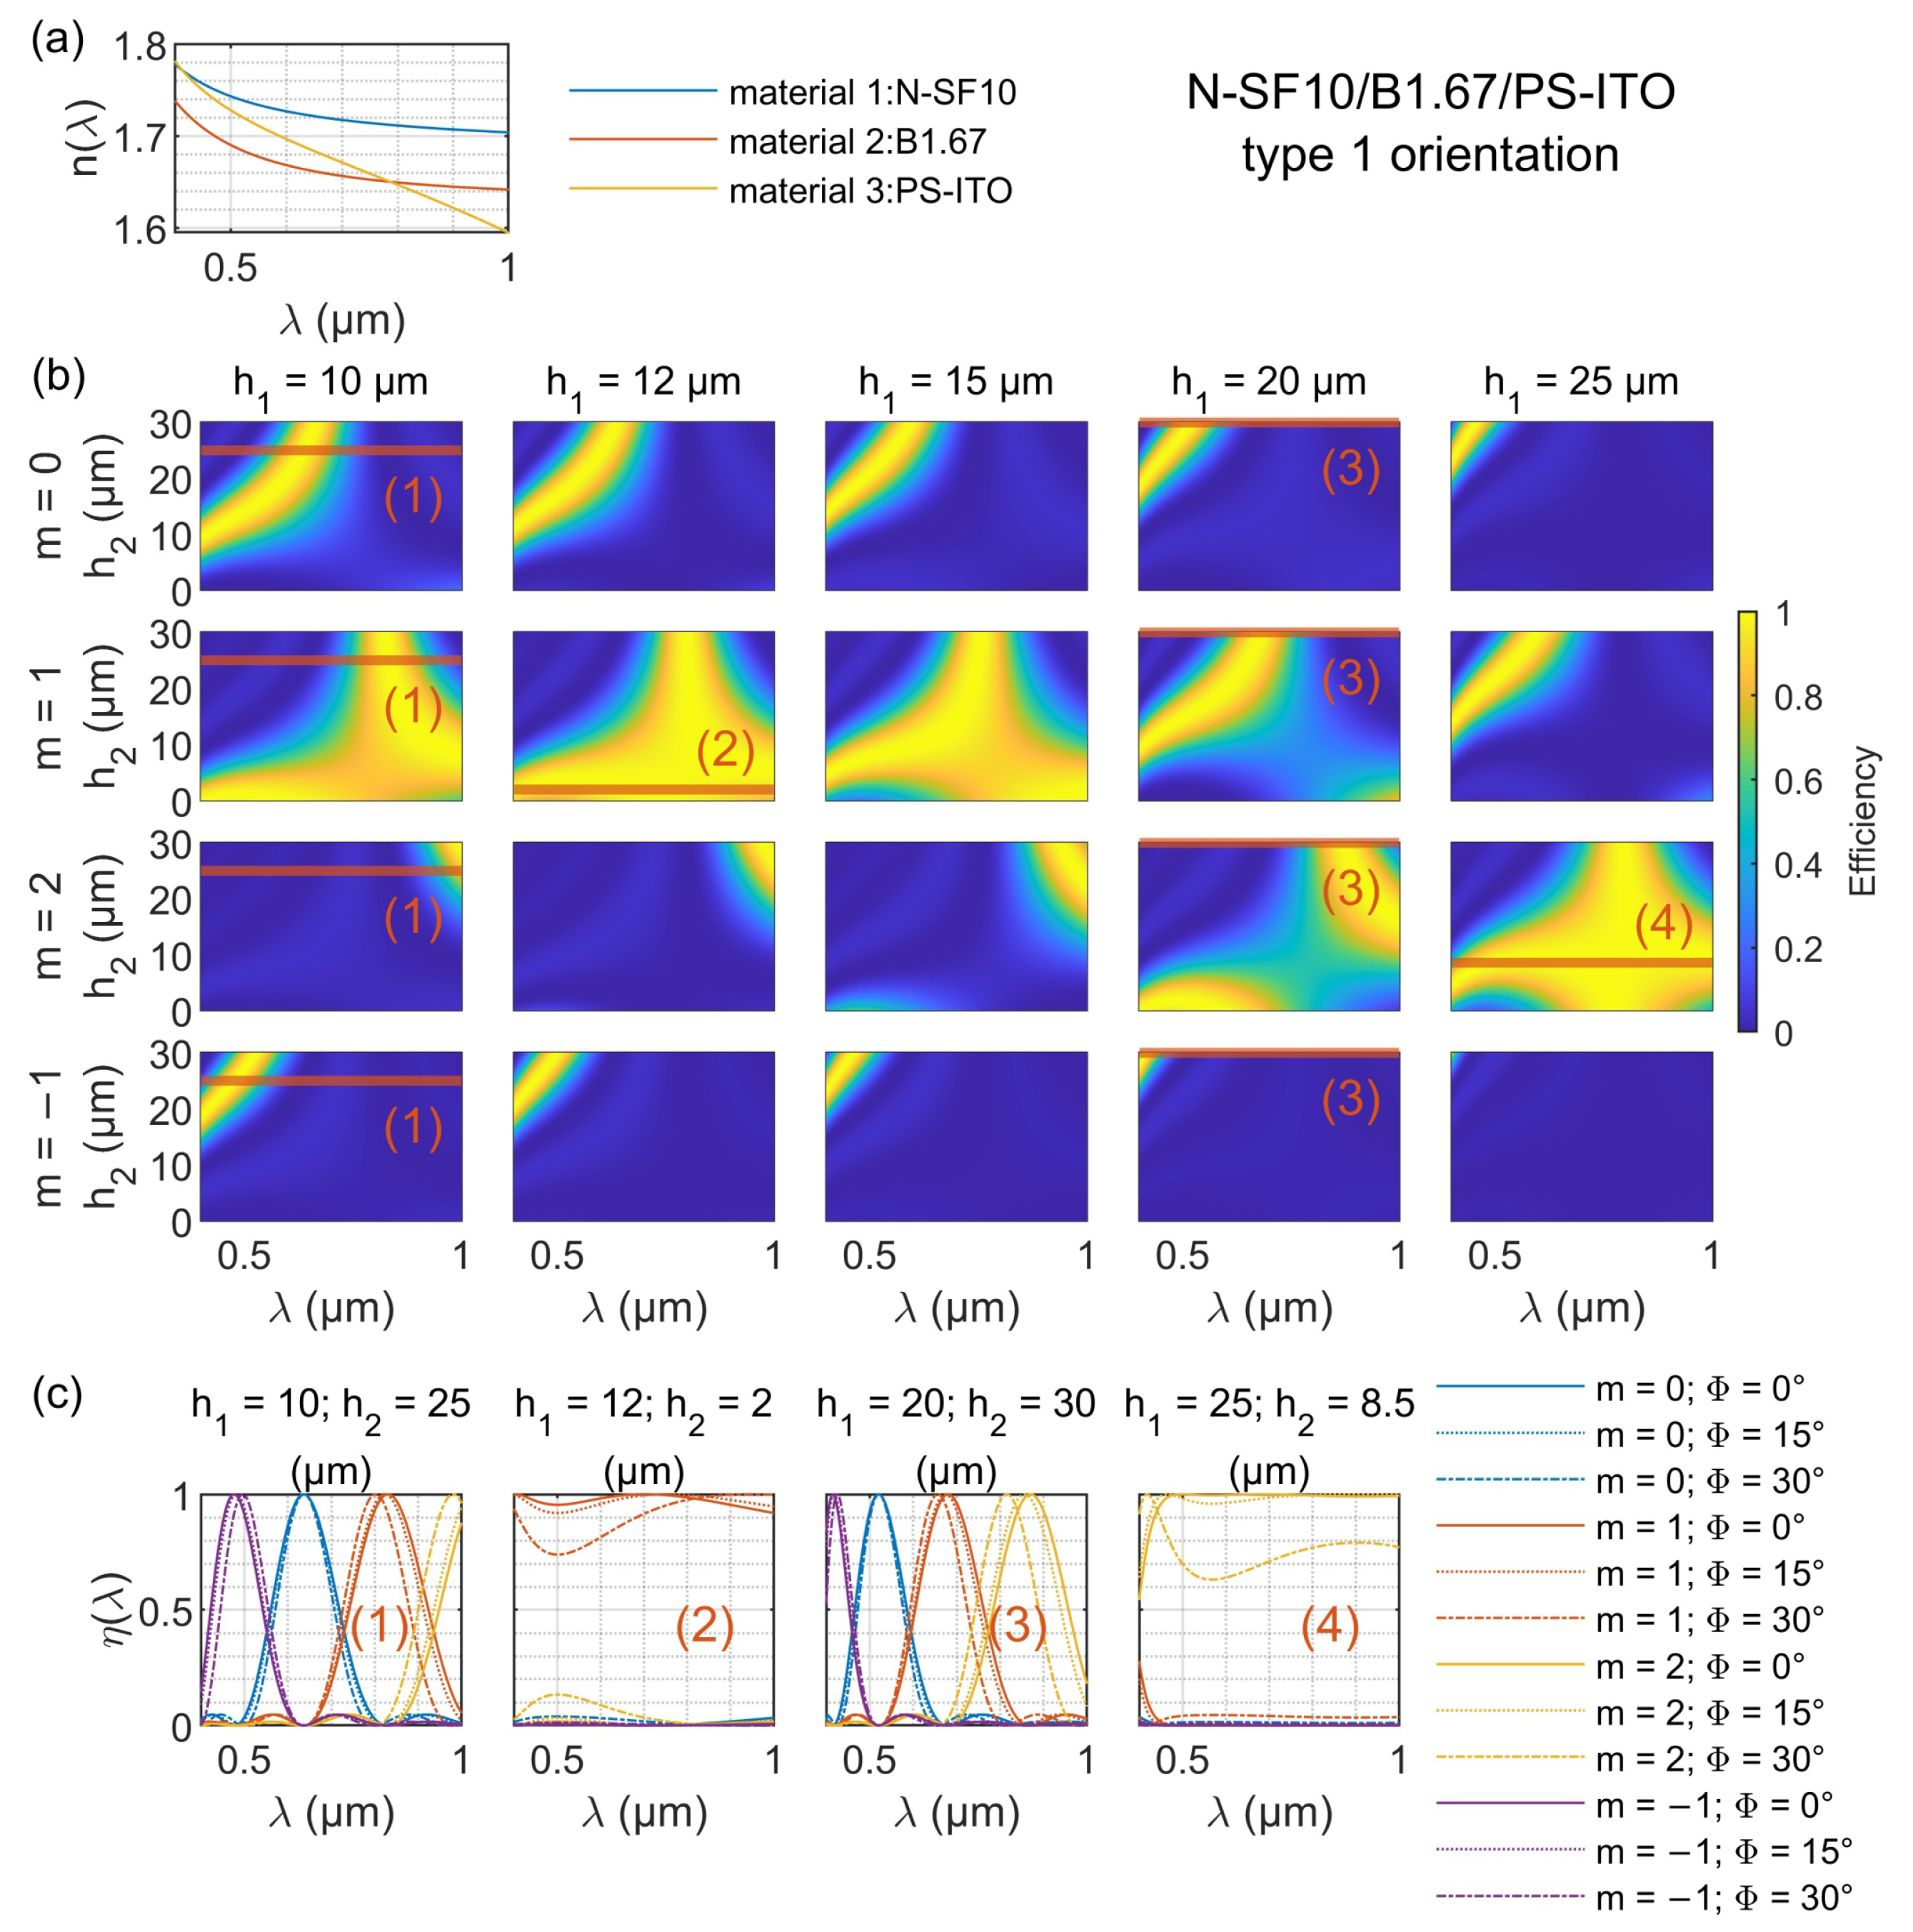
4.2. N-SF10/B1.67/PS-ITO TLDOE Type 1 Orientation

The second TLDOE structure investigated combines the inorganic glass N-SF10, the high-refractive-index liquid B1.67, and a nanocomposite comprising a PS matrix mixed with 35% of ITO. In contrast to the previous structure, this TLDOE is characterized by two separate low-dispersion curves that are intersected by a steep dispersion curve. The relief blazed structures are arranged in a type 1 configuration, with spectral transmittance ranging from 0.4 µm to 1 µm. Due to the nearly equivalent, but shifted dispersion curves, the refractive index difference Δ n 1 , 2 ( λ ) of the first relief remains nearly constant with increasing wavelength (see Figure 5a). The dispersion curves of the second relief intersect at a wavelength of 0.786 µm, where the refractive index difference Δ n 2 , 3 ( λ ) changes from a negative to a positive sign.
For example, at relief depths of h 1 = 10 µm and h 2 = 25 µm ((1) in Figure 5c) and relief depths h 1 = 20 µm and h 2 = 30 µm ((3) in Figure 5c), the efficiency can be distributed over several narrowband wavelength ranges of the 0th, 1st, 2nd, and −1st order with HWs of around 0.15 µm. These efficiency distributions can be used for a decoupled lens design (c), as a hyperchromat (e), or in interferometry ((f) and (g)) according to the application concepts presented in Figure 1 in Section 2. Changing the angle of incidence from 0° to 30° shifts the design wavelengths and HWs for the different orders by no more than 55 nm. It is noteworthy that the design wavelength of the 2nd order is larger than that of the 1st order. This feature results in non-overlapping focal regions for both diffraction orders when the TLDOE is used as a diffractive lens. With a slight increase in h 2 and constant h 1 , the wavelength ranges of the efficiency maxima approach each other, similar to the previous TLDOE in Section 4.1 ((1) in Figure 4c).
By setting relief depths of h 1 = 12 µm and h 2 = 2 µm or h 1 = 25 µm and h 2 = 8.5 µm, diffraction achromatization for the 1st and 2nd order can be achieved over the entire transmission range ((2) and (4) in Figure 5c), enabling a correction of chromatic aberration according to application example (a) in Section 2. With a small change in the angle of incidence by 15°, the efficiency changes only minimally. However, at an angle of 30°, a significant drop in efficiency occurs.
Practically, this combination may be fabricated by initially manufacturing the outer DOEs of glass and nanocomposite through diamond turning or precision pressing. These DOEs are then positioned in relation to each other, and the space between them is filled with the high-refractive-index liquid. If necessary, a protective coating could be applied to the nanocomposite DOE to prevent any chemical reactions with the liquid.

4.3. Al2O3/N-SF10/CsBr TLDOE Type 2 Orientation

The next TLDOE structure investigated combines the materials Al2O3, CsBr and the inorganic glass N-SF10, with transparency covering the wavelength range from 0.38 µm to 2.5 µm. In this case, the sawtooth structures are type 2 oriented, with oppositely inclined blazed facets. Consequently, the optical path differences associated with the two reliefs must be subtracted for the calculation of the efficiency (see Equation (2)), so that the maximum efficiency can be achieved at the −1st order. The dispersion curves of the materials forming the lower and upper layers are significantly separated across the entire transparency range (see Figure 6a). It is interesting to note that the dispersion curve of the intermediate layer touches the dispersion curve of the material of the first layer at the short wavelength limit and the dispersion curve of the material of the third layer at the long wavelength limit.
Choosing relief depths of h 1 = 8 µm and h 2 = 20 µm ((1) in Figure 6c), maximum efficiency is achieved in the −1st order across a narrow band at short wavelengths with an HW of approximately 0.13 µm, while longer wavelengths (>0.6 µm) remain in the 0th order, unaffected by diffraction. Consequently, the 0th order acts as a high-pass filter. Increasing the angle of incidence from 0° to 30° leads to changes in the design wavelength and HW of the −1st order as well as the 0th order cut-on wavelength between 10 nm and about 30 nm.
At the relief depths of h 1 = 24 µm and h 2 = 12 µm ((2) in Figure 6c), the maximum 1st order efficiency occurs in a broader wavelength range with an HW of about 1.5 µm, accompanied by narrowband maxima of the −1st and 0th orders with HWs of around 0.03 µm. At an angle of incidence of 15°, the 1st-order cut-off wavelength shifts by about 85 nm, while the minimum 1st-order efficiency decreases by 3%.
Two separate efficiency maxima enclose a 1st-order minimum for the case of using relief depths of h 1 = 32 µm and h 2 = 3 µm ((3) in Figure 6c). The contributions of the wavelength range of this 1st-order minimum appear in a broad 2nd-order maximum with an HW of about 0.5 µm. Additionally, narrow band maxima appear in the 1st and 0th orders within the short wavelength region with HWs of approximately 0.03 µm. At an angle of incidence of 15°, the efficiency distribution changes with a maximum shift of about 65 nm.
For relief depths of h 1 = 40 µm and h 2 = 2 µm ((4) in Figure 6c), two maxima are formed for both the 1st and 2nd order, each separated by an intermediate minimum. The efficiency contribution of the wavelength range of the 1st- and 2nd-order minimum would be observed in the 3rd order. When changing the angle of incidence from 0° to 15°, similar alterations occur in the efficiency distribution, as seen in Example (3).

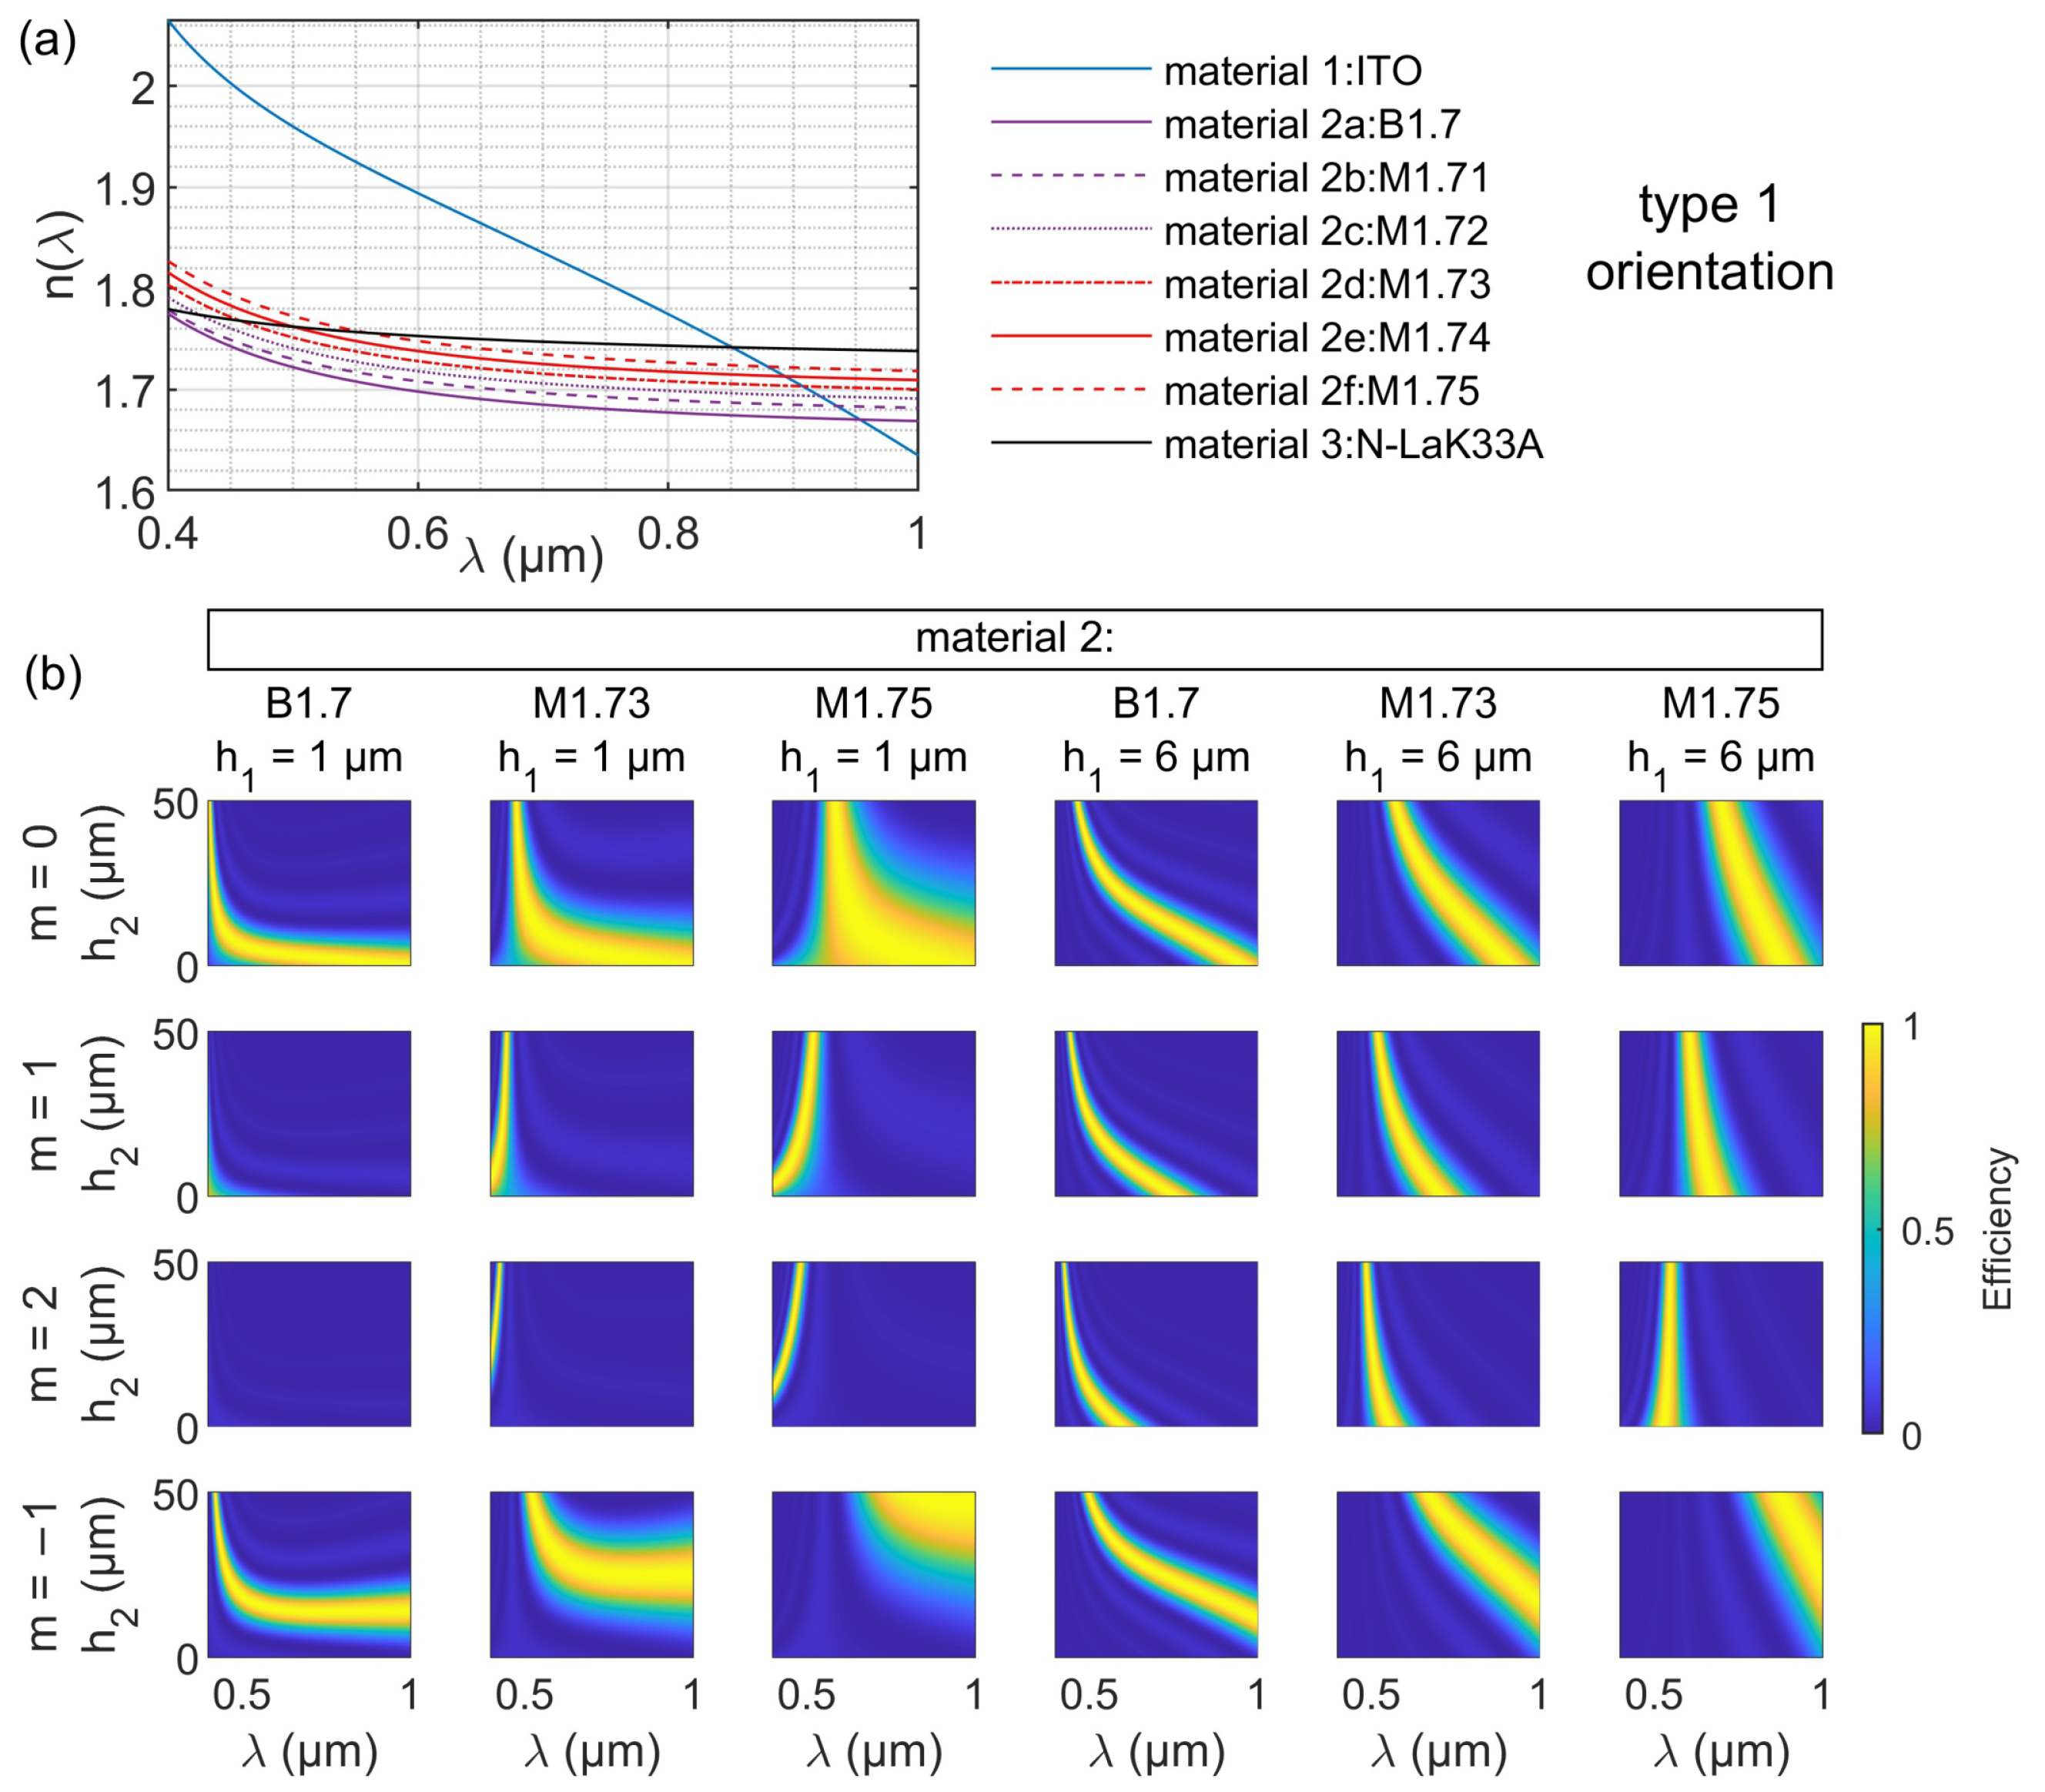
4.4. ITO/N-LaK33A/M1.75 TLDOE Type 1 Orientation

In the following section, the efficiency characteristics of a combination of ITO, the inorganic glass N-LaK33A, and the high-index liquid M1.75 in the type 1 configuration are investigated. The spectral transmission range covers 0.406 µm to 1 µm. In this case, the optical paths of the reliefs are added according to type 1, resulting in a specific efficiency profile. The first material (ITO) has a very steep dispersion curve, while the second and third materials have similar, comparably lower dispersion curves that intersect at 0.558 µm, as shown in Figure 7a. The dispersion curves of the materials ITO and N-LaK33A of the first relief intersect at a wavelength of 0.851 µm. The multiform structure of the efficiency dependence on the relief heights, which can be observed especially at shallow depths of the first relief, is particularly noteworthy in this combination.
At relief depths of h 1 = 1 µm and h 2 = 50 µm ((1) in Figure 7c), a broad maximum in the upper wavelength range (>0.6 µm) is observed in the 1st order, together with narrow maxima of the −1st and 0th orders with HWs of (0.03–0.06) µm. For example, this configuration allows for the correction of chromatic aberration in the upper wavelength range with the 1st order according to application concept (a) in Figure 1 in Section 2. An increase in the angle of incidence to 30° has only a minor effect on the efficiency characteristics of the −1st and 0th order. In contrast, the minimum efficiency of the 1st-order maximum shows a stronger change and decreases from 0.958 to 0.809.
Relief depths of h 1 = 3 µm and h 2 = 18 µm ((2) in Figure 7c) lead to the formation of two 0th-order maxima enclosing a 1st-order maximum with an HW of about 0.3 µm, which can be used for a decoupled lens design according to application examples (b) and (c) in Figure 1 in Section 2. As the angle of incidence increases to 30°, the design wavelength and HW of the 1st order changes by about 50 nm, while the maximum efficiency increases from 0.95 to 1.
The efficiency is distributed among the 0th, 1st, and 2nd orders within narrow band wavelength ranges with HWs of approximately 0.2 µm for relief depths of h 1 = 6 µm and h 2 = 20 µm ((3) in Figure 7c). Notably, the 2nd order acts as a low-pass filter. When comparing the angles of incidence of 30° and 0°, there are changes between approximately 10 nm and 50 nm in the design wavelengths, cut-off wavelengths, and HWs of the different orders. The minimum efficiency of the second order decreases to 0.651.
For relief depths of h 1 = 40 µm and h 2 = 10 µm ((4) in Figure 7c), as well as deeper structures for the first relief h 1 , the high efficiency in the narrowband wavelength ranges with HWs of about 0.03 µm is divided into the 2nd, 1st, 0th, and −1st orders. When comparing angles of incidence of 0° and 30°, the designed wavelengths and HWs of the orders change less than 6 nm. This configuration offers a variety of applications such as creating a decoupled lens design (b), a single-element achromat (d), or providing a reference in interferometry ((f) and (g)), as described in Section 2.
The fabrication of such a TLDOE structure is likely to be challenging. However, it should be noted that the high-index liquid forming the final relief can eventually be sealed by covering with a flat glass plate that does not exert any diffractive influence.

4.5. M1.73/N-LaK34/PS-ITO TLDOE Type 1 Orientation

The last material combination from this series with versatile efficiency behavior presented here includes the highly refractive liquid M1.73, the inorganic glass N-LaK34, and the nanocomposite consisting of a PS matrix in combination with 35% ITO. This combination is transparent in the wavelength range of (0.406–1) µm. The grating’s blazed structures are oriented according to type 1. Especially at short wavelengths, the high-index liquid reveals a higher dispersion than the inorganic glass (see Figure 8a). Both dispersion curves intersect at 0.6 µm. The ITO nanocomposite shows the highest dispersion of all three materials and intersects the dispersion curve of the intermediate layer at 0.469 nm.
At relief depths of h 1 = 6 µm and h 2 = 40 µm ((1) in Figure 8c), the efficiency is distributed among the −1st, 0th, 1st, and 2nd orders within narrow wavelength regions with HWs of around 0.05 µm usable for the creation of a decoupled lens design (c), a hyperchromat (e), or for interferometric applications ((f) and (g)), as discussed in Section 2. The comparison of the efficiencies at angles of incidence of 0° and 30° shows changes in the design wavelengths and HWs of the 0th, 1st, 2nd, and −1st orders of less than about 30 nm.
Achieving achromatization of the diffraction efficiency in the lower wavelength range in the 1st order, resulting in a low-pass filter characteristic with a cut-off wavelength of about 0.8 µm and high efficiency at longer wavelengths in the 2nd order, is possible at relief depths of h 1 = 18 µm and h 2 = 18 µm ((2) in Figure 8c). At an incidence angle of 15°, the cut-off wavelength of the 1st order and the cut-on wavelength of the 2nd order are shifted by 18 nm and 24 nm, respectively. The efficiency within the 1st order increases from 0.924 to 0.95.
When considering relief depths of h 1 = 24 µm and h 2 = 3 µm ((3) in Figure 8c), narrow maxima of the 1st and 2nd order are observed at shorter wavelengths with HWs of about 0.05 µm, while all longer wavelengths (>0.5 µm) show a maximum efficiency in the 0th order, allowing a decoupled lens design of the 0th and 1st order according to application example (b) in Section 2. Note that, in the examples marked with (1) and (3), exactly the opposite behavior can be observed for the 1st and 2nd orders: In the example marked with (1), the 2nd order maximum occurs at longer wavelengths than that of the 1st order, while conversely, in example (3), the maximum of the 1st-order efficiency is observed at longer wavelengths. Increasing the angle of incidence from 0° to 30° results in only a small change of about 10 nm in the design wavelengths and HWs of the different orders.
For relief depths h 1 = 30 µm and h 2 = 20 µm ((4) in Figure 8c), two 2nd-order maxima are formed enclosing a 1st-order maximum with an HW of about 0.35 µm. This configuration can be applied as a single-element achromat (d) or hyperchromat (e), as shown in Figure 1 in Section 2. Increasing the angle of incidence to 15° causes a shift of the two design wavelengths of the 2nd-order maxima by about 6 nm and 18 nm, respectively. The efficiency of the 1st order decreases from 0.993 to 0.976.

5. Adaptation of the Wavelength Selectivity of a TLDOE Structure by Variation of an Intermediate Liquid Layer

An alternative approach to achieving wavelength- and order-dependent selectivity in designing diffraction efficiency involves employing materials with dispersion properties that can be finely tuned in a controlled manner. Inorganic glasses or established coating materials generally have firmly defined dispersion properties such as a fixed Abbe number or a fixed relative partial dispersion; a defined setting is not possible or only possible to a very limited extent. Such a flexible adjustment of the dispersion properties would, in principle, be allowed by using nanocomposites [22]. However, it was pointed out in [22] that, to ensure high optical quality, very small and homogeneously distributed nanoparticles are required; in particular, aggregation must be prevented. Because of the difficulty in achieving this, we chose high-index liquids as an alternative, whose wavelength-dependent refractive index can be adjusted by the ratio of the components (e.g., composed of 1-bromonaphthalene and 1-iodonaphthalene).
For demonstration purposes, we chose the combination of ITO and the glass N-LaK33A as the lower and upper cover layers and a high-index liquid such as B1.7 or one from the M1.71-1.75 series in between. For the orientation of the blazed angles, we exemplarily selected the type 1 orientation and the transmittance ranges from 0.4 µm to 1 µm. The dispersion curves of the materials are shown in Figure 9a. In addition to the steep dispersion curve of ITO and the flat curve of the inorganic glass, the curves representing the dispersion of various liquids in the series exhibit slight vertical shifts relative to one another. All dispersion curves of the liquids are very close to the curve of the inorganic glass, but all have a higher dispersion (lower Abbe number) and all intersect the curve of the inorganic glass at different wavelengths.
In general, with TLDOEs made of these materials, very different wavelength-dependent efficiency characteristics can be obtained, as shown in Figure 9b for two selected heights h 1 and for the 0th, 1st, 2nd, and −1st orders. An interesting effect is seen at small relief depths h 1 ( h 1 = 1 µm; first three columns in Figure 9b), where efficiency achromatization in the −1st order is achieved over a larger wavelength range (bottom row). Here, by varying the intermediate layer liquid, a shift in the cut-on wavelength (lower limit of achromatization), as well as a shift in the optimum height of the second relief structure can be seen. Furthermore, at small h 1 , no efficiency maxima are observed for liquids with a small refractive index in the 1st and 2nd orders; at a larger refractive index, maxima occur in both of these orders. With a slightly larger height h 1 (6 µm; columns 4–6 in Figure 9b), it is also observable that the spectral position of the efficiency maximum in the different orders is affected by the refractive index of the intermediate layer and can, therefore, be altered by changing the liquid.
To investigate the behavior of the efficiency with variations of the refractive index of the liquids and the relief depths h 1 and h 2 , an example with specific target parameters was analyzed. In particular, a −1st-order maximum efficiency was targeted at the design wavelength λ 0 of 0.6 µm. To achieve this, a linear relationship between the profile heights h 1 and h 2 must be fulfilled, which depends primarily on the refractive index of the liquid (at λ 0 ). Figure 10 illustrates graphs depicting the design wavelengths λ 0 , meaning the wavelengths of maximum efficiency (dark red graphs) and their corresponding HWs (blue graphs) as a function of the profile depth h 1 , which result for the 0th, 1st, 2nd, and −1st orders. The three diagrams represent the results for the liquids B1.7, M1.73, and M1.75. The subtitles of the individual diagrams indicate the specific material combination of the TLDOE, as well as the linear equations that describe the relationship between h 1 and h 2 . First, the behavior of the HWs and the wavelengths of maximum efficiency λ 0 are considered for the different orders in the TLDOE combination that includes B1.7 (Figure 10a). As already mentioned, the occurrence of a broadband −1st order at small depths is particularly characteristic here (efficiency achromatization). The kink at the left edge of the HW curve of the −1st order can be attributed to the limited transparency range, which cuts off the range of maximum efficiency. All other diffraction orders show a much smaller HW. For all orders, it can be seen that the HW decreases with increasing relief depth. It also shows that, for all other orders, the design wavelengths λ 0 are smaller than 0.6 µm of the −1st order. With increasing relief depth, the HWs of the different orders approach each other and the design wavelength of maximum efficiency converges towards 0.6 µm. As the refractive index of the liquids (M1.73 and M1.75) increases, it can be observed that the HWs of the different orders generally decrease (Figure 10b,c). The wavelengths of maximum efficiency λ 0 of the different orders converge towards 0.6 µm, the design wavelength λ 0 of the 1st order. Although the HWs and target wavelength for maximum efficiency λ 0 are not completely independent, this simulation demonstrated the high flexibility in controlling the wavelength-selective efficiency of TLDOEs by choosing special high-refractive-index liquids as an intermediate layer.

6. Discussion

The calculations for the scalar diffraction efficiency of the presented TLDOEs made from specific material combinations showcased the diversity of diffraction efficiency distributions achievable through material selection and relief depth tuning. The scope of this paper was to provide an insight into the possible functionalities of multi-layer DOEs, especially to demonstrate opportunities for taking advantage of their wavelength-dependent behavior in multi-functional imaging setups. The presented TLDOEs were not assigned to any specific application with defined wavelength ranges or addressed orders, but were chosen to illustrate the wide scope of options. Additional material combinations are to be added in the future. It should be noted that the calculated diffraction efficiencies are valid only for periods that are large compared to the relief depth (period-to-depth ratio > 10 [26]) and wavelength (period-to-wavelength ratio > 4 [27]) and for angles of incidence of up to 25–30° [11]. Rigorous calculations are necessary for smaller periods and larger angles. The feasibility of manufacturing TLDOEs was not taken into account in detail, but it can be assumed that their fabrication is challenging. Nevertheless, depending on the specific materials employed, it should be possible to use well-established fabrication steps such as, for example, grayscale lithography [28], ion beam etching [29], precision glass molding [30], or polymer UV molding [31] to assemble a prototype, whereas the implementation of layer-to-layer-alignment is crucial. For systems using fluids, state-of-the-art manufacturing technologies for microfluidic components [32] can be applied. Future work will include a TLDOE designed for a specific application, its fabrication, as well as the verification of the theoretically calculated diffraction efficiency and the functionality using spectrometric measurements.

7. Conclusions

Wavelength selectivity, the tailored assignment of specific wavelengths and wavelength ranges with high diffraction efficiency to distinct diffraction orders, is a fundamental benefit of using DOEs, which enables the implementation of multiple imaging functions for different diffraction orders within a single system. This functionality is not achievable with classical dioptric or catadioptric systems and represents a significant advantage of diffractive imaging optics. Despite their potential, this property of DOEs has been insufficiently studied so far. In this contribution, our aim was to address existing gaps and demonstrate a multitude of TLDOE-based possibilities that are capable of achieving a broad spectrum of wavelength-selective functionalities. In principle, this opens up new design possibilities for hybrid imaging systems, such as wavelength-dependent imaging at different depths (wavelength-selective tomography), single-element achromats and multi-order hyperchromats, or imaging elements allowing both highly efficient +1st and −1st orders. The primary objective of this study was not to examine the completeness of all potential applicable solutions, but rather to emphasize the wide variety of possibilities, thereby providing a starting point for further specific investigations. In detail, we investigated the wavelength- and order-dependent efficiency of TLDOEs for different material compositions and two blazed facet orientations. In order to achieve a high degree of variability, we specifically incorporated also non-standardized materials. In particular, we selected inorganic glasses, as well as highly dispersive layer materials, nanocomposites, and high-index liquids with strong dispersion. As a distinct feature, we chose materials for the composition of TLDOEs whose dispersion curves intersect or at least touch. This allowed the efficient assignment of both the +1st and −1st diffraction orders to different wavelengths. With a different selection, it is possible to assign the 1st order to a long wavelength and the 2nd order to a short wavelength – an approach that facilitates a single-element achromat. The reverse behavior, 1st order for a short wavelength and, at the same time, 2nd order for a long wavelength, is also possible with a different TLDOE composition, which is required for a hyperchromat. Despite potential manufacturing challenges associated with TLDOEs, they offer novel functionalities for numerous applications ranging from broadband illumination systems to complex imaging systems and even encompass new security features for banknotes or personal documents.

Author Contributions

Conceptualization, L.S. and R.B.; methodology, L.S. and R.B.; software, L.S.; validation, L.S., H.H. and R.B.; formal analysis, L.S. and R.B.; investigation, L.S. and R.B.; writing—original draft preparation, all authors; writing—review and editing, L.S. and R.B.; visualization, L.S.; project administration, L.S. and R.B. All authors have read and agreed to the published version of the manuscript.

Funding

Financial funding by Deutsche Forschungsgemeinschaft (497866273) and the Funding Program Research at University of Applied Sciences Jena is gratefully acknowledged.

Institutional Review Board Statement

Not applicable.

Informed Consent Statement

Not applicable.

Data Availability Statement

Data underlying the results presented in this paper are not publicly available at this time, but may be obtained from the authors upon reasonable request.

Conflicts of Interest

The authors declare no conflict of interest.

Abbreviations

The following abbreviations are used in this manuscript:
DOEdiffractive optical element
HWspectral half-width
ITOindium tin oxide
MLDOEmultilayer diffractive optical element
PMMApolymethyl methacrylate
PSpolystyrene
TLDOEtriple-layer double-relief diffractive optical element

References

  1. Davidson, N.; Friesem, A.A.; Hasman, E. Analytic design of hybrid diffractive-refractive achromats. Appl. Opt. 1993, 32, 4770–4774. [Google Scholar] [CrossRef]
  2. Meyer, M.M. Hybrid Refractive/Diffractive Achromatic Camera Lens. U.S. Patent 5,543,966, 6 August 1996. [Google Scholar]
  3. Evdokimova, V.; Podlipnov, V.; Ivliev, N.; Petrov, M.; Ganchevskaya, S.; Fursov, V.; Yuzifovich, Y.; Stepanenko, S.; Kazanskiy, N.; Nikonorov, A.; et al. Hybrid refractive-diffractive lens with reduced chromatic and geometric aberrations and learned image reconstruction. Sensors 2023, 23, 415. [Google Scholar] [CrossRef]
  4. Zhao, Y.H.; Fan, C.J.; Ying, C.F.; Liu, S.H. The investigation of triple-layer diffraction optical element with wide field of view and high diffraction efficiency. Opt. Commun. 2013, 295, 104–107. [Google Scholar] [CrossRef]
  5. Xie, H.; Ren, D.; Wang, C.; Mao, C.; Yang, L. Design of high-efficiency diffractive optical elements towards ultrafast mid-infrared time-stretched imaging and spectroscopy. J. Mod. Opt. 2018, 65, 255–261. [Google Scholar] [CrossRef]
  6. Yang, H.; Xue, C.; Xiao, J.; Chen, J. Glued diffraction optical elements with broadband and a large field of view. Appl. Opt. 2020, 59, 10217–10223. [Google Scholar] [CrossRef]
  7. Zhang, B.; Cui, Q.; Piaoi, M. Effect of substrate material selection on polychromatic integral diffraction efficiency for multilayer diffractive optics in oblique incident situation. Opt. Commun. 2018, 415, 156–163. [Google Scholar] [CrossRef]
  8. Mao, S.; Zhao, L.; Zhao, J. Integral diffraction efficiency model for multilayer diffractive optical elements with wide angles of incidence in case of polychromatic light. Opt. Express 2019, 27, 21497–21507. [Google Scholar] [CrossRef] [PubMed]
  9. Laborde, V.; Loicq, J.; Hastanin, J.; Habraken, S. Multilayer diffractive optical element material selection method based on transmission, total internal reflection, and thickness. Appl. Opt. 2022, 61, 7415–7423. [Google Scholar] [CrossRef] [PubMed]
  10. Zhang, B.; Song, Y.; Dong, K.; Piao, M.; Wang, J.; Jia, R.; Chang, S.; Jiang, L.; Jiang, H. Substrate material selection model for dual-band multilayer diffractive optical elements with wide angle of incidence. Optik 2022, 255, 168701. [Google Scholar] [CrossRef]
  11. Greisukh, G.I.; Danilov, V.A.; Ezhov, E.G.; Stepanov, S.A.; Usievich, B.A. Spectral and angular dependences of the efficiency of relief-phase diffractive lenses with two- and three-layer microstructures. Opt. Spectrosc. 2015, 118, 964–970. [Google Scholar] [CrossRef]
  12. Greisukh, G.I.; Danilov, V.A.; Ezhov, E.G.; Stepanov, S.A.; Usievich, B.A. Comparism of electromagnetic and scalar methods for evaluation of efficiency of diffractive lenses for wide spectral bandwidth. Opt. Commun. 2015, 338, 54–57. [Google Scholar] [CrossRef]
  13. Greisukh, G.I.; Danilov, V.A.; Stepanov, S.A.; Antonov, A.I.; Usievich, B.A. Spectral and angular dependences of the efficiency of three-layer relief-phase diffraction elements of the IR range. Opt. Spectrosc. 2018, 125, 60–64. [Google Scholar] [CrossRef]
  14. Brunner, R.; Steiner, R.; Dobschal, H.J.; Martin, D.; Burkhardt, M.; Helgert, M. New solutions to realize complex optical systems by a combination of diffractive and refractive optical components. In Lithographic and Micromachining Techniques for Optical Component Fabrication II; SPIE: Bellingham, WA, USA, 2003; Volume 5183, pp. 47–55. [Google Scholar] [CrossRef]
  15. Brunner, R.; Dobschal, H.J. Diffractive Optical Lenses in Imaging Systems—High-Resolution Microscopy and Diffractive Solid Immersion Systems. In Optical Imaging and Microscopy: Techniques and Advanced Systems; Török, P., Kao, F.J., Eds.; Springer: Berlin/Heidelberg, Germany, 2007; pp. 45–70. [Google Scholar] [CrossRef]
  16. Ori, Y.; Takada, K.; Hashimura, J.; Mushiake, N. Diffractive/refractive hybrids for blue LD optical storage. In Frontiers in Optics 2004/Laser Science XXII/Diffractive Optics and Micro-Optics/Optical Fabrication and Testing; Optica Publishing Group: Washington, DC, USA, 2004; paper DTuA1. [Google Scholar] [CrossRef]
  17. Engelhardt, L.; Stumpf, D.; Brunner, R. Tailored chromatic diffraction efficiency of double-layer single-relief blazed gratings. J. Opt. Soc. Am. A 2023, 40, 703–713. [Google Scholar] [CrossRef]
  18. Förster, E.; Stumpf, D.; Werner, L.; Hillmer, H.; Brunner, R. Hyperchromatic lens doublets with an extremely small equivalent Abbe number employing diffractive elements and refractive materials with exceptional dispersion properties. J. Opt. Soc. Am. A 2022, 39, 1992–2000. [Google Scholar] [CrossRef] [PubMed]
  19. Werner, L.; Förster, E.; Kraus, M.; Hillmer, H.; Brunner, R. Extreme refractive-, diffractive- and hybrid-hyperchromats: Minimizing the equivalent Abbe number of a two-lens system. Photonics 2023, 10, 556. [Google Scholar] [CrossRef]
  20. Reichelt, S.; Pruss, C.; Tizianii, H.J. Absolute Testing of aspheric surfaces. Proc. SPIE Opt. Fabr. Testing Metrol. 2004, 5252, 252–263. [Google Scholar] [CrossRef]
  21. Swanson, G.J. Binary Optics Technology: Theoretical Limits on the Diffraction Efficiency of Multilevel Diffractive Optical Elements; Lincoln Laboratory, Massachusetts Institute of Technology: Lexington, MA, USA, 1991; Volume 1, Technical Report 914. [Google Scholar]
  22. Werdehausen, D. Nanocomposites as Next-Generation Optical Materials: Fundamentals, Design and Advanced Applications; Springer: Cham, Switzerland, 2021; Volume 316. [Google Scholar]
  23. Polyanskiy, M.N. Refractive Index Database. Available online: https://refractiveindex.info. (accessed on 12 April 2023).
  24. Cargille-Sacher Laboratories Inc. Available Refractive Indices, SDS and Datasheets—Refractive Index Liquids. Available online: https://www.cargille.com/available-refractive-indices-sds-datasheets/ (accessed on 12 April 2023).
  25. The Mathworks Inc. Matlab. Available online: https://matlab.mathworks.com/ (accessed on 1 August 2023).
  26. Antonov, A.; Greisukh, G.; Ezhov, E.; Stepanov, S. Diffractive elements for imaging optical systems. Optoelectron. Instrum. Data Process. 2017, 53, 421–430. [Google Scholar] [CrossRef]
  27. Rudolf, P.G.; Tollet, J.J.; MacGowan, R.R. Computer modeling wave propagation with a variation of the Helmholtz-Kirchhoff relation. Appl. Opt. 1990, 90, 998–1003. [Google Scholar] [CrossRef]
  28. Grushina, A. Direct-write grayscale lithography. Adv. Opt. Technol. 2019, 8, 163–169. [Google Scholar] [CrossRef]
  29. Schindler, A.; Haensel, T.; Flamm, D.; Frank, W.; Boehm, G.; Frost, F.; Fechner, R.; Bigl, F.; Rauschenbach, B. Ion beam and plasma jet etching for optical component fabrication. In Lithographic and Micromachining Techniques for Optical Component Fabrication; Kley, E.B., Herzig, H.P., Eds.; International Society for Optics and Photonics, SPIE: Bellingham, WA, USA, 2001; Volume 4440, pp. 217–227. [Google Scholar] [CrossRef]
  30. Zhang, Y.; Liang, R.; Spires, O.J.; Yin, S.; Yi, A.; Milster, T.D. Precision glass molding of diffractive optical elements with high surface quality. Opt. Lett. 2020, 45, 6438–6441. [Google Scholar] [CrossRef]
  31. Dannberg, P.; Mann, G.; Wagner, L.; Braeuer, A.H. Polymer UV-molding for micro-optical systems and O/E-integration. In Micromachining Technology for Micro-Optics; Lee, S.H., Johnson, E.G., Eds.; International Society for Optics and Photonics, SPIE: Bellingham, WA, USA, 2000; Volume 4179, pp. 137–145. [Google Scholar] [CrossRef]
  32. Au, A.K.; Huynh, W.; Horowitz, L.F.; Folch, A. 3D-Printed Microfluidics. Angew. Chem. Int. Ed. 2016, 55, 3862–3881. [Google Scholar] [CrossRef] [PubMed]
Figure 1. Schematic representation of the imaging functions of DOEs using different diffraction orders for imaging at different wavelengths (left: imaging characteristic; the position of the diffractive structure is visualized in green; right: wavelength-dependent efficiency η ( λ ) for different diffraction orders). The blue and red color represent a short and a long wavelength with maximum efficiency in the corresponding order. (a) diffractive–refractive achromat, (b) decoupled lens design for 0th (long wavelength) and 1st order (short wavelength), (c) decoupled lens design (wavelength dependency inverted), (d) coupled lens design (1st order of a long wavelength and 2nd order of a short wavelength having the same focus), (e) hyperchromatic strong wavelength spreading, and (f,g) wavelength-dependent switching between positive and negative 1st order (switching between intrafocal and extrafocal).
Photonics 10 01116 g001
Figure 2. Schematic cross-section of TLDOEs; (a) type 1-oriented: oriented in parallel blazed facets; (b) type 2-oriented: reversely tilted facets; h 1 and h 2 : depths of the sawtooth profiles, n 1 ( λ ) , n 2 ( λ ) , n 3 ( λ ) : wavelength-dependent refractive index of the materials and Λ : grating period. Light entering from below is obliquely incident (incidence angle Φ) and diffracted into multiple diffraction orders.
Photonics 10 01116 g002
Figure 3. Abbe diagram (refractive index n d vs. Abbe number υ d ) displaying the materials used in this study (indicated by enlarged symbols); small blue dots represent a selection of common inorganic glasses as a reference. The green and blues lines in the high dispersion range represent high-index liquids (Series B and M of [24]). The red and orange lines depict nanocomposites composed of PS or PMMA as a matrix and different volume fractions of ITO nanoparticles.
Photonics 10 01116 g003
Figure 4. Diffraction efficiency behavior of N-PSK53 and the nanocomposites PS-ITO and PMMA-ITO forming a TLDOE type 1 orientation. (a) Dispersion curves of N-PSK53, PS-ITO, and PMMA-ITO. (b) Efficiency for varying wavelengths λ (horizontal axis) and different profile depths h 2 (vertical axis); each column represents the results for different profile depths h 1 ; the rows distinguish different diffraction orders m. (c) Diagrams of diffraction efficiency η ( λ ) for three selected profile depth combinations (1)–(3) as a function of the wavelength λ , order m, and incidence angle Φ .
Photonics 10 01116 g004
Figure 5. Diffraction efficiency behavior of N-SF10, the high-index liquid B1.67, and the PS-ITO nanocomposite forming a TLDOE type 1 orientation. (a) Dispersion curves of N-SF10, B1.67, and PS-ITO. (b) Efficiency for varying wavelengths λ (horizontal axis) and different profile depths h 2 (vertical axis); the columns represent different profile depths h 1 and the rows different diffraction orders m. (c) Diagrams of diffraction efficiency η ( λ ) for four selected profile depth combinations (1)–(4) as a function of the wavelength λ , order m, and incidence angle Φ .
Photonics 10 01116 g005
Figure 6. Diffraction efficiency behavior of Al2O3, N-SF10, and CsBr composing a TLDOE type 2 orientation. (a) Dispersion curves of Al2O3, N-SF10, and CsBr. (b) Efficiency for varying wavelengths λ (horizontal axis) and different profile depths h2 (vertical axis); the columns represent different profile depths h1 and the rows different diffraction orders m. (c) Diagrams of diffraction efficiency η ( λ ) for four selected profile depth combinations (1)–(4) as a function of the wavelength λ , order m, and incidence angle Φ .
Photonics 10 01116 g006
Figure 7. Diffraction efficiency behavior of an ITO layer, N-LaK33A, and the high-index liquid M1.75 composing a TLDOE type 1 orientation. (a) Dispersion curves of ITO, N-LaK33A, and M1.75. (b) Efficiency for varying wavelengths λ (horizontal axis) and different profile depths h 2 (vertical axis); the columns represent different profile depths h 1 and the rows different diffraction orders m. (c) Diagrams of diffraction efficiency η ( λ ) for four selected profile depth combinations (1)–(4) as a function of the wavelength λ , order m, and incidence angle Φ .
Photonics 10 01116 g007
Figure 8. Diffraction efficiency behavior of a high-index liquid M1.73, N-LaK34, and a PS-ITO nanocomposite forming a TLDOE Type 1 orientation. (a) Dispersion curves of M1.73, N-LaK34, and PS-ITO. (b) Efficiency for varying wavelengths λ (horizontal axis) and different profile depths h 2 (vertical axis); the columns represent different profile depths h 1 and the rows different diffraction orders m. (c) Diagrams of diffraction efficiency η ( λ ) for four selected profile depth combinations (1)–(4) as a function of the wavelength λ , order m, and incidence angle Φ .
Photonics 10 01116 g008
Figure 9. Liquid–solid hybrid structures. (a) Dispersion curves of the materials that make up a type 1 TLDOE. For the bottom and top layers, ITO and the glass N-LaK33A are used. For the intermediate layer, a high-index liquid from a series with dispersion curves varying in incremental steps can be used. The dispersion curves of the high-index liquids intersect the curves for ITO and N-LaK33A at different wavelengths λ . (b) Varying efficiency profiles by using different high-index liquids for different relief depths as a way to fine-tune wavelength-selective efficiency (left three columns: h 1 = 1 µm; right three columns: h 1 = 6 µm). The rows represent different diffraction orders m.
Photonics 10 01116 g009
Figure 10. Spectral half-width (HW) (graphs in blue) and wavelength of maximum efficiency λ 0 (graphs in dark red) of specific diffraction orders m as a function of relief depth h 1 and the corresponding relief depth h 2 of the TLDOEs described in Figure 9. The diagrams show the results for the high-index liquids (a) B1.7, (b) M1.73, and (c) M1.75 from [24] as intermediate layers. The specific structural geometries were selected to maximize efficiency in the −1 order at the design wavelength λ 0 of 0.6 µm.
Photonics 10 01116 g010
Table 1. Refractive index n d and Abbe number υ d (reference wavelength λ d = 589 nm) of the materials used in this study.
Material n d υ d Material n d υ d
ITO1.90168.21B1.71.718.8
PS-ITO1.700113.6M1.711.7121.0
PMMA-ITO1.635714.5M1.721.7220.6
N-LaK33A1.753952.27M1.731.7320.3
N-LaK341.729254.5M1.741.7419.9
N-PSK531.620163.48M1.751.7519.7
N-SF101.728328.53Al2O31.768272.31
B1.671.6719.8CsBr1.697634.19
Disclaimer/Publisher’s Note: The statements, opinions and data contained in all publications are solely those of the individual author(s) and contributor(s) and not of MDPI and/or the editor(s). MDPI and/or the editor(s) disclaim responsibility for any injury to people or property resulting from any ideas, methods, instructions or products referred to in the content.

