Article

Degradation- and Thermal-Related Changes in Selected Electro-Optical Parameters of High-Power 270–280 nm LEDs

by
Łukasz Gryko
*,
Urszula Joanna Błaszczak
and
Marcin Kochanowicz
*
Faculty of Electrical Engineering, Bialystok University of Technology, Wiejska 45D, 15-351 Bialystok, Poland
*
Authors to whom correspondence should be addressed.
Photonics 2023, 10(12), 1326; https://doi.org/10.3390/photonics10121326
Submission received: 10 October 2023 / Revised: 22 November 2023 / Accepted: 27 November 2023 / Published: 29 November 2023
(This article belongs to the Section Lasers, Light Sources and Sensors)

Abstract

:
Recently, the rapid development of LED sources emitting high-power radiation in the UVC range has been observed, and there is a growing interest in using these LED sources in practical solutions. The innovative constructions of disinfection and sterilization devices depend on the effectiveness and reliability of UVC radiation sources. At the same time, the literature reports that deep experimental analysis of degradation of high-power LEDs is limited. The aim of this research is to contribute to existing knowledge through a comparative assessment of the changes in optical power, spectral power distribution, and forward voltage drop in time and temperature of exemplary high-power UVC LEDs. For this purpose, a controlled 1500 h degradation of six different high-power UVC LEDs was performed, based on which we determined their expected lifetimes L70, L80, and L90. According to our results, the L80 varies from 180 h to 1500 h. Stronger degradation of optical power was observed with lower current. No significant impact on the spectral parameters was observed. The results also indicate the low influence of temperature on the voltage (<0.12%/°C), optical power (<0.22%/°C), and spectral parameters (peak wavelength Δλ and full width at half maximum ΔFWHM < 0.025 nm/°C).

1. Introduction

In recent years, a number of works have been carried out to develop UVC LED technology [1]. Due to the shape of the spectral characteristics and the flexibility of control, these sources are already recognized as the most promising technology of the future [2] in the field of UVC radiation emission (Table 1). They are increasingly used to disinfect water [3,4], air [5], and surfaces [6], as well as in agriculture [7,8] and the food industry [9].
Currently, available UVC LEDs emit radiation with relatively low power (up to 100 mW), with wall-plug efficiency (WPE) in the range of 5–6% (10–15% was obtained under laboratory conditions) [10], and in this decade, they are expected to exceed the WPE of low-pressure mercury lamps (LP-Hg) [11]. UVC LEDs’ lifetime is a parameter that needs to be improved to balance the higher purchase cost with longer operating time and therefore lower maintenance costs [2,12]. As of 2016, the commercial lifetime of low-power UVC LEDs was approximately 1000 h, but devices with a lifetime of up to 12,000 h are currently available on the market [13,14]. These lifetimes are not comparable to their counterparts in emitting visible radiation [15]; due to the features of the material used in their production, they are much shorter [2].
Table 1. Parameters of UVC sources [2,11,16,17,18].
LP-HgMP-HgExcimer LampUVC LED
WPE [%]30–405–15<21–6
Wavelength (nm)253.7200–600100–350255, 260, 265, 270, 275, 280
FWHM (nm)12–1510–15
OP of UVC per device (W)1–20>100.1–0.30.005–0.1
Cost per watt of UVC output (USD/W)23>100050–600
Lifetime (h)9000–18,00010,00040001000–12,000
LED degradation mechanisms related to electroluminescence reduction are the subject of many scientific studies, most of which concern low-power LEDs or elements outside the UVC range [19]. In recent years, in the scientific literature, several reliability analyses (Table 2) and lifetime estimations [19,20,21,22,23,24,25,26,27] of low-power UVC LEDs were published. A variety of operation conditions were assumed. The optical power (OP) of tested LEDs did not exceed 60 mW, and in 40% of papers, no direct information about OP was provided. The analyzed literature included investigations of LEDs from 262 nm to 278 nm. The duration of described degradation procedures lasted up to 10,000 h but in most cases did not last more than 500 h. The reported reduction in OP was from 6% to even 90% depending on the degradation period and operating conditions. In most cases, the tests were carried out at a heat sink temperature of 25 °C and a current in the range of 100–350 mA. Some of the tests did not provide current density and supply voltage. In the up-to-date analyzed literature, the authors of this publication came across only one validation of various chips emitting radiation with wavelengths in the UVC range [20]; usually, studies of one or several chips of the same type are described [21,23].
According to the literature, OP degradation modes of UV LEDs can be divided into two categories—catastrophic and gradual degradation [28]. A summary of methods for analyzing the degradation of the OP of UV LEDs is presented in the work [19]. The first mechanism is associated with the complete lack of emission of optical radiation, while the second is associated with its successive loss and from the operational point of view is a significant problem because, despite the actual operation of the system, it leads to a deterioration in the effectiveness of the disinfection process [22]. The gradual degradation of the OP of LED depends on the operating temperature and current density [22,28,29,30,31,32] and is the fastest during the first 10–200 h of operation, then the process slows down [19,21,33,34,35,36,37]. According to [22,38], the UVC LED’s lifetime is inversely proportional to the third power of the stress current density. A model proposed in [21] reveals that LED lifetime is proportional to its radiative recombination coefficient and inversely proportional to the product of its initial nonradiative recombination coefficient and defect growth interest rate, thus providing explicit dependence of the lifetime on the LED junction temperature and current density. Authors of [21] suggest that the current density mainly impacts the defect multiplication interest rate, and the junction temperature has a predominant effect on activating more initial defects. Doubling the current density from 30 A/cm2 to 60 A/cm2 can reduce the LED lifetime by a factor of ~3–5 [21]. When the junction temperature is raised from 25 °C to 100 °C, the lifetime can be reduced by a factor of ~10 [21].
Table 2. Review of UVC LED degradation tests.
WavelengthOPElectrical ConditionsHeat Sink TemperatureDegradation PeriodChange in OPData from
(nm)(mW)I (mA)J (A/cm2)V (V)(°C)(h)(%)
2624.01006714.52025−20[37]
250−42
27112100405.82524−21[33]
48−32
96−37
500−50
265N/A78N/AN/A25333−31 (Mg 1%)[34]
95N/AN/A25.5333−55 (Mg 0.5%)
100N/AN/A26.5333−74 (Mg 0.15%)
26512N/A60N/A25333−11[27]
N/A120N/A−19
N/A180N/A−38
265N/A1001007.240202−50[39]
265N/A1001007.025317N/A[40]
275N/A250336.3255000−25[21]
350466.7−28
268199250336.360 (ambient)2500−36
350466.725 (ambient)−6
278N/A100N/AN/A2510,000−16.5
27712150607.325333−11[22]
300120−19
450180−39
27818@200 mA350N/A6.62590N/A[23]
500N/A7.3N/A
27537.5@350 mA80050825333−31[20]
27712@100 mA300257.2−13
2785@50 mA100245.8−31
27810@150 mA150335.8−22
27537.5@350 mAN/A40N/A−92
27712@100 mAN/A40N/A−76
2785@50 mAN/A40N/A−76
27810@150 mAN/A40N/A−91
260N/A20327.225150−37[41]
265N/A20N/A6.52550−50[42]
27560350N/A6N/A250−65[36]
27540350667.5150 (junction)102−20[35]
484−40
In the application context, to assess the rate of degradation of optical radiation sources, in particular LEDs, standard investigation methods recommended by IESNA, TM-21 [43], and TM-28 [44] are used, in which the working times in given conditions (temperature and power supply) are determined, followed by a specific reduction in the optical power of the source, e.g., L50, L70, and L80 (lifetimes to reduce optical power by 50, 30, and 20%, respectively) [45]. These methods are based on the nonlinear regression of the analysis degradation effects observed during accelerated life tests. According to results described in [46], the projected L70 of UVC LEDs stressed at 350 mA at room temperature and at 250 mA at 60 °C were 19,000 h and 1800 h, respectively [21].
Authors of [20,27,29,39] indicate that the electroluminescence degradation is more intense when loaded with a lower current density, thus indicating that an increase in the nonradiative recombination rate is probably taking place because of the degradation. During degradation, an increase in the serial resistance and ideality factor were also observed [39,41]. What is more, a significant increase in the OP in the initial stage was identified, which is ascribed to the activation of the Mg dopant in the p-type layer [41].
As the OP of UVC LEDs degrades, the basic electro-optical parameters also change. In [20], authors observed that initially, the various types of UVC LEDs have similar performance, and even if they have a different chip size, the OP vs. current slope is comparable between the different samples, and it changes during degradation. Instability of the electrical properties also was observed, which resulted in gradual changes in the turn-on voltage of the devices during long-term operation [34]. Several papers prove that the forward voltage decreases within the first hours of operation and increases over longer operation times [20,22,25,37,42], which was explained by a change in the resistivity of the contacts and AlGaN layers. The generation of stress-induced defects and the increase in nonradiative recombination in the early stress stage also causes an increase in leakage current, which results in a decrease in OP [20,33,39,41,42].
There are only a few studies on the UVC LED radiation spectrum, according to which degradation does not cause variation in the peak wavelength [41]. In [23], the emission of parasitic light in the UVA and green ranges by UVC LEDs was reported and explained.
The balance between the emitted OP and the lifetime of the device is therefore crucial to correctly design an effective disinfection system. Results presented in [22] confirm that as the current increases, the total amount of energy delivered over the entire period of use by the LED decreases significantly. However, functional characteristics provided by the manufacturers in the data sheets do not include the information required to calculate the current density. Therefore, when developing a device or system with UVC LEDs, the current density is not available, and the degradation of the source has to be predicted in connection with available functional characteristics. This is also important in scientific research, as neglecting the changes in the electro-optical parameters of these LEDs may call into question the obtained results due to the failure to maintain the assumed optical radiation parameters over time. Therefore, the aim of this work is to deepen the available knowledge from this point of view by analyzing and comparing the temporal and thermal changes in OP, spectral power distribution, and voltage drop of selected high-power UVC LEDs.

2. Materials and Methods

For the tests, 6 UVC LEDs with a wavelength in the range of 270–280 nm and with the currently highest OP (range 10–100 mW) were selected. Emitters of various designs (Figure 1) manufactured by 4 manufacturers (LEDs 1–5, leading manufacturers) were mounted on 5 mm thick copper plate.
The scheme of the procedure of measurements is presented in Figure 2. Measurements started with the study of the characteristics of the OP, spectral power distribution (SPD), and current–voltage (IV) characteristic of each LED for 3 values of the housing temperature. For the set conditions (substrate temperature of 20 °C, 40 °C, and 60 °C and current in the range from 0.1·Imax to Imax), OP, SPD, and V of each LED were measured. The measurements were carried out by setting the temperature of the LED housing, starting from the lowest; then the value of the supply current was set, starting from Imax, and reduced in 10% steps. Then the degradation procedure was conducted at a constant temperature of the copper board of 60 °C. During this process, each LED was supplied separately with stabilized direct current I with the maximum intensity specified by the manufacturer (depending on the model, it was 90, 105, 150, or 350 mA) (Table 3). During the procedure, measurements of OP were repeated at assumed time steps. After 1500 h, the procedure of LED characterization according to the starting scheme was repeated.
During the experiment, the working temperature of the tested LEDs was stabilized and regulated with the Peltier element, which was controlled by TC2812. Each LED emitter was supplied independently from a separate, stabilized precision laboratory power supply unit. Current I was measured with an accuracy of ±(0.2%) and voltage (V) with an accuracy of ±(0.05%). A PMD100D Thorlabs meter with an S120VC measuring head was used to measure OP, and a Stellarnet Silver spectrometer was used to measure SPD of radiation.
Based on the measurement results, changes in LED parameters (V, OP, peak wavelength λ, spectral full width at half maximum FWHM) and characteristics (shift in IV and OP characteristics) caused by their degradation were assessed.
The OP decay is fitted by the sum of two exponential decay components from [47]:
O P = O P 0 + A 1 exp t τ 1 + A 2 exp t τ 2 ,
where τ1 and τ2 are short- and long-decay components, respectively. Parameters A1 and A2 are fitting constants. According to Equation (1), the average degradation time τ is given by [48]:
τ = A 1 τ 1 2 + A 2 τ 2 2 A 1 τ 1 + A 2 τ 2 .
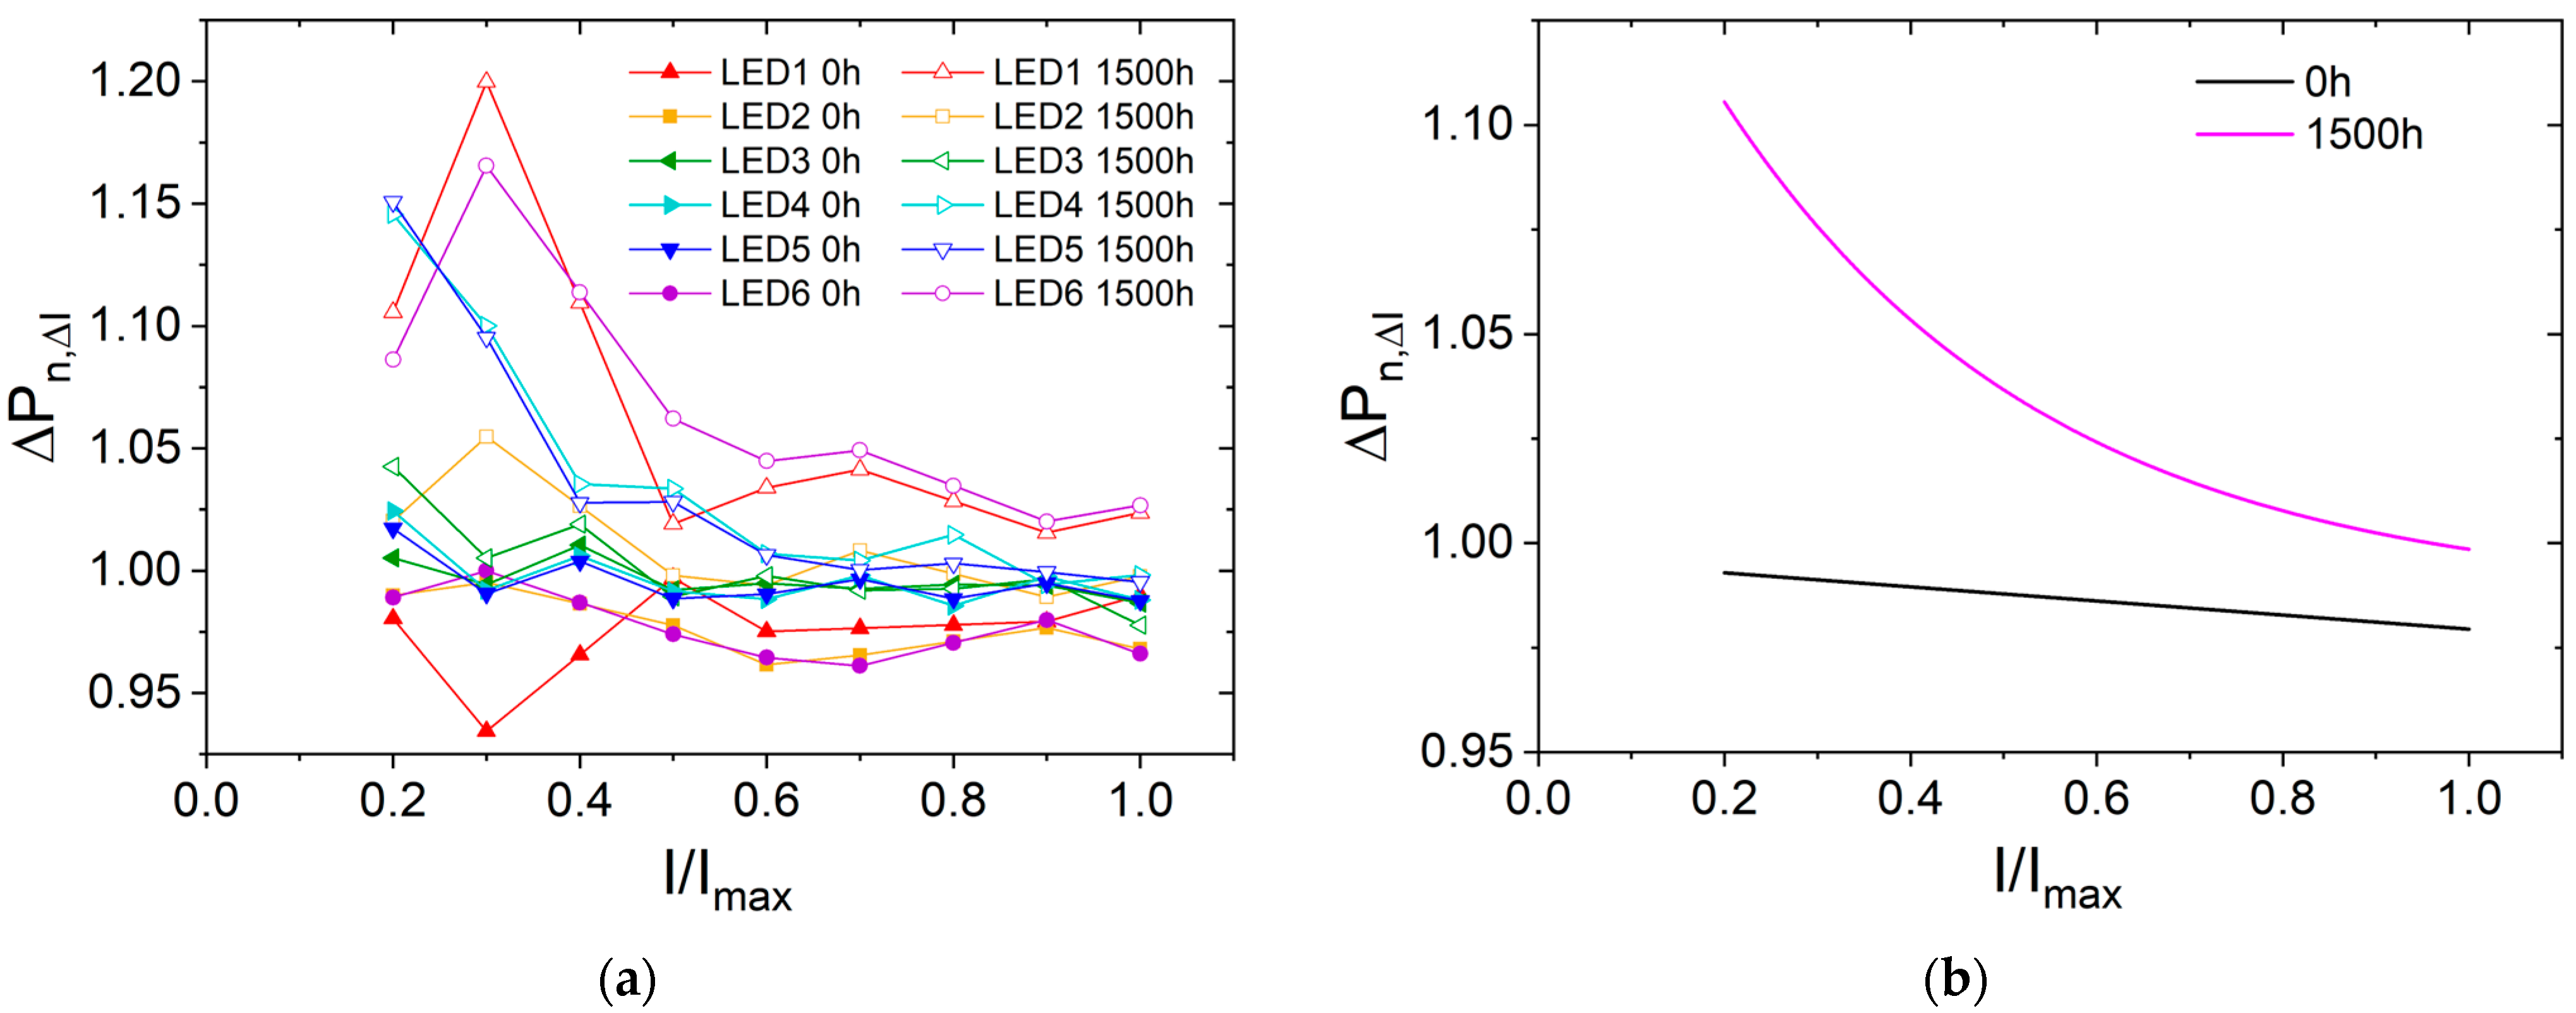
Due to the diversity of the tested LEDs, to compare the OP characteristics, we propose determining the relative changes in OP over time to relative changes in current I with coefficient ΔPn,ΔI:
O P n , I = O P n O P n 1 I n I n 1 ,
where n is a number of measurement (n = 2….10); OPn and OPn−1 are optical power values for n and n − 1 measurement; and In and In−1 are currents for n and n − 1 measurement. Ideally, the indicator ΔPn,ΔI should take the value of 1, which would mean a proportional change in OP with a change in I. The index value below 1 accompanies a decrease in the radiative recombination efficiency, e.g., due to an increase in junction temperature.
In addition, for each LED, the values of the temperature coefficient of OP changes ΔOPT before and after the degradation process were calculated and compared:
O P T = O P m a x O P m i n T m a x T m i n .
The light emission process in LEDs is one-to-one—one injected electron–hole pair yields at most one photon. Thus, the efficiency of an LED can be written as a product of the quantum efficiency of this process and the electrical voltage efficiency [2]:
W P E = E Q E · E E = I Q E · L E E · E E = I E · R E · L E E · E E
where WPE is wall-plug efficiency, EQE is external quantum efficiency, IQE is internal quantum efficiency, IE is injection efficiency, LEE is light-extraction efficiency, EE is electrical efficiency, and RE is radiative efficiency.
WPE can be also written as follows [2]:
W P E = O P V · I · 100 %
where WPE is wall-plug efficiency, OP is the useful optical power emitted by the light source, I is the electrical driving current, and V is the source voltage.
Predicting IQE and EQE can be performed by means of ABC model [24,49] as well as approaches based on direct use of OP and electrical parameters [50]:
E Q E = p h o t o n s e s c a p e   f r o m   d e v i c e s e l e c t r o n s s · 100 % = O P h · ν I e · 100 % = O P h c λ I e · 100 %
where EQE is external quantum efficiency, OP is optical power, I is the electrical driving current, e is the elementary charge, h is the Planck constant, c is the velocity of light in vacuum, ν—is frequency, and λ is the photon’s wavelength.

3. Results

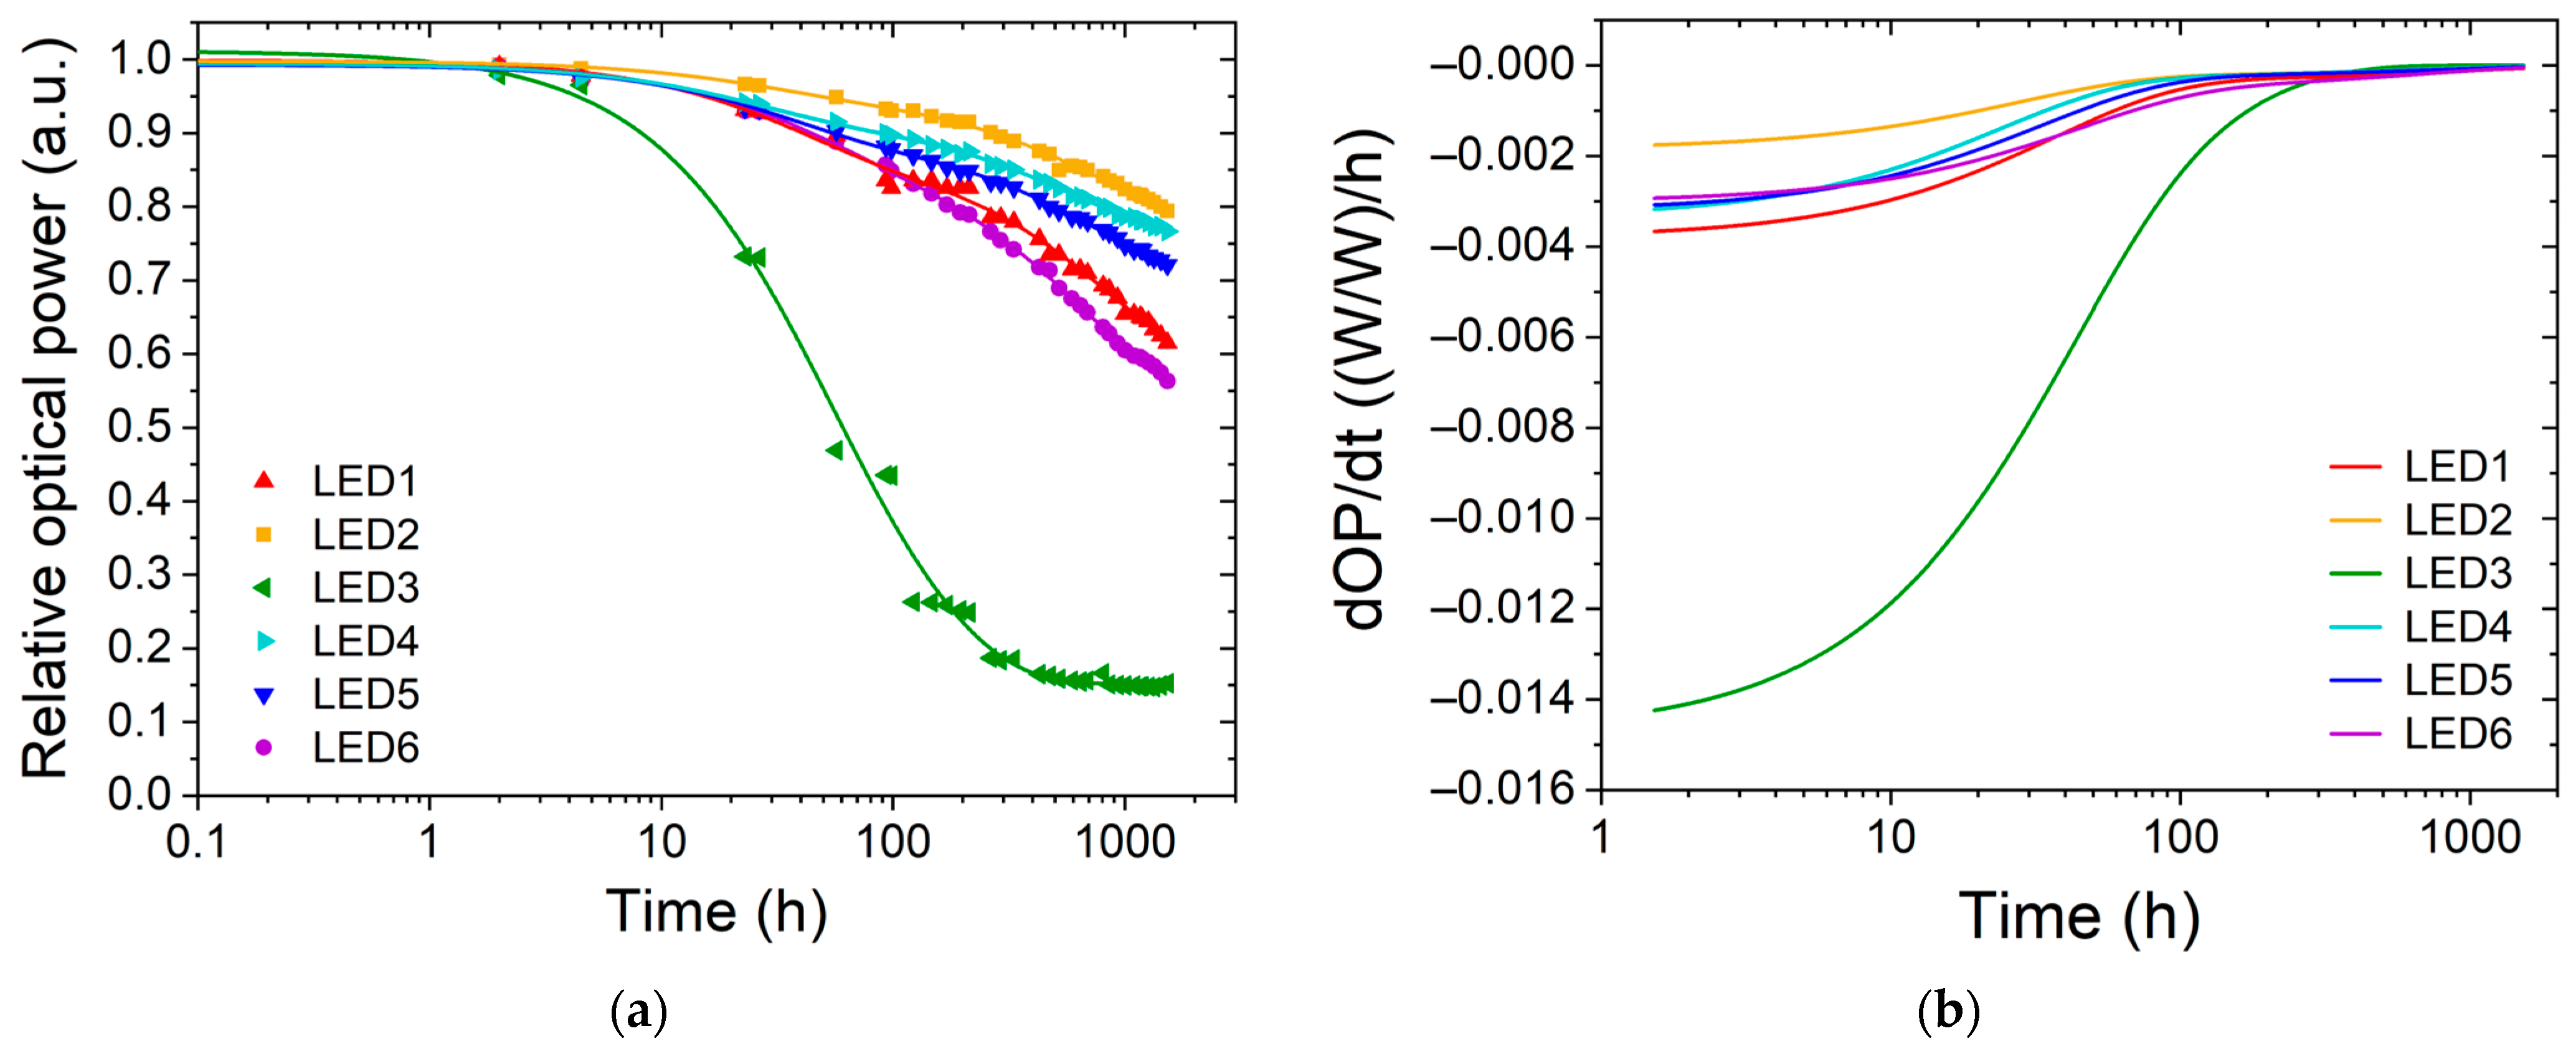
Based on themeasurements during degradation process, the results of changes in OP of LEDs due to their operation time were assessed (Figure 3 and Figure 4).
Figure 3 presents the graphs of relative changes in the OP of radiation of the tested UVC LEDs in time. For each of the tested emitters, the operating time significantly affects its optical power—after 1500 h of operation, the decrease is from 21% to 44% (Figure 3b). During the tests, LED3 suffered catastrophic degradation of three out of six chips, which resulted in a power drop of 75% after only 200 h. The first chip in LED3 failed between 5 and 23 h of operation, the second between 27 and 57 h, and the third between 99 and 122 h.
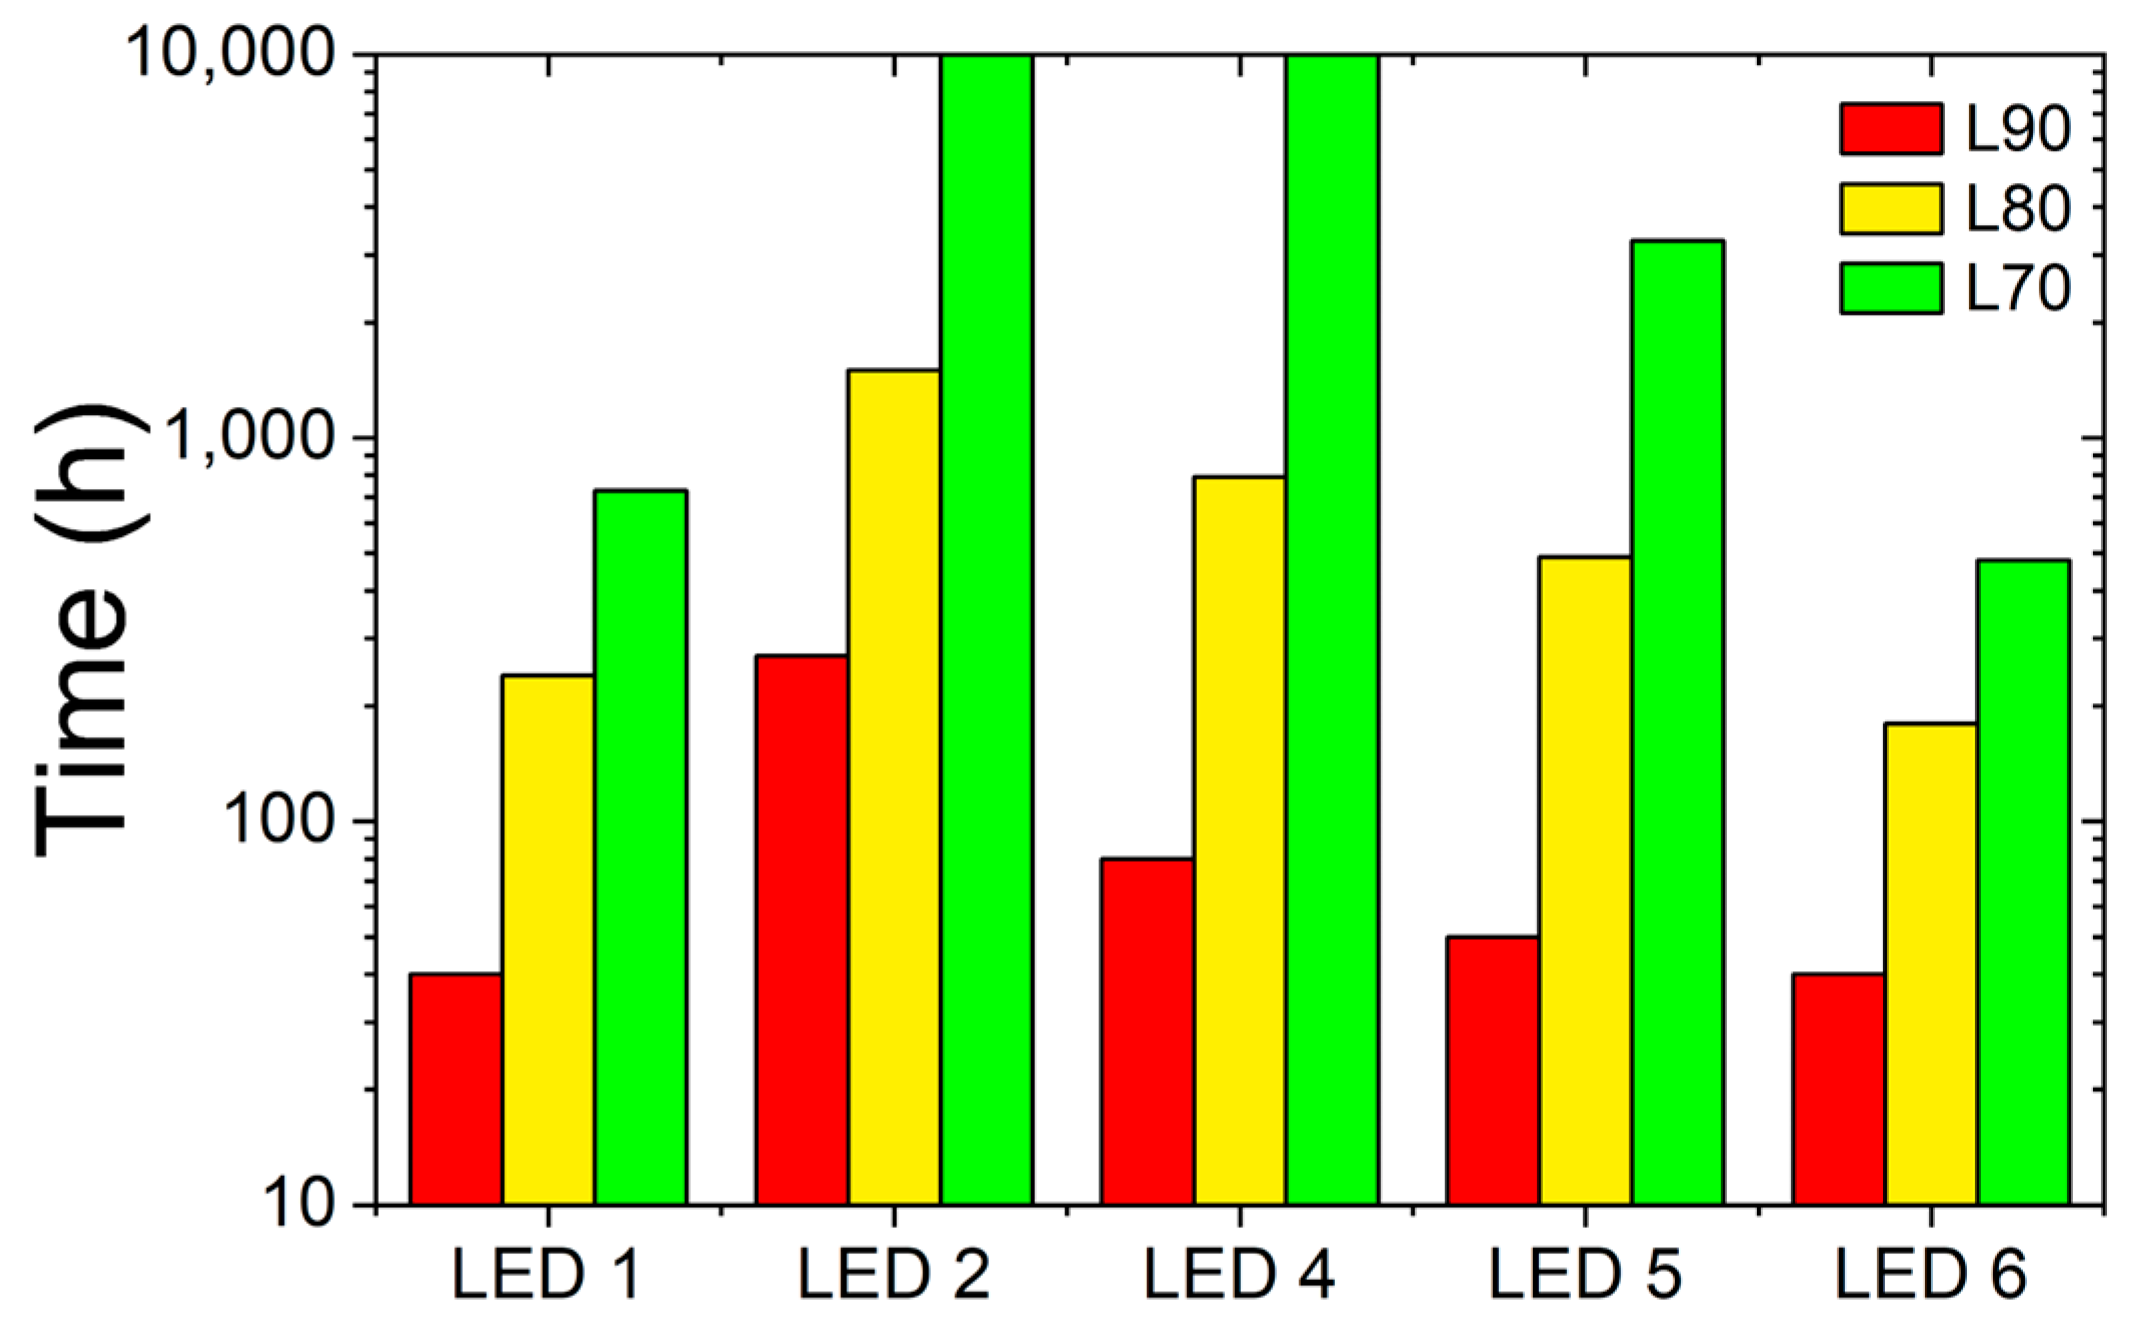
As shown in Figure 3b and Table 4, the degradation of OP of the tested sources occurred at different rates. Emitters (LED1 and LED2, as well as LED4 and LED5) with similar electro-optical parameters degraded at different rates. For the LED2 emitter powered by a 17% higher current (105 mA vs. 90 mA), the OP degradation was much slower (L80 = 1500 h) than for the LED1 emitter (L80 = 240 h) (Figure 4). Both LEDs had the same maximum currents of 150 mA (Table 3). The slower degradation of LED2 could be influenced by its lower thermal resistance compared to LED1 (6 K/W vs. 15 K/W) but similar temperature of junction (the estimated difference is 2K). The situation is different in the case of LED4 and LED5 emitters despite identical values of maximum currents (500 mA, Table 3) and thermal resistances (5 K/W); the degradation rate of LED4 was smaller (L80 = 790 h) than the LED5 emitter (L80 = 490 h) (Figure 4) despite being supplied with the same current (I = 0.7·Imax = 350 mA).
In order to compare the effects of OP degradation, the characteristics of relative changes in OP as a function of relative changes in I for a stabilized temperature before and after the process were determined according to equation 3 (Figure 5). As the I increases, the coefficient ∆OPn.I of all LEDs decreases, which may mean a reduction in energy conversion efficiency. This process occurs much faster in the case of emitters after degradation (Figure 5b). A coefficient ∆Pn.I below 1 for higher currents means the increase in the temperature of the LED junction. The rapid drop in the ∆OPn.I coefficient for low currents of LEDs after degradation may be caused by the increase in nonradiative recombination.
Based on the measurement results, the temperature coefficients of OP (∆P/T) were estimated based on equation 4 (Figure 6) (Table 5). Changing the temperature of tested LEDs’ housing in the range from 20 °C to 60 °C before the degradation process reduces the OP by 4–9%, which means (0.15 ± 0.05)%/°C. After the degradation period of 1500 h, the change in temperature causes a decrease in their OP by (0.13 ± 0.09)%/°C. In both cases, LED4 is characterized by the highest changes in ∆OP/∆T.
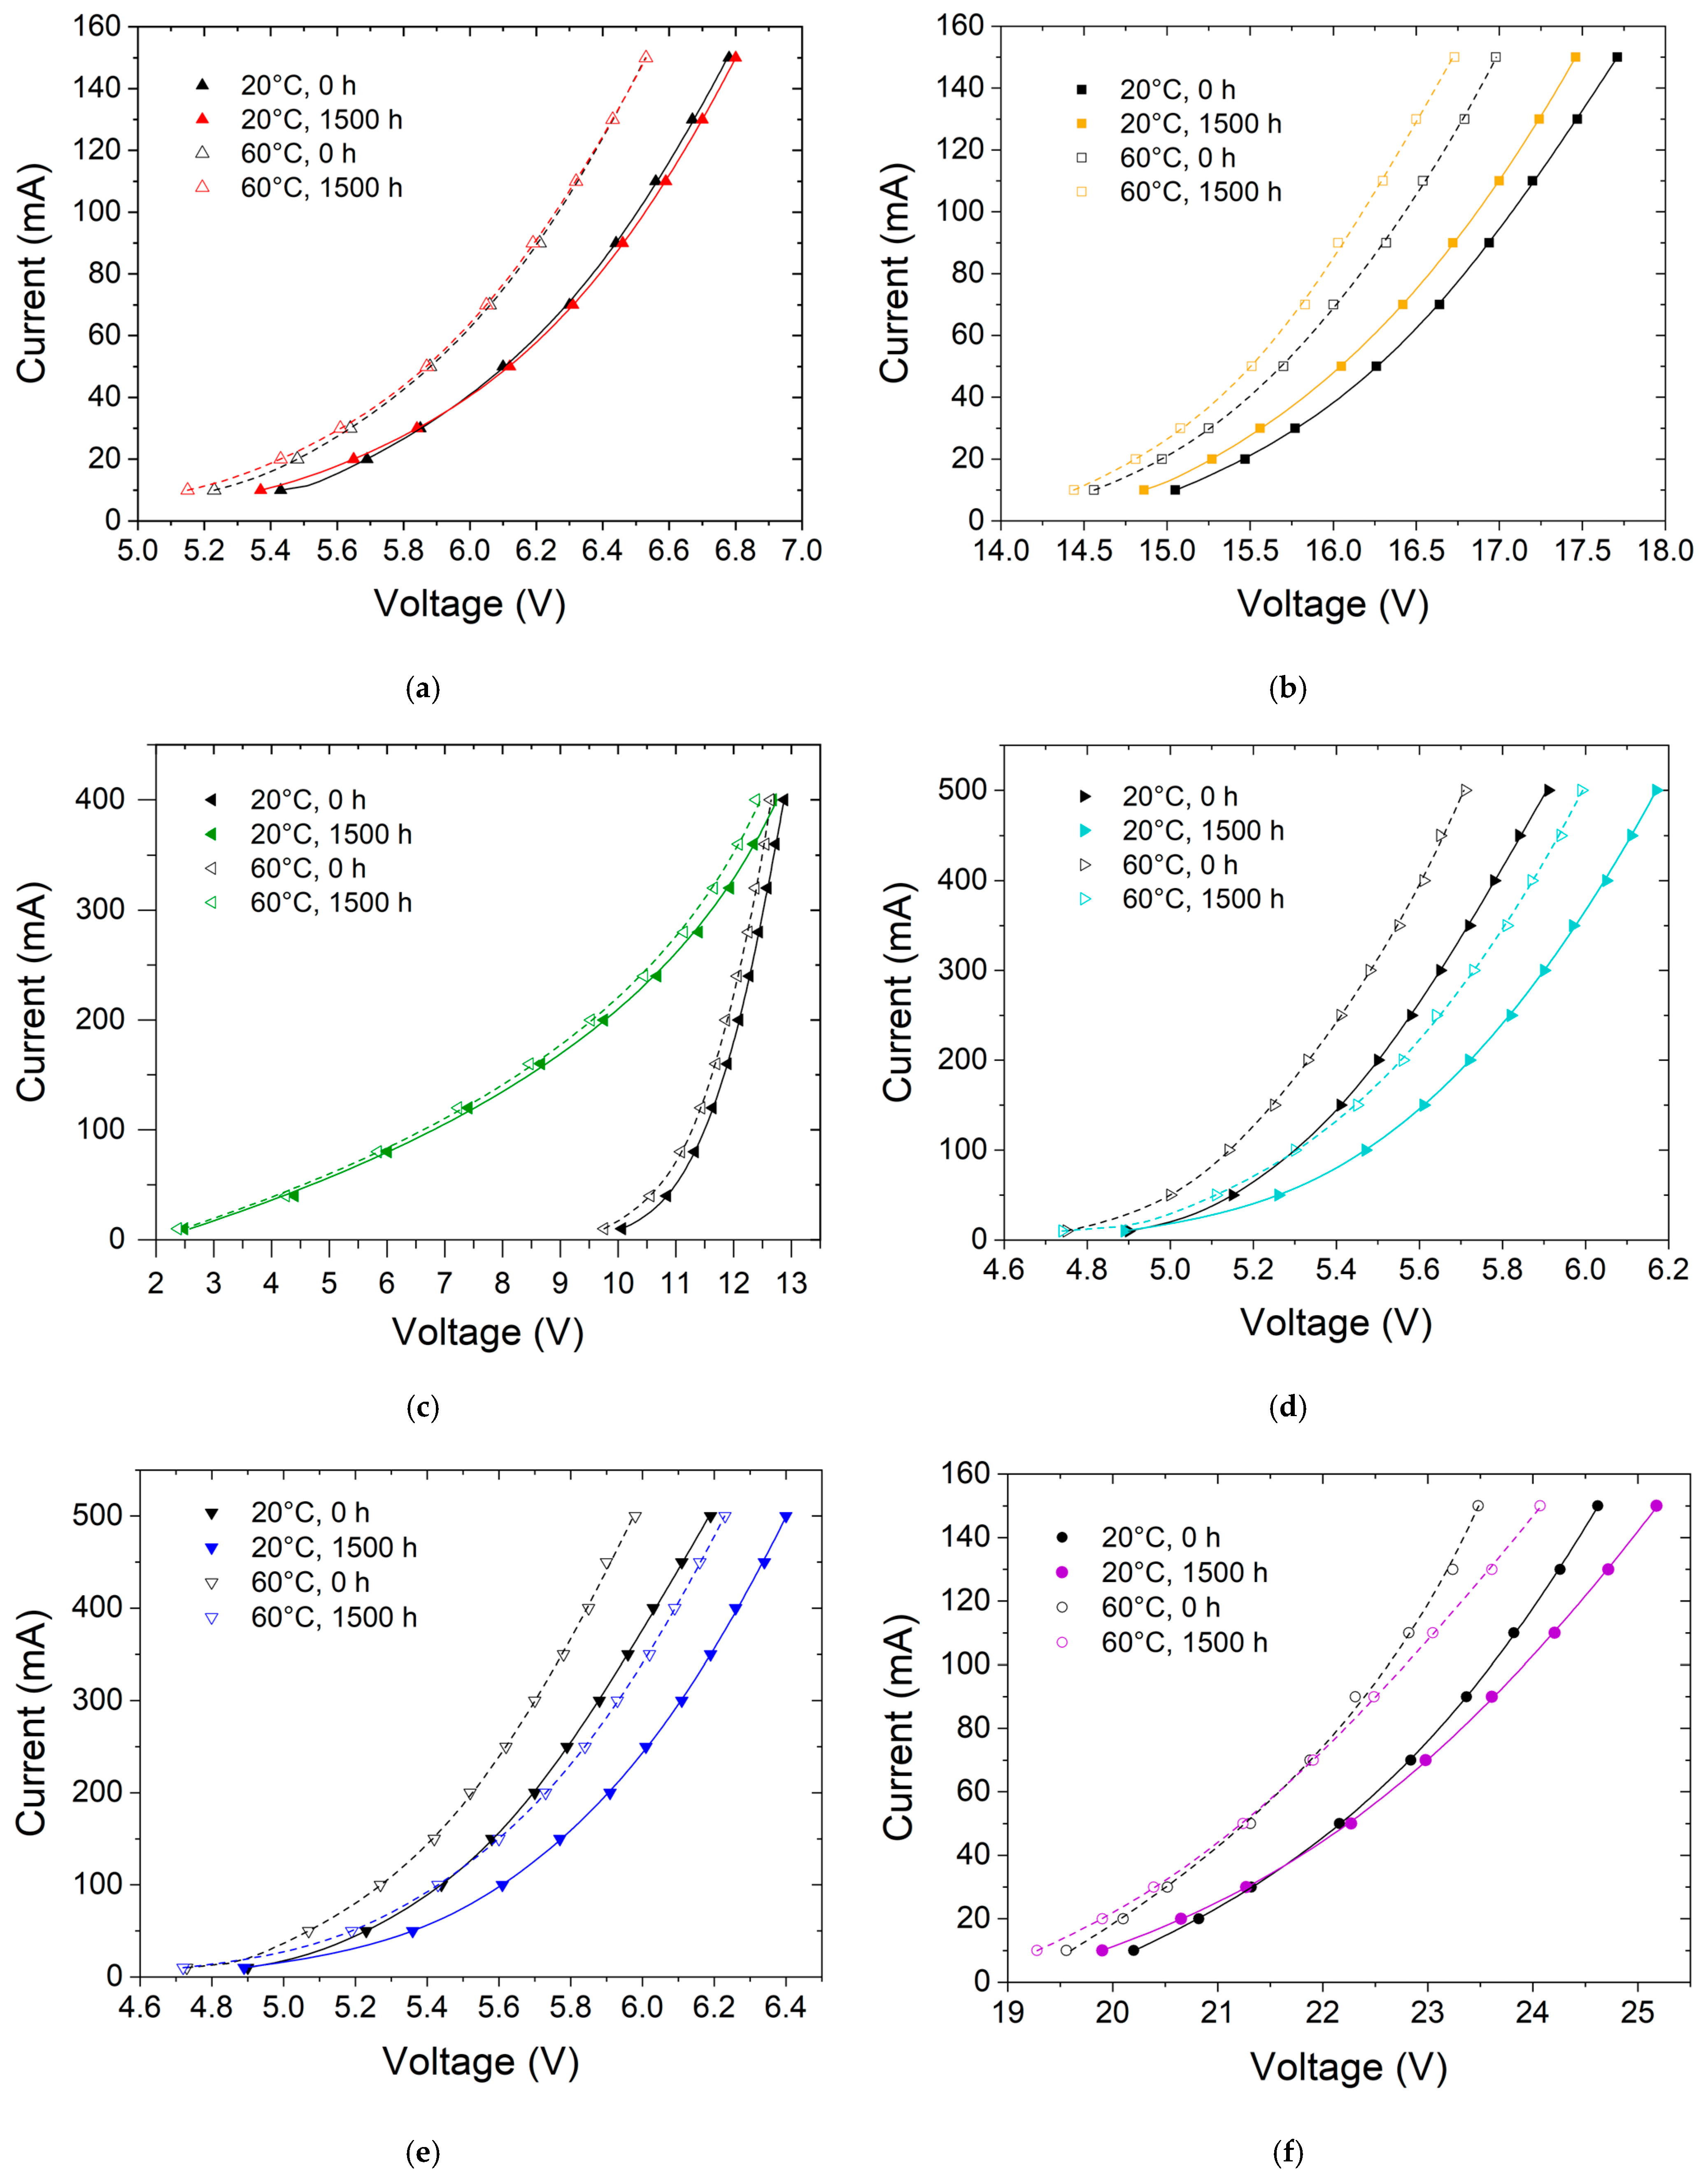
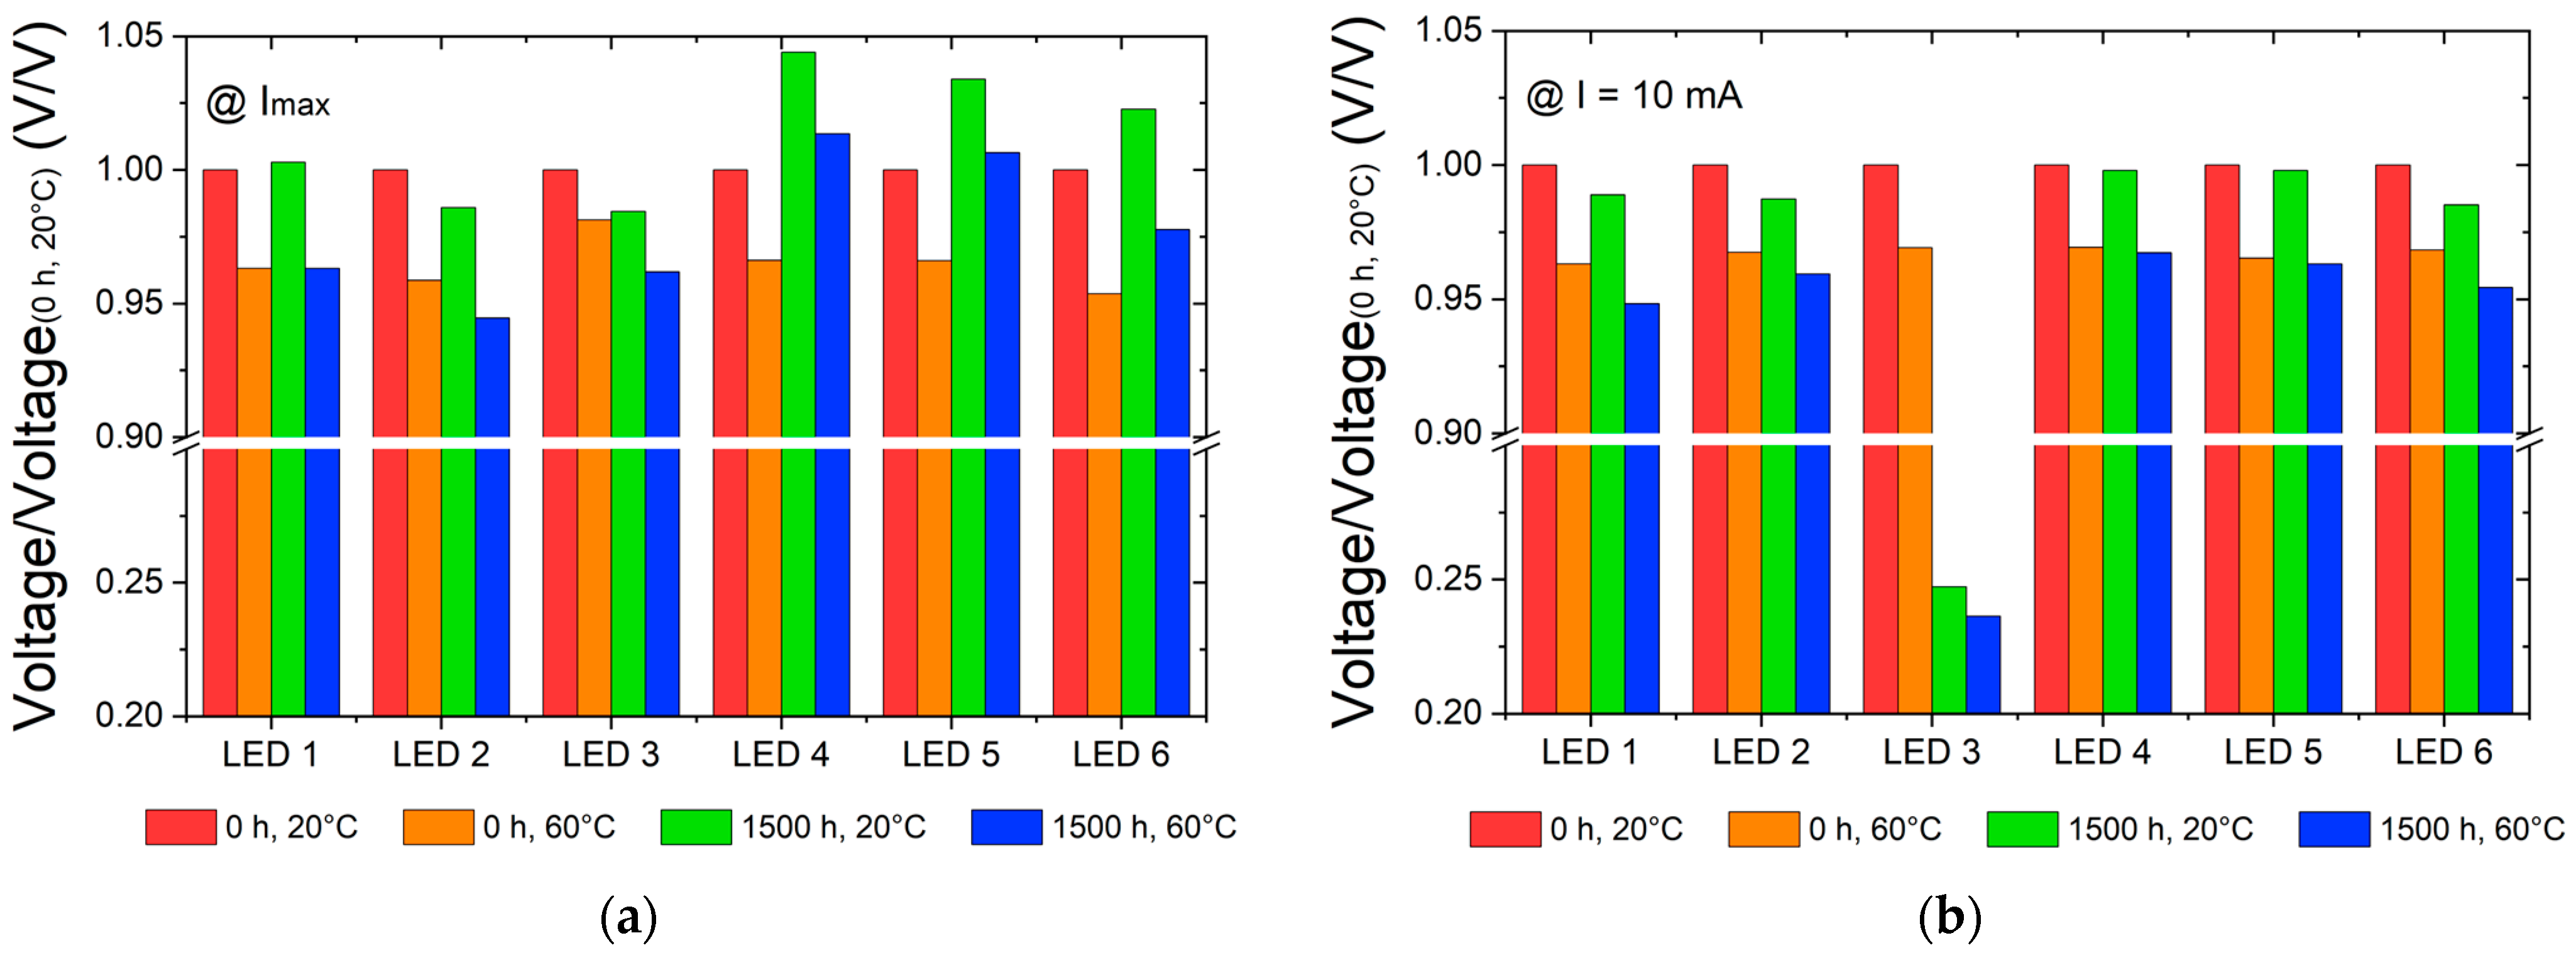
Changes in the IV characteristics of the tested LEDs were determined (Figure 7) depending on their operating time (0 and 1500 h) and temperature (20 and 60 °C) (Figure A1). For most of the tested emitters, an increase in operating time results in a (2.3–5.2%) increase in forward V at a constant I and a constant temperature of substrate. In the case of the rest of the LEDs (LED2, LED3), an inverse relationship was observed—a 1.4–2% decrease in the forward V. For all LEDs, the forward V at low I (10 mA) decreased by 0.2–2.9% as a result of degradation. An increase in the substrate temperature before degradation causes a reduction in forward V for Imax from 0.05%/°C (LED3) to 0.12%/°C (LED6), and after degradation, it decreases from 0.06%/°C (LED3) to 0.11%/°C (LED6).
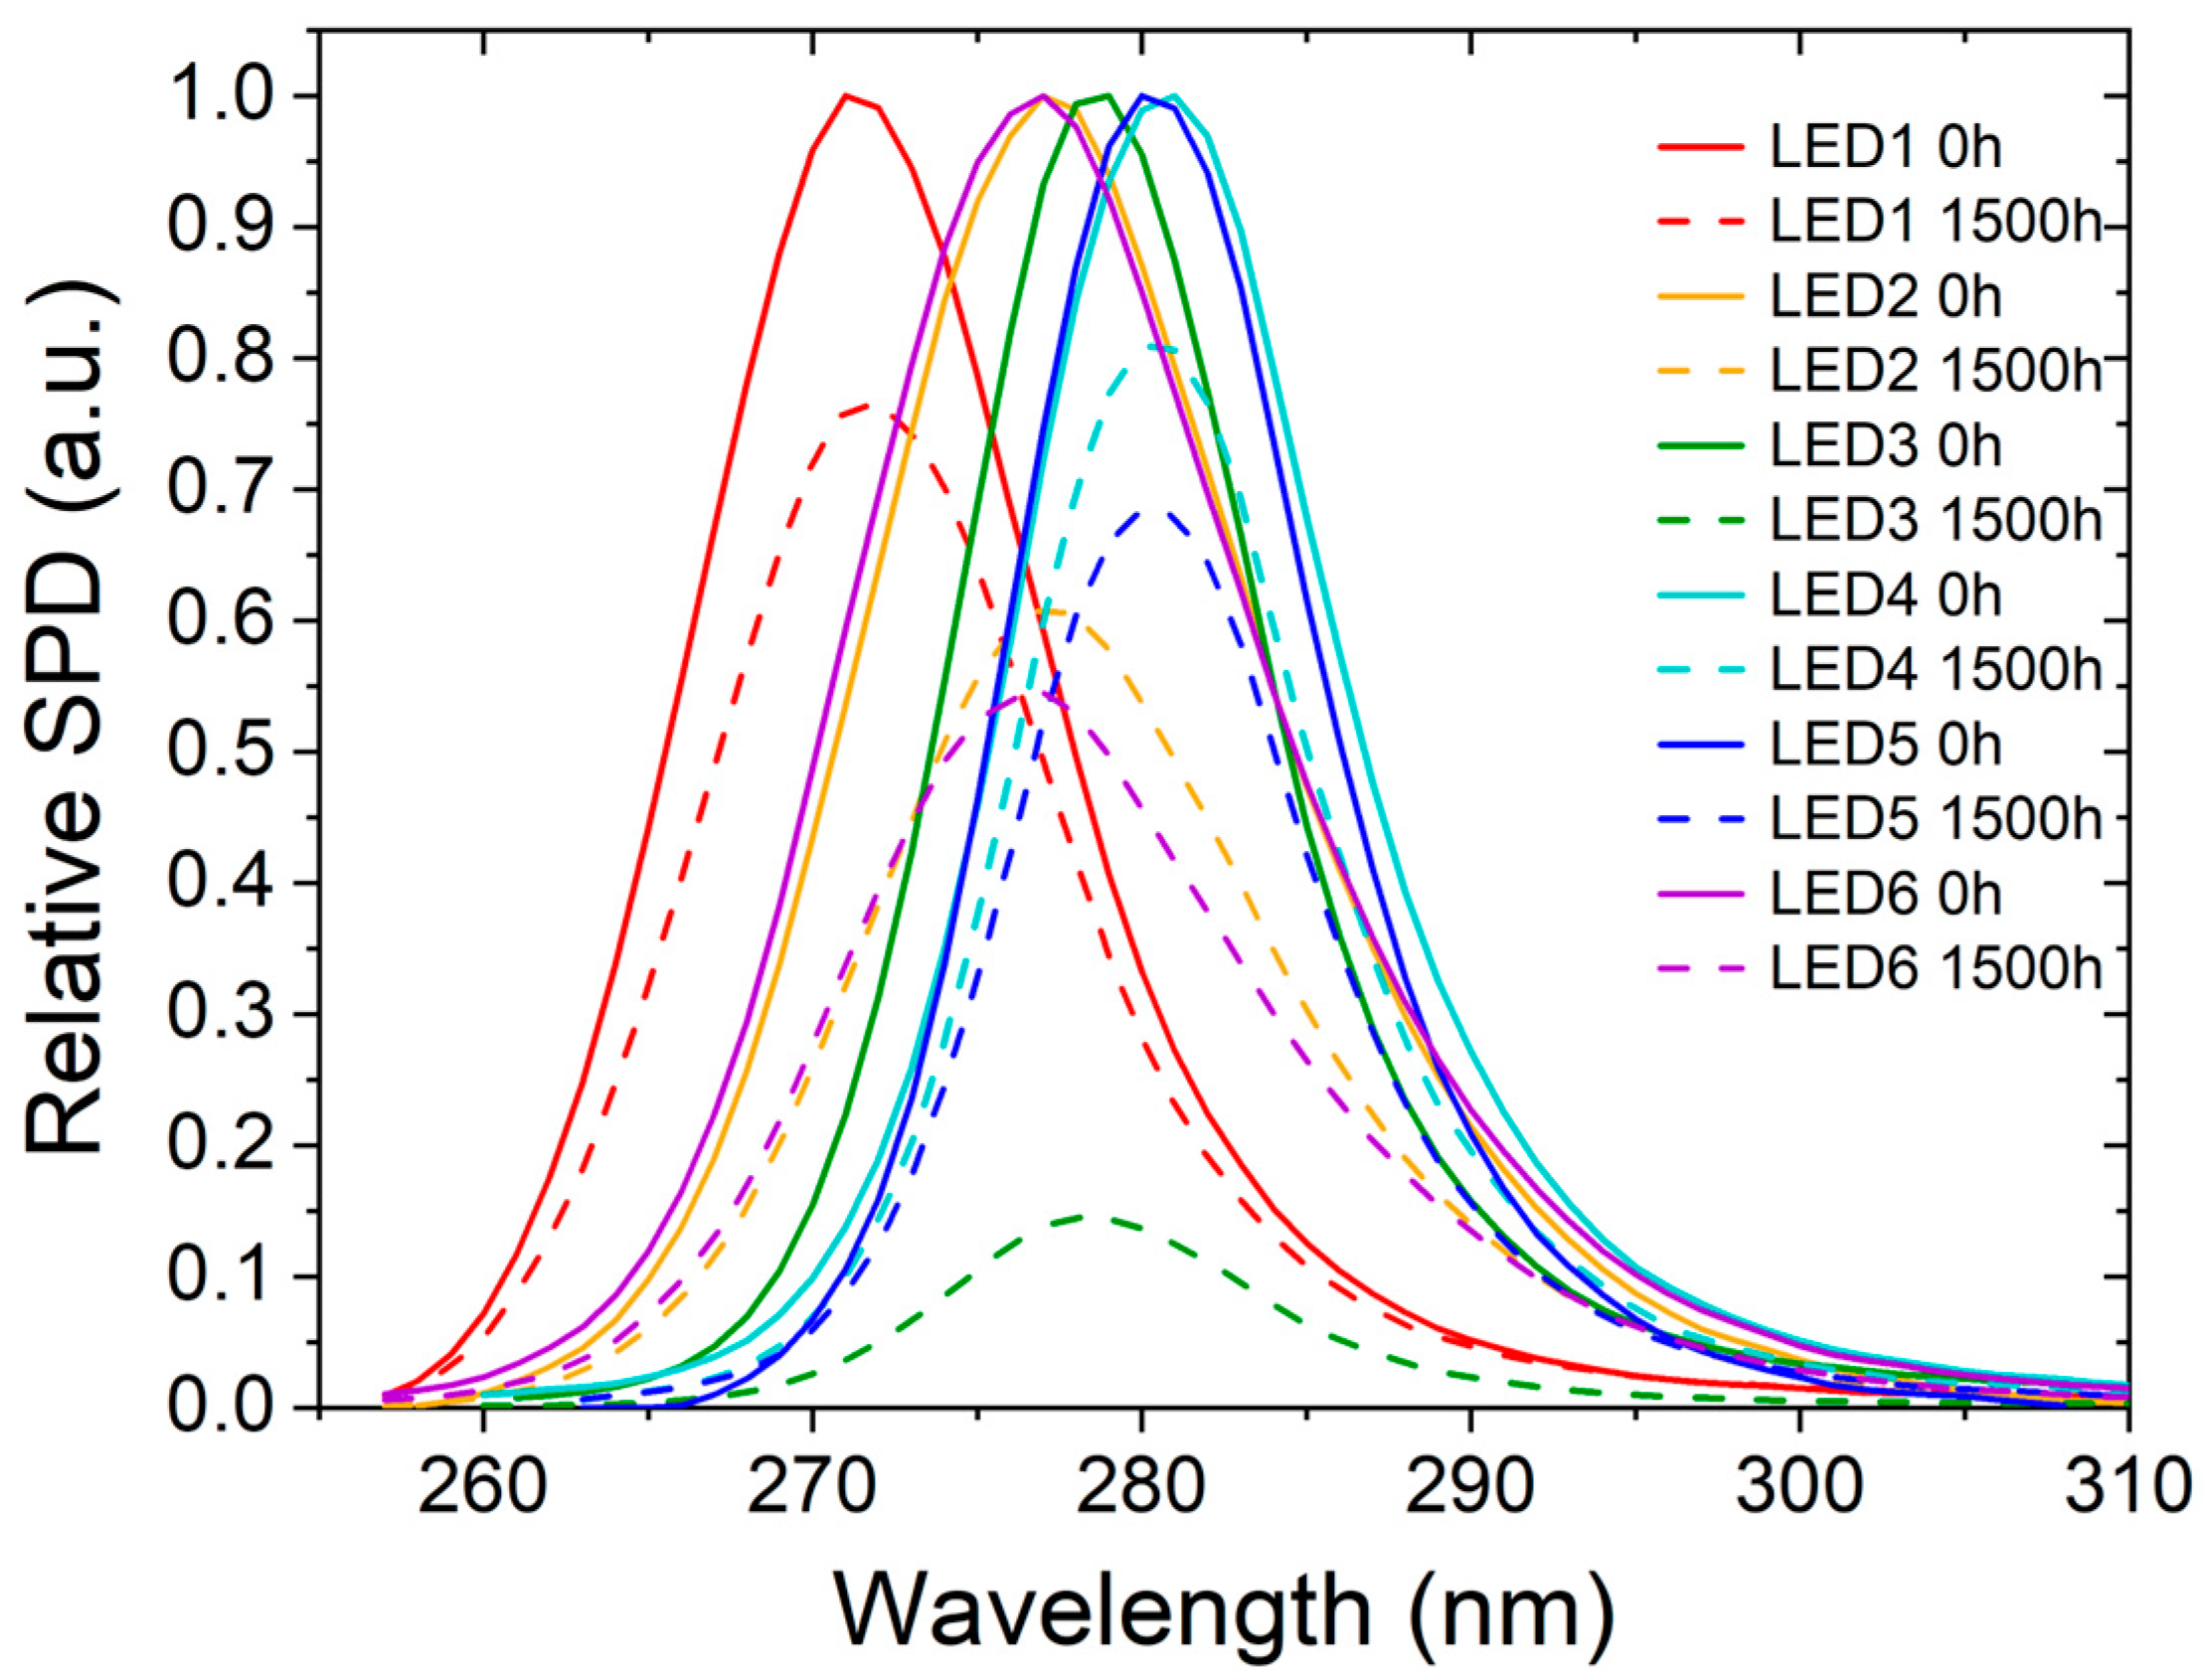
The SPDs of the tested UVC LEDs were determined depending on their operating time (0 and 1500 h) (Figure A2) and temperature (20 and 60 °C) (Figure A3). The change in the dominant peak wavelength was ∆λ = ± 0.5 nm (Figure 8a), and the change in ∆FWHM was from −0.5 nm to + 1.0 nm (Figure 8b) depending on the UVC LED type, which means the degradation process had no significant effect on the spectral parameters of the emitted radiation. Similar effects were observed for the increase in the temperature of the LED housing. In the case of the tested LEDs, the increase in the temperature by 40 °C caused an increase in the wavelength ∆λ at the emission maximum by 0.5–1.0 nm (Figure 8a) and the ∆FWHM by 0.5–1.0 nm (Figure 8b).
In the case of the tested LEDs, the obtained WPE (Equation (6)), EQE (Equation (7)), and EE (Equation (5)) results are collected in Table 6. The estimated WPE does not exceed 2.6%, while EQE is lower than 7.7% and EE is lower than 77% for all LEDs.

4. Discussion

The decrease in OP during degradation when the UVC LEDs were supplied with high current is 21–44% after 1500 h, and in the case of partially catastrophic degradation in the LED3 emitter, it was even 85% (Figure 3). Emitters with similar construction (LED1 and LED2, as well as LED4 and LED5) degrade at different rates (L80 = 180–1500 h), which is confirmed by their lifetimes (Figure 4). Therefore, for each emitter, it is possible to determine the operating conditions (I, T) and their impact on the degradation process—a decrease in electroluminescence (∆OP) in time. This is consistent with the results of [20], which found that there are significant differences in lifetimes between UVC LEDs.
Our research results indicate that a lower ∆Pn.I of UVC LEDs occurred when LEDs were supplied with higher current (Figure 5), which means an increase in the junction temperature [20,51]. The observed rapid drop in the ∆OPn.I coefficient for low currents after degradation may be caused by the increase in nonradiative recombination. The global decrease in OP at high currents, as well as the more visible one at low current levels, was explained in the works [20,39,52] by the generation of defects, as well as by SRH recombination centers located in the active region, which are responsible for the loss of the nonradiative recombination carrier [23,49]. These changes may be due to the combined effect of a decrease in injection efficiency and an increase in the nonradiative recombination rate, mainly affecting the low-current region of the OP curves [20,39].
An increase in the temperature of the emitter caused a decrease in OP at a rate of 0.10–0.22%/°C depending on the LED model (Figure 6, Table 5), which is less than 0.5%/°C as in [53] and 0.87%/°C as in [50]. It has been reported that the effect of temperature on the OP is on average 24% smaller after the degradation process. The exception is LED5, in which OP decreases faster after the degradation as a result of the temperature increase than before this process. However, the character of the changes in the coefficient ∆P/T for tested LEDs before and after the degradation process is very diverse and does not allow us to draw further conclusions with the available amount of data.
In the case of the tested UVC LEDs, the operating time significantly affects the I–V characteristics, and this impact is different in each case (Figure 7). The analysis of the electrical characteristics also indicates that a constant current induces a reduction in the turn-on voltage (from 0.2 to 3%), similar to the results in [41]. For most of the tested emitters, in the case of higher supply currents, an increase in the operating time also causes an increase in the forward voltage (less than 5%), while for some LEDs, a decrease in the forward voltage value was observed (less than 2%). A decrease in the forward voltage due to degradation is usually observed [22,41].
An increase in the temperature reduces the LED’s forward voltage by 0.05–0.12%/°C (Figure 7). Smaller changes were observed after degradation in contrast to the results of 0.18–0.19%/°C in the work [42]. The influence of temperature on the change in wavelength + (0.5–1.0) nm was also noted when it increased by 40 °C.
During research, we did not observe significant changes in the electroluminescence spectrum after the aging process, apart from a decrease in OP. The change in peak wavelength is ∆λ = 0–0.5 nm, and the change in half-width of the spectrum is ∆FWHM = 0.0–1.0 nm depending on the UVC LED model (Figure 8)—similar to [52]. This is important information, e.g., due to the strong dependence of the sensitivity of pathogens on the wavelength of disinfecting radiation [2,54]. During the tests, we also did not observe an additional emission of parasitic radiation after degradation, which confirms the nonradiative process responsible for the degradation [22,52].
A WPE of commercial 270-280 nm LEDs does not exceed 5% (15% was achieved in the research) [2]; the tested LEDs had a WPE of 1.4–2.6% (Table 6). An EQE of 270–280 nm LEDs does not exceed 20%, in most cases ranging from 1 to 10% [55]; the tested LEDs had an EQE of 2.3–7.7%. The electrical efficiency EE of the tested UVC LEDs was in a wide range of 18–77%. There is a noticeable relationship between EE and EQE; UVC LEDs with a high EE have low EQE (LED1, LED4, and LED5) and vice versa (LED2, LED3, and LED6).

5. Conclusions

In this work, we presented an analysis of the basic operational parameters of the latest technological solutions of UVC LEDs and their changes caused by carrying out a direct current load test at a temperature of 60 °C. For this purpose, we performed degradation investigations of six randomly selected high-power UVC LEDs emitting radiation in the wavelength range of 270–280 nm.
The time stability of parameters of commercially available UVC LEDs emitting radiation in the wavelength range of 270–280 nm is still limited and varies depending on the manufacturer, the quality of the emitter, and its operating conditions, resulting in significant differences in their lifetimes, e.g., L80 = 180–1500 h. In our study, stronger degradation occurred with lower current (LED1 and LED6). The observed changes in OP over time may be due to two degradation mechanisms. The first one dominates in the first 100 h of operation, and in the literature, it is attributed to a decrease in the efficiency of charge injection. This causes a decrease in OP and the amplitude of the main peak of the emission spectrum, which is independent of the current intensity. The second mechanism dominates after 100 h and is correlated with the formation of defects in half of the band gap area. This leads to a drop in OP, especially at low current levels.
Based on the results, we also conclude that there are no significant changes in voltage and SPD after the degradation process apart from a decrease in OP. As well, the voltage and spectral parameters of UVC LED radiation are not very sensitive to temperature changes.
It should be noted that due to the available data of the tested sources, we could not assess the density of the current. For this reason, it is necessary to continue the undertaken research and take into account, among other points, the assessment of the internal structure of the chips before, during, and after the degradation process and the higher number of LEDs.

Author Contributions

Conceptualization, Ł.G. and U.J.B.; methodology, Ł.G. and U.J.B.; validation, Ł.G. and U.J.B.; formal analysis, Ł.G. and U.J.B.; investigation, Ł.G. and U.J.B.; resources, Ł.G. and U.J.B.; data curation, Ł.G., U.J.B. and M.K.; writing—original draft preparation, Ł.G. and U.J.B.; writing—review and editing, Ł.G., U.J.B. and M.K.; visualization, Ł.G.; project administration, M.K. All authors have read and agreed to the published version of the manuscript.

Funding

This paper was supported by the following projects: WZ/WE-IA/3/2023 at the Bialystok University of Technology and “PROTECT MED—development of innovative solutions to increase the safety of staff and patients of infectious and single-name hospitals”, implemented as part of the National Centre for Research and Development project “Support for single-name hospitals in the fight against the spread of SARS-CoV-2 infection and in the treatment of COVID-19”.

Data Availability Statement

The dataset generated during the current study are available from the corresponding author upon reasonable request.

Conflicts of Interest

The authors declare no conflict of interest.

Appendix A

Figure A1. Current–voltage characteristics of (a) LED1, (b) LED2, (c) LED3, (d) LED4, (e) LED5, (f) LED6 before and after the degradation process, measured for their housing temperatures of 20 °C and 60 °C.
Photonics 10 01326 g0a1

Appendix B

Figure A2. Relative SPDs of UVC LEDs measured before (solid line) and after (dotted line) the degradation procedure; SPDs of LEDs before the degradation process are the reference; Tcase = 60 °C, ILED = Imax.
Photonics 10 01326 g0a2
Figure A3. Relative SPDs of UVC LEDs measured for emitter housing temperatures of Tcase = 20 °C (solid line) and 60° (dotted line); SPDs of LEDs measured for emitter housing temperatures of Tcase = 20 °C are the reference; t = 1500 h, ILED = Imax.
Photonics 10 01326 g0a3

References

  1. Amano, H.; Collazo, R.; De Santi, C.; Einfeldt, S.; Funato, M.; Glaab, J.; Hagedorn, S.; Hirano, A.; Hirayama, H.; Ishii, R.; et al. The 2020 UV Emitter Roadmap. J. Phys. D Appl. Phys 2020, 53, 503001. [Google Scholar] [CrossRef]
  2. Zollner, C.J.; DenBaars, S.P.; Speck, J.S.; Nakamura, S. Germicidal Ultraviolet LEDs: A Review of Applications and Semiconductor Technologies. Semicond. Sci. Technol. 2021, 36, 123001. [Google Scholar] [CrossRef]
  3. Jarvis, P.; Autin, O.; Goslan, E.H.; Hassard, F. Application of Ultraviolet Light-Emitting Diodes (UV-LED) to Full-Scale Drinking-Water Disinfection. Water 2019, 11, 1894. [Google Scholar] [CrossRef]
  4. Song, K.; Mohseni, M.; Taghipour, F. Application of Ultraviolet Light-Emitting Diodes (UV-LEDs) for Water Disinfection: A Review. Water Res. 2016, 94, 341–349. [Google Scholar] [CrossRef] [PubMed]
  5. Kim, D.-K.; Kang, D.-H. UVC LED Irradiation Effectively Inactivates Aerosolized Viruses, Bacteria, and Fungi in a Chamber-Type Air Disinfection System. Appl. Environ. Microbiol. 2018, 84, e00944-18. [Google Scholar] [CrossRef] [PubMed]
  6. Sellera, F.P.; Sabino, C.P.; Cabral, F.V.; Ribeiro, M.S. A Systematic Scoping Review of Ultraviolet C (UVC) Light Systems for SARS-CoV-2 Inactivation. J. Photochem. Photobiol. 2021, 8, 100068. [Google Scholar] [CrossRef]
  7. Osintseva, D.; Osintsev, E.; Rebezov, M.; Prokhasko, L.; Seilgazina, S.; Kurmanbayev, S.; Nurzhumanova, Z.; Yessimbekov, Z.; Voytsekhovskiy, V.; Maksimiuk, N.; et al. Ozonation and Microwave Treatments as New Pest Management Methods for Grain Crop Cleaning and Disinfection. Annu. Res. Rev. Biol. 2017, 20, 1–6. [Google Scholar] [CrossRef]
  8. Dombrovsky, A.; Mor, N.; Gantz, S.; Lachman, O.; Smith, E. Disinfection Efficacy of Tobamovirus-Contaminated Soil in Greenhouse-Grown Crops. Horticulturae 2022, 8, 563. [Google Scholar] [CrossRef]
  9. Kowalski, W. Ultraviolet Germicidal Irradiation Handbook; Springer: Berlin/Heidelberg, Germany, 2009; ISBN 978-3-642-01998-2. [Google Scholar]
  10. Matsukura, Y.; Inazu, T.; Pernot, C.; Shibata, N.; Kushimoto, M.; Deki, M.; Honda, Y.; Amano, H. Improving Light Output Power of AlGaN-Based Deep-Ultraviolet Light-Emitting Diodes by Optimizing the Optical Thickness of p-Layers. Appl. Phys. Express 2021, 14, 084004. [Google Scholar] [CrossRef]
  11. Wilm, A.; Leirer, C.; Lugauer, H.-J.; Hoffmann, M.P. UV-C LEDs and Their Use in Disinfection Applications. In Light-Emitting Devices, Materials, and Applications XXVI; Strassburg, M., Kim, J.K., Krames, M.R., Eds.; SPIE: Bellingham, WA, USA, 2022; p. 15. [Google Scholar]
  12. Kneissl, M.; Seong, T.-Y.; Han, J.; Amano, H. The Emergence and Prospects of Deep-Ultraviolet Light-Emitting Diode Technologies. Nat. Photonics 2019, 13, 233–244. [Google Scholar] [CrossRef]
  13. Ruschel, J.; Glaab, J.; Susilo, N.; Hagedorn, S.; Walde, S.; Ziffer, E.; Cho, H.K.; Ploch, N.L.; Wernicke, T.; Weyers, M.; et al. Reliability of UVC LEDs Fabricated on AlN/Sapphire Templates with Different Threading Dislocation Densities. Appl. Phys. Lett. 2020, 117, 241104. [Google Scholar] [CrossRef]
  14. Available online: https://bolb.co (accessed on 1 October 2023).
  15. Hsu, T.-C.; Teng, Y.-T.; Yeh, Y.-W.; Fan, X.; Chu, K.-H.; Lin, S.-H.; Yeh, K.-K.; Lee, P.-T.; Lin, Y.; Chen, Z.; et al. Perspectives on UVC LED: Its Progress and Application. Photonics 2021, 8, 196. [Google Scholar] [CrossRef]
  16. Tucciarone, C.M.; Cecchinato, M.; Vianello, L.; Simi, G.; Borsato, E.; Silvestrin, L.; Giorato, M.; Salata, C.; Morandin, M.; Greggio, E.; et al. Evaluation of UVC Excimer Lamp (222 Nm) Efficacy for Coronavirus Inactivation in an Animal Model. Viruses 2022, 14, 2038. [Google Scholar] [CrossRef] [PubMed]
  17. Ahmad, S.I. (Ed.) Ultraviolet Light in Human Health, Diseases and Environment; Springer International Publishing: Cham, Switzerland, 2017; Volume 996, ISBN 978-3-319-56016-8. [Google Scholar]
  18. Ramos, C.C.R.; Roque, J.L.A.; Sarmiento, D.B.; Suarez, L.E.G.; Sunio, J.T.P.; Tabungar, K.I.B.; Tengco, G.S.C.; Rio, P.C.; Hilario, A.L. Use of Ultraviolet-C in Environmental Sterilization in Hospitals: A Systematic Review on Efficacy and Safety. Int. J. Health Sci. 2020, 14, 52–65. [Google Scholar]
  19. Letson, B.; Conklin, J.W.; Wass, P.; Barke, S.; Mueller, G.; Rasel, M.A.J.; Haque, A.; Pearton, S.J.; Ren, F. Review—Reliability and Degradation Mechanisms of Deep UV AlGaN LEDs. ECS J. Solid. State Sci. Technol. 2023, 12, 066002. [Google Scholar] [CrossRef]
  20. Trivellin, N.; Fiorimonte, D.; Piva, F.; Buffolo, M.; De Santi, C.; Meneghesso, G.; Zanoni, E.; Meneghini, M. Reliability of Commercial UVC LEDs: 2022 State-of-the-Art. Electronics 2022, 11, 728. [Google Scholar] [CrossRef]
  21. Zhang, J.; Zhou, L.; Gao, Y.; Lunev, A.; Zhang, B.; Wu, S. Defect Dynamics and Internal Quantum Efficiency Decay Resultant Ultraviolet C-Band Light-Emitting Diode Lifetime Performance. Phys. Status Solidi 2022, 220, 2200433. [Google Scholar] [CrossRef]
  22. Trivellin, N.; Piva, F.; Fiorimonte, D.; Buffolo, M.; De Santi, C.; Zanoni, E.; Meneghesso, G.; Meneghini, M. Performance and Degradation of Commercial UV-C LEDs for Disinfection Purposes. Phys. Status Solidi 2023, 220, 2200900. [Google Scholar] [CrossRef]
  23. Trivellin, N.; Monti, D.; Piva, F.; Buffolo, M.; De Santi, C.; Zanoni, E.; Meneghesso, G.; Meneghini, M. Degradation Processes of 280 Nm High Power DUV LEDs: Impact on Parasitic Luminescence. Jpn. J. Appl. Phys. 2019, 58, SCCC19. [Google Scholar] [CrossRef]
  24. Buffolo, M.; Caria, A.; Piva, F.; Roccato, N.; Casu, C.; De Santi, C.; Trivellin, N.; Meneghesso, G.; Zanoni, E.; Meneghini, M. Defects and Reliability of GaN-Based LEDs: Review and Perspectives. Phys. Status Solidi 2022, 219, 2100727. [Google Scholar] [CrossRef]
  25. Trivellin, N.; Piva, F.; Fiorimonte, D.; Buffolo, M.; De Santi, C.; Orlandi, V.T.; Dughiero, F.; Meneghesso, G.; Zanoni, E.; Meneghini, M. UV-Based Technologies for SARS-CoV2 Inactivation: Status and Perspectives. Electronics 2021, 10, 1703. [Google Scholar] [CrossRef]
  26. Yoshikawa, A.; Hasegawa, R.; Morishita, T.; Nagase, K.; Yamada, S.; Grandusky, J.; Mann, J.; Miller, A.; Schowalter, L.J. Improve Efficiency and Long Lifetime UVC LEDs with Wavelengths between 230 and 237 Nm. Appl. Phys. Express 2020, 13, 022001. [Google Scholar] [CrossRef]
  27. Trivellin, N.; Piva, F.; Buffolo, M.; De Santi, C.; Zanoni, E.; Meneghesso, G.; Meneghini, M. UVC LED Reliability and Its Effect on Disinfection Systems Design. In Light-Emitting Devices, Materials, and Applications XXVII; Strassburg, M., Kim, J.K., Krames, M.R., Eds.; SPIE: Bellingham, WA, USA, 2023; p. 8. [Google Scholar]
  28. Glaab, J.; Ploch, C.; Kelz, R.; Stölmacker, C.; Lapeyrade, M.; Ploch, N.L.; Rass, J.; Kolbe, T.; Einfeldt, S.; Mehnke, F.; et al. Degradation of (InAlGa)N-Based UV-B Light Emitting Diodes Stressed by Current and Temperature. J. Appl. Phys. 2015, 118, 094504. [Google Scholar] [CrossRef]
  29. Piva, F.; De Santi, C.; Deki, M.; Kushimoto, M.; Amano, H.; Tomozawa, H.; Shibata, N.; Meneghesso, G.; Zanoni, E.; Meneghini, M. Stability and Degradation of AlGaN-Based UV-B LEDs: Role of Doping and Semiconductor Defects. Microelectron. Reliab. 2019, 100–101, 113418. [Google Scholar] [CrossRef]
  30. Buffolo, M.; de Santi, C.; Meneghini, M.; Rigon, D.; Meneghesso, G.; Zanoni, E. Long-Term Degradation Mechanisms of Mid-Power LEDs for Lighting Applications. Microelectron. Reliab. 2015, 55, 1754–1758. [Google Scholar] [CrossRef]
  31. Dalapati, P.; Yamamoto, K.; Egawa, T.; Miyoshi, M. Current-Induced Degradation Process in (In)AlGaN-Based Deep-UV Light-Emitting Diode Fabricated on AlN/Sapphire Template. Opt. Mater. 2020, 109, 110352. [Google Scholar] [CrossRef]
  32. Arques-Orobon, F.J.; Nuñez, N.; Vazquez, M.; González-Posadas, V. UV LEDs Reliability Tests for Fluoro-Sensing Sensor Application. Microelectron. Reliab. 2014, 54, 2154–2158. [Google Scholar] [CrossRef]
  33. Shen, C.-H.; Yang, R.-L.; Gong, H.-L.; Zhu, L.-H.; Gao, Y.-L.; Chen, G.-L.; Chen, Z.; Lu, Y. Optical Power Degradation Mechanisms in 271 Nm AlGaN-Based Deep Ultraviolet Light-Emitting Diodes. Opt. Express 2023, 31, 20265. [Google Scholar] [CrossRef]
  34. Meneghini, M.; Piva, F.; De Santi, C.; Trivellin, N.; Buffolo, M.; Roccato, N.; Brescancin, R.; Grigoletto, M.; Fiorimonte, D.; Einfeldt, S.; et al. UV LED Reliability: Degradation Mechanisms and Challenges. In Gallium Nitride Materials and Devices XVII; Morkoç, H., Fujioka, H., Schwarz, U.T., Eds.; SPIE: Bellingham, WA, USA, 2022; p. 43. [Google Scholar]
  35. Chichibu, S.F.; Nagata, K.; Oya, M.; Kasuya, T.; Okuno, K.; Ishiguro, H.; Saito, Y.; Takeuchi, T.; Shima, K. Operation-Induced Degradation Mechanisms of 275-Nm-Band AlGaN-Based Deep-Ultraviolet Light-Emitting Diodes Fabricated on a Sapphire Substrate. Appl. Phys. Lett. 2023, 122, 201105. [Google Scholar] [CrossRef]
  36. Huang, C.-Y.; Hsieh, W.-H.; Shao, T.-L.; Wu, C.-H.; Lu, T.-C. Degradation of High-Power UVC Light-Emitting Diodes via Emission-Activated Nitrogen Vacancy Generation. IEEE Trans. Electron. Devices 2023, 70, 3166–3171. [Google Scholar] [CrossRef]
  37. Glaab, J.; Haefke, J.; Ruschel, J.; Brendel, M.; Rass, J.; Kolbe, T.; Knauer, A.; Weyers, M.; Einfeldt, S.; Guttmann, M.; et al. Degradation Effects of the Active Region in UV-C Light-Emitting Diodes. J. Appl. Phys. 2018, 123, 104502. [Google Scholar] [CrossRef]
  38. Ruschel, J.; Glaab, J.; Beidoun, B.; Ploch, N.L.; Rass, J.; Kolbe, T.; Knauer, A.; Weyers, M.; Einfeldt, S.; Kneissl, M. Current-Induced Degradation and Lifetime Prediction of 310 Nm Ultraviolet Light-Emitting Diodes. Photonics Res. 2019, 7, B36. [Google Scholar] [CrossRef]
  39. Piva, F.; Pilati, M.; Buffolo, M.; Roccato, N.; Susilo, N.; Hauer Vidal, D.; Muhin, A.; Sulmoni, L.; Wernicke, T.; Kneissl, M.; et al. Degradation of AlGaN-Based UV-C SQW LEDs Analyzed by Means of Capacitance Deep-Level Transient Spectroscopy and Numerical Simulations. Appl. Phys. Lett. 2023, 122, 18. [Google Scholar] [CrossRef]
  40. Roccato, N.; Piva, F.; De Santi, C.; Buffolo, M.; Fregolent, M.; Pilati, M.; Susilo, N.; Vidal, D.H.; Muhin, A.; Sulmoni, L.; et al. Modeling the Electrical Degradation of AlGaN-Based UV-C LEDs by Combined Deep-Level Optical Spectroscopy and TCAD Simulations. Appl. Phys. Lett. 2023, 122, 16. [Google Scholar] [CrossRef]
  41. Ma, Z.; Cao, H.; Lin, S.; Li, X.; Zhao, L. Degradation and Failure Mechanism of AlGaN-Based UVC-LEDs. Solid. State Electron. 2019, 156, 92–96. [Google Scholar] [CrossRef]
  42. Xiu, H.; Zhang, Y.; Fu, J.; Ma, Z.; Zhao, L.; Feng, J. Degradation Behavior of Deep UV-LEDs Studied by Electro-Optical Methods and Transmission Electron Microscopy. Curr. Appl. Phys. 2019, 19, 20–24. [Google Scholar] [CrossRef]
  43. IESNA TM-21-11; Projecting Long Term Lumen Maintenance of LED Light Sources. Illuminating Engineering Society: New York, NY, USA, 2011.
  44. IESNA, TM-28-14; Projecting Long-Term Luminous Flux Maintenance of LED Lamps and Luminaries. Illuminating Engineering Society: New York, NY, USA, 2014.
  45. Arques-Orobon, F.J.; Vazquez, M.; Nuñez, N. Lifetime Analysis of Commercial 3 W UV-A LED. Crystals 2020, 10, 1083. [Google Scholar] [CrossRef]
  46. Tan, K.-Z.; Lee, S.-K.; Low, H.-C. LED Lifetime Prediction Under Thermal-Electrical Stress. IEEE Trans. Device Mater. Reliab. 2021, 21, 310–319. [Google Scholar] [CrossRef]
  47. Kochanowicz, M.; Zmojda, J.; Baranowska, A.; Kuwik, M.; Starzyk, B.; Lesniak, M.; Miluski, P.; Pisarski, W.A.; Pisarska, J.; Dorosz, J.; et al. Fluoroindate Glass Co-Doped with Yb3+/Ho3+ as a 2.85 Μm Luminescent Source for MID-IR Sensing. Sensors 2021, 21, 2155. [Google Scholar] [CrossRef]
  48. Kochanowicz, M.; Zmojda, J.; Miluski, P.; Baranowska, A.; Leich, M.; Schwuchow, A.; Jäger, M.; Kuwik, M.; Pisarska, J.; Pisarski, W.A.; et al. Tm 3+ /Ho 3+ Co-Doped Germanate Glass and Double-Clad Optical Fiber for Broadband Emission and Lasing above 2 Μm. Opt. Mater. Express 2019, 9, 1450. [Google Scholar] [CrossRef]
  49. Meneghini, M.; De Santi, C.; Tibaldi, A.; Vallone, M.; Bertazzi, F.; Meneghesso, G.; Zanoni, E.; Goano, M. Thermal Droop in III-Nitride Based Light-Emitting Diodes: Physical Origin and Perspectives. J. Appl. Phys. 2020, 127, 21. [Google Scholar] [CrossRef]
  50. Piva, F.; De Santi, C.; Deki, M.; Kushimoto, M.; Amano, H.; Tomozawa, H.; Shibata, N.; Meneghesso, G.; Zanoni, E.; Meneghini, M. Modeling the Degradation Mechanisms of AlGaN-Based UV-C LEDs: From Injection Efficiency to Mid-Gap State Generation. Photonics Res. 2020, 8, 1786. [Google Scholar] [CrossRef]
  51. Buffolo, M.; Magri, A.; De Santi, C.; Meneghesso, G.; Zanoni, E.; Meneghini, M. Gradual Degradation of InGaAs LEDs: Impact on Non-Radiative Lifetime and Extraction of Defect Characteristics. Materials 2021, 14, 1114. [Google Scholar] [CrossRef] [PubMed]
  52. Zhang, J.; Zhou, L.; Gao, Y.; Lunev, A.; Zhang, B.; Götz, W. Performance and Analysis of an Ultraviolet C-Band Light Emitting Diode with an Emission Wavelength of 268 Nm. Semicond. Sci. Technol. 2022, 37, 07LT01. [Google Scholar] [CrossRef]
  53. Chen, J.; Loeb, S.; Kim, J.-H. LED Revolution: Fundamentals and Prospects for UV Disinfection Applications. Environ. Sci. 2017, 3, 188–202. [Google Scholar] [CrossRef]
  54. Reed, N.G. The History of Ultraviolet Germicidal Irradiation for Air Disinfection. Public. Health Rep. 2010, 125, 15–27. [Google Scholar] [CrossRef]
  55. Liang, S.; Sun, W. Recent Advances in Packaging Technologies of AlGaN-Based Deep Ultraviolet Light-Emitting Diodes. Adv. Mater. Technol. 2022, 7, 2101502. [Google Scholar] [CrossRef]
Figure 1. View of the tested UVC LEDs after degradation process (in the bottom row is the view under the microscope).
Photonics 10 01326 g001
Figure 2. The procedure of LED testing.
Photonics 10 01326 g002
Figure 3. Changes (a) and derivative of changes (b) in OP of UVC LEDs in time.
Photonics 10 01326 g003
Figure 4. Predicted LED lifetimes L90, L80, L70.
Photonics 10 01326 g004
Figure 5. Relative (a) and average relative (b) changes in OP in time at constant housing temperature to relative changes of current.
Photonics 10 01326 g005
Figure 6. Relative changes in OP as a function of the temperature of the UVC LEDs’ housing before and after the degradation process; measurements were made with each emitter powered by its nominal current.
Photonics 10 01326 g006
Figure 7. Relative changes in LED voltage for maximum LED current (a) and for current equal to 10 mA (b) before (0 h) and after (1500 h) the degradation procedure in temperatures 20 °C and 60 °C.
Photonics 10 01326 g007
Figure 8. Peak wavelength λ (a) and FWHM (b) of LEDs before (0 h) and after (1500 h) the aging procedure in temperatures 20 °C and 60 °C.
Photonics 10 01326 g008
Table 3. Basic data of tested UVC LEDs.
LEDAbsolute
Maximum
Current Imax (mA)
*
OP at Current
(mW@mA)
*
Current During Degradation Procedure (mA)
**
Peak
Wavelength (nm)
**
FWHM (nm)
**
Package Size/
Total Pad Area
*
Maximum Junction Temperature
(°C)
*
115010.5@1009027113SMD 3.5 × 3.5 mm
TP (4.29 mm2)
Contacts (4.29 mm2)
85
215032@10010527714SMD 5 × 5 mm
TP (13.29 mm2)
Contacts (4 mm2)
85
3400100@45035027811SMD 6.5 × 6.5 mm
TP (18.9 mm2)
Contacts (13.86 mm2)
85
450050@35035028011SMD 3.5 × 3.5 mm
TP (4.88 mm2)
Contacts (3.15 mm2)
85
550055@35035028011SMD 3.5 × 3.5 mm
no TP
Contacts (10.5 mm2)
85
615052–72@15015027714SMD STAR 20 mm
no data
no data
no data
*—manufacturers’ data; **—measured at a heat sink temperature of 20 °C; TP—thermal pad.
Table 4. Coefficients of functions approximating relative changes in OP of tested UVC LEDs during aging tests (OP0, A1, τ1, A2, τ2), R2—coefficient of determination, τ—average lifetimes.
CoefficientLED1LED2LED3 *LED4LED5LED6
OP00.5650.7760.1520.7590.6970.535
A10.1250.0440.4140.0730.0970.108
τ136.0727.15437.6723.6632.6343.48
A20.3090.1780.4450.1620.1990.349
τ2888.9754.2118.4579.7755.0647.1
R20.9950.9970.9930.9990.9990.999
τ (h)875748100570740635
* For LED3, partially catastrophic degradation occurred during testing.
Table 5. Temperature coefficient of OP of the tested LEDs before ∆P/T0h and after 1500 h of degradation ∆P/T1500h; LED3 was excluded from the list due to partially catastrophic degradation.
Optical Power Temperature CoefficientUnitLED1LED2LED4LED5LED6Average
OP/∆T0h(%/°C)−0.11−0.18−0.21−0.10−0.18−0.15
OP/∆T1500h(%/°C)−0.03−0.15−0.22−0.17−0.04−0.12
Table 6. WPE, EQE, and EE of tested LEDs.
LED1LED2LED3LED4LED5LED6
EQE (%)2.37.15.03.23.57.7
WPE (%)1.61.91.72.52.61.4
EE (%)702634777418
Disclaimer/Publisher’s Note: The statements, opinions and data contained in all publications are solely those of the individual author(s) and contributor(s) and not of MDPI and/or the editor(s). MDPI and/or the editor(s) disclaim responsibility for any injury to people or property resulting from any ideas, methods, instructions or products referred to in the content.