Assessment of the Human Retinal Neural Selectivity to Square Gratings’ Orientation with the Multifocal and Pattern Electroretinograms

 ,
,  ,
,  ,
,  and
and
Abstract
:1. Introduction
2. Materials and Methods
2.1. Study Design and Subjects
2.2. ERG Assessment
2.3. Evaluation Conditions
2.4. Statistical Analysis
3. Results
3.1. Impact of Illumination Conditions
3.2. Sample Characteristics
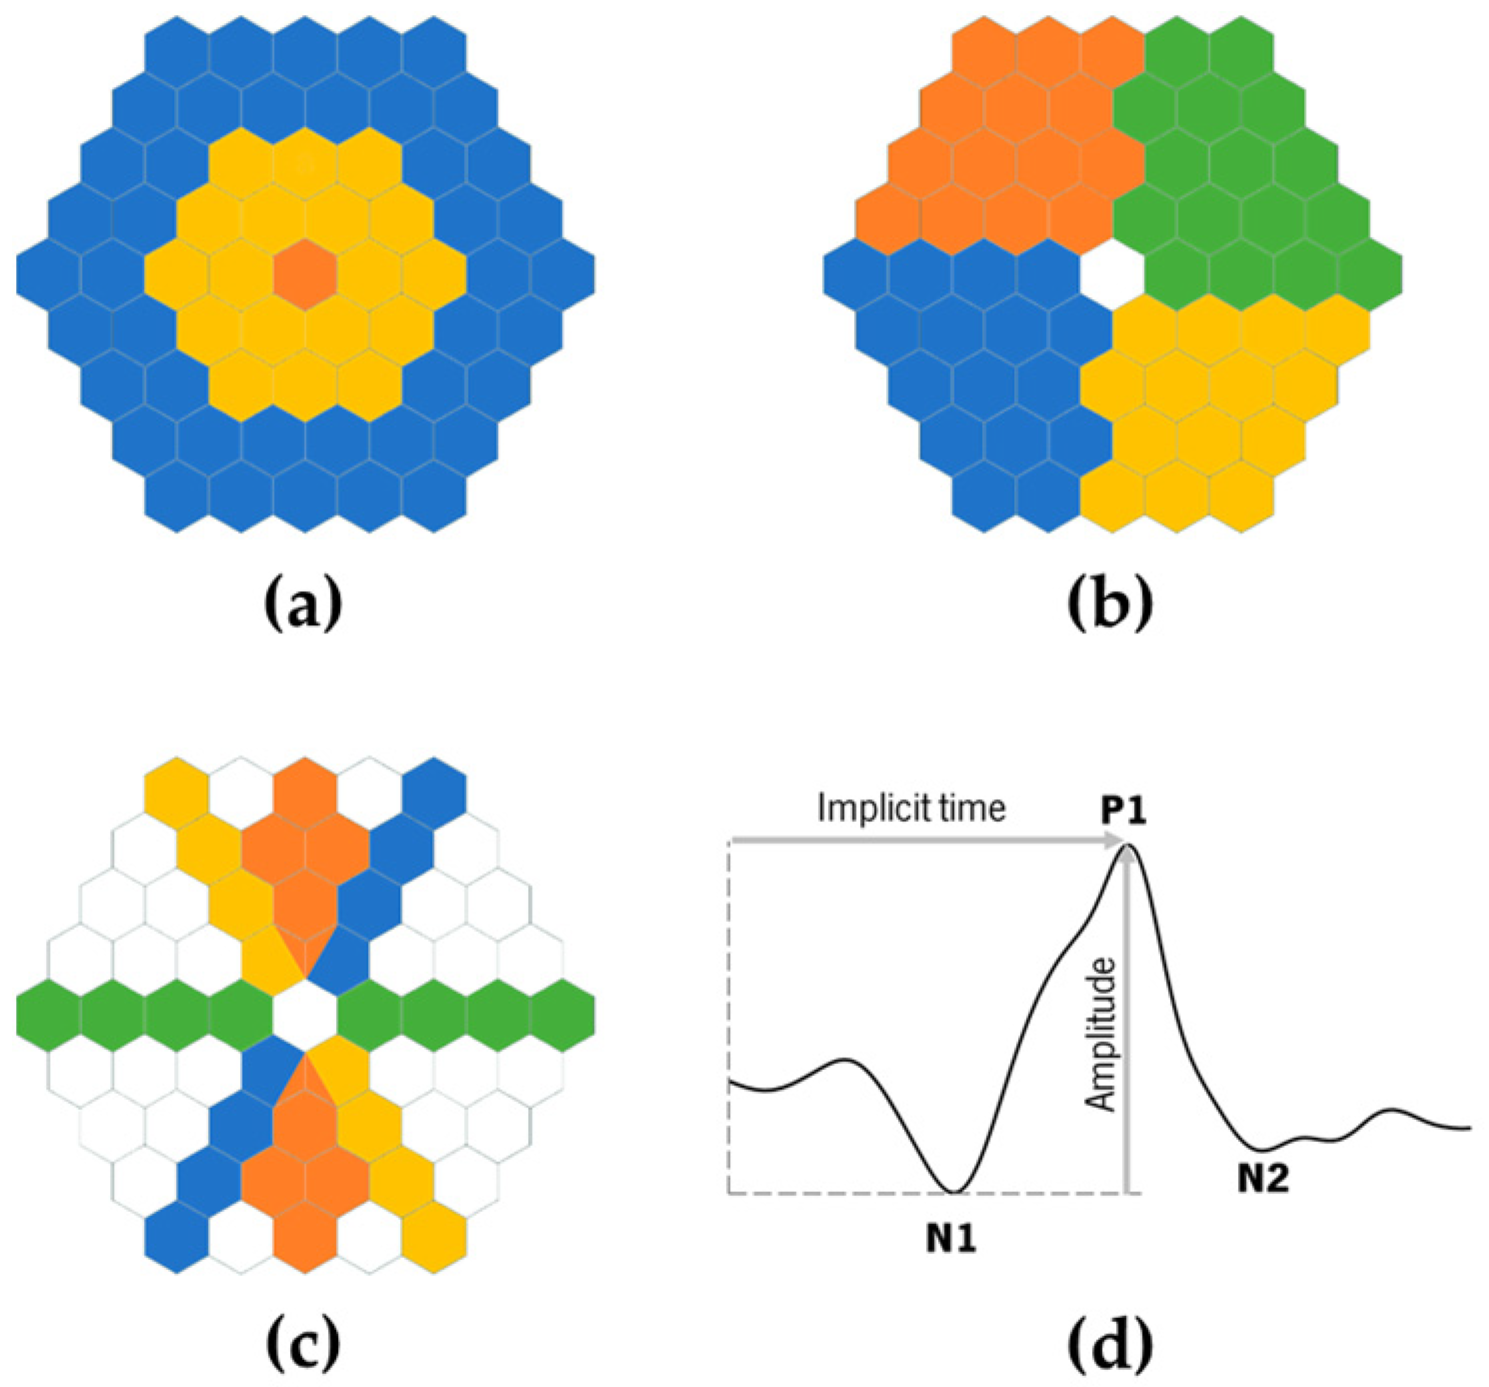
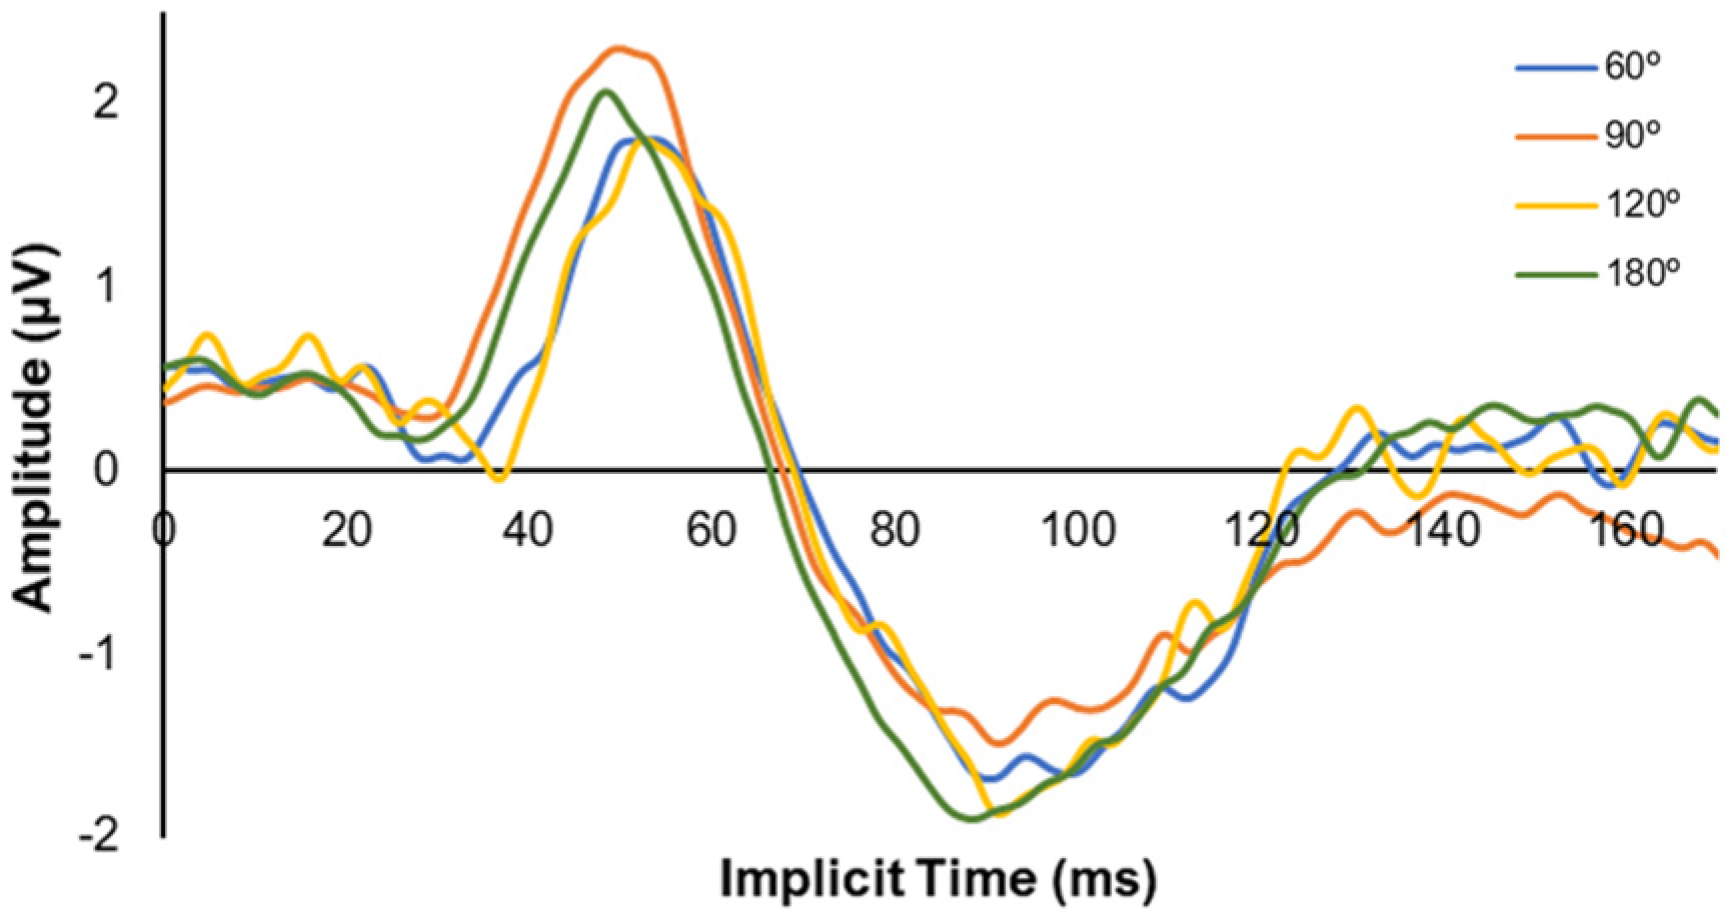
3.3. mfERG Response
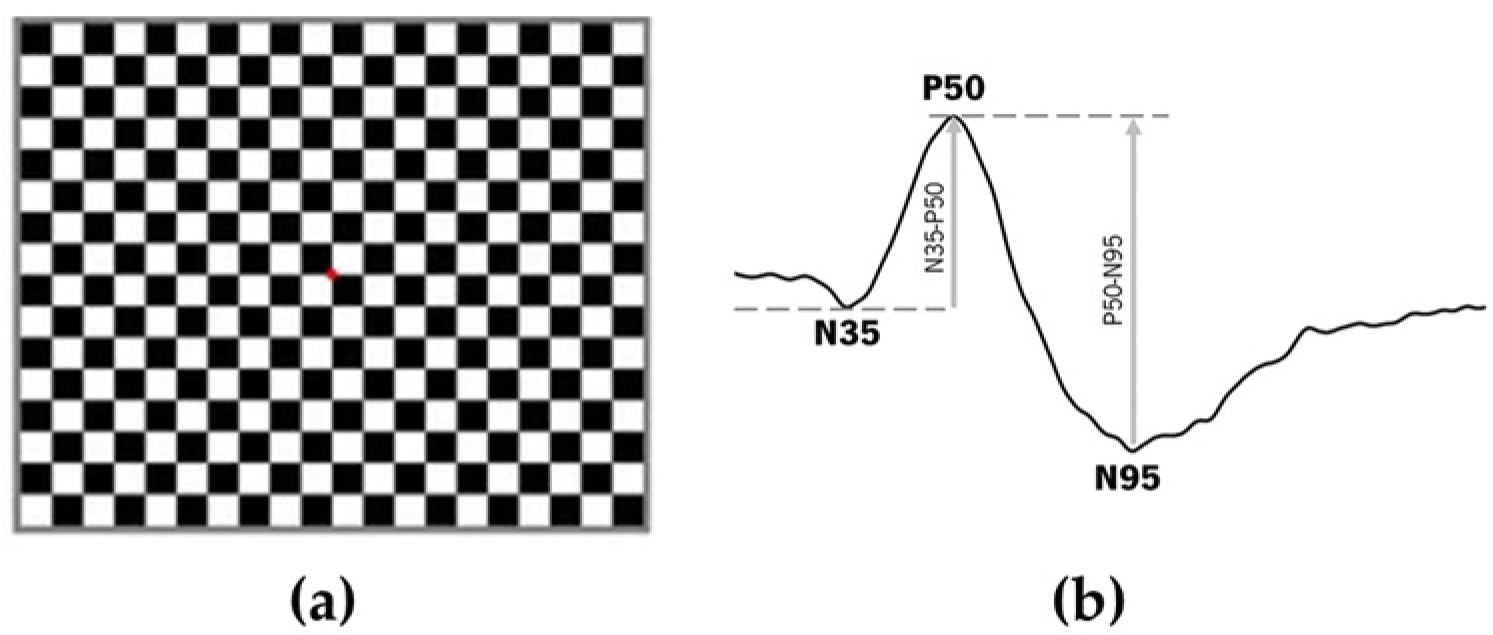
3.4. PERG Response
4. Discussion
5. Conclusions
Author Contributions
Funding
Institutional Review Board Statement
Informed Consent Statement
Data Availability Statement
Conflicts of Interest
References
- Gwiazda, J.; Grice, K.; Held, R.; McLellan, J.; Thorn, F. Astigmatism and the development of myopia in children. Vis. Res. 2000, 40, 1019–1026. [Google Scholar] [CrossRef]
- Serrano-Pedraza, I.; Grady, J.P.; Read, J.C.A. Spatial frequency bandwidth of surround suppression tuning curves. J. Vis. 2012, 12, 24. [Google Scholar] [CrossRef]
- Queirós, A.; Amorim-De-Sousa, A.; Lopes-Ferreira, D.; Villa-Collar, C.; Gutiérrez, R.; González-Méijome, J.M. Relative peripheral refraction across 4 meridians after orthokeratology and LASIK surgery. Eye Vis. 2018, 5, 12. [Google Scholar] [CrossRef] [PubMed]
- Atchison, D.A.; Pritchard, N.; Schmid, K.L. Peripheral refraction along the horizontal and vertical visual fields in myopia. Vis. Res. 2006, 46, 1450–1458. [Google Scholar] [CrossRef]
- Charman, W.N. Myopia, posture and the visual environment. Ophthalmic Physiol. Opt. 2011, 31, 494–501. [Google Scholar] [CrossRef]
- Kee, C.-S.; Hung, L.-F.; Qiao-Grider, Y.; Roorda, A.; Smith, E.L. Effects of Optically Imposed Astigmatism on Emmetropization in Infant Monkeys. Investig. Ophthalmol. Vis. Sci. 2004, 45, 1647–1659. [Google Scholar] [CrossRef]
- Howland, H.C. A possible role for peripheral astigmatism in the emmetropization of the eye. In Proceedings of the 13th International Myopia Conference, Tubingen, Germany, 26–29 July 2010. [Google Scholar]
- Hung, L.-F.; Ramamirtham, R.; Huang, J.; Qiao-Grider, Y.; Smith, E.L. Peripheral Refraction in Normal Infant Rhesus Monkeys. Investig. Ophthalmol. Vis. Sci. 2008, 49, 3747–3757. [Google Scholar] [CrossRef]
- Smith, E.I.; Greeman, N.; Ho, A.; Holden, B. Methods and Apparatuses for Altering Relative Curvature of Field and Positions of Peripheral, off-Axis Focal Positions. U.S. Patent 7.025.460 B2, 25 June 2006. [Google Scholar]
- Pärssinen, O. Astigmatism and school myopia. Acta Ophthalmol. 2009, 69, 786–790. [Google Scholar] [CrossRef] [PubMed]
- Chamberlain, P.; Peixoto-De-Matos, S.C.; Logan, N.S.; Ngo, C.; Jones, D.; Young, G. A 3-year Randomized Clinical Trial of MiSight Lenses for Myopia Control. Optom. Vis. Sci. 2019, 96, 556–567. [Google Scholar] [CrossRef] [PubMed]
- Queirós, A.; Lopes-Ferreira, D.; González-Méijome, J.M. Astigmatic Peripheral Defocus with Different Contact Lenses: Review and Meta-Analysis. Curr. Eye Res. 2016, 41, 1005–1015. [Google Scholar] [CrossRef]
- González-Méijome, J.M.; Peixoto-De-Matos, S.C.; Faria-Ribeiro, M.; Lopes-Ferreira, D.P.; Jorge, J.; Legerton, J.; Queiros, A. Strategies to Regulate Myopia Progression with Contact Lenses: A review. Eye Contact Lens Sci. Clin. Pract. 2016, 42, 24–34. [Google Scholar] [CrossRef]
- Queirós, A.; González-Méijome, J.M.; Jorge, J.; Villa-Collar, C.; Gutiérrez, A.R. Peripheral Refraction in Myopic Patients after Orthokeratology. Optom. Vis. Sci. 2010, 87, 323–329. [Google Scholar] [CrossRef]
- Gifford, K.L.; Gifford, P.; Hendicott, P.L.; Schmid, K. Stability of peripheral refraction changes in orthokeratology for myopia. Contact Lens Anterior Eye 2019, 43, 44–53. [Google Scholar] [CrossRef] [PubMed]
- Pauné, J.; Queiros, A.; Lopes-Ferreira, D.; Faria-Ribeiro, M.; Quevedo, L.; Gonzalez-Meijome, J.M. Efficacy of a Gas Permeable Contact Lens to Induce Peripheral Myopic Defocus. Optom. Vis. Sci. 2015, 92, 596–603. [Google Scholar] [CrossRef]
- Amorim-De-Sousa, A.; Schilling, T.; Fernandes, P.; Seshadri, Y.; Bahmani, H.; González-Méijome, J.M. Blue light blind-spot stimulation upregulates b-wave and pattern ERG activity in myopes. Sci. Rep. 2021, 11, 9273. [Google Scholar] [CrossRef] [PubMed]
- Queirós, A.; Pereira-Da-Mota, A.F.; Costa, J.; Amorim-De-Sousa, A.; Fernandes, P.R.B.; González-Méijome, J.M. Retinal Response of Low Myopes during Orthokeratology Treatment. J. Clin. Med. 2020, 9, 2649. [Google Scholar] [CrossRef] [PubMed]
- Amorim-De-Sousa, A.; Macedo-De-Araújo, R.; Fernandes, P.; Queirós, A.; González-Méijome, J.M. Multifocal Electroretinogram in Keratoconus Patients without and with Scleral Lenses. Curr. Eye Res. 2021, 46, 1732–1741. [Google Scholar] [CrossRef] [PubMed]
- Kader, M.A. Electrophysiological study of myopia. Saudi J. Ophthalmol. 2011, 26, 91–99. [Google Scholar] [CrossRef]
- Chin, M.P.; Chu, P.H.W.; Cheong, A.M.Y.; Chan, H.H.L. Human Electroretinal Responses to Grating Patterns and Defocus Changes by Global Flash Multifocal Electroretinogram. PLoS ONE 2015, 10, e0123480. [Google Scholar] [CrossRef]
- Ho, W.-C.; Wong, O.-Y.; Chan, Y.-C.; Wong, S.-W.; Kee, C.-S.; Chan, H.H.-L. Sign-dependent changes in retinal electrical activity with positive and negative defocus in the human eye. Vis. Res. 2012, 52, 47–53. [Google Scholar] [CrossRef]
- Trick, G.L.; Wintermeyer, D.H. Spatial and temporal frequency tuning of pattern-reversal retinal potentials. Investig. Ophthalmol. Vis. Sci. 1982, 23, 774–779. [Google Scholar]
- Odom, J.V.; Maida, T.M.; Dawson, W.W. Pattern evoked retinal response (PERR) in human: Effects of spatial frequency, temporal frequency, luminance and defocus. Curr. Eye Res. 1982, 2, 99–108. [Google Scholar] [CrossRef] [PubMed]
- Sachs, M.B.; Nachmias, J.; Robson, J.G. Spatial-Frequency Channels in Human Vision. J. Opt. Soc. Am. 1971, 61, 1176–1186. [Google Scholar] [CrossRef] [PubMed]
- Greenlee, M.W. Spatial frequency discrimination of band-limited periodic targets: Effects of stimulus contrast, bandwidth and retinal eccentricity. Vis. Res. 1992, 32, 275–283. [Google Scholar] [CrossRef] [PubMed]
- Hood, N.C.; Frishman, L.J.; Saszik, S.; Viswanathan, S. Retinal origins of the primate multifocal ERG: Implications for the human response. Investig. Ophthalmol. Vis. Sci. 2002, 43, 1673–1685. [Google Scholar]
- Hood, D.C. Assessing retinal function with the multifocal technique. Prog. Retin. Eye Res. 2000, 19, 607–646. [Google Scholar] [CrossRef]
- Thompson, D.; Drasdo, N. The origins of luminance and pattern responses of the pattern electroretinogram. Int. J. Psychophysiol. 1994, 16, 219–227. [Google Scholar] [CrossRef]
- Burkhardt, D.A. Contrast processing by ON and OFF bipolar cells. Vis. Neurosci. 2010, 28, 69–75. [Google Scholar] [CrossRef]
- Bach, M.; Brigell, M.G.; Hawlina, M.; Holder, G.E.; Johnson, M.A.; McCulloch, D.; Meigen, T.; Viswanathan, S. ISCEV standard for clinical pattern electroretinography (PERG): 2012 update. Doc. Ophthalmol. 2012, 126, 1–7. [Google Scholar] [CrossRef]
- Hoffmann, M.B.; Bach, M.; Kondo, M.; Li, S.; Walker, S.; Holopigian, K.; Viswanathan, S.; Robson, A.G. ISCEV standard for clinical multifocal electroretinography (mfERG) (2021 update). Doc. Ophthalmol. 2021, 142, 5–16. [Google Scholar] [CrossRef]
- Hood, D.C.; Bach, M.; Brigell, M.; Keating, D.; Kondo, M.; Lyons, J.S.; Marmor, M.F.; McCulloch, D.L.; Plamowski-Wolfe, A.M. ISCEV standard for clinical multifocal electroretinography (mfERG) (2011 edition). Doc. Ophthalmol. 2012, 124, 1–13. [Google Scholar] [CrossRef]
- Amorim-De-Sousa, A.; Moreira, L.; Macedo-De-Araújo, R.; Amorim, A.; Jorge, J.; Fernandes, P.R.; Queirós, A.; González-Méijome, J.M. Impact of contact lens materials on the mfERG response of the human retina. Doc. Ophthalmol. 2019, 140, 103–113. [Google Scholar] [CrossRef]
- Mazinani, B.A.E.; Repas, T.; Weinberger, A.W.A.; Vobig, M.A.; Walter, P. Amplitude calculation in multifocal ERG: Comparison of repeatability in 30 Hz flicker and first order kernel stimulation. Graefe’s Arch. Clin. Exp. Ophthalmol. 2006, 245, 338–344. [Google Scholar] [CrossRef]
- Yoshii, M.; Yanashima, K.; Wakaguri, T.; Sakemi, F.; Kikuchi, Y.; Suzuki, S.; Okisaka, S. A basic investigation of multifocal electroretinogram: Reproducibility and effect of luminance. Jpn. J. Ophthalmol. 2000, 44, 122–127. [Google Scholar] [CrossRef] [PubMed]
- Schimitzek, T.; Bach, M. The influence of luminance on the multifocal ERG. Doc. Ophthalmol. 2006, 113, 187–192. [Google Scholar] [CrossRef] [PubMed]
- Korth, M. Pattern-evoked responses and luminance-evoked responses in the human electroretinogram. J. Physiol. 1983, 337, 451–469. [Google Scholar] [CrossRef] [PubMed]
- Schall, J.; Perry, V.; Leventhal, A. Retinal ganglion cell dendritic fields in old-world monkeys are oriented radially. Brain Res. 1986, 368, 18–23. [Google Scholar] [CrossRef]
- Sasaki, Y.; Rajimehr, R.; Kim, B.W.; Ekstrom, L.B.; Vanduffel, W.; Tootell, R.B. The Radial Bias: A Different Slant on Visual Orientation Sensitivity in Human and Nonhuman Primates. Neuron 2006, 51, 661–670. [Google Scholar] [CrossRef]
- Sjöstrand, J.; Popovic, Z.; Conradi, N.; Marshall, J. Morphometric study of the displacement of retinal ganglion cells subserving cones within the human fovea. Graefe’s Arch. Clin. Exp. Ophthalmol. 1999, 237, 1014–1023. [Google Scholar] [CrossRef]
- Venkataraman, A.P.; Winter, S.; Rosén, R.; Lundström, L. Choice of Grating Orientation for Evaluation of Peripheral Vision. Optom. Vis. Sci. 2016, 93, 567–574. [Google Scholar] [CrossRef]
- Jonas, J.B.; Ang, M.; Cho, P.; Guggenheim, J.A.; He, M.G.; Jong, M.; Logan, N.S.; Liu, M.; Morgan, I.; Ohno-Matsui, K.; et al. IMI Prevention of Myopia and Its Progression. Investig. Ophthalmol. Vis. Sci. 2021, 62, 6. [Google Scholar] [CrossRef]
- Faria-Ribeiro, M.; Queiros, A.; Lopes-Ferreira, D.; Jorge, J.; Gonzalez-Meijome, J.M. Peripheral Refraction and Retinal Contour in Stable and Progressive Myopia. Optom. Vis. Sci. 2013, 90, 9–15. [Google Scholar] [CrossRef] [PubMed]
- Wallman, J.; Winawer, J. Homeostasis of Eye Growth and the Question of Myopia. Neuron 2004, 43, 447–468. [Google Scholar] [CrossRef]
- Neil Charman, W.; Radhakrishnan, H. Peripheral refraction and the development of refractive error: A review. Ophthalmic Physiol. Opt. 2010, 30, 321–338. [Google Scholar] [CrossRef] [PubMed]
- Vyas, S.A.; Kee, C.-S. Early Astigmatism Can Alter Myopia Development in Chickens. Investig. Ophthalmol. Vis. Sci. 2021, 62, 27. [Google Scholar] [CrossRef] [PubMed]
- Langrová, H.; Jägle, H.; Zrenner, E.; Kurtenbach, A. The multifocal pattern electroretinogram (mfPERG) and cone-isolating stimuli. Vis. Neurosci. 2007, 24, 805–816. [Google Scholar] [CrossRef] [PubMed]
- von Helmholtz, H.L.F. On the Sensations of Tone as a Physiological Basis for the Theory of Music; Longmans, Green, and Co.: London, UK, 1875. [Google Scholar]
- Thibos, L.N.; Still, D.L.; Bradley, A. Characterization of spatial aliasing and contrast sensitivity in peripheral vision. Vis. Res. 1996, 36, 249–258. [Google Scholar] [CrossRef] [PubMed]
- Campbell, F.W.; Carpenter, R.H.S.; Levinson, J.Z. Visibility of aperiodic patterns compared with that of sinusoidal gratings. J. Physiol. 1969, 204, 283–298. [Google Scholar] [CrossRef]
- Allenmark, F.; Read, J.C.A. Detectability of sine- versus square-wave disparity gratings: A challenge for current models of depth perception. J. Vis. 2010, 10, 17. [Google Scholar] [CrossRef] [PubMed]
- Campbell, F.W.; Robson, J.G. Application of fourier analysis to the visibility of gratings. J. Physiol. 1968, 197, 551–566. [Google Scholar] [CrossRef]


| Luminance (cd/m2) | Illuminance (lux) | (%) | ||
|---|---|---|---|---|
| mfERG | PERG | |||
| 60° | 47.43 ± 0.62 | 103.12 ± 3.37 | - | 97.88 ± 0.09 |
| 90° | 50.81 ± 0.78 | 105.10 ± 3.20 | 139.83 ± 0.53 | 97.43 ± 0.07 |
| 120° | 48.47 ± 0.62 | 102.21 ± 3.29 | - | 97.83 ± 0.06 |
| 180° | 47.02 ± 1.12 | 108.28 ± 2.48 | 136.10 ± 0.53 | 97.73 ± 0.09 |
| Gender | 3 women 6 men |
| Age (years) | 32.9 ± 7.7 |
| M (D) | −0.45 ± 1.15 |
| J0 (D) | 0.05 ± 0.35 |
| J45 (D) | 0.00 ± 0.03 |
| HCVA (logMAR) | −0.08 ± 0.08 |
| LCVA (logMAR) | 0.08 ± 0.06 |
| Mydriatic Pupil Diameter (mm) | 7.55 ± 0.46 |
| Grids Orientation | p-Value | |||||
|---|---|---|---|---|---|---|
| 60° | 90° | 120° | 180° | |||
| Total retina | 9.48 [1.05] | 11.57 [4.82] | 10.49 [3.77] | 10.55 [5.70] | 0.706 | |
| Eccentricity | Fovea | 85.60 [27.80] | 73.86 [28.10] | 81.13 [54.74] | 82.21 [18.29] | 0.314 |
| Parafovea | 18.70 [9.20] | 21.92 [10.02] | 21.36 [13.94] | 25.91 [8.16] | 0.081 | |
| Periphery | 7.84 [1.00] | 8.48 [3.91] | 8.33 [4.77] | 7.97 [4.66] | 0.506 | |
| Quadrants | Top-Right | 12.52 [2.72] | 12.57 [4.65] | 12.00 [2.99] | 12.87 [3.38] | 0.392 |
| Top-Left | 12.14 [5.11] | 14.61 [7.88] | 14.54 [7.20] | 12.69 [11.20] | 0.115 | |
| Bottom-Left | 10.49 [6.18] | 14.42 [4.19] | 10.13 [6.48] | 12.69 [1.95] | 0.204 | |
| Bottom-Right | 10.81 [4.80] | 12.06 [5.04] | 14.00 [8.14] | 14.18 [5.35] | 0.072 | |
| Meridians | Horizontal | 15.19 [11.06] | 11.27 [2.43] | 18.79 [7.90] | 19.64 [2.89] | 0.001 * |
| Vertical | 13.57 [3.84] | 19.61 [6.71] | 13.33 [7.06] | 13.19 [7.11] | 0.392 | |
| 60° | 15.30 [6.81] | 12.46 [4.72] | 12.38 [3.46] | 16.51 [12.30] | 0.035 * | |
| 120° | 10.02 [3.53] | 14.10 [8.06] | 12.02 [5.22] | 15.86 [16.05] | 0.042 * | |
Disclaimer/Publisher’s Note: The statements, opinions and data contained in all publications are solely those of the individual author(s) and contributor(s) and not of MDPI and/or the editor(s). MDPI and/or the editor(s) disclaim responsibility for any injury to people or property resulting from any ideas, methods, instructions or products referred to in the content. |
© 2023 by the authors. Licensee MDPI, Basel, Switzerland. This article is an open access article distributed under the terms and conditions of the Creative Commons Attribution (CC BY) license (https://creativecommons.org/licenses/by/4.0/).
Share and Cite
Amorim-de-Sousa, A.; Fernandes, P.; López-Gil, N.; Queirós, A.; González-Méijome, J.M. Assessment of the Human Retinal Neural Selectivity to Square Gratings’ Orientation with the Multifocal and Pattern Electroretinograms. Photonics 2023, 10, 526. https://doi.org/10.3390/photonics10050526
Amorim-de-Sousa A, Fernandes P, López-Gil N, Queirós A, González-Méijome JM. Assessment of the Human Retinal Neural Selectivity to Square Gratings’ Orientation with the Multifocal and Pattern Electroretinograms. Photonics. 2023; 10(5):526. https://doi.org/10.3390/photonics10050526
Chicago/Turabian StyleAmorim-de-Sousa, Ana, Paulo Fernandes, Noberto López-Gil, António Queirós, and José M. González-Méijome. 2023. "Assessment of the Human Retinal Neural Selectivity to Square Gratings’ Orientation with the Multifocal and Pattern Electroretinograms" Photonics 10, no. 5: 526. https://doi.org/10.3390/photonics10050526