Abstract
In the last decade, terahertz (THz) technologies have been introduced to the detection, identification, and quantification of biomolecules in various biological samples. This review focuses on substances that represent important biomarkers in the urine associated with various cancers and their treatments. From a diagnostic point of view, urine liquid biopsy is particularly important because it allows the non-invasive and rapid collection of large volumes of samples. In this review, the THz spectral responses of substances considered metabolic biomarkers in urine and obtained in previous studies are collected. In addition, the findings from the relatively small number of prior studies that have already been carried out on urine samples are summarised. In this context, we also present the different THz methods used for urine analysis. Finally, a brief discussion is given, presenting perspectives for future research in this field, interpreted based on the results of previous studies. This work provides important information on the further application of THz techniques in biomedicine for detecting and monitoring urinary biomarkers for various diseases, including cancer.
1. Introduction
The term “biomarker” first appeared in geology and was later transferred formally to the biomedical field in the 1970s. The first scientific paper published in 1976 focused on plasma biomarkers [1]. Only four years later, Webb and Lin published their research with chromatography on urinary fibronectin, a potential biomarker for prostatic cancer diagnosis [2]. However, biomarkers in biomedicine are important for early diagnosis, treatment, and monitoring of the prognosis of various diseases [3,4,5]. Most biomarker studies have been conducted on blood, as shown by the search results in the Web of Science (WoS) database, which show that the scientific community is more focused on blood biomarkers than urine biomarkers. When searching the scientific papers in the database, we found more than 48,000 papers on blood biomarkers and only 12,325 on urinary biomarkers, of which just over 3800 are focused on cancer (Figure 1A).
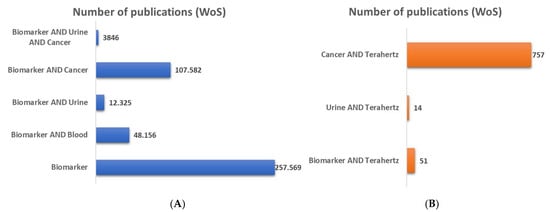
Figure 1.
Number of scientific publications on biomarkers (A) and terahertz (B) with phrase searching in the WoS database.
The hot topic on biomarkers today is liquid biopsy used as a minimally invasive detection method for cancer molecular profiling of blood and other body fluids, including urine, from which circulating metabolites, extracellular nucleic acids, circulating tumour DNA, circulating tumour cells, and even exosomes (i.e., lipid bilayer membrane vesicles released from most cells) can be isolated [6,7]. The urine liquid biopsy method is non-invasive and particularly useful for screening various analytes and early detection of urogenital cancers and various other malignancies [8]. One of the new techniques in liquid biopsy, promising in diagnosing and treating various diseases, is metabolomics, which studies the end and intermediate metabolic products of a biological system (cell, organ or whole organism) [9,10,11]. Individual metabolites can be linked to the characteristics of specific diseases and can play a major role in the diagnosis and prognosis of disease. One of the media containing end and intermediate metabolic products in humans is urine, which is discussed in this work. Compared to blood, urine has a relatively low concentration of proteins and a large number of low-molecular-weight compounds, i.e., metabolites, which are the source of disease biomarkers [12].
The last few decades have witnessed impressive advances in the development of new analytical methods and sensors for diagnosing and monitoring various diseases via analysis of metabolic biomarkers in body fluids that are moving in and/or out of the body. Among them, the most used methods for urine sample analysis for metabolic biomarker detection are nuclear magnetic resonance (NMR) spectroscopy [12,13,14,15] and mass spectrometry [16,17]. Mass spectrometry (MS) works by ionizing the biomolecules in the sample and then separating them based on their mass-to-charge ratio. The resulting mass spectrum can be used to identify the biomarkers present in the sample. The MS method is often combined with gas chromatography (GC) or high-performance liquid chromatography (HPLC) [18,19,20]. HPLC works by passing the urine sample through a column that contains a stationary phase, which separates the biomolecules based on their chemical properties. The separated biomarkers can then be detected using a variety of methods, including UV detection, fluorescence detection, or MS [21,22,23]. Also, some other spectroscopic techniques were applied for urinary metabolic biomarkers characterisation, such as Fourier transform infrared (FTIR) spectroscopy [24,25,26,27] and Raman spectroscopy [28,29,30]. Still, the most used method for biomarker analysis is enzyme-linked immunosorbent assay (ELISA) [31,32,33] and fluorescence polarisation immunoassay (FPIA) [34,35,36,37]. ELISA involves the use of antibodies that are specific to the biomarker of interest. The antibodies are immobilised on a solid surface, such as a microplate, and the urine sample is added to the plate. If the biomarker is present in the sample, it will bind to the antibodies, and the bound biomarker can be detected using a colourimetric or fluorescent signal. FPIA works by irradiating reaction mixtures containing fluorophore-labelled molecules with plane-polarised light and then detecting the fluorescence generated by this irradiation. In general, FPIA is based on the competitive binding of specific antibodies with the analyte under test and the fluorescently labelled analyte. As it is a homogeneous analytical method, it does not require separation of the resulting compounds and analyte concentrations can be determined within minutes.
Recently, a lot of research has focused on biosensors and microfluidics, which have several advantages over traditional analytical methods, such as fast real-time analysis, minimal sample preparation and on-site or field measurements [38,39]. Electrochemical biosensors detect biomarkers in urine samples based on their electrochemical properties. The biosensor typically consists of an electrode coated with a biomolecule-specific receptor, such as an antibody or aptamer. When the urine sample is added to the biosensor, the biomarker of interest will bind to the receptor, causing a change in the electrical signal that can be detected and quantified. Electro-optical technological solutions can also be developed within the terahertz (THz) frequency band, which spans between mid-infrared (MIR) and microwave regions. The THz frequency region is in the range of 0.1–10 THz and the corresponding wavelength range is 30–3000 μm [40].
THz spectroscopy is a relatively new technique already used to analyse urine samples and biomarkers. More than 50 publications were found in the WoS database by phrase searching (Figure 1B). This method is popular in biomedicine due to several advantages: low emissivity, low photon energy level and non-ionisation-related hazards to biological samples. Furthermore, the THz spectroscopic technique detects the collective vibration and rotation modes of complex molecules, which are compound-specific and can be used to identify the presence of metabolites or other substances in liquid media like urine or blood. The introduction of metamaterials (MM) in the THz band has opened additional possibilities in the last ten years for new materials design that can sense bioactive substances such as proteins and nucleic acids [41,42,43,44,45,46,47,48]. THz radiation was already used for the protein concentration analysis considering non-proteinuria and proteinuria, which can indicate certain diseases, such as kidney disease [49]. Furthermore, glucose content in urine linked to diabetes [45] was also determined by THz radiation as well as nitriles in urine vapours during chemotherapy [50]. Moreover, THz spectroscopy has been used to detect bacteria species and other substances in urine samples [51,52].
All this initial research on urine samples opens new questions and possibilities for the biomedical application of THz waves in detecting biomarkers in body fluids such as urine. Although not much THz research has been conducted on the urine itself, there are many results in the literature on metabolites present in urine that are important biomarkers for various diseases, including cancer. For this reason, we have prepared this review, where we present findings from a relatively small number of studies that have already been performed on urine samples and then focus on metabolic biomarkers that occur in urine and whose THz spectra have been reported in other studies. Several databases for urine metabolites can be found on the web. The Human Metabolome Database (HMDB) provides comprehensive reference information about human metabolites and their associated biological, physiological, and chemical properties [53]. The Urine Metabolome database [54] is integrated into the HMDB and allows users to browse the data from different views, such as metabolites, concentrations, and diseases. This database contains the complete set of 3564 detected human urine metabolite species, their structures, concentrations, related references in the literature, and links to their known disease associations. Collected data on their THz responses can thus further enrich the already existing databases.
2. Urinary Metabolic Biomarkers in Cancer Diagnostics
The main chemical compounds of urine include metabolites (e.g., urea, uric acid, creatinine, bilirubin, glucose), proteins (e.g., albumin, cystatin) and different volatile organic compounds (VOCs), which all act as urinary biomarkers for different diseases diagnosis [55,56]. Figure 2 outlines the different fields of study that address each group of urinary biomarkers. The analysis of small molecules of metabolites present in urine samples is addressed by so-called urinary metabolomics, which uses advanced analytical techniques such as MS and NMR spectroscopy to identify and quantify metabolites in urine samples. Urinary metabolomics is used to analyse a wide range of metabolites, such as amino acids, lipids, and carbohydrates. By analysing metabolites in urine samples, researchers can gain insight into the metabolic pathways and biochemical processes that are altered in response to different diseases or conditions. From a metabolomics point of view, urine is a biological fluid that is difficult to fully understand due to its chemical complexity. Urine contains residues of the metabolic breakdown of many foods, drugs, environmental pollutants, metabolites of endogenous wastes and bacterial by-products [54]. The urine composition often fluctuates between individuals or periods within the same individual. These fluctuations indicate urine sensitivity, which reflects normal physiological changes in the body as well as abnormal pathological changes.
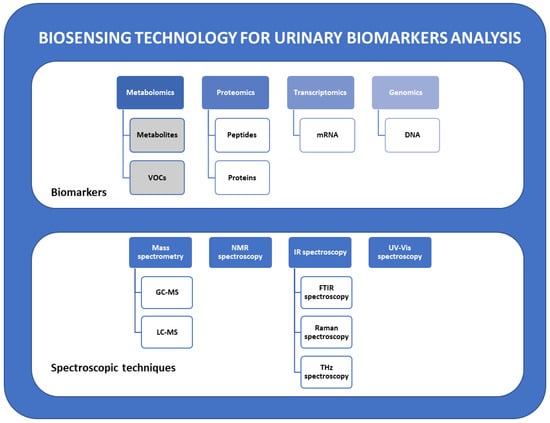
Figure 2.
Schematics of urinary biomarkers according to the type of chemical substance and spectroscopic methods for urinary biomarker analysis.
A recent metabolomics approach is “volatilomics”, which studies volatile organic compounds (VOCs) produced in the human body, which can also be released in the urine [57]. VOCs are low-molecular-weight substances formed as end products of cellular metabolism and have a high vapour pressure and a low boiling point (below 250 °C). Compared to other types of metabolites, they do not need to be extracted before analysis as VOCs are directly accessible in the gas phase and, therefore, require minimal sample preparation, allowing for near real-time non-invasive monitoring. In pathological conditions, VOC concentrations change, or even new VOCs are formed from which certain disease conditions can be identified or monitored [55].
Urinary proteomics is the identification and analysis of proteins present in urine [58,59,60]. Advanced analytical techniques such as mass spectrometry allow the identification and quantification of proteins in urine samples. Changes in the levels of certain proteins in urine indicate certain diseases or conditions, including kidney disease, cancer, and metabolic disorders. Urinary genomics focuses on the analysis of genetic material (DNA and RNA) in urine samples. One of the compounds that can be analysed by urine genomics is cell-free DNA (cfDNA) [61,62]. This is DNA that is released into the bloodstream and eventually excreted in the urine. By analysing the cfDNA in urine samples, researchers can study genetic variations and mutations associated with various diseases such as cancer and genetic disorders. In addition to cfDNA, other genetic material present in urine, such as microRNAs (miRNAs) and messenger RNAs (mRNAs), can be analysed within the so-called urinary transcriptomics [63,64,65,66]. mRNA is RNA transcribed from DNA and carries genetic information from the nucleus to the ribosomes, where it is translated into proteins. These molecules can provide valuable information on gene expression patterns and be used as biomarkers for diagnosing and predicting disease.
Urine metabolic profiling is particularly interesting for cancer diagnosis, prognosis, and treatment monitoring because urine is a source of many metabolic biomarkers. Monitoring the levels of certain metabolites in urine makes it possible to detect the early stages of various diseases and even to distinguish cancer patients from healthy subjects or benign from malignant tumours. Many review articles on urinary metabolic biomarkers can be found in the literature, including those dealing with urinary metabolomics in detecting cancer biomarkers [8,38,56,60,67,68,69]. Urine is used for screening many types of cancer, not just those related to the urogenital tract. Jordaens et al. systematically summarised all the cancers that researchers worldwide have detected or tested for in urine samples [8]. The list of cancers is depicted in Figure 3.
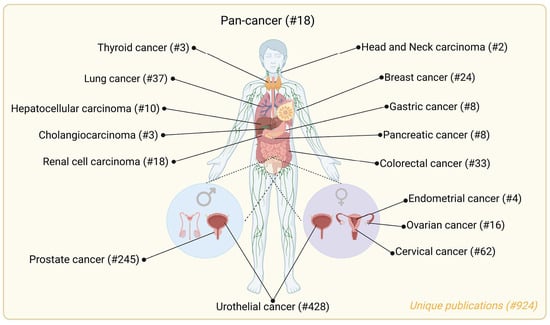
Figure 3.
Recognition of cancers in urine samples through biomarker detection [8].
2.1. Urinary Biomarkers Classification
The classification of urinary biomarkers is important for their development and clinical application and for selecting an appropriate analysing method because different biomarkers have different characteristics and functions. Some of them can be present at very high or very low levels in urine samples from which the sensitivity of the selected analytical method is dependent. Moreover, some biomarkers may be very specific to a particular disease or condition, while others may be more general and present in multiple diseases or conditions. By selecting the most appropriate analytical method for each biomarker analysis, the accuracy and reliability of the results can be significantly improved.
There are several classes of biomarkers defined by the US Food and Drug Administration and the National Institutes of Health in the frame of Biomarkers, Endpoints, and other Tools (BEST) [4,70]:
- Diagnostic biomarkers: Detect or confirm the presence of a disease or condition or identify an individual with a disease subtype. These biomarkers are used to identify persons with the disease and redefine disease classification. One of the objectives is to define a method for the validation of such biomarkers that ensures reliable, accurate and reproducible measurement at low cost. By developing new and improving existing measurement methods, understanding the values of individual diagnostic biomarkers will be more reliable and easier to measure.
- Monitoring biomarkers: Allows serial measurements to assess a disease or health condition to demonstrate exposure to or the effect of, a medical product or biological agent. Achieving a more precise understanding of which changes in a biomarker should signal a particular change in clinical course and decision-making is often complex and often less precise than desired. Monitoring biomarkers is also important to provide a safety threshold for drugs with potential organ toxicity and to measure pharmacodynamic effects or to detect therapeutic responses and complications of disease or therapy.
- Response biomarkers: A biomarker whose level changes in response to exposure to a drug or environmental agent. It is used in clinical practice and in the early development of therapies to provide evidence that a drug will be safe for use in individuals with the target disease. Here, it is of critical importance that the measured change in biomarker response provides a reliable signal for the expected therapeutic response. It may also be that measurable biomarkers do not reflect the true pharmacodynamic response.
- Predictive biomarkers: The presence or change in such a biomarker predicts the individual or group of individuals more likely to experience a beneficial or adverse effect from exposure to the medical product or environmental agent. In patients randomly selected for treatment, differences in treatment outcome associated with a difference in the presence, absence or level of the biomarker are measured.
- Prognostic biomarkers: Determine the likelihood of a clinical event, disease recurrence or disease progression in patients with a particular disease or condition. These biomarkers are used to set entry and exclusion criteria for trials, to identify populations at higher risk, and are particularly important for predicting an individual’s risk.
- Safety biomarker: Measured before or after exposure to a medical procedure or environmental agent to indicate the likelihood, presence, or magnitude of toxicity as an adverse effect of treatment. They may also be used for population monitoring of environmental exposures or post-exposure population monitoring.
- Susceptibility/risk biomarker: Indicates the possibility of developing a disease or health condition in an individual who does not currently have a clinically apparent disease or health condition or where the individual has not yet been diagnosed. These types of biomarkers are the basis for epidemiological studies on disease risk.
2.2. Urinary Metabolic Biomarkers for Cancer Detection
Cancer is one of the leading causes of morbidity and death worldwide, imposing huge costs on global public health. By using artificial intelligence algorithms, the predictions show that cancer prevalence will increase significantly in the coming years [71,72]. One US study predicted that, due to population growth and ageing, the annual number of cancer cases in the US will increase by almost 50% by 2050, with the highest percentage increase among adults aged ≥ 75 years. Cancers with the highest predicted absolute increases include female breast, colorectal and prostate cancers [73]. Therefore, early detection of cancer through the detection of biomarkers in biological fluids such as urine significantly reduces mortality and increases patients’ life expectancy. Cancer pathogenesis involves many molecular changes, including those at the level of metabolites, which are the end products of gene and protein expression and the result of the interaction between the genome and the internal environment [67]. As urinary metabolites represent the chemical fingerprint of cellular metabolism, urinary metabolomics is emerging as a method for detecting metabolite biomarkers that can be used for early cancer detection, prognosis, and response to cancer treatment. In this chapter, we summarise the cancers where the detection of urinary metabolic biomarkers can be used for diagnosis.
2.2.1. Lung Cancer
Lung cancer is the second most common cancer in incidence, with a high mortality rate worldwide. In most cases, it is often diagnosed at a late stage, when the metastatic phase has already begun. This can be avoided by using urinary metabolites, which could be derived from lung-cancer-specific pathways or altered metabolism caused by the presence of cancer cells. Some examples of urinary metabolites acting as biomarkers discussed in scientific papers focusing on lung cancer are tyrosine and tryptophan, hippurate, N-aceglutamide, β-hydroxyisovaleric acid, α-hydroxyisobutyric acid, N-acetylneuraminic acid, 2-pentanone, 2-butanone, hexanol, pyrrole, cortisol sulfate, creatinine, creatine, valine, proline betaine, taurine, and phenylalanine [74,75,76]. One promising class of urinary biomarkers for lung cancer diagnosis could be low-molecular-weight volatile organic metabolites [77].
2.2.2. Breast Cancer
Breast cancer is the second most common cancer in the world and the most common type of cancer in women. It is most commonly diagnosed using standard mammography that exposes the patient to ionising radiation. Early diagnosis of breast cancer greatly increases the chance of cure and survival. Therefore, non-invasive tests with high sensitivity are needed, including urinary biomarkers that have appeared in recent years. The major contributing metabolites identified are 8-OHdG, 1-methyladenoside, 1-methylguanosine, creatinine, pyruvate, threonine, lactate, choline, serine, carnitine, glutamine, formate, alanine, acetone, mannitol, glycine, citrate, taurine, betaine, histidine, hippurate, phenylalanine, succinate, valine, isoleucine, homovanillate, 4-hydroxyphenylacetate, 5-hydroxyindoleacetate, and urea [78,79].
2.2.3. Bladder Cancer
Bladder cancer is the seventh most commonly diagnosed cancer worldwide every year. Urine cytology, cystoscopy, and biopsy are currently used as standard procedures for bladder cancer detection and monitoring its progression and recurrence. These techniques have limitations such as low sensitivity, high costs, invasiveness, and pain. Thus, a new non-invasive diagnostic approach is needed. One such option is by using urine metabolomics biomarker screening. Some of the commonly used biomarkers for bladder cancer are hippurate, histidine, lactate, succinate, phenylalanine, tyrosine, tryptophan, leucine, isoleucine, valine, uric acid, carnitine, acetyl-CoA, adipate, gluconate, adenosine, anserine, tyramine and taurine [67]. It is also interesting to note that in the case of bladder cancer, three metabolites related to lipid metabolism, such as palmitoyl sphingomyelin, phosphocholine and arachidonate lipids, have been detected in urine samples. However, lipids are not extensively excreted in the urine [80].
2.2.4. Prostate Cancer
Prostate cancer is among the most frequently diagnosed types of cancer in men across Western countries, with the highest rate in Japan and USA. At present, the detection of prostate cancer is still an imprecise practice. There is still a high demand to find more sensitive and specific biomarkers to improve its diagnosis and prognosis. Currently, a blood screening test measuring the level of prostate-specific antigen (PSA) is the standard test to identify patients with prostate cancer [81]. Several metabolites acting as urinary biomarkers for prostate cancer diagnosis and prognosis were reported: proline, sarcosine, kynurenine, uracil, glycerol-3-phosphate, leucine, L-lactate, L-alanine, guanidinoacetate, phenylacetylglycine, glycine, creatinine, tyrosine, tryptophan, purine, sarcosine, cysteine, taurine, alanine, androgen, and acylcarnitines [82,83]. Some volatile compounds typical of prostate cancer patients are also likely to be present in the urine. For this purpose, four volatile organic compounds with a detection accuracy of 63–65% were studied, namely 2,6-dimethyl-7-octen-2-ol, pentanal, 3-octanone and 2-octanone [84].
2.2.5. Gastric Cancer
Currently, the standard diagnostic method for gastric cancer is gastroduodenal endoscopy, which is invasive and expensive. At an early stage, it is often asymptomatic; therefore, several urinary metabolites have been identified as new biomarkers for the early screening of gastric cancer: 2-hydroxyisobutyrate, 3-indoxylsufate, alanine, prostaglandin E2 metabolite (PGE-M), arginine, alanine, glycine, threonine, proline, tryptophan, 4-hydroxyphenylacetate, phenylacetyl glycine, aspartate, leucine, isoleucine, valine, citric acid, malic acid, lactic acid, cholic acid, succinate, histidine, methionine, serine, aspartate, taurine, tyrosine, lactate, and phenylalanine [85,86].
2.2.6. Kidney Cancer and Renal Cell Carcinoma (RCC)
Kidney or renal cell carcinoma is among the top ten most prevalent forms of cancer and the second deadliest urinary tract disease, often asymptomatic and metastatic at diagnosis. It is more frequent in men than in women. Most kidney cancers are usually detected when investigating symptoms such as back or abdominal pain. Metabolomic urine analysis is an ideal non-invasive tool to investigate this disease and can be used in diagnostics before the first symptoms. Several metabolites were observed to be changed in patients with RCC, such as folate, tryptophan, lysine, phenylalanine, biopterin, cortolone, testosterone, acylcarnites and acylcarnitines. N’-formylkynurenine was recognised as the most discriminated metabolite [67].
2.2.7. Colorectal Cancer
Screening programmes are used to diagnose colorectal cancer earlier, reducing mortality rates and improving health outcomes for patients. These methods are often unsatisfactory, invasive or have poor diagnostic performance. The presence of certain metabolites in urine can be effective in detecting this type of cancer: proline, glucose, sarcosine, putrescine, kynurenine, diacetylspermine, 4-hydroxyproline, aspartic acid, citric acid, aminoadipic acid, indole acetic acid, hippuric acid, butryric acid and 3-(3-Hydroxyphenyl)-3-hydroxypropanoic acid (HPHPA) [87].
2.2.8. Pancreatic Cancer
Pancreatic cancer patients have a very low survival rate. The structure of pancreatic tissue is complex and consists of exocrine and endocrine compartments that regulate the secretion of different molecules, including metabolites. There are several metabolites whose level in urine is increased in case of the presence of pancreatic cancer: acetoacetate, acetate, leucine, glucose, 2-phenylacetamide, and some acetylated compounds, whereas the level of citrate, creatinine, glycine, hippurate, 3-hydroxyisovalerate, trigonelline, is lower [67]. Also, abnormal levels of other metabolites, e.g., glycolate, creatine myoinositol, hydroxyacetone, choline, 2-aminobutyrate, urea and 2-oxoglutarate, were recognised in patient’s urine with pancreatic cancer diagnosis [88].
2.2.9. Hepatocellular Carcinoma
Hepatocellular carcinoma is one of the leading causes of cancer-related deaths worldwide. This cancer often occurs in people with chronic inflammatory liver disease associated with viral infections (e.g., chronic hepatitis B and C), toxic (alcohol and aflatoxin), metabolic (diabetes mellitus, haemochromatosis, and non-alcoholic fatty liver disease) and immune factors (autoimmune hepatitis and primary biliary hepatitis). Due to the unavailability of appropriate biomarkers for early diagnosis of this type of cancer, the prognosis is rather poor [67]. Significant metabolites discriminatory for HCC are creatinine, creatine, carnitine, glycine, hippurate citrate, methionine, pyruvate, indole-3-acetat, 2-oxoglutarate, trimethylamine-N-oxide, adenosine, inosine, glutamine, xylitol [67,89,90].
2.2.10. Endometrial and Ovarian Cancer
Endometrial cancer has the highest incidence among gynaecological cancers in Western countries. In recent years, the number of diagnosed cases of endometrial cancer has been steadily increasing. Endometrial cancer is usually diagnosed at an early stage, where it shows symptoms such as abnormal vaginal bleeding or discharge. The diagnosis is usually confirmed by biopsy or hysteroscopy, which is invasive [91]. Amino acids, lipids and hormonal metabolites have all been suggested to have potential as diagnostic biomarkers for endometrial cancer diagnostics. Several metabolic biomarkers are porphobilinogen, acetylcysteine, N-acetyserine, urocanic acid, and isobutyrylglycine [92,93]. Ovarian tumours can be diagnosticated through the following biomarkers: 3-dehydroquinic acid, 3-indolelactic acid, S-reticuline, selenocystathionine, 1-(1Z-hexadecenyl)-sn-glycero-3-3-phosphate, N-acetylneuraminic acid, 3-sialyl-N-acetyllactosamine and 3-sialylactose [94].
2.3. Selection of Metabolic Biomarkers for THz Spectroscopy Profiling of Urine
As already presented in the previous chapter, many metabolites in urine can be used and analysed as biomarkers for various cancer diagnostics. For instance, amino acids as the building blocks of proteins and organic acids produced during the breakdown of fats, carbohydrates, and proteins with their abnormal levels in urine can indicate metabolic disorders. Lipids that are fats and fat-like substances also can express abnormal levels in urine. Polyamines, i.e., organic compounds involved in cell growth and differentiation, are also present in urine and can indicate certain types of cancer. Moreover, some hormones can be excreted in urine and used as biomarkers for certain conditions. Abnormal levels of nitrogenous wastes, such as ammonia and uric acid, produced during protein breakdown can indicate certain metabolic disorders. According to several already published systematic reviews on urinary metabolic biomarkers for oncological disease detection [8,56,67,76], we prepared a list of 22 chemical compounds in Table 1. The selected compounds will be considered in this review to contribute to the development of a library of THz responses of urinary metabolites that have the potential to be used as urinary biomarkers. This review considers their THz response and unique spectral characteristics obtained in previous experimental studies (THz spectra are reprinted from articles published under Open Access or with permission from the publisher). The cancer-type data for each compound found in urine are taken from the HMDB database.

Table 1.
THz spectra of metabolites that may act as urinary biomarkers.
3. Spectroscopic Detection Techniques for Urinary Biomarkers Analysis
Various spectroscopic methods have been used over the years for analysing urinary biomarkers. These techniques are used to identify and quantify various compounds present in urine that can serve as biomarkers for certain diseases or conditions, including the diagnosis of cancer and the monitoring of its progression or the effect of treatment in an individual. Some commonly used spectroscopic techniques for urinary biomarker analysis are listed below and summarised in Table 2. Each of these techniques has its advantages and limitations, and the choice of technique will depend on the specific biomarkers being analysed and the analytical requirements of the study. Therefore, these spectroscopic techniques are often complementary and used in combination with each other. In addition, they are frequently used with different methods of separation and preparation of urine samples in biomarker detection.
Table 2.
Spectroscopic techniques used for the analysis of urinary biomarkers.
- Ultraviolet–visible (UV-Vis) spectroscopy: This is a commonly used method for detecting biomarkers in urine samples. It involves measuring the absorbance of light in the UV-Vis range by the biomolecules present in the sample. It can quantify certain biomolecules in urine that absorb light in this spectral range. UV spectroscopy is widely used for protein quantification because it is fast and convenient, can be performed directly on the sample without adding an external label, and provides a linear relationship between concentration and absorbance [21,112].
- Infrared (IR) spectroscopy: In IR spectroscopy, the absorption of IR radiation excites vibrational transitions in molecules. Since the vibrational frequency and the probability of absorption depend on the strength and polarity of the vibrating bonds, they are affected by intra- and intermolecular interactions. The position of the IR absorption band is determined by the vibrational masses and the type of bonding (single, double, triple), as well as the effects of electron uptake or donation from the intra- and intermolecular environment and coupling to other vibrations. From the IR spectrum, it is possible to obtain information on the chemical structure of the vibrating group, the chemical properties of neighbouring groups in the molecule, the redox state, bonding parameters, hydrogen bonding dynamics, conformations, and others. In general, all polar bonds contribute to IR absorption, so it is not necessary to specifically label biomolecules to detect them. Due to the complexity of biomolecules, their IR spectra are challenging to analyse because of overlapping IR bands [112]. Therefore, they are often combined using computers and statistical computational systems, which help to obtain spectra quickly and make them easily interpretable [27]. Analytical techniques that rely on molecular vibrations are Raman spectroscopy, Fourier transform infrared (FTIR) spectroscopy and THz spectroscopy.
- Nuclear magnetic resonance (NMR) spectroscopy: Besides mass spectrometry, NMR spectroscopy is the most useful method for a global view of the human metabolome. The advantages of NMR spectroscopy are the reusability of samples, high reproducibility and minimal sample preparation requirements [113]. NMR spectroscopy has been widely used for multidimensional metabolic profiling of cells, tissues, and biological fluids. These studies produce complex multivariate datasets that require visualisation software, chemometrics and bioinformatics methods for interpretation. These methods can be used to take biochemically based fingerprints to diagnose and classify diseases [13]. This method is based on the interaction of magnetic fields with the atomic nuclei in the biomolecules present in the sample. NMR spectroscopy can be used to identify the chemical composition of the biomolecules and to detect changes in the biomolecule structure due to disease or other factors. It is particularly beneficial for identifying small molecules, metabolites, and other organic compounds in urine.
- Fluorescence spectroscopy: This method is based on the emission of light by the biomolecules present in the sample when they are excited by light of a specific wavelength. In most cases, the emitted light has a longer wavelength and lower energy than the absorbed radiation. In chemical analysis, the sample is often irradiated in the UV or visible range, resulting in fluorescence in the visible or near-infrared range. Because of the method’s sensitivity, it is possible to measure concentrations of fluorescent molecules as low as 1 part per trillion. Fluorescence spectroscopy can be used alone or in conjunction with high-performance liquid chromatography as a detector [112]. Typically, analyte molecules do not emit strong luminescence, so the analyte is usually modified with a fluorophore to facilitate their analytical detection. Fluorescence spectroscopy can be used to identify the biomolecules present in the sample and can be used to detect changes in the biomolecule structure due to disease or other factors.
Several IR spectroscopic methods are used for biomarker detection in urine samples in far-, mid- and near-infrared regions [27,114,115,116]. The IR spectral range covers wavelengths from 780 nm to 1000 μm, which can be further subdivided into the near-infrared (NIR) range from 780 nm to 2500 nm, the mid-infrared (MIR) range from 2500 nm to 50 μm and the far-infrared (FIR) range from 50 μm to 1000 μm [112]. In the last region, THz bioanalytical sensing is also included, using THz radiation to investigate the interaction between THz waves and biomolecules. These techniques allow for label-free and non-destructive probing of biological samples at the molecular level. Thus, THz bioanalytical sensing holds great promise for understanding biomolecular interactions, studying biological structures, and detecting disease biomarkers [117,118,119]. As research in this area continues to advance, it is expected to contribute significantly to various applications in biomedical sciences and diagnostics.
Since the first published reports in which THz generators and detectors appeared [120,121,122], continuous research and development in photonics and electronics over the last 30 years have contributed to the development of THz systems that open up applications in various fields of medicine, chemistry and biology. The wide bandwidth in the THz range, even up to 20 THz [123], allows insight into the structure of chemical substances with micrometre resolution. The first optoelectronic THz transmission imaging was made in 1995 by Hu and Nuss [124], who imaged biological materials like plant leaves and human skin samples. Thus, they showed that THz waves could penetrate and interact with biological tissues, providing valuable insights into the sample’s internal structure and properties. This early research opened new possibilities for THz imaging in biomedical applications, including non-invasive imaging and diagnostics of biological tissues. Since then, THz imaging has become an important tool in medical imaging due to its unique capability to probe biological and material properties without ionizing radiation [125,126,127,128].
THz-based biosensing techniques have already been used for urine analysis and biomolecule detection. The research results are summarised in the next chapter, whereas in the following paragraphs and in Table 3, we outline the systems that have been used in previous analytical studies on urine samples in the THz frequency range:
Table 3.
Methods that can be applied in analytical studies on urine samples in the THz frequency range.
- Attenuated Total Reflectance Fourier-transform infrared (ATR-FTIR) spectroscopy [26]: ATR-FTIR is a powerful bioanalytical tool suitable for the unlabelled, rapid, non-destructive and relatively inexpensive analysis of biomolecules and molecular components in liquids such as urine. ATR-FTIR technology is also available as a portable device, ideal for biomedical applications. It can measure specific vibrational modes of molecules such as carbohydrates, proteins, lipids, metabolites, DNA and RNA without extensive sample preparation. The obtained IR spectrum can be used to identify the sample’s biomolecules and detect changes in the biomolecule structure due to disease or other factors. It provides information about the chemical bonds and functional groups present in a sample. ATR-FTIR is used instead of FTIR when the investigated sample does not produce strong or clear signals due to their limited interaction with the IR radiation. This method uses an attenuated total reflectivity (ATR) crystal made of a material that interacts strongly with IR light and is in contact with the sample’s surface. As a result, IR light can penetrate the sample to a small depth (typically a few micrometres), producing an evanescent wave that interacts with the sample and the attenuated total reflectance spectrum is measured. The evanescent wave penetration allows for better sensitivity, particularly for samples with low absorbance or small quantities.
- Terahertz Time-Domain Spectroscopy (THz-TDS): A technique that involves generating/detecting short THz pulses and measuring the electric field of the transmitted or reflected signal as a function of time after passing through the sample. The THz detector and generator are critical components for successful data acquisition and analysis. THz-TDS systems with photoconductive antennas (PCAs), inorganic (e.g., GaP or ZnTe) and organic (DAST, DSTMS) electrooptic crystals are mainly applied for bioanalytics [129,130]. The same short optical pulse is used to produce (pump) and detect (probe) THz radiation. THz-TDS allows simultaneous measurement of the amplitude and phase of the THz field, from which real and imaginary optical constants such as absorption coefficient and refractive index can be calculated without Kramers–Kronig relations. This represents a significant advantage over FTIR spectroscopy. The basic working principle of the THz-TDS system is shown in Figure 4a. When a THz wave passes through a material, it is partially absorbed, and the transmitted or reflected signal is detected and analysed. A reference measurement must be performed before the sample is measured to obtain a reference spectrum (e.g., an empty space in a particular atmosphere or sample carrier or the sample itself before experimentation). This is followed by the measurement of the investigated sample. The ratio of the reference spectrum to the sample spectrum is an expression from which the refractive index, absorption coefficient and sample thickness can be determined. By Fourier transforming the recorded signal into the frequency domain, this spectroscopic technique can provide additional information on the molecular structure, including the presence of functional groups, degree of crystallinity, molecule conformation, intramolecular and intermolecular dynamics [131]. Compared to FTIR spectroscopy, THz spectroscopy can provide information on the low-frequency vibrational modes of biomolecules, such as the collective vibrational modes of amino acids, proteins and carbohydrates, which are not accessible by FTIR spectroscopy [132]. THz-TDS can be applied to study the vibrational modes of metabolites, enabling researchers to identify and quantify specific metabolites in biological samples. This technique is also used for 2D and 3D imaging of materials. The amplitude image is captured by placing it on the top of the THz pulse and then performing a raster scan of the sample. With amplitude imaging, only detection is possible, but not identification and classification, which requires a recording of the entire pulse profile at each selected point on the sample, thus providing a large amount of information about compounds and molecules in the frequency domain [104].
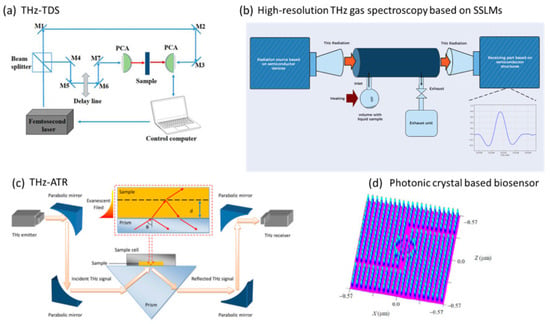 Figure 4. THz systems for urine samples analysis: (a) THz-TDS [49], (b) high-resolution THz system for urine vapour analysis [50], (c) THz-ATR [51] and (d) bio-sensor based on 2D photonic crystal ring resonator used for detection of glucose in urine [134].
 - THz-attenuated total reflection (THz-ATR) spectroscopy [51]: A method that acquires the THz signal of a sample attached to an ATR prism using evanescent waves that are concentrated within a few tens of microns of the prism surface. The signal is derived from THz radiation focused on the prism at its critical angle. The sample is placed in direct contact with the ATR crystal. Like THz-TDS, a femtosecond laser system generates short pulses of THz radiation. Compared to THz-TDS, THz-ATR spectroscopy is more sensitive in measuring highly absorbing biological samples. The THz-ATR system is depicted in Figure 4c. It is used for analysing samples that do not transmit THz radiation well, such as highly absorptive or scattering samples and samples with limited thickness, such as thin films, coatings, and surfaces.
- Far infrared (FIR) microspectroscopy [133]: Also known as THz microspectroscopy, this is an analytical technique used to study the molecular composition and properties of materials in the THz region. In the context of metabolic biomarkers, FIR microspectroscopy can be applied to analyse metabolic fingerprints or profiles of biological samples. Different metabolic patterns may be associated with specific diseases or conditions, allowing for potential biomarker discovery. FIR microspectroscopy is a complementary technique and is often used in conjunction with other analytical methods to provide a more comprehensive understanding of biomarkers and their roles in various biological processes and disease states. This method is used for chemical imaging of heterogeneous samples as it provides simultaneous information on their composition and morphology, i.e., the distribution of their constituents. It is more suitable for the analysis of rough samples, such as cross-sectioned urinary stones, because of the reduced diffuse reflectance and sample thickness.
- Photonic-crystal-based biosensor [134]: A method that is based on a photonic crystal (PC), which consists of periodic dielectric or metal-dielectric nanostructures that have alternating low and high dielectric material constants (refractive index), which affect the propagation of electromagnetic waves within the structure. Based on the variation of the refractive index in one, two and three directions, PCs are classified into three types, namely one-dimensional (1D), two-dimensional (2D) and three-dimensional (3D) PCs. 2D PCs have a simple structure, small size, and high light confinement and are more suitable for the analysis of urine samples compared to 1D and 3D PCs. The design of such a square grid biosensor is shown schematically in Figure 4d. The sensor comprises two inverted “L” waveguides and a ring resonator. The inverted “L” waveguide is created by introducing line defects, while the ring resonator is designed with line/point defects. The rod radius, lattice constant and dielectric constant are the structural parameters of the sensor.
- Non-stationary THz high-resolution spectrometer [50]: A method that can be applied to gases and vapours of liquids (e.g., urine) after evaporation or thermal decomposition. The advantages of this method are real-time measurements, easy-to-obtain samples, unique identification of a wide range of detectable compounds and suitability for any patient regardless of their state. This spectrometer is based on semiconductor superlattice multipliers (SSLM) with input from sources such as a Gunn diode and a backward oscillator (BWO). Superlattices are very efficient for frequency multiplication from the sub-THz to THz range but require complex gold resonators for the transmitter and detector, which limits frequency tuning, increases the cost of the device, and reduces the output power. Therefore, there is great potential for further improvements of these devices with on-chip integration. With a non-linear mechanism responsible for frequency amplification in the SSLM, control of the input power for monitoring the vapour composition of urine can be achieved. Compared to quantum cascade lasers, which are an efficient source of MIR spectra, this method works efficiently in the THz range without cryocooling and in the low THz range. A schematic showing an experimental set-up where the radiation source and detection are based on SSLMs is shown in Figure 4b.
- THz time-domain spectroscopic ellipsometry (THz-TDSE) [135,136,137]: Using this method, THz pulses are incident at an angle close to the Brewster angle of the investigated material. Both p- and s-polarizations of the reflected waves are separately measured. Although not employed specifically for urine samples yet, THz-TDSE may be considered a potentially interesting technique for biomarker detection in urine, as it applies to highly absorbing materials such as aqueous samples [135] that are not easily studied by conventional THz-TDS in transmission mode. In addition, compared to THz-TDS in reflection mode, THz-TDSE does not require reference measurements, which may be subject to significant errors due to the high sensitivity to very small displacement errors. In the optical/IR range, ellipsometry is a widely used and established technique to study the optical properties and thicknesses of thin films but requires a rather complex analysis due to the non-coherent detection in this range. This can be avoided by combining the coherent detection in THz-TDS and ellipsometry [135]. Therefore, THz-TDSE allows for determining the complex optical properties (refractive index and absorption) of highly absorptive samples without measuring reference signals.
- Free Electron Laser (FEL)-based THz sources [138,139]: The most powerful sources in the THz wavelength range. They can produce extremely bright, coherent, wideband, tunable ultra-short pulses that are not achievable with other techniques. The FEL THz source working principle is based on the interaction of a relativistic electron beam and a periodic magnetic field structure called an undulator or a wiggler. The undulator forces the electrons to wiggle transversely, emitting photons of radiation that are monochromatic but incoherent. The radiation is amplified by an optical cavity or an external laser, creating a feedback loop that modulates the electron energy and density. This leads to a coherent emission of tunable radiation, powerful (pulse energies up to 100 μJ with peak electric fields up to 1 MV/cm), and ultra-short (pulses of few picoseconds or less). The FEL THz source can generate radiation in the 1 to 30 THz frequency range, which is useful for various applications such as imaging, spectroscopy, and material research. The detection techniques used for high-intensity THz waves generated by FELs are electro-optic (EO) sampling, field-streaking, or, more recently, THz Air Breakdown Coherent Detection (ABCD). FELs can enable novel investigations into complex systems, time-dependent interactions, and material dynamics in the THz range. Example applications are in non-linear physics (high energies), polarisation-sensitive imaging, metamaterial-based sensing, and spectroscopy of biomolecules. FELs can overcome the limitations of conventional THz sources, such as low power, narrow bandwidth, poor coherence, and lack of tunability. They can also overcome the challenges of THz detection, such as low sensitivity, slow response, and high noise. FELs can provide high spatial resolution and penetration depth for imaging biological samples, as well as high spectral resolution and sensitivity for identifying molecular signatures. They can also enable label-free and non-invasive analysis of biological samples, as well as dynamic and functional imaging of biological processes.
4. Terahertz Spectroscopic Analysis of Urine
THz spectroscopy and imaging are relatively new technologies that promise to analyse a wide range of biological samples such as tissues, cells, and body fluids. THz spectroscopy has already been applied in experiments on human body liquids: blood [140,141], plasma [142], saliva [143,144,145], urine [50,146], and sweat [21,147,148]. In urine, THz spectroscopy can be used to analyse the molecular composition of the sample. More specifically, it can identify and quantify the presence of different molecules like proteins, carbohydrates, and lipids. In addition to molecular analysis, THz imaging can detect and visualise abnormalities in urine samples, such as the presence of crystals, stones, or other foreign bodies. As such, THz spectroscopy and imaging have the potential to be a valuable disease diagnostic tool for analysing liquid biological samples in a non-invasive and label-free manner. However, further research is needed to validate the diagnostic and prognostic value of THz spectroscopy and imaging for urine sample analysis. However, the major limit is the complex chemical composition of human body liquids, which usually contain various substances. Therefore, the signal-to-noise ratio (SNR) for the absorption peaks of target substances is very small, and the target substances are hard to identify [149]. In this review, we summarise THz spectroscopic research that has been conducted on urine samples till now. Also, all past studies are summarised in Table 4 at the end of this chapter.
Xue et al. compared the absorption spectra of proteinuria and non-proteinuria [49]. They first measured and calculated the THz absorption coefficient for water and urine samples (Figure 5a). The absorption coefficient of water is higher in comparison to urine, which indicates that the THz absorption coefficient is sensitive to some contents in urine. With THz-TDS, they found a significant difference in the absorption coefficient between proteinuria and non-proteinuria, where the protein in the urine and water in the solvent play a key role (Figure 5b). Proteinuria samples with increased protein concentration have a greater absorption coefficient than non-protein urine samples. Moreover, they investigated the effect of pH (6.0–9.0) on the analysis of proteinuria (Figure 5c) and monitored the changes in absorption coefficient when adding β2-microglobulin and albumin into the urine samples (Figure 5d) to verify the ability of THz-TDS to distinguish different kinds of proteinuria. β2-microglobulin is a biomarker of various neoplastic, inflammatory, and infectious conditions [150], whereas albumin is a diagnostic and prognostic biomarker to evaluate the degree of severity of glomerular diseases in the progression of chronic kidney disease and acute kidney injury [151]. They found that the absorption coefficient of the urine sample at different pH values is not changed by THz-TDS, which means that THz-TDS can be applicable also under alkaline conditions. Both investigated proteins showed significant differences in the absorption coefficient due to differences in conformation and molecular weight. Finally, the study confirmed that the THz-TDS method can be used for the detection of proteinuria with the ability to discriminate between different proteinuria (renal tubular proteinuria and glomerular proteinuria).
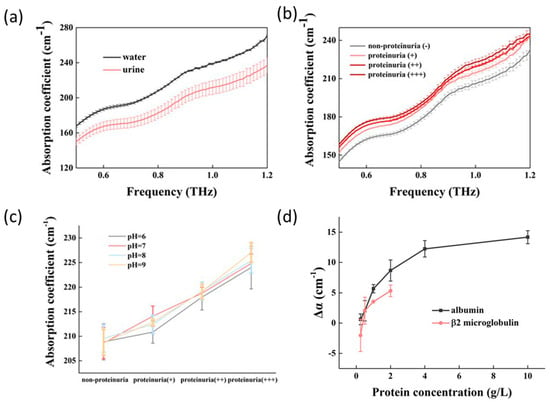
Figure 5.
(a) The absorption coefficient of water and different urine samples in the frequency range of 0.5–1.2 THz; (b) THz absorption coefficients for different concentrations of proteinuria and non-proteinuria; (c) Absorption coefficients and protein concentrations of urine with different protein concentrations at the same pH; (d) Effect of different types and concentrations of protein on urinary THz absorption [49].
Some other experimental study on albumin was conducted by Yang et al., who have found a certain type of relationship between THz spectrum data and urinary albumin content [152]. They observed that the refractive index in the THz range changed in urine samples with proteins, even if the protein concentrations were below 100 mg/L. This confirms that THz-TDS can discriminate whether urine contains protein or not. Moreover, Emaminejad also investigated the albumin and some other urine components and their concentrations by a novel tuneable THz biosensor based on metamaterials [45].
Li et al. used THz spectroscopy to analyse the vibration and rotation of homocysteine with different concentrations. Homocysteine is an amino acid related to cardiovascular disease, senile dementia, and other diseases. If the homocysteine metabolizing pathways are inhibited due to enzymatic defects or vitamin deficiencies, the concentration level of homocysteine in plasma or urine increases over its normal concentration level, which is in urine 3.5–9.5 μmol/L [153]. Homocysteine has two absorption peaks at 1.29 THz and 1.93 THz (Figure 6), which can be used to determine the chemical compound in mixtures as well as to detect the concentrations of homocysteine in samples accurately. In human urine, there are many other amino acids and other chemical compounds, which also have their own THz spectral peaks and may superpose with the homocysteine peaks.
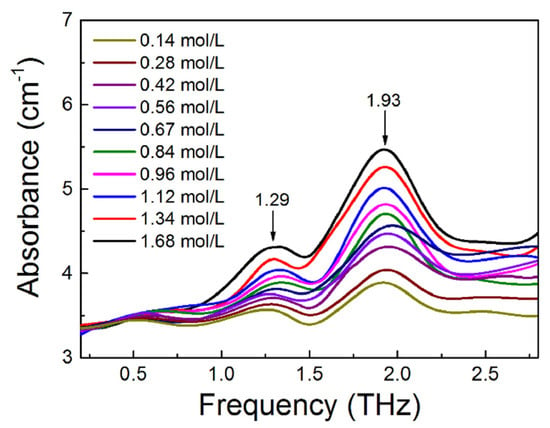
Figure 6.
THz absorption spectra of homocysteine samples under different concentrations. The corresponding concentrations are labelled with different colours [153].
The dielectric constant also changes with glucose concentration in urine [45]. Toshiba Research Europe Ltd. started a project in 2001 together with physicists and biochemists to develop a medical spectroscopic system that could be used to analyse biological substances at clinically relevant concentrations in biological samples such as blood, urine and cerebrospinal fluid [154]. Examples of such substances are glucose, urea, creatinine, and cholesterol. Since then, many studies have been focused on glucose evaluation with THz systems. For example, Robinson and Dhanlaksmi designed a photonic crystal ring resonator biosensor to detect the concentration of glucose over the range of 0–15 gm/dl in urine at a 1550 nm wavelength, which is equal to 193 THz [134]. With this approach also, the concentration of other urinary compounds can be determined, e.g., albumin, urea, and bilirubin. Caixeta et al. monitored the glucose levels in urine also by attenuated total reflection FTIR (ATR-FTIR) spectroscopy [26]. The experiment was performed on urine samples of non-diabetic, diabetic, and diabetic insulin-treated rats. The absorbance spectra in the frequency range of 12–120 THz for urine samples collected from each rat species are presented in Figure 7. The changes in absorption are related to urea, creatinine, and glucose content. In addition, using univariate or multivariate analysis, the glucose status in the urine can be obtained, showing the potential of ATR-FTIR as a novel non-invasive approach to diabetes screening and monitoring.
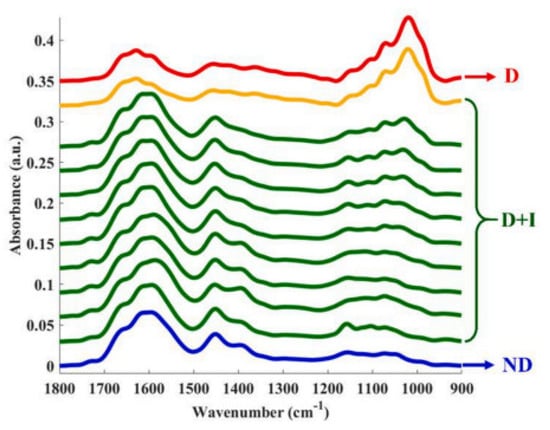
Figure 7.
FTIR spectra for the urine of insulin-treated diabetic (D+I) animal, all diabetic (red) and non-diabetic rats (blue) recorded by ATR-FTIR. Green lines relate to animals with positive responses to insulin treatment, while the orange line represents the animal that displayed no response to insulin treatment [26].
THz absorption spectroscopy can be used to analyse a wide range of gas molecules, including VOCs and other gases produced by biological processes. These gases can indicate specific diseases or conditions, such as kidney disease and urinary tract infections. Vaks et al. measured acetone concentrations in urine samples of diabetes patients [155] at around 150 GHz. Results confirmed that sub-THz radiation can be used to determine metabolites-markers sets in vapours of biological liquids like urine when characterizing diabetes presence. Furthermore, in another research, they investigated the composition of thermal degradation products in urine samples from cancer patients before and after chemotherapy, with the aim of identifying biomarkers that reflect the impact of platinum-based chemotherapy on the human body [146]. For example, in the case of kidney failure induced by platinum-based chemotherapy, changes in serum creatinine levels and creatinine clearance occur [50]. Multi-component gas mixtures were investigated, namely rotational spectral lines and low-frequency vibrational spectra of molecules in the THz frequency range. The spectra of the gases show absorption lines, a unique feature of certain gaseous substances in the multicomponent gas mixture under investigation. The complex of metabolites formed by the thermal degradation of the sample was identified and the gaseous content of the thermal degradation products of urine obtained from sick and conditionally healthy individuals was compared. Similar research was conducted on urine samples, where nitriles appeared or their level in urine increased after chemotherapy [50]. The absorption spectra for the nitrile example, i.e., isobutyronitrile, alkylthiol, and ethanethiol, are shown in Figure 8. The detected nitriles are candidates for biomarkers in urine that can be used for further large-scale systematic testing of nephrotoxicity of chemotherapy at an early stage of treatment when conventional diagnostics cannot detect significant organ damage. Nitriles are present in urine because of biochemical reactions associated with chemotherapy-related kidney damage. The used THz device allows spectroscopy differently than other devices, e.g., THz-TDS and FTIR. This THz system allows a range of four different frequency bands for a general assessment of most substances in the liquid and the selection of a spectral interval that bypasses the strong absorption lines of substances such as water and ammonia, which may otherwise obscure the detection of target metabolites. In another paper, the same authors studied the content of thermal degradation products in urine samples from rats with artificially induced dysbacteriosis [156].
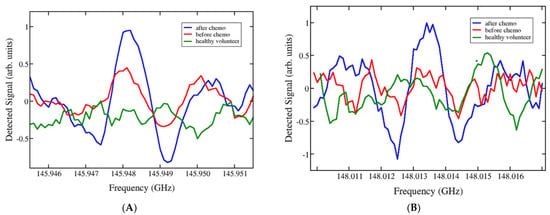
Figure 8.
Experimental detection of the absorption spectral line of (A) isobutyronitrile near fc = 145.9481 GHz and (B) ethanethiol near fc = 148.01327 GHz measured in a patient’s urine sample before (solid, red) and after (solid, blue) chemotherapy, compared to a reference measurement from a healthy individual (dashed, green) [50].
Some experiments were also conducted on tissues linked with the urinary tract and conditions like urolithiasis, which is linked with forming urinary stones. Kidney tissue samples were investigated by THz spectroscopy and imaging methods. The THz absorption spectra of different organic tissues are shown in Figure 9E. In contrast, the THz image of kidney tissue is visible in Figure 9B, and it was obtained by recording the peak-to-peak values. The THz method was used to determine the water content of organic tissues [157]. The water content of kidney tissues was determined by a simple calculation considering the absorption coefficients of fresh and lyophilised tissues and water. The measured water content was compared with the difference in weight of the tissues before and after lyophilisation (Figure 9D). In the case of kidney tissue, a poorer agreement was observed in comparison to other organic tissues because, unlike other organs, the kidney has a special structure made up of several micron-sized Bowman’s capsules containing urine (noticeable in micrography in Figure 9C), which act as THz scatterers and increased the THz absorbance of a kidney. Kidney tissue was also studied using high-resolution gas THz spectroscopy to examine diabetic and non-diabetic biological samples [142]. The kidney tissue was dried and shaped into pellets and then vaporised. The vapours containing the mixture of gaseous products from thermal decomposition were detected by THz high-resolution spectroscopy in the frequency range of 118–178 GHz. In addition, a set of gas markers characteristic of diabetes was revealed by analysis of the absorption lines appearing in the vapour spectra of the samples. The molecular content of the gaseous products of thermal decomposition differed between diabetic and non-diabetic samples. Acetone, which occurs in diabetic renal tissue, was identified as the main biomarker.
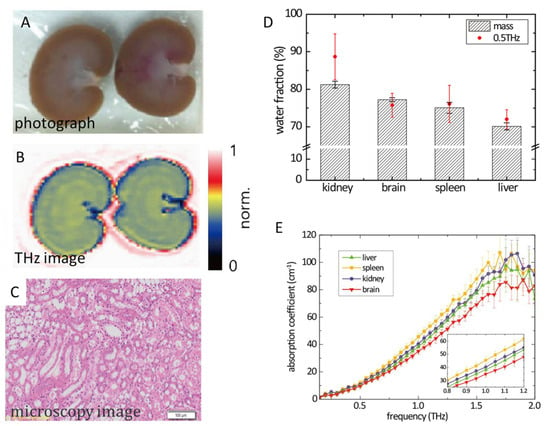
Figure 9.
(A) Visible image, (B) THz images and (C) microscopy image of the surgically extracted kidney; (D) comparison of the water fractions calculated using weights (bar) and THz absorption coefficients (red point); and (E) THz absorption coefficients of lyophilised organic tissues with the inset figure showing a magnified graph of the absorption coefficients of organs from 0.8 to 1.2 THz [157].
Engdahl used reflection infrared microspectroscopy for multi-spectral IR chemical imaging of cross-sectioned urinary stones to determine their chemical composition and morphology through the distribution of the constituents. He recorded THz absorption spectra of urinary stones containing uric acid and calcium oxalate in the frequency range of 4.5–20 THz. Furthermore, FIR chemical images of the cross-sectioned urinary stone showed the distribution of uric acid and calcium oxalate within the sample [133].
In recent years, there has been a growing interest in methods that allow rapid and accurate identification of microorganisms in body fluids such as urine. In this field, THz spectroscopy has shown its unique advantages as a new way to detect bacteria [158,159,160,161]. Yu et al. presented THz-ATR as one of the methods that allow rapid and label-free identification of microorganisms by an automated recognition method based on voting with multiple classifiers [51]. Using THz-ATR spectroscopy, they were able to classify microbial strains into three different groups of microorganisms (Gram-positive bacteria, Gram-negative bacteria, and fungi), as shown in Figure 10. Microbial strains, including E. coli, P. aeruginosa, C. albicans, C. tropicalis, and E. faecalis were isolated from clinical samples of sputum, blood, urine, and faeces. The accuracy of the proposed method for 1123 different specimens exceeds 80% when classifying into three classes. Compared to traditional biochemical assays, the time consumption for the identification/classification of bacterial isolates can be reduced by at least 10 h.
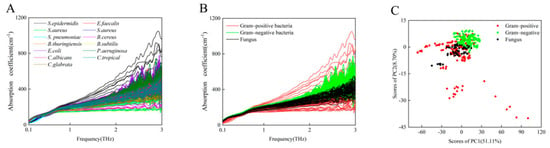
Figure 10.
(A) THz absorption spectra of 13 species of microbial isolates; (B) THz absorption spectra of Gram-positive bacteria (red), Gram-negative bacteria (green), and fungi (black); (C) PCA of THz spectra for Gram-positive bacteria (red), Gram-negative bacteria (green), and fungi (black) [51].
Table 4.
Summary of past studies focusing on analysing urine samples with THz systems.
Table 4.
Summary of past studies focusing on analysing urine samples with THz systems.
| Chemical Compound | THz Method | Frequency Band | Sample Preparation | Research Purpose | Reference |
|---|---|---|---|---|---|
| β2-microglobulin and albumin | THz-TDS | 0.5–1.2 THz | 17.7 μL | proteinuria qualitative detection | [49] |
| albumin | PCA-ZnTe based THZ-TDS | 0.2–1.8 THz | 0.1 mm thick film of the liquid sample | Protein concentration in urine | [152] |
| homocysteine | THz-TDS | 0.2–2.8 THz | 0.14 mol/L in the form of a 1 mm thick tablet mixed with PE | absorption spectrum of homocysteine under different concentrations | [153] |
| glucose, albumin, urea | MM biosensor based on split-ring resonators | Tuneable: 0.2–2 THz 193 THz | 5–100 μm sample thickness 500 (nm/RIU) at 1–2 THz 136 (µm/RIU) at 193 THz | concentration of glucose, albumin, and urea in urine | [45] |
| glucose | photonic crystal ring resonator biosensor | 193 THz | of 0–15 gm/dl | concentration of glucose | [134] |
| acetone | high-resolution THz spectroscopy | 151.647 GHz | NA | acetone concentrations | [155] |
| multicomponent gas mixture | high-resolution THz gas spectroscopy (free-damping polarisation) | 150.537 GHz and 151.647 GHz | NA | composition of thermal decomposition products of urine before and after platinum-based chemotherapy | [146] |
| urea, creatinine, and glucose | ATR-FTIR | 4000–400 cm−1 (12–120 THz) | Aqueous solutions dry at room temperature | Glucose levels in rat urine samples | [26] |
| nitriles | high-resolution spectrometer based on Gunn generators and semiconductor superlattice multipliers and mixers | 4 distinct frequency ranges: 118–178 GHz 336–345 GHz 560–575 GHz 784–805 GHz | 1–2 mL urine was first frozen and dehydrated to form a thin film or crystallised residue, which was then evaporated and heated | dynamics of urine composition for cancer patients treated with chemotherapy | [50] |
| Gram-positive bacteria, Gram-negative bacteria, and fungi | ATR-THz | 0.1–5.0 THz | isolates from clinical samples of urine, diameter of 7 mm and a thickness of 100 µm | microbial identification from urine samples | [51] |
| urinary stones | FIR microspectroscopy in reflection mode | 4.5–20 THz | cross-sectioned urinary stone | urinary stone structure and chemical composition | [133] |
| water content | transmission-mode THz-TDS and reflection-mode THz imaging | 0.2–2.0 THz | Fresh and lyophilised fresh kidney tissues from Sprague Dawley rat | measuring water contents in kidney tissue | [157] |
| sulfur compounds (methanethiol) formic acid | THz-TDS THz high-resolution gas spectrometer | 0.2–1.4 THz (THz-TDS) 118 to 178 GHz (gas spectrometer) | vapours samples of dried rat kidney tissue in a pellet form | molecular content of rat kidney tissue during thermal decomposition to distinguish diabetic from non-diabetic samples; absorption rotational spectra of vapours | [9] |
| lysozyme (from hen egg white lysozyme) mouse urinary protein | NA (THz-TDS assumed) | 0.6–4.5 THz | lyophilised powders and single-crystal proteins in a pellet form | THz frequency response at different concentrations and temperature | [162] |
5. Conclusions and Future Directions for Detection of Urinary Metabolic Biomarkers by THz Systems
In this paper, we present some of the different THz methods that can be used for the analysis of urine samples, also in terms of qualitative and quantitative determination of urinary metabolic biomarkers associated with different oncological conditions. With these methods presented, the reader can gain a basic understanding of approaches to perform studies in the biomedical detection of metabolites present in urine or urine vapour based on THz spectroscopy. As can be observed from the summary of past studies, few publications can be traced to the identification of biomarkers in actual biological samples such as urine.
Finally, in the discussion, we give our perspectives for future research in this field interpreted from the results of previous studies:
- Different labelling agents can be used to specifically improve the detection of metabolites in urine by THz spectroscopy, but this will lead to sample distortion. Adding different reagents to urine samples requires different time and financial costs. This still limits the use of THz spectroscopy in medical biomarker diagnostics.
- Different AI algorithms can extract effective information from large amounts of spectroscopic information regarding urine constituents, but some useful information may be lost in the process.
- Further optimisation of THz systems is necessary, especially in terms of signal-to-noise and frequency resolution improvement, to increase the sensitivity of detection and increase the frequency bandwidth to improve the selectivity for various substances since the signal of the target substance can still be overlaid with the signals of other substances in the urine samples. Urine samples contain components such as water, protein, lipids, fibres and other organic constituents, and target substances such as metabolic biomarkers often only occupy a small proportion, so the signal-to-noise ratio is very important for the detection of absorption peaks of target substances.
- For non-invasive cancer diagnosis, human liquid secretions such as urine are of increasing interest as the sample collection is very fast and non-invasive. It is easy to collect urine even at home, without the assistance of medical staff, with no restrictions on quantity and reproducibility. However, using urine for liquid biopsy requires the determination of pre-analytical parameters such as urine type, urine fraction, collected volume, collection method, preservation, collection time, etc. All these parameters can influence the THz spectroscopic measurements and the interpretation of the obtained results. Therefore, from this point of view, it is of utmost importance that future THz studies on urine samples are carried out, also considering all factors that may affect the reliability, validity, and reproducibility of the results. The influence of exogenous substances on urinary metabolites such as water, drugs, and food, which can cause strong interferences in THz urinalysis, must also be considered. An interesting THz study would be to investigate the influence of diet on urine metabolomics, which can certainly show changes in the THz spectra and the calculation of the absorption coefficient and refractive index.
- Although obtaining urine samples is a simple and non-invasive process, the way these samples are stored and handled requires specifics. For example, one THz study suggested that urine samples should be quickly stored in a medical refrigerator and analysed within a day [152]. This may eliminate the effects of prolonged storage of samples on the THz measurement itself. Sometimes, urine in liquid form is difficult to analyse, and urine samples should also be pre-treated using different methods of filtering, cleaning and drying [153], which can simplify the detection of metabolic biomarkers in solutions such as urine.
Cancer metabolomics, where researchers analyse the metabolic profile of cancer patients to identify potential biomarkers for their early detection, prognosis, and response to treatment, will become an increasingly interesting topic in future THz research. However, it should be stressed that the use of THz methods in the determination and identification of urinary metabolites as a diagnostic marker for cancer is still in its early stages of exploration, although some studies have already shown promising results. Further research and clinical trials are needed to establish the reliability and accuracy of THz methods and results in the diagnosis and treatment of cancer based on urinalysis. In the future, we can expect the use of biosensors for self-monitoring of urine and other body fluids to be part of regular health monitoring. As the THz frequency range offers a unique insight into intramolecular and intermolecular interactions, biosensors in the THz range may be one of them.
Author Contributions
All authors contributed equally to the paper. All authors have read and agreed to the published version of the manuscript.
Funding
The research leading to these results has received funding from the ARRS Programme under grant agreement number P2-0348 (C), the project “New imaging and analytic methods”.
Institutional Review Board Statement
Not applicable.
Informed Consent Statement
Not applicable.
Data Availability Statement
The data that support the findings of this study are available from the corresponding author upon reasonable request.
Conflicts of Interest
The authors declare no conflict of interest.
References
- Humphrey, R.; Trivedi, S. Murine Plasmacytoma Tumor-Cell Burden Measured In Vivo by Means of Guanido-C-14-Arginine Labeling of M Component Biomarker. J. Exp. Hematol. 1976, 4, 28. [Google Scholar]
- Webb, K.S.; Lin, G.H. Urinary Fibronectin: Potential as a Biomarker in Prostatic Cancer. Investig. Urol. 1980, 17, 401–404. [Google Scholar]
- Bodaghi, A.; Fattahi, N.; Ramazani, A. Biomarkers: Promising and Valuable Tools towards Diagnosis, Prognosis and Treatment of COVID-19 and Other Diseases. Heliyon 2023, 9, e13323. [Google Scholar] [CrossRef] [PubMed]
- Califf, R.M. Biomarker Definitions and Their Applications. Exp. Biol. Med. 2018, 243, 213–221. [Google Scholar] [CrossRef] [PubMed]
- Lucignani, G.; Neri, E. Integration of Imaging Biomarkers into Systems Biomedicine: A Renaissance for Medical Imaging. Clin. Transl. Imaging 2019, 7, 149–153. [Google Scholar] [CrossRef]
- Nikanjam, M.; Kato, S.; Kurzrock, R. Liquid Biopsy: Current Technology and Clinical Applications. J. Hematol. Oncol. J. Hematol. Oncol. 2022, 15, 131. [Google Scholar] [CrossRef]
- Yu, D.; Li, Y.; Wang, M.; Gu, J.; Xu, W.; Cai, H.; Fang, X.; Zhang, X. Exosomes as a New Frontier of Cancer Liquid Biopsy. Mol. Cancer 2022, 21, 56. [Google Scholar] [CrossRef]
- Jordaens, S.; Zwaenepoel, K.; Tjalma, W.; Deben, C.; Beyers, K.; Vankerckhoven, V.; Pauwels, P.; Vorsters, A. Urine Biomarkers in Cancer Detection: A Systematic Review of Preanalytical Parameters and Applied Methods. Int. J. Cancer 2023, 152, 2186–2205. [Google Scholar] [CrossRef]
- Lykina, A.A.; Anfertev, V.A.; Domracheva, E.G.; Chernyaeva, M.B.; Kononova, Y.A.; Toropova, Y.G.; Korolev, D.V.; Smolyanskaya, O.A.; Vaks, V.L. Terahertz High-Resolution Spectroscopy of Thermal Decomposition Gas Products of Diabetic and Non-Diabetic Blood Plasma and Kidney Tissue Pellets. J. Biomed. Opt. 2021, 26, 043008. [Google Scholar] [CrossRef]
- Yang, M.; Liu, X.; Tang, X.; Sun, W.; Ji, Z. LC-MS Based Urine Untargeted Metabolomic Analyses to Identify and Subdivide Urothelial Cancer. Front. Oncol. 2023, 13, 1160965. [Google Scholar] [CrossRef]
- Wang, W.; Rong, Z.; Wang, G.; Hou, Y.; Yang, F.; Qiu, M. Cancer Metabolites: Promising Biomarkers for Cancer Liquid Biopsy. Biomark. Res. 2023, 11, 66. [Google Scholar] [CrossRef] [PubMed]
- Gowda, G.A.N.; Raftery, D. NMR Based Metabolomics. Adv. Exp. Med. Biol. 2021, 1280, 19–37. [Google Scholar] [CrossRef]
- Beckonert, O.; Keun, H.C.; Ebbels, T.M.D.; Bundy, J.; Holmes, E.; Lindon, J.C.; Nicholson, J.K. Metabolic Profiling, Metabolomic and Metabonomic Procedures for NMR Spectroscopy of Urine, Plasma, Serum and Tissue Extracts. Nat. Protoc. 2007, 2, 2692–2703. [Google Scholar] [CrossRef]
- Emwas, A.-H.; Luchinat, C.; Turano, P.; Tenori, L.; Roy, R.; Salek, R.M.; Ryan, D.; Merzaban, J.S.; Kaddurah-Daouk, R.; Zeri, A.C.; et al. Standardizing the Experimental Conditions for Using Urine in NMR-Based Metabolomic Studies with a Particular Focus on Diagnostic Studies: A Review. Metabolomics 2015, 11, 872–894. [Google Scholar] [CrossRef] [PubMed]
- Emwas, A.-H.; Roy, R.; McKay, R.T.; Ryan, D.; Brennan, L.; Tenori, L.; Luchinat, C.; Gao, X.; Zeri, A.C.; Gowda, G.A.N.; et al. Recommendations and Standardization of Biomarker Quantification Using NMR-Based Metabolomics with Particular Focus on Urinary Analysis. J. Proteome Res. 2016, 15, 360–373. [Google Scholar] [CrossRef]
- Zhang, X.; Li, Q.; Xu, Z.; Dou, J. Mass Spectrometry-Based Metabolomics in Health and Medical Science: A Systematic Review. RSC Adv. 2020, 10, 3092–3104. [Google Scholar] [CrossRef] [PubMed]
- Zou, W.; She, J.; Tolstikov, V.V. A Comprehensive Workflow of Mass Spectrometry-Based Untargeted Metabolomics in Cancer Metabolic Biomarker Discovery Using Human Plasma and Urine. Metabolites 2013, 3, 787–819. [Google Scholar] [CrossRef]
- Martinez-Moral, M.-P.; Kannan, K. Analysis of 19 Urinary Biomarkers of Oxidative Stress, Nitrative Stress, Metabolic Disorders, and Inflammation Using Liquid Chromatography–Tandem Mass Spectrometry. Anal. Bioanal. Chem. 2022, 414, 2103–2116. [Google Scholar] [CrossRef]
- Liu, X.; Li, J.; Hao, X.; Sun, H.; Zhang, Y.; Zhang, L.; Jia, L.; Tian, Y.; Sun, W. LC–MS-Based Urine Metabolomics Analysis for the Diagnosis and Monitoring of Medulloblastoma. Front. Oncol. 2022, 12, 949513. [Google Scholar] [CrossRef]
- Nam, H.; Chung, B.C.; Kim, Y.; Lee, K.; Lee, D. Combining Tissue Transcriptomics and Urine Metabolomics for Breast Cancer Biomarker Identification. Bioinformatics 2009, 25, 3151–3157. [Google Scholar] [CrossRef]
- Ray, P.; Steckl, A.J. Label-Free Optical Detection of Multiple Biomarkers in Sweat, Plasma, Urine, and Saliva. ACS Sens. 2019, 4, 1346–1357. [Google Scholar] [CrossRef]
- Kamal, A.; Gulfraz, M.; Anwar, M.A.; Malik, R.N. Reverse Phase High Performance Liquid Chromatographic Method Development Based on Ultravioletvisible Detector for the Analysis of 1-Hydroxypyrene (PAH Biomarker) in Human Urine. Int. J. Occup. Med. Environ. Health 2015, 28, 399–403. [Google Scholar] [CrossRef]
- Birková, A.; Oboril, J.; Kréta, R.; Čižmárová, B.; Hubková, B.; Šteffeková, Z.; Genči, J.; Paralič, J.; Mareková, M. Human Fluorescent Profile of Urine as a Simple Tool of Mining in Data from Autofluorescence Spectroscopy. Biomed. Signal Process. Control 2020, 56, 101693. [Google Scholar] [CrossRef]
- Witzke, K.E.; Großerueschkamp, F.; Jütte, H.; Horn, M.; Roghmann, F.; von Landenberg, N.; Bracht, T.; Kallenbach-Thieltges, A.; Käfferlein, H.; Brüning, T.; et al. Integrated Fourier Transform Infrared Imaging and Proteomics for Identification of a Candidate Histochemical Biomarker in Bladder Cancer. Am. J. Pathol. 2019, 189, 619–631. [Google Scholar] [CrossRef] [PubMed]
- Ortega-Hernández, N.; Ortega-Romero, M.; Medeiros-Domingo, M.; Barbier, O.C.; Rojas-López, M. Detection of Biomarkers Associated with Acute Kidney Injury by a Gold Nanoparticle Based Colloidal Nano-Immunosensor by Fourier-Transform Infrared Spectroscopy with Principal Component Analysis. Anal. Lett. 2022, 55, 2370–2381. [Google Scholar] [CrossRef]
- Caixeta, D.C.; Lima, C.; Xu, Y.; Guevara-Vega, M.; Espindola, F.S.; Goodacre, R.; Zezell, D.M.; Sabino-Silva, R. Monitoring Glucose Levels in Urine Using FTIR Spectroscopy Combined with Univariate and Multivariate Statistical Methods. Spectrochim. Acta. A Mol. Biomol. Spectrosc. 2023, 290, 122259. [Google Scholar] [CrossRef]
- Vigo, F.; Tozzi, A.; Disler, M.; Gisi, A.; Kavvadias, V.; Kavvadias, T. Vibrational Spectroscopy in Urine Samples as a Medical Tool: Review and Overview on the Current State-of-the-Art. Diagnostics 2022, 13, 27. [Google Scholar] [CrossRef] [PubMed]
- Huttanus, H.M.; Vu, T.; Guruli, G.; Tracey, A.; Carswell, W.; Said, N.; Du, P.; Parkinson, B.G.; Orlando, G.; Robertson, J.L.; et al. Raman Chemometric Urinalysis (Rametrix) as a Screen for Bladder Cancer. PLoS ONE 2020, 15, e0237070. [Google Scholar] [CrossRef] [PubMed]
- Jeng, M.-J.; Sharma, M.; Lee, C.-C.; Lu, Y.-S.; Tsai, C.-L.; Chang, C.-H.; Chen, S.-W.; Lin, R.-M.; Chang, L.-B. Raman Spectral Characterization of Urine for Rapid Diagnosis of Acute Kidney Injury. J. Clin. Med. 2022, 11, 4829. [Google Scholar] [CrossRef] [PubMed]
- Moreira, L.P.; Silveira, L.; da Silva, A.G.; Fernandes, A.B.; Pacheco, M.T.T.; Rocco, D.D.F.M. Raman Spectroscopy Applied to Identify Metabolites in Urine of Physically Active Subjects. J. Photochem. Photobiol. B 2017, 176, 92–99. [Google Scholar] [CrossRef]
- Lucas, A.D.; Jones, A.D.; Goodrow, M.H.; Saiz, S.G.; Blewett, C.; Seiber, J.N.; Hammock, B.D. Determination of Atrazine Metabolites in Human Urine: Development of a Biomarker of Exposure. Available online: https://pubs.acs.org/doi/pdf/10.1021/tx00031a017 (accessed on 19 July 2023).
- Bradlow, H.L.; Sepkovic, D.W.; Klug, T.; Osborne, M.P. Application of an Improved ELISA Assay to the Analysis of Urinary Estrogen Metabolites. Steroids 1998, 63, 406–413. [Google Scholar] [CrossRef] [PubMed]
- Zheng, X.-M.; Yang, F.-Y.; Chen, X.; Yang, Y.-H.; Zhu, X.-R.; Chen, C.; Yang, J.-K. Development of a Sensitive and Reliable ELISA Kit of Urinary Haptoglobin to Predict Progress of Diabetic Kidney Disease. Diabetes Metab. Res. Rev. 2021, 37, e3432. [Google Scholar] [CrossRef] [PubMed]
- Shan, G.; Huang, H.; Stoutamire, D.W.; Gee, S.J.; Leng, G.; Hammock, B.D. A Sensitive Class Specific Immunoassay for the Detection of Pyrethroid Metabolites in Human Urine. Chem. Res. Toxicol. 2004, 17, 218–225. [Google Scholar] [CrossRef] [PubMed]
- Wang, Y.; Li, Z.; Barnych, B.; Huo, J.; Wan, D.; Vasylieva, N.; Xu, J.; Li, P.; Liu, B.; Zhang, C.; et al. Investigation of Small Size of Nanobody for Sensitive Fluorescence Polarization Immunoassay for Small Molecule: 3-Phenoxybenzoic Acid, an Exposure Biomarker of Pyrethroid Insecticides as a Model. J. Agric. Food Chem. 2019, 67, 11536–11541. [Google Scholar] [CrossRef] [PubMed]
- Kraemer, T.; Wennig, R.; Maurer, H.H. The Antispasmodic Drug Mebeverine Leads to Positive Amphetamine Results by Fluorescence Polarization Immunoassay (FPIA)—Studies on the Toxicological Analysis of Urine by FPIA and GC-MS. J. Anal. Toxicol. 2001, 25, 333–338. [Google Scholar] [CrossRef][Green Version]
- Hendrickson, O.D.; Taranova, N.A.; Zherdev, A.V.; Dzantiev, B.B.; Eremin, S.A. Fluorescence Polarization-Based Bioassays: New Horizons. Sensors 2020, 20, 7132. [Google Scholar] [CrossRef]
- Sequeira-Antunes, B.; Ferreira, H.A. Urinary Biomarkers and Point-of-Care Urinalysis Devices for Early Diagnosis and Management of Disease: A Review. Biomedicines 2023, 11, 1051. [Google Scholar] [CrossRef]
- Hwang, C.; Lee, W.-J.; Kim, S.D.; Park, S.; Kim, J.H. Recent Advances in Biosensor Technologies for Point-of-Care Urinalysis. Biosensors 2022, 12, 1020. [Google Scholar] [CrossRef]
- Wang, H.; Zheng, F.; Xu, Y.; Mauk, M.G.; Qiu, X.; Tian, Z.; Zhang, L. Recent Progress in Terahertz Biosensors Based on Artificial Electromagnetic Subwavelength Structure. TrAC Trends Anal. Chem. 2023, 158, 116888. [Google Scholar] [CrossRef]
- Wang, G.; Zhu, F.; Lang, T.; Liu, J.; Hong, Z.; Qin, J. All-Metal Terahertz Metamaterial Biosensor for Protein Detection. Nanoscale Res. Lett. 2021, 16, 109. [Google Scholar] [CrossRef]
- EL-Wasif, Z.; Ismail, T.; Hamdy, O. Design and Optimization of Highly Sensitive Multi-Band Terahertz Metamaterial Biosensor for Coronaviruses Detection. Opt. Quantum Electron. 2023, 55, 604. [Google Scholar] [CrossRef] [PubMed]
- Terahertz Biosensing of Protein Based on a Metamaterial|IEEE Conference Publication|IEEE Xplore. Available online: https://ieeexplore.ieee.org/document/7824992 (accessed on 19 July 2023).
- Mehrotra, P.; Chatterjee, B.; Sen, S. EM-Wave Biosensors: A Review of RF, Microwave, Mm-Wave and Optical Sensing. Sensors 2019, 19, 1013. [Google Scholar] [CrossRef] [PubMed]
- Emaminejad, H.; Mir, A.; Farmani, A. Design and Simulation of a Novel Tunable Terahertz Biosensor Based on Metamaterials for Simultaneous Monitoring of Blood and Urine Components. Plasmonics 2021, 16, 1537–1548. [Google Scholar] [CrossRef]
- Matvejev, V.; Zhang, Y.; Stiens, J. High Performance Integrated Terahertz Sensor for Detection of Biomolecular Processes in Solution. IET Microw. Antennas Propag. 2014, 8, 394–400. [Google Scholar] [CrossRef]
- Yang, K.; Li, J.; Lamy de la Chapelle, M.; Huang, G.; Wang, Y.; Zhang, J.; Xu, D.; Yao, J.; Yang, X.; Fu, W. A Terahertz Metamaterial Biosensor for Sensitive Detection of MicroRNAs Based on Gold-Nanoparticles and Strand Displacement Amplification. Biosens. Bioelectron. 2021, 175, 112874. [Google Scholar] [CrossRef]
- Veeraselvam, A.; Mohammed, G.N.A.; Savarimuthu, K. A Novel Ultra-Miniaturized Highly Sensitive Refractive Index-Based Terahertz Biosensor. J. Light. Technol. 2021, 39, 7281–7287. [Google Scholar] [CrossRef]
- Xue, Z.; Mao, P.; Peng, P.; Yan, S.; Zang, Z.; Yao, C. Terahertz Spectra of Proteinuria and Non-Proteinuria. Front. Bioeng. Biotechnol. 2023, 11, 1119694. [Google Scholar] [CrossRef]
- Vaks, V.; Anfertev, V.; Chernyaeva, M.; Domracheva, E.; Yablokov, A.; Maslennikova, A.; Zhelesnyak, A.; Baranov, A.; Schevchenko, Y.; Pereira, M.F. Sensing Nitriles with THz Spectroscopy of Urine Vapours from Cancers Patients Subject to Chemotherapy. Sci. Rep. 2022, 12, 18117. [Google Scholar] [CrossRef]
- Yu, W.; Shi, J.; Huang, G.; Zhou, J.; Zhan, X.; Guo, Z.; Tian, H.; Xie, F.; Yang, X.; Fu, W. THz-ATR Spectroscopy Integrated with Species Recognition Based on Multi-Classifier Voting for Automated Clinical Microbial Identification. Biosensors 2022, 12, 378. [Google Scholar] [CrossRef]
- Vaks, V.; Domracheva, E.; Chernyaeva, M.; Anfertev, V.; Zhukova, E.S.; Shcherbatyuk, T.G. An Application of THz Gas High Resolution Spectroscopy Method for Investigation of Thermal Decomposition Products of Biological Liquid (Urine) of Rats with Dysbacteriosis. In Proceedings of the 2022 IEEE 8th All-Russian Microwave Conference (RMC), Moscow, Russia, 23–25 November 2022; pp. 31–34. [Google Scholar]
- Wishart, D.S.; Guo, A.; Oler, E.; Wang, F.; Anjum, A.; Peters, H.; Dizon, R.; Sayeeda, Z.; Tian, S.; Lee, B.L.; et al. HMDB 5.0: The Human Metabolome Database for 2022. Nucleic Acids Res. 2021, 50, D622–D631. [Google Scholar] [CrossRef]
- Bouatra, S.; Aziat, F.; Mandal, R.; Guo, A.C.; Wilson, M.R.; Knox, C.; Bjorndahl, T.C.; Krishnamurthy, R.; Saleem, F.; Liu, P.; et al. The Human Urine Metabolome. PLoS ONE 2013, 8, e73076. [Google Scholar] [CrossRef] [PubMed]
- da Costa, B.R.B.; De Martinis, B.S. Analysis of Urinary VOCs Using Mass Spectrometric Methods to Diagnose Cancer: A Review. Clin. Mass Spectrom. 2020, 18, 27–37. [Google Scholar] [CrossRef] [PubMed]
- Broza, Y.Y.; Zhou, X.; Yuan, M.; Qu, D.; Zheng, Y.; Vishinkin, R.; Khatib, M.; Wu, W.; Haick, H. Disease Detection with Molecular Biomarkers: From Chemistry of Body Fluids to Nature-Inspired Chemical Sensors. Chem. Rev. 2019, 119, 11761–11817. [Google Scholar] [CrossRef] [PubMed]
- Wen, Q.; Boshier, P.; Myridakis, A.; Belluomo, I.; Hanna, G.B. Urinary Volatile Organic Compound Analysis for the Diagnosis of Cancer: A Systematic Literature Review and Quality Assessment. Metabolites 2020, 11, 17. [Google Scholar] [CrossRef] [PubMed]
- Chakraborty, A.; Dasari, S.; Long, W.; Mohan, C. Urine Protein Biomarkers for the Detection, Surveillance, and Treatment Response Prediction of Bladder Cancer. Am. J. Cancer Res. 2019, 9, 1104–1117. [Google Scholar]
- Swensen, A.C.; He, J.; Fang, A.C.; Ye, Y.; Nicora, C.D.; Shi, T.; Liu, A.Y.; Sigdel, T.K.; Sarwal, M.M.; Qian, W.-J. A Comprehensive Urine Proteome Database Generated From Patients With Various Renal Conditions and Prostate Cancer. Front. Med. 2021, 8, 548212. [Google Scholar] [CrossRef]
- Pisitkun, T.; Johnstone, R.; Knepper, M.A. Discovery of Urinary Biomarkers. Mol. Cell. Proteom. 2006, 5, 1760–1771. [Google Scholar] [CrossRef]
- Herranz, R.; Oto, J.; Plana, E.; Fernández-Pardo, Á.; Cana, F.; Martínez-Sarmiento, M.; Vera-Donoso, C.D.; España, F.; Medina, P. Circulating Cell-Free DNA in Liquid Biopsies as Potential Biomarker for Bladder Cancer: A Systematic Review. Cancers 2021, 13, 1448. [Google Scholar] [CrossRef]
- Ren, S.; Ren, X.-D.; Guo, L.-F.; Qu, X.-M.; Shang, M.-Y.; Dai, X.-T.; Huang, Q. Urine Cell-Free DNA as a Promising Biomarker for Early Detection of Non-Small Cell Lung Cancer. J. Clin. Lab. Anal. 2020, 34, e23321. [Google Scholar] [CrossRef]
- Bazzell, B.G.; Rainey, W.E.; Auchus, R.J.; Zocco, D.; Bruttini, M.; Hummel, S.L.; Byrd, J.B. Human Urinary MRNA as a Biomarker of Cardiovascular Disease. Circ. Genomic Precis. Med. 2018, 11, e002213. [Google Scholar] [CrossRef]
- Urquidi, V.; Netherton, M.; Gomes-Giacoia, E.; Serie, D.; Eckel-Passow, J.; Rosser, C.J.; Goodison, S. Urinary MRNA Biomarker Panel for the Detection of Urothelial Carcinoma. Oncotarget 2016, 7, 38731–38740. [Google Scholar] [CrossRef] [PubMed]
- Iwasaki, H.; Shimura, T.; Kitagawa, M.; Yamada, T.; Nishigaki, R.; Fukusada, S.; Okuda, Y.; Katano, T.; Horike, S.; Kataoka, H. A Novel Urinary MiRNA Biomarker for Early Detection of Colorectal Cancer. Cancers 2022, 14, 461. [Google Scholar] [CrossRef] [PubMed]
- van de Vrie, M.; Deegens, J.K.; Eikmans, M.; van der Vlag, J.; Hilbrands, L.B. Urinary MicroRNA as Biomarker in Renal Transplantation. Am. J. Transplant. 2017, 17, 1160–1166. [Google Scholar] [CrossRef] [PubMed]
- De Matteis, S.; Bonafè, M.; Giudetti, A.M. Urinary Metabolic Biomarkers in Cancer Patients: An Overview. Methods Mol. Biol. 2021, 2292, 203–212. [Google Scholar] [CrossRef]
- Wang, R.; Kang, H.; Zhang, X.; Nie, Q.; Wang, H.; Wang, C.; Zhou, S. Urinary Metabolomics for Discovering Metabolic Biomarkers of Bladder Cancer by UPLC-MS. BMC Cancer 2022, 22, 214. [Google Scholar] [CrossRef] [PubMed]
- Fliser, D.; Novak, J.; Thongboonkerd, V.; Argilés, A.G.A.; Jankowski, V.; Girolami, M.A.; Jankowski, J.; Mischak, H. Advances in Urinary Proteome Analysis and Biomarker Discovery. J. Am. Soc. Nephrol. 2007, 18, 1057. [Google Scholar] [CrossRef]
- FDA-NIH Biomarker Working Group. BEST (Biomarkers, EndpointS, and Other Tools) Resource; Food and Drug Administration: Silver Spring, MD, USA, 2016.
- Kourou, K.; Exarchos, T.P.; Exarchos, K.P.; Karamouzis, M.V.; Fotiadis, D.I. Machine Learning Applications in Cancer Prognosis and Prediction. Comput. Struct. Biotechnol. J. 2015, 13, 8–17. [Google Scholar] [CrossRef]
- Gaidai, O.; Yan, P.; Xing, Y. Future World Cancer Death Rate Prediction. Sci. Rep. 2023, 13, 303. [Google Scholar] [CrossRef]
- Weir, H.K. Cancer Incidence Projections in the United States Between 2015 and 2050. Prev. Chronic. Dis. 2021, 18, E59. [Google Scholar] [CrossRef]
- Gasparri, R.; Sedda, G.; Caminiti, V.; Maisonneuve, P.; Prisciandaro, E.; Spaggiari, L. Urinary Biomarkers for Early Diagnosis of Lung Cancer. J. Clin. Med. 2021, 10, 1723. [Google Scholar] [CrossRef]
- Haznadar, M.; Cai, Q.; Krausz, K.W.; Bowman, E.D.; Margono, E.; Noro, R.; Thompson, M.D.; Mathé, E.A.; Munro, H.M.; Steinwandel, M.D.; et al. Urinary Metabolite Risk Biomarkers of Lung Cancer: A Prospective Cohort Study. Cancer Epidemiol. Biomark. Prev. 2016, 25, 978–986. [Google Scholar] [CrossRef]
- Carrola, J.; Rocha, C.M.; Barros, A.S.; Gil, A.M.; Goodfellow, B.J.; Carreira, I.M.; Bernardo, J.; Gomes, A.; Sousa, V.; Carvalho, L.; et al. Metabolic Signatures of Lung Cancer in Biofluids: NMR-Based Metabonomics of Urine. J. Proteome Res. 2011, 10, 221–230. [Google Scholar] [CrossRef] [PubMed]
- Silva, C.L.; Passos, M.; Câmara, J.S. Investigation of Urinary Volatile Organic Metabolites as Potential Cancer Biomarkers by Solid-Phase Microextraction in Combination with Gas Chromatography-Mass Spectrometry. Br. J. Cancer 2011, 105, 1894–1904. [Google Scholar] [CrossRef] [PubMed]
- Zahran, F.; Rashed, R.; Omran, M.; Darwish, H.; Belal, A. Study on Urinary Candidate Metabolome for the Early Detection of Breast Cancer. Indian J. Clin. Biochem. 2021, 36, 319–329. [Google Scholar] [CrossRef] [PubMed]
- Silva, C.L.; Olival, A.; Perestrelo, R.; Silva, P.; Tomás, H.; Câmara, J.S. Untargeted Urinary 1H NMR-Based Metabolomic Pattern as a Potential Platform in Breast Cancer Detection. Metabolites 2019, 9, 269. [Google Scholar] [CrossRef]
- Wittmann, B.M.; Stirdivant, S.M.; Mitchell, M.W.; Wulff, J.E.; McDunn, J.E.; Li, Z.; Dennis-Barrie, A.; Neri, B.P.; Milburn, M.V.; Lotan, Y.; et al. Bladder Cancer Biomarker Discovery Using Global Metabolomic Profiling of Urine. PLoS ONE 2014, 9, e115870. [Google Scholar] [CrossRef]
- Fujita, K.; Nonomura, N. Urinary Biomarkers of Prostate Cancer. Int. J. Urol. Off. J. Jpn. Urol. Assoc. 2018, 25, 770–779. [Google Scholar] [CrossRef]
- Yang, B.; Zhang, C.; Cheng, S.; Li, G.; Griebel, J.; Neuhaus, J. Novel Metabolic Signatures of Prostate Cancer Revealed by 1H-NMR Metabolomics of Urine. Diagnostics 2021, 11, 149. [Google Scholar] [CrossRef]
- Kdadra, M.; Höckner, S.; Leung, H.; Kremer, W.; Schiffer, E. Metabolomics Biomarkers of Prostate Cancer: A Systematic Review. Diagnostics 2019, 9, 21. [Google Scholar] [CrossRef]
- Khalid, T.; Aggio, R.; White, P.; De Lacy Costello, B.; Persad, R.; Al-Kateb, H.; Jones, P.; Probert, C.S.; Ratcliffe, N. Urinary Volatile Organic Compounds for the Detection of Prostate Cancer. PLoS ONE 2015, 10, e0143283. [Google Scholar] [CrossRef]
- Kwon, H.N.; Lee, H.; Park, J.W.; Kim, Y.-H.; Park, S.; Kim, J.J. Screening for Early Gastric Cancer Using a Noninvasive Urine Metabolomics Approach. Cancers 2020, 12, 2904. [Google Scholar] [CrossRef] [PubMed]
- Li, D.; Yan, L.; Lin, F.; Yuan, X.; Yang, X.; Yang, X.; Wei, L.; Yang, Y.; Lu, Y. Urinary Biomarkers for the Noninvasive Detection of Gastric Cancer. J. Gastric Cancer 2022, 22, 306–318. [Google Scholar] [CrossRef] [PubMed]
- Deng, L.; Ismond, K.P.; Liu, Z.; Constable, J.; Wang, H.; Alatise, O.I.; Weiser, M.R.; Kingham, T.P.; Chang, D. Urinary Metabolomics to Identify a Unique Biomarker Panel for Detecting Colorectal Cancer: A Multicentre Study. Cancer Epidemiol. Biomark. Prev. 2019, 28, 1283–1291. [Google Scholar] [CrossRef] [PubMed]
- Hipperson, L.; Hadden, W.J.; Nahm, C.B.; Gill, A.J.; Samra, J.S.; Dona, A.; Mittal, A.; Sahni, S. Urinary Metabolite Prognostic Biomarker Panel for Pancreatic Ductal Adenocarcinomas. Biochim. Biophys. Acta Gen. Subj. 2021, 1865, 129966. [Google Scholar] [CrossRef]
- Cartlidge, C.R.; Abellona U, M.R.; Alkhatib, A.M.A.; Taylor-Robinson, S.D. The Utility of Biomarkers in Hepatocellular Carcinoma: Review of Urine-Based 1H-NMR Studies–What the Clinician Needs to Know. Int. J. Gen. Med. 2017, 10, 431–442. [Google Scholar] [CrossRef]
- Guan, M.-C.; Ouyang, W.; Wang, M.-D.; Liang, L.; Li, N.; Fu, T.-T.; Shen, F.; Lau, W.-Y.; Xu, Q.-R.; Huang, D.-S.; et al. Biomarkers for Hepatocellular Carcinoma Based on Body Fluids and Feces. World J. Gastrointest. Oncol. 2021, 13, 351–365. [Google Scholar] [CrossRef]
- Shin, W.; Park, S.-Y.; Kang, S.; Lim, M.C.; Seo, S.-S. How to Manage Synchronous Endometrial and Ovarian Cancer Patients? BMC Cancer 2021, 21, 489. [Google Scholar] [CrossRef]
- Shao, X.; Wang, K.; Liu, X.; Gu, C.; Zhang, P.; Xie, J.; Liu, W.; Sun, L.; Chen, T.; Li, Y. Screening and Verifying Endometrial Carcinoma Diagnostic Biomarkers Based on a Urine Metabolomic Profiling Study Using UPLC-Q-TOF/MS. Clin. Chim. Acta 2016, 463, 200–206. [Google Scholar] [CrossRef]
- Njoku, K.; Chiasserini, D.; Jones, E.R.; Barr, C.E.; O’Flynn, H.; Whetton, A.D.; Crosbie, E.J. Urinary Biomarkers and Their Potential for the Non-Invasive Detection of Endometrial Cancer. Front. Oncol. 2020, 10, 559016. [Google Scholar] [CrossRef]
- Dinges, S.S.; Hohm, A.; Vandergrift, L.A.; Nowak, J.; Habbel, P.; Kaltashov, I.A.; Cheng, L.L. Cancer Metabolomic Markers in Urine: Evidence, Techniques and Recommendations. Nat. Rev. Urol. 2019, 16, 339–362. [Google Scholar] [CrossRef]
- Lu, J.-Y.; You, B.; Wang, J.-Y.; Jhuo, S.-S.; Hung, T.-Y.; Yu, C.-P. Volatile Gas Sensing through Terahertz Pipe Waveguide. Sensors 2020, 20, 6268. [Google Scholar] [CrossRef] [PubMed]
- Dey, I.; Jana, K.; Fedorov, V.Y.; Koulouklidis, A.D.; Mondal, A.; Shaikh, M.; Sarkar, D.; Lad, A.D.; Tzortzakis, S.; Couairon, A.; et al. Highly Efficient Broadband Terahertz Generation from Ultrashort Laser Filamentation in Liquids. Nat. Commun. 2017, 8, 1184. [Google Scholar] [CrossRef] [PubMed]
- Wang, F.; Sun, X.; Zan, J.; Li, M.; Liu, Y.; Chen, J. Terahertz Spectra and Weak Intermolecular Interactions of Nucleosides or Nucleoside Drugs. Spectrochim. Acta. A Mol. Biomol. Spectrosc. 2022, 265, 120344. [Google Scholar] [CrossRef] [PubMed]
- Liu, Y.; Zhou, T.; Cao, J.-C. Terahertz Spectral of Enantiomers and Racemic Amino Acids by Time-Domain-Spectroscopy Technology. Infrared Phys. Technol. 2019, 96, 17–21. [Google Scholar] [CrossRef]
- Wang, H.; Shi, W.; Hou, L.; Wang, Z.; Wu, M.; Li, C.; Li, C. Effect of THz Spectra of L-Arginine Molecules by the Combination of Water Molecules. iScience 2022, 25, 103788. [Google Scholar] [CrossRef]
- Korter, T.M.; Balu, R.; Campbell, M.B.; Beard, M.C.; Gregurick, S.K.; Heilweil, E.J. Terahertz Spectroscopy of Solid Serine and Cysteine. Chem. Phys. Lett. 2006, 418, 65–70. [Google Scholar] [CrossRef]
- Huang, H.; Shao, S.; Wang, G.; Ye, P.; Su, B.; Zhang, C. Terahertz Spectral Properties of Glucose and Two Disaccharides in Solid and Liquid States. iScience 2022, 25, 104102. [Google Scholar] [CrossRef]
- Ye, P.; Wang, G.; Yang, Y.; Meng, Q.; Wang, J.; Su, B.; Zhang, C. Terahertz Absorption Properties of Two Solid Amino Acids and Their Aqueous Solutions. Int. J. Opt. 2021, 2021, e9203999. [Google Scholar] [CrossRef]
- Bian, Y.; Zhu, Z.; Zhang, X.; Zeng, R.; Yang, B. Terahertz Spectroscopy for Quantitatively Elucidating the Crystal Transformation of Chiral Histidine Enantiomers to Racemic Compounds. Food Chem. 2023, 406, 135043. [Google Scholar] [CrossRef]
- Puc, U.; Abina, A.; Jeglič, A.; Zidanšek, A.; Kašalynas, I.; Venckevičius, R.; Valušis, G. Spectroscopic Analysis of Melatonin in the Terahertz Frequency Range. Sensors 2018, 18, 4098. [Google Scholar] [CrossRef]
- Allen, J.L.; Sanders, T.J.; Plathe, R.; Appadoo, D.; Horvat, J.; Lewis, R.A. Temperature-Dependent Terahertz Spectroscopy of l-Phenylalanine. Spectrochim. Acta. A Mol. Biomol. Spectrosc. 2021, 260, 119922. [Google Scholar] [CrossRef] [PubMed]
- Chen, T.; Zhang, Q.; Li, Z.; Hu, F. Intermolecular Weak Interactions of Crystalline Purine and Uric Acid Investigated by Terahertz Spectroscopy and Theoretical Calculation. J. Lumin. 2020, 223, 117198. [Google Scholar] [CrossRef]
- King, M.D.; Hakey, P.M.; Korter, T.M. Discrimination of Chiral Solids: A Terahertz Spectroscopic Investigation of l- and Dl-Serine. Available online: https://pubs.acs.org/doi/epdf/10.1021/jp911863v (accessed on 27 July 2023).
- Dai, Z.; Xu, X.; Gu, Y.; Li, X.; Wang, F.; Lian, Y.; Fan, K.; Cheng, X.; Chen, Z.; Sun, M.; et al. A Terahertz Study of Taurine: Dispersion Correction and Mode Couplings. J. Chem. Phys. 2017, 146, 124119. [Google Scholar] [CrossRef] [PubMed]
- Yu, B.; Zeng, F.; Yang, Y.; Xing, Q.; Chechin, A.; Xin, X.; Zeylikovich, I.; Alfano, R.R. Torsional Vibrational Modes of Tryptophan Studied by Terahertz Time-Domain Spectroscopy. Biophys. J. 2004, 86, 1649–1654. [Google Scholar] [CrossRef] [PubMed]
- Hu, M.; Tang, M.; Wang, H.; Zhang, M.; Zhu, S.; Yang, Z.; Zhou, S.; Zhang, H.; Hu, J.; Guo, Y.; et al. Terahertz, Infrared and Raman Absorption Spectra of Tyrosine Enantiomers and Racemic Compound. Spectrochim. Acta. A Mol. Biomol. Spectrosc. 2021, 254, 119611. [Google Scholar] [CrossRef] [PubMed]
- Zhao, Y.; Li, Z.; Liu, J.; Hu, C.; Zhang, H.; Qin, B.; Wu, Y. Intermolecular Vibrational Modes and H-Bond Interactions in Crystalline Urea Investigated by Terahertz Spectroscopy and Theoretical Calculation. Spectrochim. Acta. A Mol. Biomol. Spectrosc. 2018, 189, 528–534. [Google Scholar] [CrossRef]
- Aitekenov, S.; Gaipov, A.; Bukasov, R. Review: Detection and Quantification of Proteins in Human Urine. Talanta 2021, 223, 121718. [Google Scholar] [CrossRef]
- Laíns, I.; Duarte, D.; Barros, A.S.; Martins, A.S.; Carneiro, T.J.; Gil, J.Q.; Miller, J.B.; Marques, M.; Mesquita, T.S.; Barreto, P.; et al. Urine Nuclear Magnetic Resonance (NMR) Metabolomics in Age-Related Macular Degeneration. J. Proteome Res. 2019, 18, 1278–1288. [Google Scholar] [CrossRef]
- Ramirez, C.A.M.; Stringfellow, H.; Naik, R.; Crosbie, E.J.; Paraskevaidi, M.; Rehman, I.U.; Martin-Hirsch, P. Infrared Spectroscopy of Urine for the Non-Invasive Detection of Endometrial Cancer. Cancers 2022, 14, 5015. [Google Scholar] [CrossRef]
- Finlayson, D.; Rinaldi, C.; Baker, M.J. Is Infrared Spectroscopy Ready for the Clinic? Anal. Chem. 2019, 91, 12117–12128. [Google Scholar] [CrossRef]
- Yu, M.-C.; Rich, P.; Foreman, L.; Smith, J.; Yu, M.-S.; Tanna, A.; Dibbur, V.; Unwin, R.; Tam, F.W.K. Label Free Detection of Sensitive Mid-Infrared Biomarkers of Glomerulonephritis in Urine Using Fourier Transform Infrared Spectroscopy. Sci. Rep. 2017, 7, 4601. [Google Scholar] [CrossRef] [PubMed]
- Weisenstein, C.; Wigger, A.K.; Richter, M.; Sczech, R.; Bosserhoff, A.K.; Bolívar, P.H. THz Detection of Biomolecules in Aqueous Environments—Status and Perspectives for Analysis Under Physiological Conditions and Clinical Use. J. Infrared Millim. Terahertz Waves 2021, 42, 607–646. [Google Scholar] [CrossRef]
- Lin, S.; Chen, J.; Liu, W.; Peng, Z.; Chen, Z.; Hu, F. Detection of Biomarkers Using Terahertz Metasurface Sensors and Machine Learning. Appl. Opt. 2023, 62, 1027–1034. [Google Scholar] [CrossRef] [PubMed]
- Abina, A.; Korošec, T.; Puc, U.; Zidanšek, A. Review of Bioplastics Characterisation by Terahertz Techniques in the View of Ensuring a Circular Economy. Photonics 2023, 10, 883. [Google Scholar] [CrossRef]
- Smith, P.R.; Auston, D.H.; Nuss, M.C. Subpicosecond Photoconducting Dipole Antennas. IEEE J. Quantum Electron. 1988, 24, 255–260. [Google Scholar] [CrossRef]
- Fattinger, C.; Grischkowsky, D.R. A Cherenkov Source for Freely-Propagating Terahertz Beams. IEEE J. Quantum Electron. 1989, 25, 2608–2610. [Google Scholar] [CrossRef]
- Grischkowsky, D.; Keiding, S.; van Exter, M.; Fattinger, C. Far-Infrared Time-Domain Spectroscopy with Terahertz Beams of Dielectrics and Semiconductors. JOSA B 1990, 7, 2006–2015. [Google Scholar] [CrossRef]
- Puc, U.; Bach, T.; Günter, P.; Zgonik, M.; Jazbinsek, M. Ultra-Broadband and High-Dynamic-Range THz Time-Domain Spectroscopy System Based on Organic Crystal Emitter and Detector in Transmission and Reflection Geometry. Adv. Photonics Res. 2021, 2, 2000098. [Google Scholar] [CrossRef]
- Hu, B.B.; Nuss, M.C. Imaging with Terahertz Waves. Opt. Lett. 1995, 20, 1716–1718. [Google Scholar] [CrossRef]
- Pickwell, E.; Wallace, V.P. Biomedical Applications of Terahertz Technology. J. Phys. Appl. Phys. 2006, 39, R301. [Google Scholar] [CrossRef]
- Humphreys, K.; Loughran, J.P.; Gradziel, M.; Lanigan, W.; Ward, T.; Murphy, J.A.; O’Sullivan, C. Medical Applications of Terahertz Imaging: A Review of Current Technology and Potential Applications in Biomedical Engineering. In Proceedings of the 26th Annual International Conference of the IEEE Engineering in Medicine and Biology Society, San Francisco, CA, USA, 1–5 September 2004; Volume 1, pp. 1302–1305. [Google Scholar]
- Menikh, A.; MacColl, R.; Mannella, C.A.; Zhang, X.-C. Terahertz Biosensing Technology: Frontiers and Progress. ChemPhysChem 2002, 3, 655–658. [Google Scholar] [CrossRef] [PubMed]
- Berry, E.; Fitzgerald, A.J.; Zinov’ev, N.N.; Walker, G.C.; Homer-Vanniasinkam, S.; Sudworth, C.D.; Miles, R.E.; Chamberlain, J.M.; Smith, M.A. Optical Properties of Tissue Measured Using Terahertz-Pulsed Imaging. In Proceedings of the Medical Imaging 2003: Physics of Medical Imaging, San Diego, CA, USA, 15–20 February 2003; Volume 5030, pp. 459–470. [Google Scholar]
- Jazbinsek, M.; Puc, U.; Abina, A.; Zidansek, A. Organic Crystals for THz Photonics. Appl. Sci. 2019, 9, 882. [Google Scholar] [CrossRef]
- Lewis, R.A. Terahertz Imaging and Spectroscopy Methods and Instrumentation. In Encyclopedia of Spectroscopy and Spectrometry, 3rd ed.; Lindon, J.C., Tranter, G.E., Koppenaal, D.W., Eds.; Academic Press: Oxford, UK, 2017; pp. 422–426. ISBN 978-0-12-803224-4. [Google Scholar]
- Neu, J.; Schmuttenmaer, C.A. Tutorial: An Introduction to Terahertz Time Domain Spectroscopy (THz-TDS). J. Appl. Phys. 2018, 124, 231101. [Google Scholar] [CrossRef]
- Morais, C.L.M.; Lima, K.M.G.; Singh, M.; Martin, F.L. Tutorial: Multivariate Classification for Vibrational Spectroscopy in Biological Samples. Nat. Protoc. 2020, 15, 2143–2162. [Google Scholar] [CrossRef] [PubMed]
- Engdahl, A. Microspectroscopic Infrared Specular Reflection Studies of Multi-Component Urinary Stones at Beamline D7 at the MAX IV Laboratory, Lund Sweden. In Proceedings of the 2015 40th International Conference on Infrared, Millimeter, and Terahertz waves (IRMMW-THz), Hong Kong, China, 23–28 August 2015; pp. 1–2. [Google Scholar]
- Robinson, S.; Dhanlaksmi, N. Photonic Crystal Based Biosensor for the Detection of Glucose Concentration in Urine. Photonic Sens. 2017, 7, 11–19. [Google Scholar] [CrossRef]
- Mazaheri, Z.; Koral, C.; Andreone, A.; Marino, A. Terahertz Time-Domain Ellipsometry: Tutorial. JOSA A 2022, 39, 1420–1433. [Google Scholar] [CrossRef]
- Ketelsen, H.; Mästle, R.; Liebermeister, L.; Kohlhaas, R.; Globisch, B. THz Time-Domain Ellipsometer for Material Characterization and Paint Quality Control with More Than 5 THz Bandwidth. Appl. Sci. 2022, 12, 3744. [Google Scholar] [CrossRef]
- Agulto, V.C.; Iwamoto, T.; Kitahara, H.; Toya, K.; Mag-usara, V.K.; Imanishi, M.; Mori, Y.; Yoshimura, M.; Nakajima, M. Terahertz Time-Domain Ellipsometry with High Precision for the Evaluation of GaN Crystals with Carrier Densities up to 1020 cm−3. Sci. Rep. 2021, 11, 18129. [Google Scholar] [CrossRef]
- Jeong, Y.U.; Jang, K.-H.; Bae, S.; Pathania, V.; Mun, J.; Lee, K. Prospects of a Terahertz Free-Electron Laser for Field Application. J. Korean Phys. Soc. 2022, 80, 367–376. [Google Scholar] [CrossRef]
- Koral, C.; Mazaheri, Z.; Papari, G.P.; Andreone, A.; Drebot, I.; Giove, D.; Masullo, M.R.; Mettivier, G.; Opromolla, M.; Paparo, D.; et al. Multi-Pass Free Electron Laser Assisted Spectral and Imaging Applications in the Terahertz/Far-IR Range Using the Future Superconducting Electron Source BriXSinO. Front. Phys. 2022, 10, 725901. [Google Scholar] [CrossRef]
- Jeong, K.; Huh, Y.-M.; Kim, S.-H.; Park, Y.; Son, J.-H.; Oh, S.J.; Suh, J.-S. Characterization of Blood Using Terahertz Waves. J. Biomed. Opt. 2013, 18, 107008. [Google Scholar] [CrossRef] [PubMed]
- Reid, C.B.; Reese, G.; Gibson, A.P.; Wallace, V.P. Terahertz Time-Domain Spectroscopy of Human Blood. IEEE J. Biomed. Health Inform. 2013, 17, 774–778. [Google Scholar] [CrossRef] [PubMed]
- Lykina, A.A.; Nazarov, M.M.; Konnikova, M.R.; Mustafin, I.A.; Vaks, V.L.; Anfertev, V.A.; Domracheva, E.G.; Chernyaeva, M.B.; Kistenev, Y.V.; Vrazhnov, D.A.; et al. Terahertz Spectroscopy of Diabetic and Non-Diabetic Human Blood Plasma Pellets. J. Biomed. Opt. 2021, 26, 043006. [Google Scholar] [CrossRef] [PubMed]
- Kistenev, Y.; Borisov, A.; Titarenko, M.; Baydik, O.; Shapovalov, A. Diagnosis of Oral Lichen Planus from Analysis of Saliva Samples Using Terahertz Time-Domain Spectroscopy and Chemometrics. J. Biomed. Opt. 2018, 23, 1–8. [Google Scholar] [CrossRef] [PubMed]
- Tabib–Azar, M. Terahertz Detection of Deoxyribonucleic Bases, Viruses and Nano Particles. In Proceedings of the 2022 IEEE Sensors, Dallas, TX, USA, 30 October–2 November 2022; pp. 1–4. [Google Scholar]
- Knyazkova, A.I.; Yunusova, N.V.; Tugutova, E.A.; Ilyasova, E.E.; Sandykova, E.A.; Zasedatel, V.S. THz Laser Spectroscopy Exosome Analysis of Saliva and Blood Plasma. In Proceedings of the International Conference on Atomic and Molecular Pulsed Lasers XIII, Tomsk, Russia, 10–15 September 2017; Volume 10614, pp. 382–387. [Google Scholar]
- Vaks, V.L.; Domracheva, E.G.; Chernyaeva, M.B.; Anfertev, V.A.; Maslennikova, A.V.; Zheleznyak, A.V.; Knyazeva, T.D.; Rodionov, M.A.; Maiorov, A.I. Application of a High-Resolution Terahertz Gas Spectroscopy Method to Compositional Analysis of Thermal Decomposition Products of Human Fluids (Urine). J. Opt. Technol. 2022, 89, 243–249. [Google Scholar] [CrossRef]
- Tripathi, S.R.; Miyata, E.; Ishai, P.B.; Kawase, K. Morphology of Human Sweat Ducts Observed by Optical Coherence Tomography and Their Frequency of Resonance in the Terahertz Frequency Region. Sci. Rep. 2015, 5, 9071. [Google Scholar] [CrossRef]
- Hashimoto, K.; Ishai, P.B.; Bründermann, E.; Tripathi, S.R. Dielectric Property Measurement of Human Sweat Using Attenuated Total Reflection Terahertz Time Domain Spectroscopy. Biomed. Opt. Express 2022, 13, 4572–4582. [Google Scholar] [CrossRef]
- Peng, Y.; Shi, C.; Zhu, Y.; Gu, M.; Zhuang, S. Terahertz Spectroscopy in Biomedical Field: A Review on Signal-to-Noise Ratio Improvement. PhotoniX 2020, 1, 12. [Google Scholar] [CrossRef]
- Bethea, M.; Forman, D.T. Beta 2-Microglobulin: Its Significance and Clinical Usefulness. Ann. Clin. Lab. Sci. 1990, 20, 163–168. [Google Scholar]
- Bolisetty, S.; Agarwal, A. Urine Albumin as a Biomarker in Acute Kidney Injury. Am. J. Physiol. Ren. Physiol. 2011, 300, F626–F627. [Google Scholar] [CrossRef]
- Yang, S.; Liu, S.; Zuo, J.; Zhang, C. Research of Biological Liquid Albumin Based on Terahertz Time Domain Spectroscopy. In Proceedings of the Infrared, Millimeter-Wave, and Terahertz Technologies IV, Beijing, China, 12–14 October 2016; Volume 10030, pp. 456–462. [Google Scholar]
- Li, T.; Ma, H.; Peng, Y.; Chen, X.; Zhu, Z.; Wu, X.; Kou, T.; Song, B.; Guo, S.; Liu, L.; et al. Gaussian Numerical Analysis and Terahertz Spectroscopic Measurement of Homocysteine. Biomed. Opt. Express 2018, 9, 5467–5476. [Google Scholar] [CrossRef] [PubMed]
- Davies, A.G. Development of a Portable Coherent THz Spectroscopy System for Medical Diagnosis. Available online: https://gow.epsrc.ukri.org/NGBOViewGrant.aspx?GrantRef=GR/N20386/01 (accessed on 20 July 2023).
- Vaks, V.L.; Domracheva, E.G.; Pripolzin, S.I.; Chernyaeva, M.B. High Resolution Terahertz Spectroscopy for Medical, Biological and Agricultural Applications. EPJ Web Conf. 2018, 195, 10014. [Google Scholar] [CrossRef][Green Version]
- Vaks, V.; Anfertev, V.; Chernyaeva, M.; Domracheva, E.; Shcherbatyuk, T.G.; Zhukova, E.S. Analysis of Rodent’s Urine Vapors with Using THz High Resolution Spectrometer for Revealing the Markers of Dysbacteriosis. Int. Conf. Adv. Laser Technol. ALT 2022, 217. [Google Scholar] [CrossRef]
- Lee, K.; Jeoung, K.; Kim, S.H.; Ji, Y.; Son, H.; Choi, Y.; Huh, Y.-M.; Suh, J.-S.; Oh, S.J. Measuring Water Contents in Animal Organ Tissues Using Terahertz Spectroscopic Imaging. Biomed. Opt. Express 2018, 9, 1582–1589. [Google Scholar] [CrossRef] [PubMed]
- Globus, T.; Dorofeeva, T.; Sizov, I.; Gelmont, B.; Lvovska, M.; Khromova, T.; Chertihin, O.; Koryakina, Y. Sub-THz Vibrational Spectroscopy of Bacterial Cells and Molecular Components. Am. J. Biomed. Eng. 2012, 2, 143–154. [Google Scholar] [CrossRef]
- Yang, X.; Yang, K.; Luo, Y.; Fu, W. Terahertz Spectroscopy for Bacterial Detection: Opportunities and Challenges. Appl. Microbiol. Biotechnol. 2016, 100, 5289–5299. [Google Scholar] [CrossRef]
- Wang, J.; Peng, L.; Han, D.; Zheng, T.; Chang, T.; Cui, H.-L. Label-Free Detection and Identification of Single Bacteria via Terahertz near-Field Imaging. Front. Microbiol. 2023, 14, 1195448. [Google Scholar] [CrossRef]
- Yoon, S.A.; Cha, S.H.; Jun, S.W.; Park, S.J.; Park, J.-Y.; Lee, S.; Kim, H.S.; Ahn, Y.H. Identifying Different Types of Microorganisms with Terahertz Spectroscopy. Biomed. Opt. Express 2019, 11, 406–416. [Google Scholar] [CrossRef]
- Tych, K.M.; Burnett, A.D.; Wood, C.D.; Malham, R.W.; Li, L.; Cunningham, J.E.; Pearson, A.R.; Paci, E.; Linfield, E.H.; Davies, A.G. Terahertz Time-Domain Spectroscopy of Lysozyme and Mouse Urinary Protein Single Crystals. In Proceedings of the 2013 38th International Conference on Infrared, Millimeter, and Terahertz Waves (IRMMW-THz), Mainz, Germany, 1–6 September 2013; pp. 1–2. [Google Scholar]


Disclaimer/Publisher’s Note: The statements, opinions and data contained in all publications are solely those of the individual author(s) and contributor(s) and not of MDPI and/or the editor(s). MDPI and/or the editor(s) disclaim responsibility for any injury to people or property resulting from any ideas, methods, instructions or products referred to in the content. |
© 2023 by the authors. Licensee MDPI, Basel, Switzerland. This article is an open access article distributed under the terms and conditions of the Creative Commons Attribution (CC BY) license (https://creativecommons.org/licenses/by/4.0/).