Article

Rapid Determination of Ochratoxin A in Black Tea Using Terahertz Ultrasensitive Biosensor

1
Terahertz Technology Innovation Research Institute, Shanghai Key Lab of Modern Optical System, Terahertz Science Cooperative Innovation Center University of Shanghai for Science and Technology Shanghai Institute of Intelligent Science and Technology, Shanghai 200093, China
2
School of Pharmacy, Shanghai University of Traditional Chinese Medicine, Shanghai 201203, China
*
Author to whom correspondence should be addressed.
These authors contributed equally to this work.
Photonics 2024, 11(1), 9; https://doi.org/10.3390/photonics11010009
Submission received: 17 November 2023 / Revised: 11 December 2023 / Accepted: 21 December 2023 / Published: 22 December 2023
(This article belongs to the Special Issue THz Imaging and Spectroscopy)

Abstract

:
Ochratoxin A (OTA), which is highly toxic and carcinogenic, is easily produced in cereal crops, dry herbs, and other foods under improper storage. Traditional detection methods, including high-performance liquid chromatography (HPLC) and enzyme-linked immunosorbent assay (ELISA), can detect OTA accurately, but there are many problems such as long period, high cost, and poor reproducibility. Therefore, developing a rapid, non-destructive, and highly sensitive method for OTA detection is essential. In this paper, we used a surface plasmon resonance (SPR) biosensor combined with terahertz (THz) spectroscopy to quantify OTA. As a result, the concentration range of OTA in acetonitrile solution was up to 0–20 pg/μL, with a detection limit of 1 pg/μL, which can meet the requirements for OTA detection in most foods. Further, we applied this method to black tea, and the detection limit was up to 1 pg/mg, which is 500 times higher than UV spectrophotometry, and completely meets the EU regulations. This study shows that the combination of terahertz spectroscopy and an SPR biosensor is a promising approach to achieve a simple, rapid, and low-cost method for trace substance quantification in foods and drugs.

1. Introduction

Ochratoxin A is a common mycotoxin produced by various Aspergillus and Penicillium species. It holds a prominent position among the ochratoxin family due to its widespread occurrence and remarkable stability [1]. It is often detected in food and crops, such as herbs, coffee, corn, wheat, and oats [2,3,4]. As of now, hundreds of mycotoxins have been identified [3]. The contamination of plant-based foods with ochratoxins presents a significant and urgent public health concern [5]. OTA is readily absorbed by humans and animals, leading to various health concerns owing to its toxicological effects, including teratogenicity, immunotoxicity, carcinogenicity, genotoxicity, neurotoxicity, and hepatotoxicity, while its slow metabolism results in a half-life of more than a month [6,7,8]. Therefore, OTA has been classified as a class 2B agent by the International Agency for Research on Cancer, indicating that it is potentially carcinogenic for humans [2,6]. Due to its chemical and thermal stability, it can remain persistent even at temperatures between 80 and 121 °C during food processing [3]. As a common herbal beverage [9], the regular brewing or decocting process of black tea may have difficulty reaching the temperature that kills OTA, leaving behind health hazards. Given its adverse effects on human health and the economic losses it can cause, OTA contamination has garnered escalating global attention [10]. Many countries have established specific limits for OTA concentration in plant-based foods. Within the European Union, maximum allowable levels for OTA have been defined, with 10 pg/mg for dried herbs [11]. Therefore, the development of a simple, sensitive, and rapid method for OTA detection in plant-based foods is essential.
There are already some developed methods for OTA detection, including HPLC, ELISA, liquid chromatography–mass spectrometry (LC-MS), etc. [12,13,14]. For example, Zeng et al. developed an HPLC method with liquid–liquid extraction purification for the determination of OTA in black tea, and the limit of detection could reach 5.2 pg/mg [15]. Yu et al. developed a competitive ELISA for the rapid detection of OTA in cassava leaf powder, achieving a detection limit as low as 5 pg/mg using a monoclonal antibody and enzyme-labeled antigen [16]. Li et al. developed a method for the determination of OTA in Pu-erh tea using ultra-performance liquid chromatography–tandem mass spectrometry (UPLC-MS), with a limit of detection of 0.1 pg/mg [17]. These methods provide high accuracy and sensitivity, but there are some drawbacks, such as a time-consuming and complex pre-treatment, long period, high cost of testing, poor reproducibility, and damage of samples; therefore, they cannot meet the market requirements for rapid detection [18]. In recent years, spectroscopy techniques including UV spectrophotometry, near-infrared spectroscopy, and Raman spectroscopy have been used for the rapid detection and quantitative analysis of various compounds, providing the basis for the identification of OTA [19,20,21]. However, these methods are unable to detect the far-infrared spectral region, which contains a great deal of physical and chemical information about the compound. Therefore, there is an urgent need for a highly sensitive, rapid, and non-destructive method for the detection of OTA.
Terahertz waves are typically defined as electromagnetic waves within the frequency range of 0.1 to 10 THz [22,23]. THz waves allow non-destructive detection with high penetration and spectral fingerprinting, which is the last part of electromagnetic waves to be explored [24,25]. Since the absorption of terahertz waves is mainly excited by intramolecular and intermolecular vibrations, some biological and chemical molecules will exhibit fingerprint absorption peaks in the terahertz band [26,27]. However, conventional terahertz spectroscopy has proven difficult for the detection of trace compounds with high toxicity [28,29,30]. This limitation could be attributed to the mismatch between the THz wave’s wavelength and the size of the target molecule, which restricts the sensitivity of identifying trace analytes using terahertz radiation in free space [31]. In order to improve the sensitivity of biochemical assays, researchers have used a variety of artificial structures fabricated using metamaterials. Metamaterials have several significant advantages, including easy preparation, rapid processing, and high sensitivity [32,33,34]. Consequently, metamaterials are being researched for use in the detection of trace substances [35,36,37]. Based on the redshifts and blueshifts of the plasma resonance peaks of metamaterial structures, these researchers are able to detect trace substances quantitatively [38]. In recent years, the technique has been widely used to detect biological and chemical molecules due to its high sensitivity [39].
In this work, we used an SPR biosensor, which improved the stability and detection limit of the test. Firstly, we obtained the absorption spectra of OTA in acetonitrile solution in the concentration range of 1–20 pg/μL with an SPR biosensor combined with THz-TDS to assess the potential for quantitative analysis of OTA. Subsequently, we further tested OTA in black tea and compared it with UV spectrophotometry to evaluate the ability of TDS to detect OTA. The purpose of this study was to determine the OTA content in the food with a high-sensitivity biosensor combined with THz spectroscopy. The innovations of this research are as follows: (1) we quantified OTA in black tea under the 2023 edition of the European Union standards; (2) the detection limit can be up to 1 pg/mg, which is 500 times higher than that of UV spectrophotometry. This study provides a reference for future quantitative detection of molds in food products. The method established in this study also provides new approaches to the trace detection of small molecules by terahertz spectroscopy.

2. Materials and Methods

2.1. Sample Preparation

The black tea was collected from a market in Shanghai City, China. The standard solution of ochratoxin A was purchased from Aladdin (Shanghai, China) (https://www.aladdin-e.com/) (accessed on 9 August 2023). In order to determine the content of trace OTA, the acetonitrile was absorbed by a pipetting gun to dilute the standard solution. Black tea was brewed by weighing 2.00 g black tea into a beaker, adding 100 mL boiling water to brew for 5 min, and then quickly straining into another beaker. After the black tea was cooled to room temperature, THz spectroscopy and UV spectrophotometry were conducted [40]. Referring to the EU regulations for OTA [11], ten different black tea samples with OTA at concentrations ranging from 0 to 20 pg/mg (0, 1, 3, 5, 7, 10, 12, 15, 17, 20 pg/mg) were obtained by adding an appropriate amount of the stock standard solution of OTA to pure black tea. For THz spectroscopy detection, the sample was dropped with 10 µL on the SPR biosensor and the measurements were repeated four times to ensure the stability of the results. For UV spectroscopy, a 350 µL sample was loaded into an ultra-low-volume cuvette, and the measurements were repeated three times.

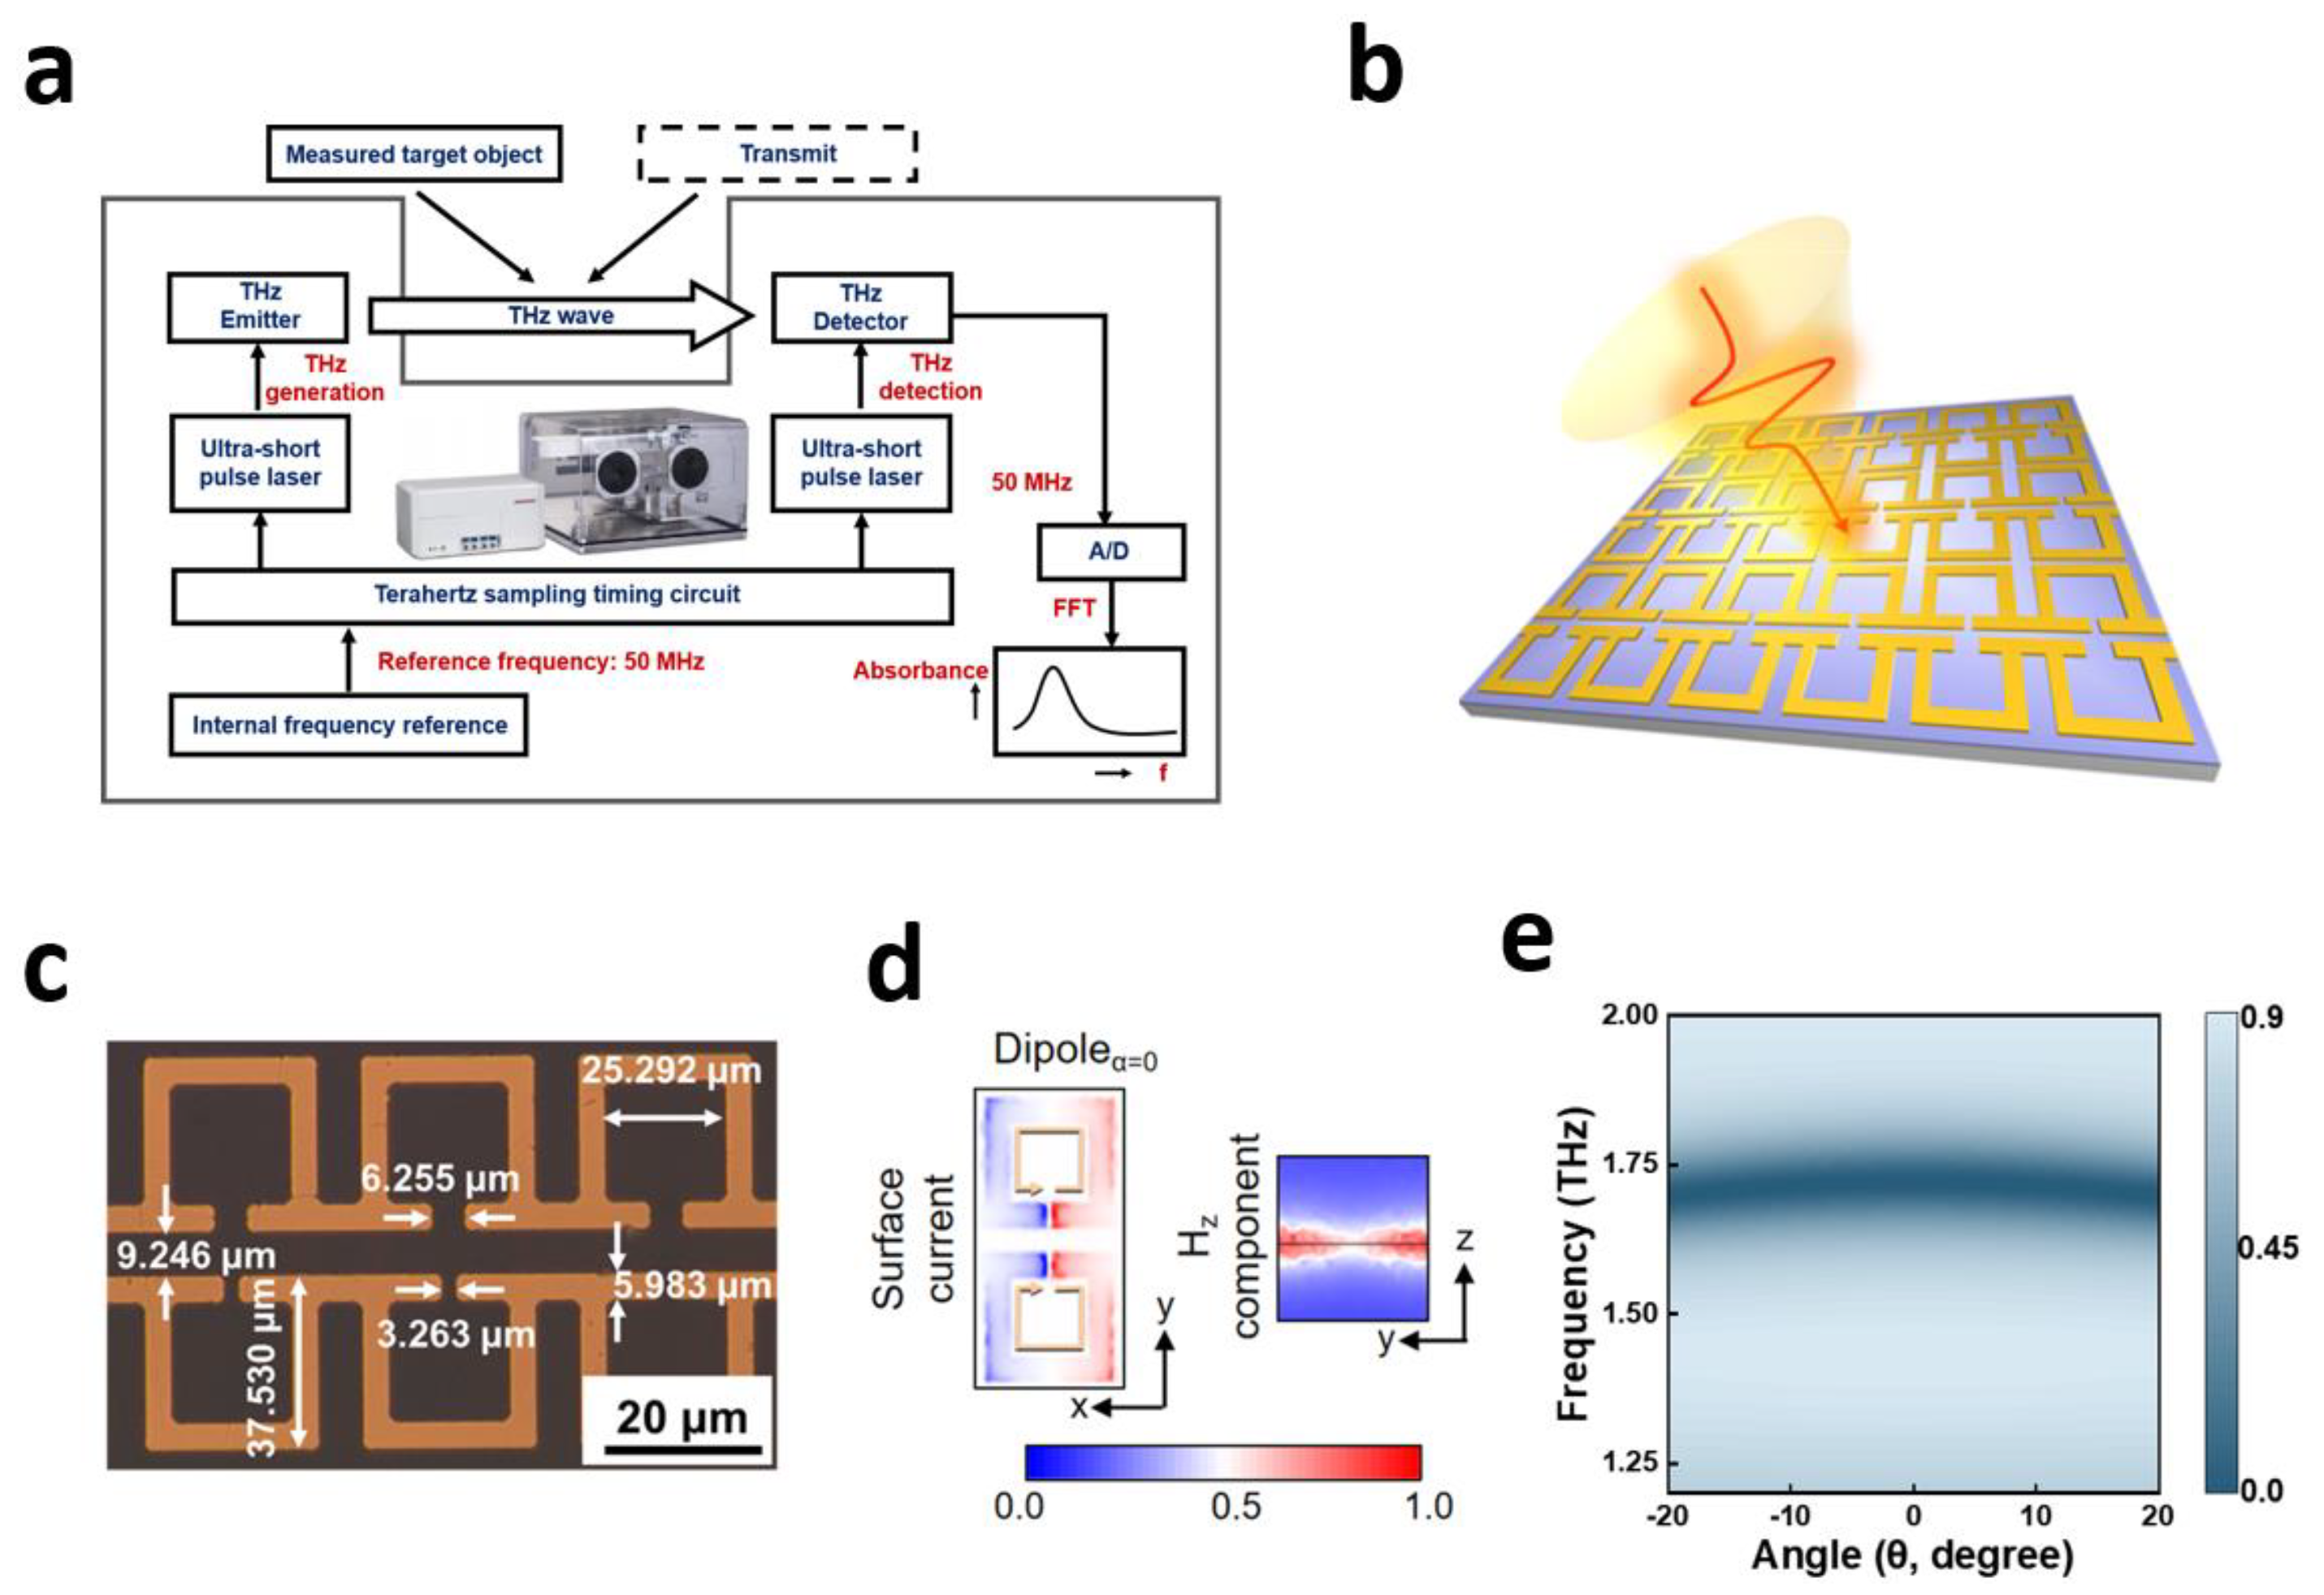
2.2. Terahertz Spectroscopy System

TAS7400 (Advantest Ltd., Tokyo, Japan) uses two ultra-short-pulse lasers (A and B) working at the same time. Laser-A uses fiber to transmit a femtosecond laser pulse to the terahertz emitter. Based on the photoconductive antenna method, THz pulses are generated under the influence of an external electric field. Then, the terahertz pulse passes through the sample after being collimated by an optical lens. The terahertz signal carrying the sample information and the detection pulse emitted by the laser-B will propagate collinearly in the electro-optic material together. Based on the birefringence effect, the sample information can be transferred to the detection signal. Finally, to obtain the terahertz spectrum of the sample, free space electro-optical sampling technology is applied, and the detection signal is converted by A/D and FFT (Figure 1a).
In this spectrometer, the dynamic range of the THz spectrometer is >60 dB, the effective spectral range is from 0.5 to 4 THz, and the spectral resolution is about 1.9 GHz. The average power of the pump laser used for the THz emitter is 20 mW, and the central wavelength of the pulse is 1550 nm, and the pulse width is 50 fs. We acquired each sample four times, for a total of 12 min for a sample.

2.3. SPR Biosensor

The SPR biosensor used in this study was designed by our team [41]. Figure 1b shows a microscope image of the SPR biosensor structure. Figure 1c shows the specific parameters of the biosensor. The resonator and substrate materials are gold and quartz, respectively. The metasurface initially applies chromium and gold films onto a double-sided polished quartz substrate and employs conventional lithography techniques for patterning. Chromium is used as a bonding layer, and the thickness of the substrate is T = 500 μm.
For Dipole resonance, the electric field enhancement in the x−y plane is mainly distributed in the inner part of resonant cavities and its side edge, and the formed annular electric field flows in the same direction clockwise. Accordingly, the magnetic field enhancement in the y−z plane of Dipole resonance is mainly limited to the near surface of resonators (Figure 1d). In addition, we explored the effect of oblique angle of incidence waves on the absorption spectra (Figure 1e). The propagation of terahertz beam in space is hyperbolic and un-collimated. The commercially developed system we used has an incidence angle in the range of −10° to 10°. Therefore, we analyzed the resonance response of the metasurface for incidence angles in the range of −20° to 20°. The results show that the oblique angle of incidence wave will not affect the absorbance spectra.
We combine a highly sensitive terahertz metamaterial biosensor with terahertz spectroscopy to achieve quantitative detection of small molecules. When the sample covers the surface of the biosensor, the dielectric constant of its surface changes, causing its corresponding resonance frequency to change. Moreover, when different contents of samples are covered on the biosensor, the effective dielectric constant will change, resulting in different levels of resonance frequency shift. According to the change patterns of frequency shift in different content samples, we can achieve quantitative detection and analysis of target substances.

2.4. UV Spectrophotometric System

The UV spectrophotometric method was developed on a double beam spectrophotometer made by Sanotac, UV2000D (Shanghai MAPADA Instrument Co., Ltd., Shanghai, China), with a spectral width of 1 nm, wavelength accuracy of 1 nm, and a pair of 350 μL micro volume cuvettes. In this study, the measurement wavelength was set from 190 to 400 nm with a slit of 1.0 nm and a sampling interval of 0.2 nm.

2.5. Data Processing and Analysis

Matlab 2021 software and Origin 2021b software were used for data analysis. All samples for TDS were tested four times and samples for UV spectrophotometry were repeated three times. Subsequently, all data were imported into Matlab software to obtain the average value and peak value. Then, the peaks were imported into Origin software for analysis. For data analysis, the peak value of the biosensor without a sample was taken as the initial value, and the peak value of the biosensor with a sample was subtracted from the initial value for analysis.

3. Results and Discussion

3.1. Spectra Analysis

All the average THz signals of the different samples from TAS7400 are shown in Figure 2. Figure 2a shows the time-domain waveform, Figure 2b shows the frequency-domain spectral signal converted from the time-domain signal by Fast Fourier Transform (FFT), and Figure 2c shows the absorbance obtained by further transformation. As shown in Figure 2a, the transient electric field of THz wave was pulse signal and the differences among distinct samples existed in amplitude and phase fields, which may be due to the difference in the OTA concentration in acetonitrile. However, the differences were not apparent enough to obtain a suitable detection model. In Figure 2b, the terahertz signal waveforms of OTA in ten different concentrations of acetonitrile are still similar. In order to show the variations between the data more accurately, we further transformed the data to obtain the absorbance signal and the results are shown in Figure 2c. It can be seen that the differences were clearer than the time-domain waveform and frequency-domain spectrum. Therefore, all subsequent analyses were based on the absorbance.

3.2. Detection of Ochratoxin A in Acetonitrile

In the standards set by the EU in 2023, the OTA standards for most foods are below 20 pg/mg; for example, soluble coffee (instant coffee) cannot exceed 5 pg/mg, dried vine fruits and dried figs cannot exceed 8 pg/mg, and pistachios cannot exceed 10 pg/mg [11]. Therefore, we prepared OTA acetonitrile solutions with concentrations of 0–20 pg/µL for detection to explore the relationship between absorbance and the concentration of OTA. The prepared ten OTA acetonitrile solutions were dropped in 10 µL quantities onto the SPR biosensor and the absorbance of OTA in acetonitrile solutions in the frequency range of 0.5–4 THz were measured by THz-TDS. The samples for each concentration were measured four times and the spectra were generated by averaging the measurements. Absorbance of different samples is compared in Figure 2c (concentration range 0–20 pg/μL). To capture the variation in measurements more intuitively, Figure 2c was zoomed in for 2d, and the average frequencies for the different OTA concentration ranges were 1.7529 (0 pg/μL), 1.7490 (1 pg/μL), 1.7433 (3 pg/μL), 1.7395 (5 pg/μL), 1.7376 (7 pg/μL), 1.7319 (10 pg/μL), 1.7242 (12 pg/μL), 1.7223 (15 pg/μL), 1.7204 (17 pg/μL), and 1.7166 (20 pg/μL), respectively.
At a concentration of 0 pg/μL, we measured full width at half maxima (WFWHM) for 0.107 THz. Based on the ratio of resonance frequency to WFWHM, we calculated the Q factor. The Q factor reflects the resonance characteristics of the biosensor. The larger the Q value, the more sensitive the sensor is to changes in the electromagnetic field in the area where its energy is concentrated. Moreover, the more concentrated the energy of the biosensor is, the more favorable it is to enhance the sensitivity of the biosensor and obtain better sensing performance. The experimentally measured Q factor of resonance was 16.4. In addition, we compared the refractive index sensitivity of this work with the recently reported metasurface biosensor. In this study, we measured the SDipole as 345 GHz/RIU, and the reported refractive index sensitivity measured by metasurface biosensors was much lower than the refractive index in our work [42,43].
Figure 2e shows the relationship curve between the concentration of OTA standard solution and the amount of resonance peak frequency shift of the metasurface. From the figure, it can be seen that there is a nonlinear relationship between the amount of frequency shift corresponding to the resonance peak of the metasurface and the concentration of the OTA standard solution, and as the sample concentration increases, the resonance peak of the SPR biosensor shifts to lower frequencies. We extracted the frequency shifts for different concentrations of OTA to establish a functional correlation with concentration. The corresponding fitting Equation (1) was obtained:
y = (0.059 ± 0.013) + (−0.059 ± 0.012) × exp[−(0.047 ± 0.015)x], R2 = 0.99
where x is the sample coverage thickness, y is the frequency shift induced by the sample on the THz SPR biosensor, and R2 is the determination coefficient of the fitting curve. This equation represents the change in frequency shift, where y0 represents the frequency shift of the highest-concentration sample compared to the lowest-concentration sample.
In Figure 2f, a column chart is made by extracting the frequency and concentration, and it can be visualized that the resonance peaks of the SPR biosensors move to the lower frequencies with the increase in the sample concentration, and the overall movement tends to slow down, which is in line with the distribution pattern of the exponential functions.
From the experimental results, it can be seen that the utilization of a metamaterial chip to detect the concentration of OTA can meet the requirements of the latest version of the EU standards for the detection of OTA [11], and the minimum detection limit can reach 1 pg/μL. This not only meets the requirements of most of the food products, but also is more efficient and convenient compared with other methods.

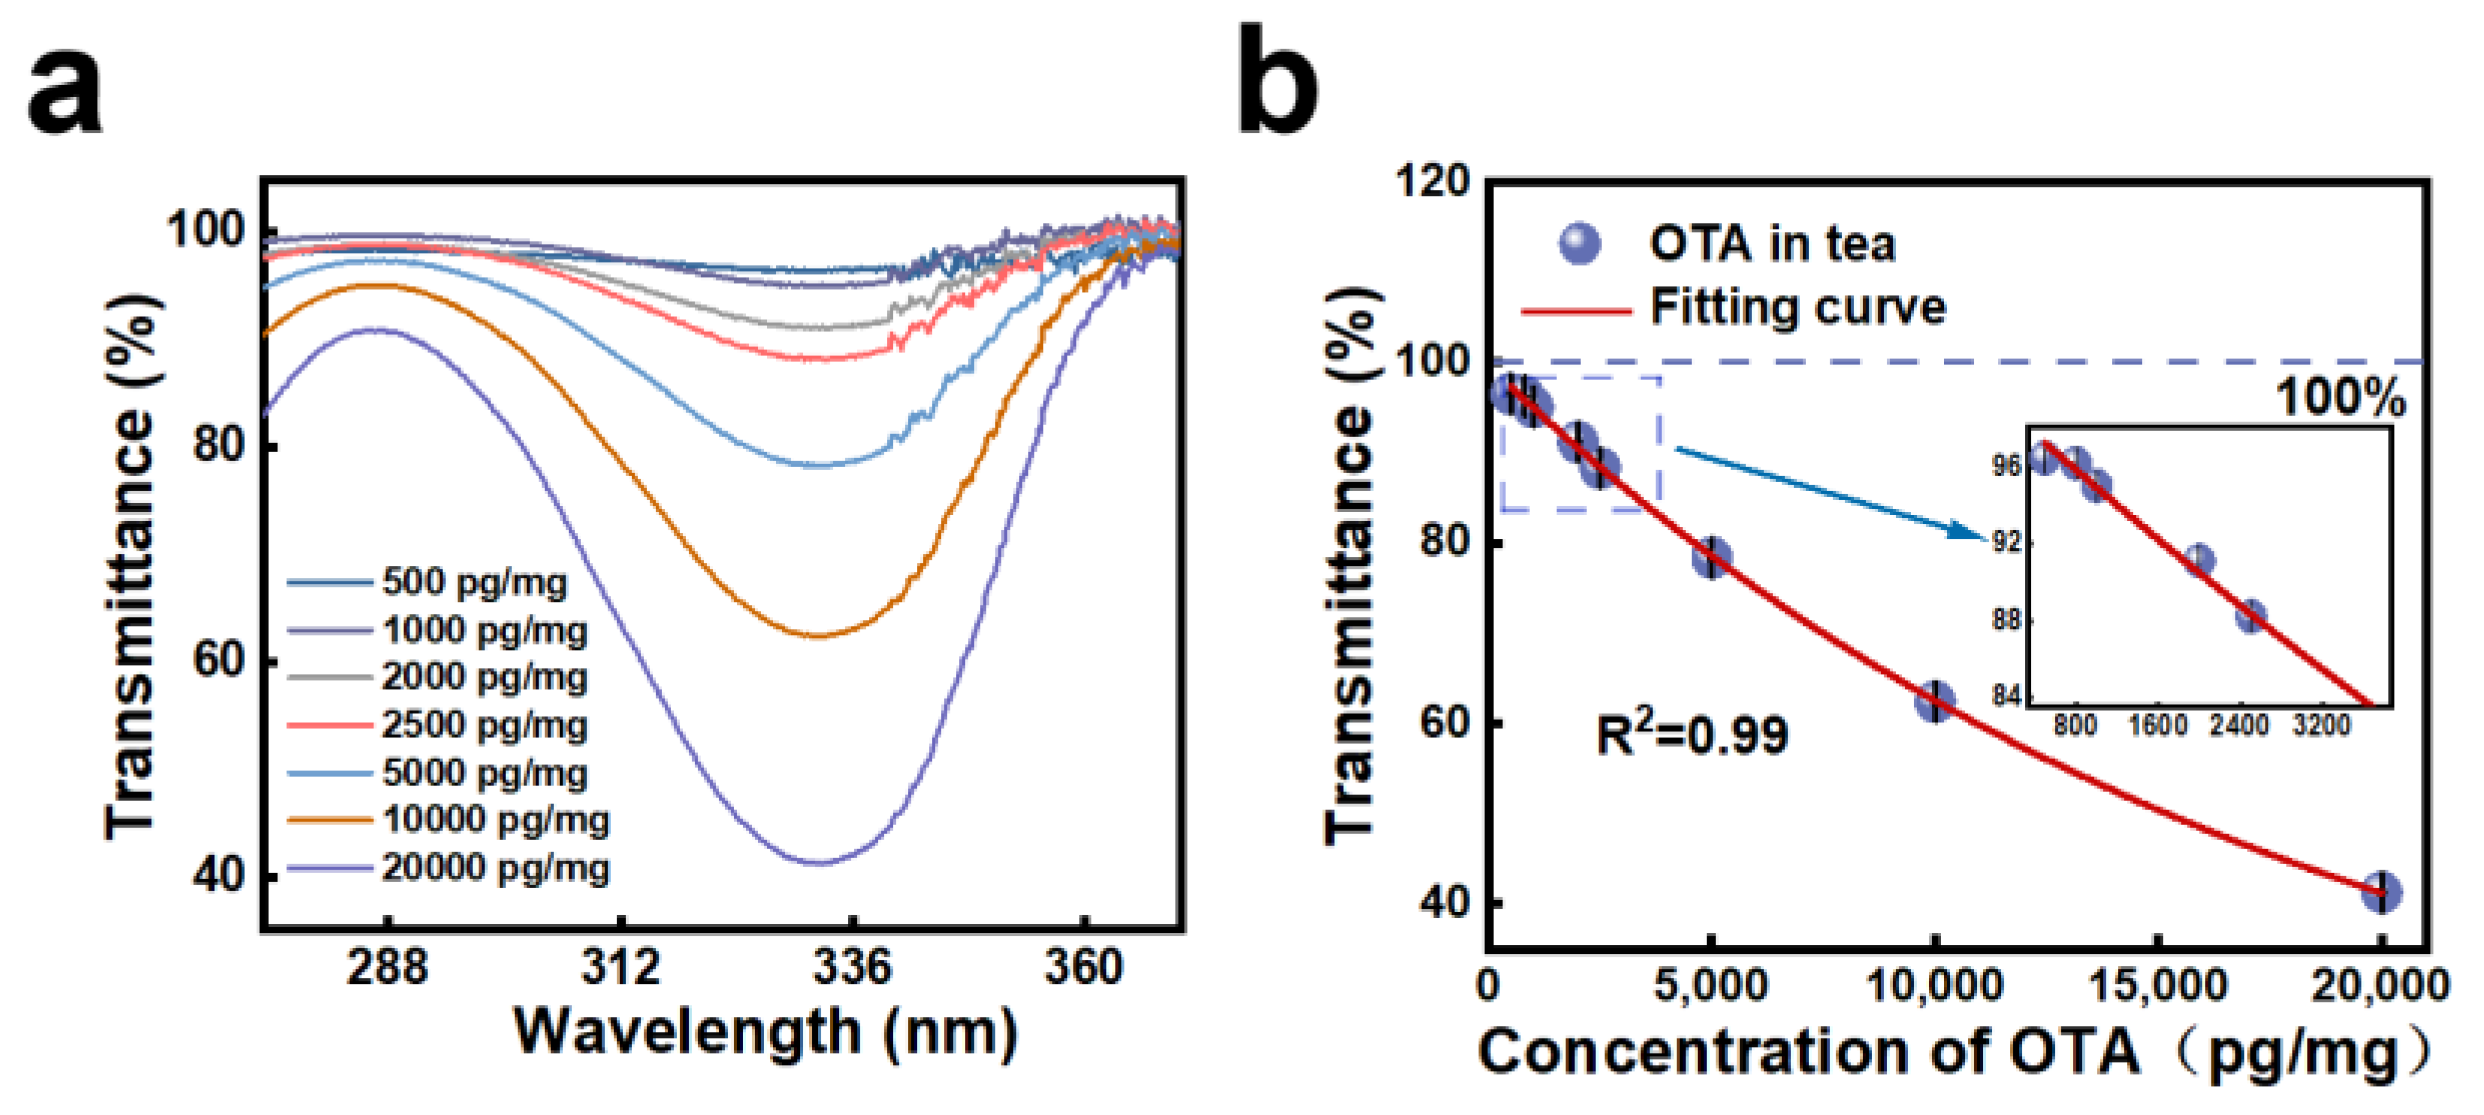
3.3. Detection of Ochratoxin A in Black Tea

After establishing the concentration curve of the pure OTA, we applied it in actual food products to verify the validity and accuracy of the method, so we added the prepared OTA standard solution to black tea for detection. We prepared solutions with concentrations of 1–20 pg/mg and measured the absorbance of OTA in black tea over the frequency range of 0.5–4 THz by THz-TDS. The samples were measured four times for each concentration and the spectra were generated by averaging the measurements. A comparison of the absorbance for the different samples is shown in Figure 3a (concentration range 1–20 pg/mg). In order to visualize the variation in the measurements more intuitively, Figure 3a was zoomed into Figure 3b and the mean frequencies for the different OTA concentration ranges were 1.7667 (0 pg/mg), 1.7629 (1 pg/mg), 1.7576 (3 pg/mg), 1.7529 (5 pg/mg), 1.7471 (7 pg/mg), 1.7405 (10 pg/mg), 1.7390 (12 pg/mg), 1.7333 (15 pg/mg), 1.7328 (17 pg/mg), and 1.7304 (20 pg/mg), respectively. From Figure 3b, it can be seen that the pure black tea (the concentration of OTA is 0 pg/mg) itself also has a frequency shift, so with the addition of OTA, it continues to shift to the lower frequency based on the pure black tea frequency shift. Comparison of the test results with those of the acetonitrile solution showed that the trends of the results were basically the same.
Similarly, the frequency shifts of OTA at different concentrations were extracted to analyze them as a function of concentration and the data were then fitted and the results can be seen in Figure 3c, where the following nonlinear equations were obtained from the function fitting (2):
y = (−0.056 ± 0.009) + (−0.055 ± 0.009) × exp[(−0.051 ± 0.014)x], R2 = 0.99
In order to analyze the frequency shift results more intuitively, we drew a column chart by extracting the frequency and concentration, and it can be noticed from Figure 3d that the resonance peaks of the SPR biosensors move similarly to the pure product as the concentration of the OTA increases. The EU standard specifies that OTA in dried herbs cannot exceed 10 pg/mg, so the test results are completely applicable to the detection of OTA content [11]. Therefore, it is feasible to detect OTA in black tea using metamaterial chips, which lays the foundation for future applications of convenient and rapid detection of OTA in food.

3.4. Comparison with UV Spectroscopy

UV spectrophotometry is a more mature technology compared to terahertz spectroscopy, which also has many applications in the detection of food and drugs, so it was chosen for comparison in this study. According to the literature, OTA shows absorption at 332 nm [44]; therefore, a UV spectrophotometer can be used for the measurement. In this study, different concentrations of OTA solution were added to black tea to obtain eight samples with different concentrations (500–20,000 pg/mg), and each concentration was measured three times to find the lowest detection limit of UV spectrophotometry for OTA, and the results are shown in Figure 4a. As can be seen from the figure, the spectrum shows a marked characteristic absorption band at 332 nm, and the average transmittance for different OTA concentration ranges are 41.26% (20,000 pg/mg), 62.41% (10,000 pg/mg), 78.33% (5000 pg/mg), 88.26% (2500 pg/mg), 91.15% (2000 pg/mg), 95.06% (1000 pg/mg), 96.23% (800 pg/mg), and 96.50% (500 pg/mg), respectively. The results show that as the concentration gets lower, the transmittance gradually increases and gets closer to 100%. The regression equation for the calibration curve is derived by comparing the transmittance values at different concentrations, and the equation is as follows:
y = (12.698 ± 3.570) + exp[−(5.575 × 10⁻⁵ ± 3.820)x + (4.466 ± 0.039)], R2 = 0.99
We extracted the UV transmittance at different concentrations and fitted it as shown in Figure 4b. In order to better show the details in the figure, we present the low-concentration part by zooming in individually. From the figure, it can be seen that the linearity of OTA was good in the concentration range of 500–20,000 pg/mg, and the transmittance had reached 96.50% at 500 pg/mg; therefore, we believe that the lowest detection limit of the UV spectrophotometric method for OTA is 500 pg/mg. Comparing the results of UV spectrophotometry with those of terahertz detection, it can be seen that the detection limit of terahertz spectroscopy is much higher than that of UV spectrophotometry, up to 500 times higher. The results of the study showed that the detection range of UV spectrophotometry was not sufficient to meet the European Union’s requirements. In the previous literature investigation, we found that technologies such as HPLC and ELISA can meet the detection limits required for OTA, but the processing of these traditional detection methods is time-consuming and complex, and multiple steps are required during the processing of the test, such as extraction, purification, enzyme digestion, etc., which requires a lot of time and labor. These technologies are temporarily unable to meet the market demand for rapid and simple detection. Therefore, among the many methods, terahertz spectroscopy is a promising technique.

4. Conclusions

The main objective of this study was to realize the rapid determination of OTA in food products using THz spectroscopy in combination with SPR biosensors. Therefore, we firstly detected the absorbance spectra of OTA in acetonitrile and combined with the latest standards given by the European Union, we designed a detection range of 0–20 pg/mg to meet the requirements for the detection of OTA in most foodstuffs. In order to verify the validity of the method, we carried out a specific application in black tea, setting the same concentration range as that of the OTA in acetonitrile, and found that the pattern of change was similar, and the detection limit could reach as low as 1 pg/mg. However, the lowest detection limit of UV spectrophotometry is 500 pg/mg, which is a 500-fold difference compared to terahertz technology. This confirms that the combination of terahertz spectroscopy with SPR biosensors is a promising technique that provides a simple, fast, and low-cost method for the quantitative detection of OTA in food. In addition, the detection of OTA by SPR biosensors combined with terahertz spectroscopy in our study also provides a new approach for subsequent trace detection of small molecules.

Author Contributions

G.C. performed experiments, data processing, and mathematical modelling and wrote the article. B.L. designed a terahertz SPR biosensor. P.L. performed experiments. Y.P. developed the idea and supervised the project. All authors have read and agreed to the published version of the manuscript.

Funding

This work was supported by the National Key Research and Development Program of China (2022YFA1404004), National Natural Science Foundation of China (61988102, 62335012).

Institutional Review Board Statement

Not applicable.

Informed Consent Statement

Not applicable.

Data Availability Statement

Data underlying the results presented in this paper are not publicly available at this time but may be obtained from the authors upon reasonable request.

Conflicts of Interest

There are no conflicts of interest to declare.

References

  1. Lyu, H.; Sun, H.; Zhu, Y.; Wang, J.; Xie, Z.; Li, J. A double-recognized aptamer-molecularly imprinted monolithic column for high-specificity recognition of ochratoxin A. Anal. Chim. Acta. 2020, 1103, 97–105. [Google Scholar] [CrossRef] [PubMed]
  2. Wang, L.; Hua, X.; Shi, J.; Jing, N.; Ji, T.; Lv, B.; Liu, L.; Chen, Y. Ochratoxin A: Occurrence and recent advances in detoxification. Toxicon 2022, 210, 11–18. [Google Scholar] [CrossRef] [PubMed]
  3. Li, X.; Ma, W.; Ma, Z.; Zhang, Q.; Li, H. The Occurrence and Contamination Level of Ochratoxin A in Plant and Animal-Derived Food Commodities. Molecules 2021, 26, 6928. [Google Scholar] [CrossRef] [PubMed]
  4. Wang, L.; Wang, Q.; Wang, S.; Cai, R.; Yuan, Y.; Yue, T.; Wang, Z. Bio-control on the contamination of Ochratoxin A in food: Current research and future prospects. Curr. Res. Food Sci. 2022, 5, 1539–1549. [Google Scholar] [CrossRef]
  5. Obafemi, B.A.; Adedara, I.A.; Rocha, J.B.T. Neurotoxicity of ochratoxin A: Molecular mechanisms and neurotherapeutic strategies. Toxicology 2023, 497–498, 153630. [Google Scholar] [CrossRef]
  6. Chen, X.; Gao, D.; Sun, F.; Li, Z.; Wang, Y.; Qiu, C.; He, K.; Wang, J. Nanomaterial-based aptamer biosensors for ochratoxin A detection: A review. Anal. Bioanal. Chem. 2022, 414, 2953–2969. [Google Scholar] [CrossRef]
  7. Nourbakhsh, F.; Tajbakhsh, E. Neurotoxicity mechanism of Ochratoxin A. Qual. Assur. Saf. Crop. Foods 2021, 13, 34–45. [Google Scholar] [CrossRef]
  8. Heussner, A.H.; Bingle, L.E. Comparative Ochratoxin Toxicity: A Review of the Available Data. Toxins 2015, 7, 4253–4282. [Google Scholar] [CrossRef]
  9. Cai, H.; Zhong, Z.; Li, Z.; Zhang, X.; Fu, H.; Yang, B.; Zhang, L. Metabolomics in quality formation and characterisation of tea products: A review. Int. J. Food Sci. Technol. 2022, 57, 4001–4014. [Google Scholar] [CrossRef]
  10. Kosicki, R.; Buharowska-Donten, J.; Twaruzek, M. Ochratoxin A levels in serum of Polish dialysis patients with chronic renal failure. Toxicon 2021, 200, 183–188. [Google Scholar] [CrossRef]
  11. The European Commission. Commission Regulation (EU) 2023/915 of 25 April 2023 on Maximum Levels for Certain Contaminants in Food and Repealing Regulation (EC) No 1881/2006; The European Commission: Brussels, Belgium, 2023; pp. 115–117.
  12. Torabi, R.; Ali Rezvanipour, A.; Esmaeili Gouvarchinghaleh, H.; Ranjbar, R.; Heiat, M. Aptamer based detection and separation platforms for ochratoxin A: A systematic review. Biocell 2022, 46, 2537–2557. [Google Scholar] [CrossRef]
  13. Zhang, K. Comparison of Flow Injection-MS/MS and LC-MS/MS for the Determination of Ochratoxin A. Toxins 2021, 13, 547. [Google Scholar] [CrossRef] [PubMed]
  14. Cina, M.; Ponce, M.D.V.; Martinez, L.D.; Cerutti, S. Development of a novel UHPLC-MS/MS method for the determination of ochratoxin A in tea. Heliyon 2021, 7, e06663. [Google Scholar] [CrossRef]
  15. Zeng, H.; Zhang, M. Determination of Ochratoxin A in Black Tea by Liquid-Liquid Extraction HPLC. Beverage Ind. 2023, 26, 25–28. [Google Scholar]
  16. Yu, H.; Wang, Q.; Lin, L.; Xu, H.; Zhang, Z. Establishment of a rapid detection method for Ochratoxins A in cassava leaf meal. J. Food Saf. Qual. 2019, 10, 8242–8249. [Google Scholar]
  17. Li, W.; Nong, R.; Shen, Y.; Li, J.; Ran, Y.; Chen, J.; Zhang, M. Determination of ochratoxin A in Pu-erh tea by ultra performance liquid chromatography-tandem mass spectrometry. J. Food Saf. Qual. 2021, 6, 2240–2245. [Google Scholar]
  18. Hu, S.; Sun, C.; Wu, X.; Peng, Y. Polarization-Independent Terahertz Surface Plasmon Resonance Biosensor for Species Identification of Panax and Paeonia. Photonics 2023, 10, 250. [Google Scholar] [CrossRef]
  19. Sudjatmiko, S.; Hadi, S.; Khairunnisa, A.; Nastiti, K.; Yansen; Zarkani, A. Descriminant analysis of flowers, leaves, stems of combretum indicum varr.M and Varr.B with UV-vis spectrophotometric chemometric method. E3S Web Conf. 2023, 373, 03024. [Google Scholar]
  20. Wang, P.; Yu, Z. Species authentication and geographical origin discrimination of herbal medicines by near infrared spectroscopy: A review. J. Pharm. Anal. 2015, 5, 277–284. [Google Scholar] [CrossRef]
  21. Lima, C.; Muhamadali, H.; Goodacre, R. The Role of Raman Spectroscopy Within Quantitative Metabolomics. Annu. Rev. Anal. Chem. 2021, 14, 323–345. [Google Scholar] [CrossRef]
  22. Zhu, Y.; Zang, X.; Chi, H.; Zhou, Y.; Zhu, Y.; Zhuang, S. Metasurfaces designed by a bidirectional deep neural network and iterative algorithm for generating quantitative field distributions. Light Adv. Manuf. 2023, 4, 9. [Google Scholar] [CrossRef]
  23. Zang, X.; Yao, B.; Chen, L.; Xie, J.; Guo, X.; Balakin, A.V.; Shkurinov, A.P.; Zhuang, S. Metasurfaces for manipulating terahertz waves. Light Adv. Manuf. 2021, 2, 10. [Google Scholar] [CrossRef]
  24. Deng, Y.; Sun, Q.; Li, C.; Wang, Y.; Zhang, C.; Zhang, X.; Huang, Z.; Tang, L.; Li, Z.; Tang, X. Calibration of terahertz time-domain spectrometers and terahertz radiometry. In Proceedings of the 2021 International Conference on Optical Instruments and Technology: IRMMW-THz Technologies and Applications, Online, 8–10 April 2022; Volume 12284, p. 1228403. [Google Scholar]
  25. Choi, G.; Lee, D.-H.; Park, I.; Kang, D.; Lee, H.K.; Rhie, J.; Bahk, Y.M. Evaluation of moisturizing cream using terahertz time-domain spectroscopy. Curr. Appl. Phys. 2022, 39, 84–89. [Google Scholar] [CrossRef]
  26. Meng, D.; Liu, J.; Chen, W.; Cheng, Y.; You, K.; Fan, Z.; Ye, Q.; Huang, P.; Chen, Y. Study on the enhancement mechanism of terahertz molecular fingerprint sensing. Results Phys. 2022, 39, 105766. [Google Scholar] [CrossRef]
  27. Zhang, X.; Liu, J.; Qin, J. A terahertz metasurface sensor with fingerprint enhancement in a wide spectrum band for thin film detection. Nanoscale Adv. 2023, 5, 2210–2215. [Google Scholar] [CrossRef]
  28. Li, X.; Ma, C.; Yan, D.; Guo, S.; Zhang, L.; Yang, J.; Zhao, Y.; Zhou, W. Enhanced trace-amount terahertz vibrational absorption spectroscopy using surface spoof polarization in metasurface structures. Opt. Lett. 2022, 47, 2446–2449. [Google Scholar] [CrossRef]
  29. Islam, M.S.; Sultana, J.; Dinovitser, A.; Ahmed, K.; Ng, B.W.H.; Abbott, D. Sensing of toxic chemicals using polarized photonic crystal fiber in the terahertz regime. Opt. Commun. 2018, 426, 341–347. [Google Scholar] [CrossRef]
  30. Sun, Y.; Huang, J.; Shan, L.; Fan, S.; Zhu, Z.; Liu, X. Quantitative analysis of bisphenol analogue mixtures by terahertz spectroscopy using machine learning method. Food Chem. 2021, 352, 129313. [Google Scholar] [CrossRef]
  31. Xu, W.; Wang, Q.; Zhou, R.; Hameed, S.; Ma, Y.; Lijuan, X.; Ying, Y. Defect-rich graphene-coated metamaterial device for pesticide sensing in rice. RSC Adv. 2022, 12, 28678–28684. [Google Scholar] [CrossRef]
  32. Shou, Y.; Wang, Y.; Miao, L.; Chen, S.; Luo, H. Realization of all-optical higher-order spatial differentiators based on cascaded operations. Optics Letters. 2022, 47, 5981–5984. [Google Scholar] [CrossRef]
  33. Silalahi, H.M.; Chiang, W.F.; Shih, Y.H.; Wei, W.Y.; Su, J.Y.; Huang, C.Y. Folding metamaterials with extremely strong electromagnetic resonance. Photonics Res. 2022, 10, 2215–2222. [Google Scholar] [CrossRef]
  34. Zhao, F.; Li, Z.; Li, S.; Dai, X.; Zhou, Y.; Liao, X.; Cao, J.; Liang, G.; Shang, Z.; Zhang, Z.; et al. Terahertz metalens of hyper-dispersion. Photonics Res. 2022, 10, 886–895. [Google Scholar] [CrossRef]
  35. Chiang, W.F.; Silalahi, H.M.; Chiang, Y.-C.; Hsu, M.C.; Zhang, Y.S.; Liu, J.H.; Yu, Y.; Lee, C.R.; Huang, C.Y. Continuously tunable intensity modulators with large switching contrasts using liquid crystal elastomer films that are deposited with terahertz metamaterials. Optics Express 2020, 28, 27676–27687. [Google Scholar] [CrossRef] [PubMed]
  36. Liu, S.; Xu, F.; Zhan, J.; Qiang, J.; Xie, Q.; Yang, L.; Deng, S.; Zhang, Y. Terahertz liquid crystal programmable metasurface based on resonance switching. Optics Letters 2022, 47, 1891–1894. [Google Scholar] [CrossRef] [PubMed]
  37. Pan, Y.; Lan, F.; Zhang, Y.; Zeng, H.; Wang, L.; Song, T.; He, G.; Yang, Z. Dual-band multifunctional coding metasurface with a mingled anisotropic aperture for polarized manipulation in full space. Photonics Res. 2022, 10, 416–425. [Google Scholar] [CrossRef]
  38. Yudistira, H.T.; Ginting, L.Y.; Kananda, K. High absorbance performance of symmetrical split ring resonator (SRR) terahertz metamaterial based on paper as spacer. Mater. Res. Express 2018, 6, 025804. [Google Scholar] [CrossRef]
  39. Peng, Y.; Huang, J.; Luo, J.; Yang, Z.; Wang, L.; Wu, X.; Zang, X.; Yu, C.; Gu, M.; Hu, Q.; et al. Three-step one-way model in terahertz biomedical detection. PhotoniX 2021, 2, 12. [Google Scholar] [CrossRef]
  40. Cui, Y.; Lai, G.; Wen, M.; Han, Z.; Zhang, L. Identification of low-molecular-weight color contributors of black tea infusion by metabolomics analysis based on UV-visible spectroscopy and mass spectrometry. Food Chem. 2022, 386, 132788. [Google Scholar] [CrossRef]
  41. Liu, B.; Peng, Y.; Jin, Z.; Wu, X.; Gu, H.; Wei, D.; Zhu, Y.; Zhuang, S. Terahertz ultrasensitive biosensor based on wide-area and intense light-matter interaction supported by QBIC. Chem. Eng. J. 2023, 462, 142347. [Google Scholar] [CrossRef]
  42. Tang, C.; Yang, J.; Wang, Y.; Cheng, J.; Li, X.; Chang, C.; Hu, J.; Lü, J. Integrating terahertz metamaterial and water nanodroplets for ultrasensitive detection of amyloid β aggregates in liquids. Sens. Actuators B Chem. 2021, 329, 129113. [Google Scholar] [CrossRef]
  43. Yang, K.; Li, J.; Lamy de la Chapelle, M.; Huang, G.; Wang, Y.; Zhang, J.; Xu, D.; Yao, J.; Yang, X.; Fu, W. A terahertz metamaterial biosensor for sensitive detection of microRNAs based on gold-nanoparticles and strand displacement amplification. Biosens. Bioelectron. 2021, 175, 112874. [Google Scholar] [CrossRef] [PubMed]
  44. Aschl, T.; Frison, G.; Moraillon, A.; Ozanam, F.; Allongue, P.; Gouget-Laemmel, A.C. Insights into the Ochratoxin A/Aptamer Interactions on a Functionalized Silicon Surface by Fourier Transform Infrared and UV-Vis Studies. Langmuir 2020, 36, 13908–13917. [Google Scholar] [CrossRef]
Figure 1. Schematic diagram of experimental equipment (a), the schematic diagram of metasurface excited by THz wave (b), and the geometric parameters of the lattice (c); the surface current distribution in the x−y plane and the z component of the magnetic field in the y−z plane corresponding to Dipole mode (d); simulation results of transmission spectrum at different angles (e).
Photonics 11 00009 g001
Figure 2. THz time-domain spectra (a), frequency-domain spectra (b), absorbance spectra (c), partial amplified absorbance spectra of dotted box in (c,d), corresponding frequency shift as a function (e), and column chart of the corresponding frequency shifts (f) of different OTA concentrations in acetonitrile.
Photonics 11 00009 g002
Figure 3. Absorbance spectra (a), partial amplified absorbance spectra of dotted box in (a,b), corresponding frequency shift as a function (c), and column chart of the corresponding frequency shifts (d) of different OTA concentrations in black tea.
Photonics 11 00009 g003
Figure 4. Transmittance spectra (a) and transmittance as a function (b) of different OTA concentrations in black tea (the inset shows the low-concentration part).
Photonics 11 00009 g004
Disclaimer/Publisher’s Note: The statements, opinions and data contained in all publications are solely those of the individual author(s) and contributor(s) and not of MDPI and/or the editor(s). MDPI and/or the editor(s) disclaim responsibility for any injury to people or property resulting from any ideas, methods, instructions or products referred to in the content.

