Urinary Metabolic Biomarker Profiling for Cancer Diagnosis by Terahertz Spectroscopy: Review and Perspective
Abstract
:1. Introduction
2. Urinary Metabolic Biomarkers in Cancer Diagnostics
2.1. Urinary Biomarkers Classification
- Diagnostic biomarkers: Detect or confirm the presence of a disease or condition or identify an individual with a disease subtype. These biomarkers are used to identify persons with the disease and redefine disease classification. One of the objectives is to define a method for the validation of such biomarkers that ensures reliable, accurate and reproducible measurement at low cost. By developing new and improving existing measurement methods, understanding the values of individual diagnostic biomarkers will be more reliable and easier to measure.
- Monitoring biomarkers: Allows serial measurements to assess a disease or health condition to demonstrate exposure to or the effect of, a medical product or biological agent. Achieving a more precise understanding of which changes in a biomarker should signal a particular change in clinical course and decision-making is often complex and often less precise than desired. Monitoring biomarkers is also important to provide a safety threshold for drugs with potential organ toxicity and to measure pharmacodynamic effects or to detect therapeutic responses and complications of disease or therapy.
- Response biomarkers: A biomarker whose level changes in response to exposure to a drug or environmental agent. It is used in clinical practice and in the early development of therapies to provide evidence that a drug will be safe for use in individuals with the target disease. Here, it is of critical importance that the measured change in biomarker response provides a reliable signal for the expected therapeutic response. It may also be that measurable biomarkers do not reflect the true pharmacodynamic response.
- Predictive biomarkers: The presence or change in such a biomarker predicts the individual or group of individuals more likely to experience a beneficial or adverse effect from exposure to the medical product or environmental agent. In patients randomly selected for treatment, differences in treatment outcome associated with a difference in the presence, absence or level of the biomarker are measured.
- Prognostic biomarkers: Determine the likelihood of a clinical event, disease recurrence or disease progression in patients with a particular disease or condition. These biomarkers are used to set entry and exclusion criteria for trials, to identify populations at higher risk, and are particularly important for predicting an individual’s risk.
- Safety biomarker: Measured before or after exposure to a medical procedure or environmental agent to indicate the likelihood, presence, or magnitude of toxicity as an adverse effect of treatment. They may also be used for population monitoring of environmental exposures or post-exposure population monitoring.
- Susceptibility/risk biomarker: Indicates the possibility of developing a disease or health condition in an individual who does not currently have a clinically apparent disease or health condition or where the individual has not yet been diagnosed. These types of biomarkers are the basis for epidemiological studies on disease risk.
2.2. Urinary Metabolic Biomarkers for Cancer Detection
2.2.1. Lung Cancer
2.2.2. Breast Cancer
2.2.3. Bladder Cancer
2.2.4. Prostate Cancer
2.2.5. Gastric Cancer
2.2.6. Kidney Cancer and Renal Cell Carcinoma (RCC)
2.2.7. Colorectal Cancer
2.2.8. Pancreatic Cancer
2.2.9. Hepatocellular Carcinoma
2.2.10. Endometrial and Ovarian Cancer
2.3. Selection of Metabolic Biomarkers for THz Spectroscopy Profiling of Urine
3. Spectroscopic Detection Techniques for Urinary Biomarkers Analysis
- Ultraviolet–visible (UV-Vis) spectroscopy: This is a commonly used method for detecting biomarkers in urine samples. It involves measuring the absorbance of light in the UV-Vis range by the biomolecules present in the sample. It can quantify certain biomolecules in urine that absorb light in this spectral range. UV spectroscopy is widely used for protein quantification because it is fast and convenient, can be performed directly on the sample without adding an external label, and provides a linear relationship between concentration and absorbance [21,112].
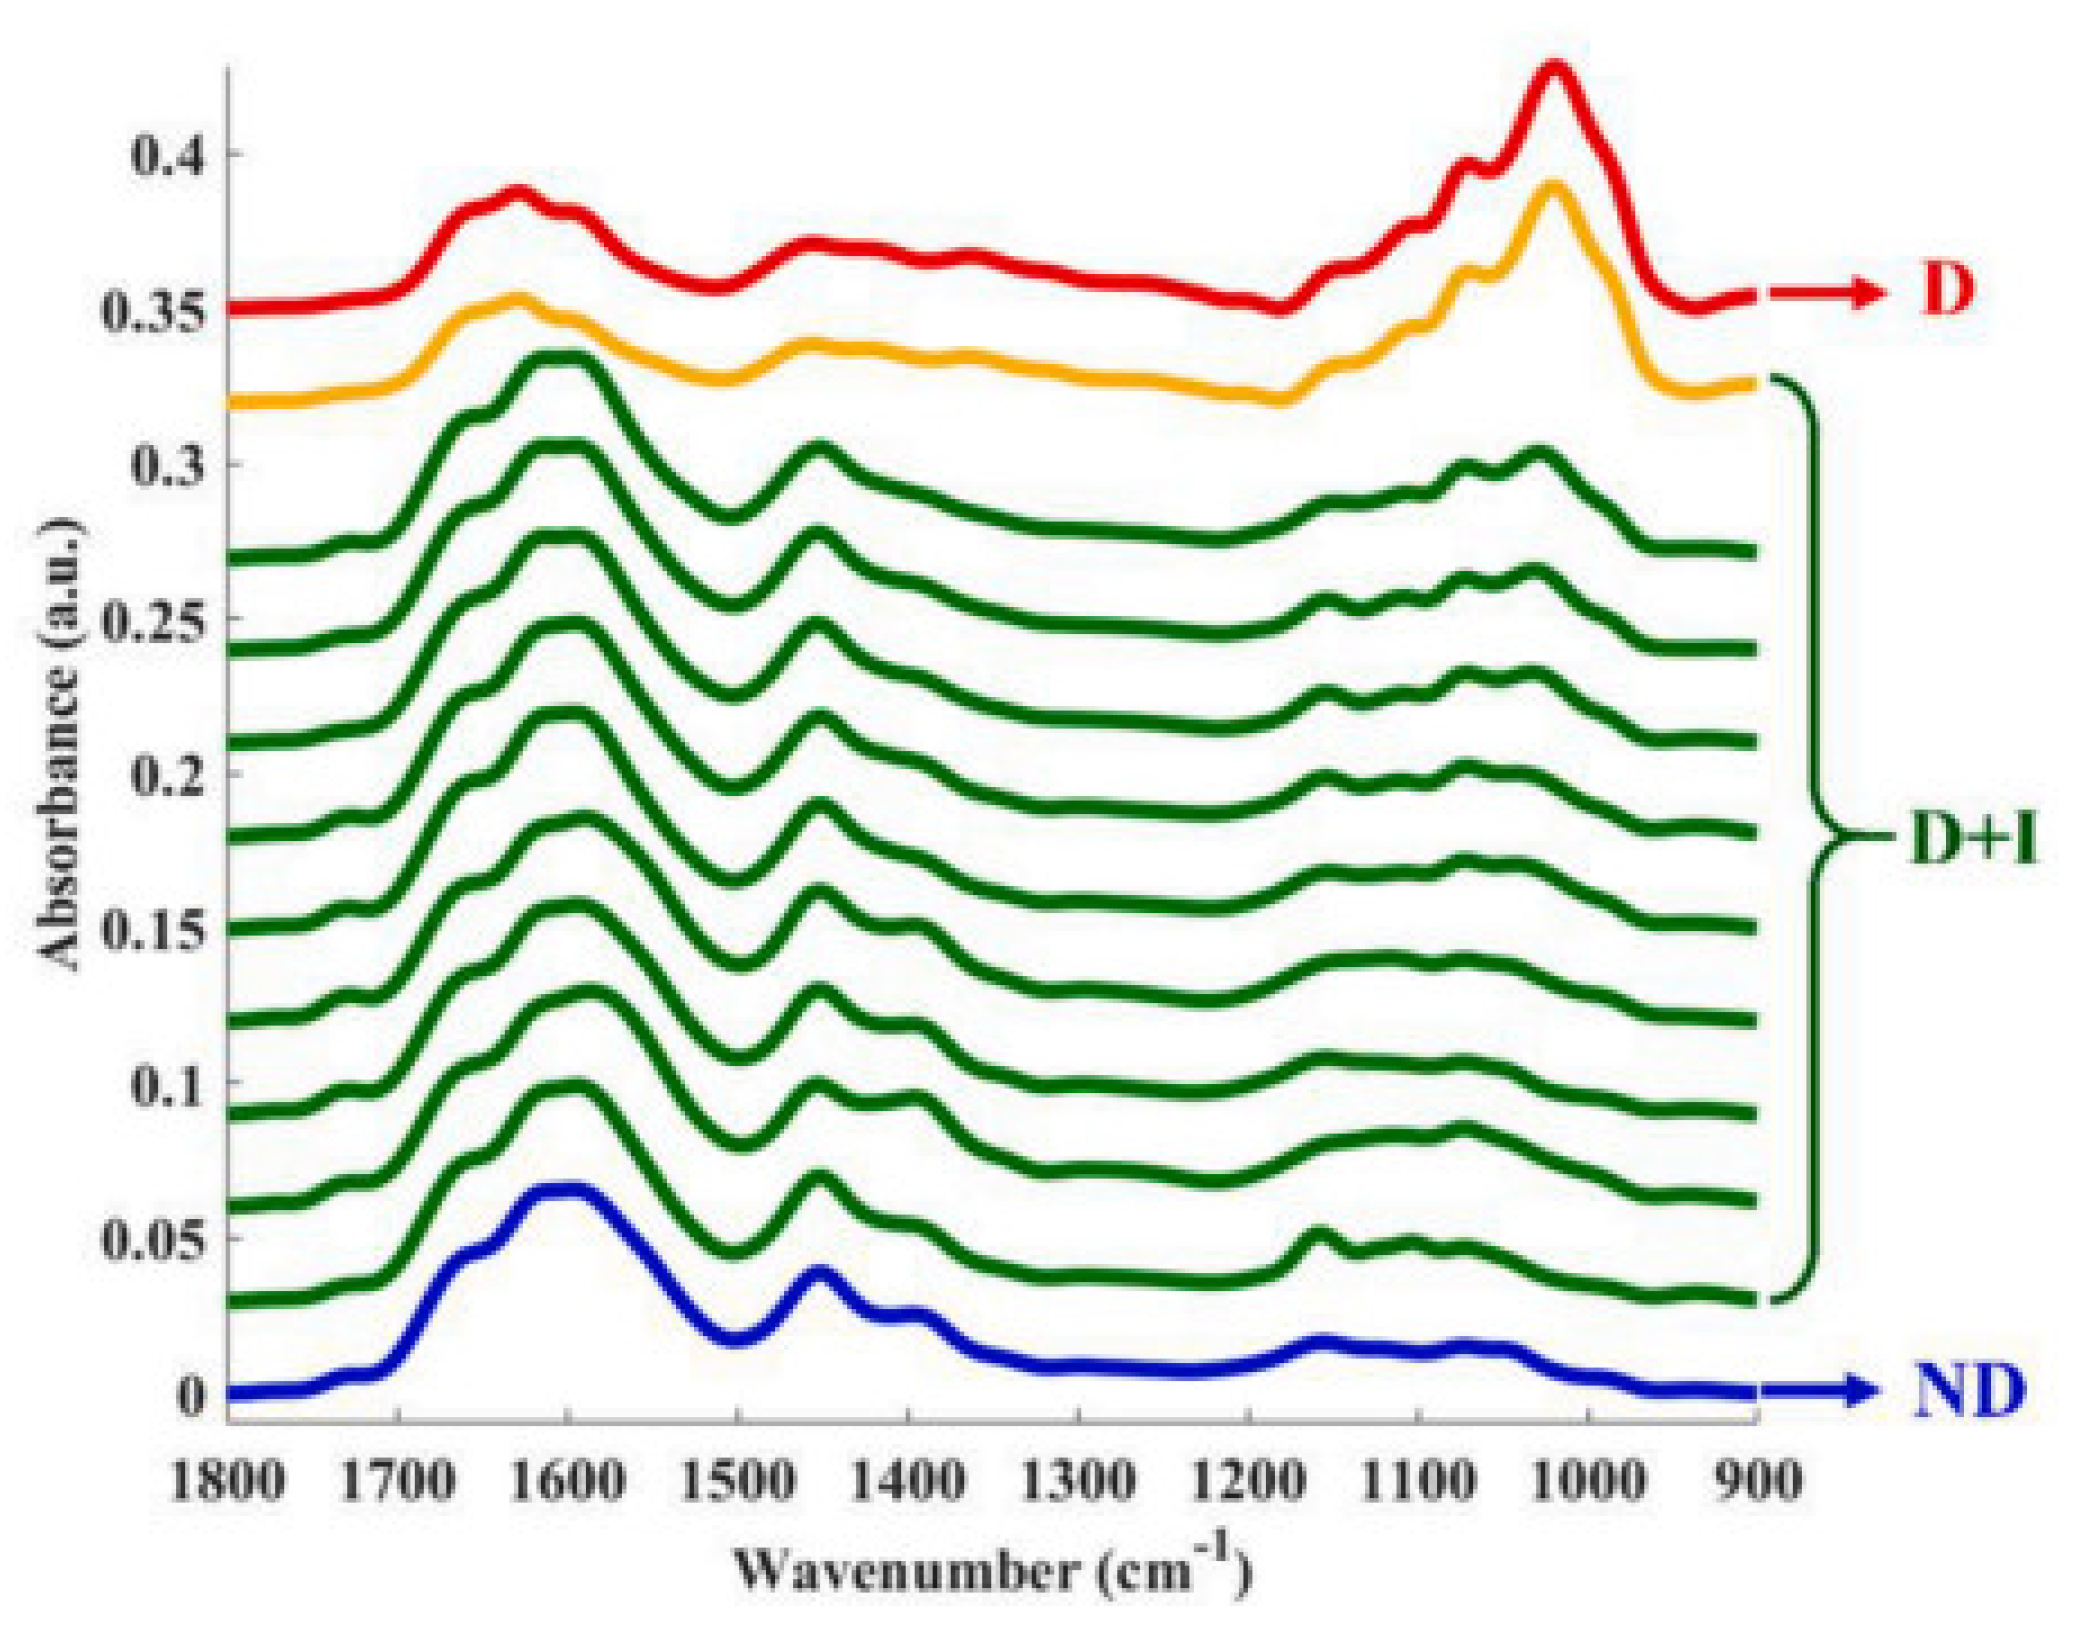
- Infrared (IR) spectroscopy: In IR spectroscopy, the absorption of IR radiation excites vibrational transitions in molecules. Since the vibrational frequency and the probability of absorption depend on the strength and polarity of the vibrating bonds, they are affected by intra- and intermolecular interactions. The position of the IR absorption band is determined by the vibrational masses and the type of bonding (single, double, triple), as well as the effects of electron uptake or donation from the intra- and intermolecular environment and coupling to other vibrations. From the IR spectrum, it is possible to obtain information on the chemical structure of the vibrating group, the chemical properties of neighbouring groups in the molecule, the redox state, bonding parameters, hydrogen bonding dynamics, conformations, and others. In general, all polar bonds contribute to IR absorption, so it is not necessary to specifically label biomolecules to detect them. Due to the complexity of biomolecules, their IR spectra are challenging to analyse because of overlapping IR bands [112]. Therefore, they are often combined using computers and statistical computational systems, which help to obtain spectra quickly and make them easily interpretable [27]. Analytical techniques that rely on molecular vibrations are Raman spectroscopy, Fourier transform infrared (FTIR) spectroscopy and THz spectroscopy.
- Nuclear magnetic resonance (NMR) spectroscopy: Besides mass spectrometry, NMR spectroscopy is the most useful method for a global view of the human metabolome. The advantages of NMR spectroscopy are the reusability of samples, high reproducibility and minimal sample preparation requirements [113]. NMR spectroscopy has been widely used for multidimensional metabolic profiling of cells, tissues, and biological fluids. These studies produce complex multivariate datasets that require visualisation software, chemometrics and bioinformatics methods for interpretation. These methods can be used to take biochemically based fingerprints to diagnose and classify diseases [13]. This method is based on the interaction of magnetic fields with the atomic nuclei in the biomolecules present in the sample. NMR spectroscopy can be used to identify the chemical composition of the biomolecules and to detect changes in the biomolecule structure due to disease or other factors. It is particularly beneficial for identifying small molecules, metabolites, and other organic compounds in urine.
- Fluorescence spectroscopy: This method is based on the emission of light by the biomolecules present in the sample when they are excited by light of a specific wavelength. In most cases, the emitted light has a longer wavelength and lower energy than the absorbed radiation. In chemical analysis, the sample is often irradiated in the UV or visible range, resulting in fluorescence in the visible or near-infrared range. Because of the method’s sensitivity, it is possible to measure concentrations of fluorescent molecules as low as 1 part per trillion. Fluorescence spectroscopy can be used alone or in conjunction with high-performance liquid chromatography as a detector [112]. Typically, analyte molecules do not emit strong luminescence, so the analyte is usually modified with a fluorophore to facilitate their analytical detection. Fluorescence spectroscopy can be used to identify the biomolecules present in the sample and can be used to detect changes in the biomolecule structure due to disease or other factors.
- Attenuated Total Reflectance Fourier-transform infrared (ATR-FTIR) spectroscopy [26]: ATR-FTIR is a powerful bioanalytical tool suitable for the unlabelled, rapid, non-destructive and relatively inexpensive analysis of biomolecules and molecular components in liquids such as urine. ATR-FTIR technology is also available as a portable device, ideal for biomedical applications. It can measure specific vibrational modes of molecules such as carbohydrates, proteins, lipids, metabolites, DNA and RNA without extensive sample preparation. The obtained IR spectrum can be used to identify the sample’s biomolecules and detect changes in the biomolecule structure due to disease or other factors. It provides information about the chemical bonds and functional groups present in a sample. ATR-FTIR is used instead of FTIR when the investigated sample does not produce strong or clear signals due to their limited interaction with the IR radiation. This method uses an attenuated total reflectivity (ATR) crystal made of a material that interacts strongly with IR light and is in contact with the sample’s surface. As a result, IR light can penetrate the sample to a small depth (typically a few micrometres), producing an evanescent wave that interacts with the sample and the attenuated total reflectance spectrum is measured. The evanescent wave penetration allows for better sensitivity, particularly for samples with low absorbance or small quantities.
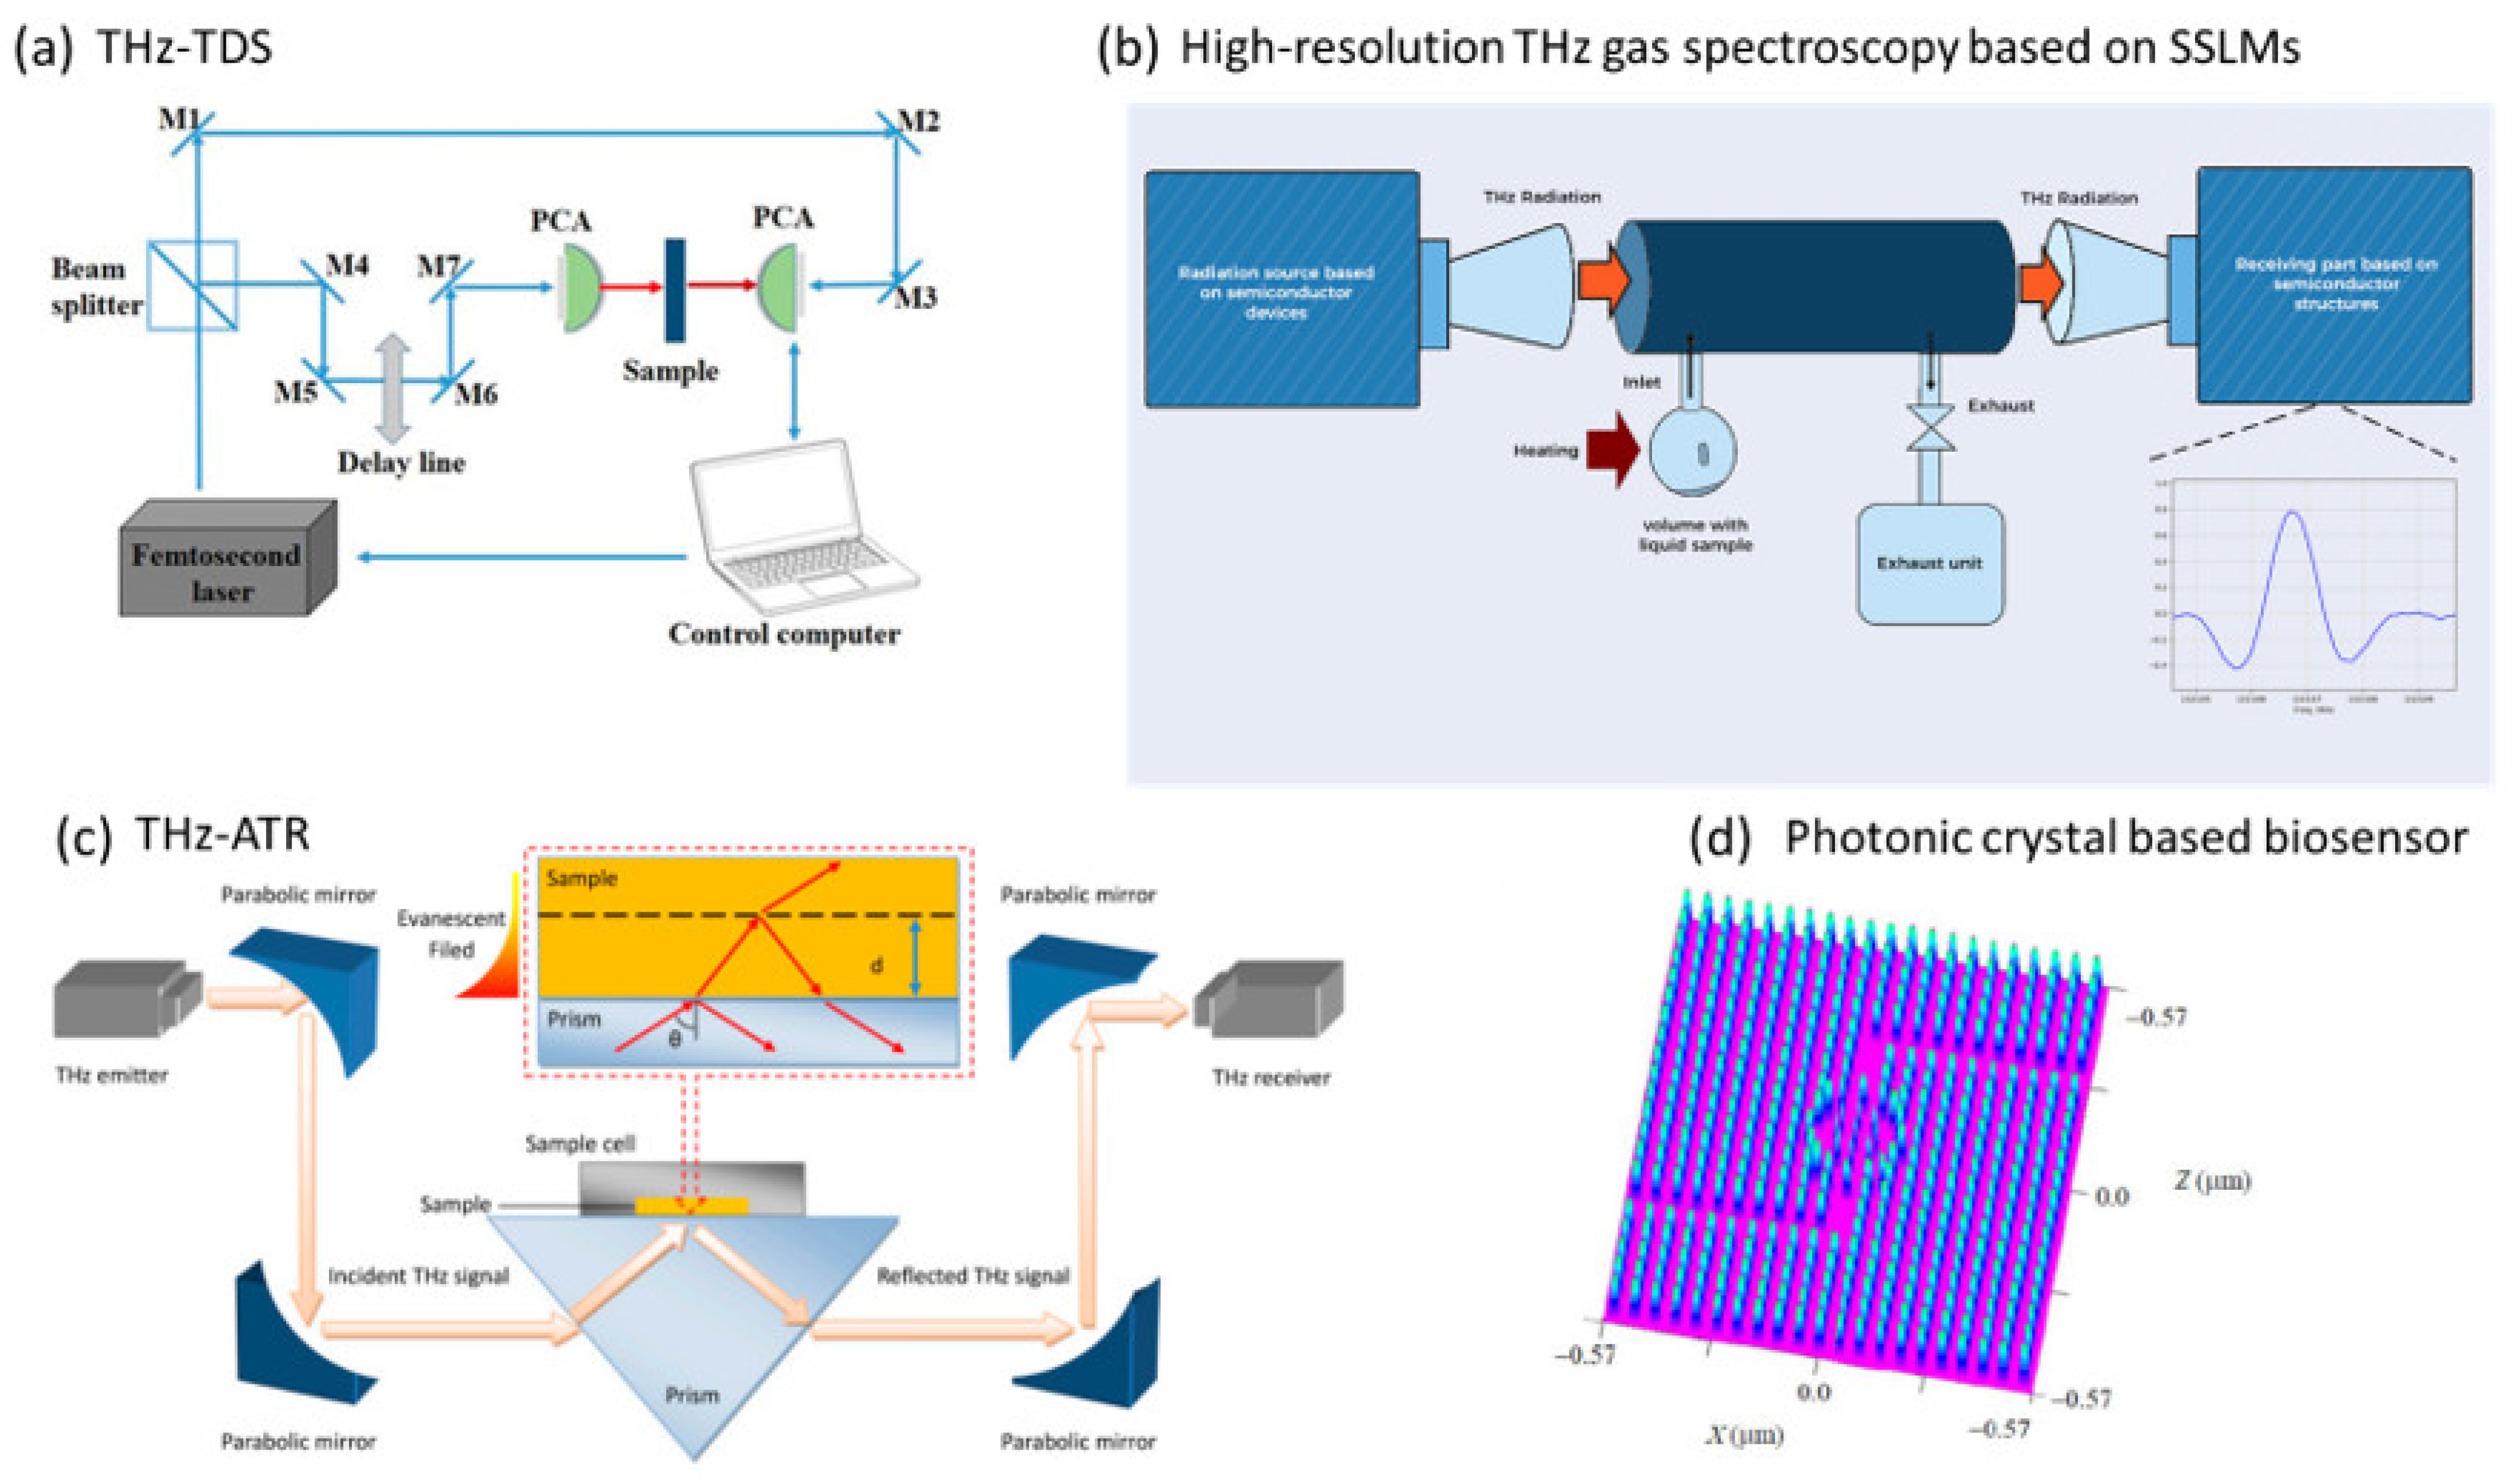
- Terahertz Time-Domain Spectroscopy (THz-TDS): A technique that involves generating/detecting short THz pulses and measuring the electric field of the transmitted or reflected signal as a function of time after passing through the sample. The THz detector and generator are critical components for successful data acquisition and analysis. THz-TDS systems with photoconductive antennas (PCAs), inorganic (e.g., GaP or ZnTe) and organic (DAST, DSTMS) electrooptic crystals are mainly applied for bioanalytics [129,130]. The same short optical pulse is used to produce (pump) and detect (probe) THz radiation. THz-TDS allows simultaneous measurement of the amplitude and phase of the THz field, from which real and imaginary optical constants such as absorption coefficient and refractive index can be calculated without Kramers–Kronig relations. This represents a significant advantage over FTIR spectroscopy. The basic working principle of the THz-TDS system is shown in Figure 4a. When a THz wave passes through a material, it is partially absorbed, and the transmitted or reflected signal is detected and analysed. A reference measurement must be performed before the sample is measured to obtain a reference spectrum (e.g., an empty space in a particular atmosphere or sample carrier or the sample itself before experimentation). This is followed by the measurement of the investigated sample. The ratio of the reference spectrum to the sample spectrum is an expression from which the refractive index, absorption coefficient and sample thickness can be determined. By Fourier transforming the recorded signal into the frequency domain, this spectroscopic technique can provide additional information on the molecular structure, including the presence of functional groups, degree of crystallinity, molecule conformation, intramolecular and intermolecular dynamics [131]. Compared to FTIR spectroscopy, THz spectroscopy can provide information on the low-frequency vibrational modes of biomolecules, such as the collective vibrational modes of amino acids, proteins and carbohydrates, which are not accessible by FTIR spectroscopy [132]. THz-TDS can be applied to study the vibrational modes of metabolites, enabling researchers to identify and quantify specific metabolites in biological samples. This technique is also used for 2D and 3D imaging of materials. The amplitude image is captured by placing it on the top of the THz pulse and then performing a raster scan of the sample. With amplitude imaging, only detection is possible, but not identification and classification, which requires a recording of the entire pulse profile at each selected point on the sample, thus providing a large amount of information about compounds and molecules in the frequency domain [104].
- THz-attenuated total reflection (THz-ATR) spectroscopy [51]: A method that acquires the THz signal of a sample attached to an ATR prism using evanescent waves that are concentrated within a few tens of microns of the prism surface. The signal is derived from THz radiation focused on the prism at its critical angle. The sample is placed in direct contact with the ATR crystal. Like THz-TDS, a femtosecond laser system generates short pulses of THz radiation. Compared to THz-TDS, THz-ATR spectroscopy is more sensitive in measuring highly absorbing biological samples. The THz-ATR system is depicted in Figure 4c. It is used for analysing samples that do not transmit THz radiation well, such as highly absorptive or scattering samples and samples with limited thickness, such as thin films, coatings, and surfaces.
- Far infrared (FIR) microspectroscopy [133]: Also known as THz microspectroscopy, this is an analytical technique used to study the molecular composition and properties of materials in the THz region. In the context of metabolic biomarkers, FIR microspectroscopy can be applied to analyse metabolic fingerprints or profiles of biological samples. Different metabolic patterns may be associated with specific diseases or conditions, allowing for potential biomarker discovery. FIR microspectroscopy is a complementary technique and is often used in conjunction with other analytical methods to provide a more comprehensive understanding of biomarkers and their roles in various biological processes and disease states. This method is used for chemical imaging of heterogeneous samples as it provides simultaneous information on their composition and morphology, i.e., the distribution of their constituents. It is more suitable for the analysis of rough samples, such as cross-sectioned urinary stones, because of the reduced diffuse reflectance and sample thickness.
- Photonic-crystal-based biosensor [134]: A method that is based on a photonic crystal (PC), which consists of periodic dielectric or metal-dielectric nanostructures that have alternating low and high dielectric material constants (refractive index), which affect the propagation of electromagnetic waves within the structure. Based on the variation of the refractive index in one, two and three directions, PCs are classified into three types, namely one-dimensional (1D), two-dimensional (2D) and three-dimensional (3D) PCs. 2D PCs have a simple structure, small size, and high light confinement and are more suitable for the analysis of urine samples compared to 1D and 3D PCs. The design of such a square grid biosensor is shown schematically in Figure 4d. The sensor comprises two inverted “L” waveguides and a ring resonator. The inverted “L” waveguide is created by introducing line defects, while the ring resonator is designed with line/point defects. The rod radius, lattice constant and dielectric constant are the structural parameters of the sensor.
- Non-stationary THz high-resolution spectrometer [50]: A method that can be applied to gases and vapours of liquids (e.g., urine) after evaporation or thermal decomposition. The advantages of this method are real-time measurements, easy-to-obtain samples, unique identification of a wide range of detectable compounds and suitability for any patient regardless of their state. This spectrometer is based on semiconductor superlattice multipliers (SSLM) with input from sources such as a Gunn diode and a backward oscillator (BWO). Superlattices are very efficient for frequency multiplication from the sub-THz to THz range but require complex gold resonators for the transmitter and detector, which limits frequency tuning, increases the cost of the device, and reduces the output power. Therefore, there is great potential for further improvements of these devices with on-chip integration. With a non-linear mechanism responsible for frequency amplification in the SSLM, control of the input power for monitoring the vapour composition of urine can be achieved. Compared to quantum cascade lasers, which are an efficient source of MIR spectra, this method works efficiently in the THz range without cryocooling and in the low THz range. A schematic showing an experimental set-up where the radiation source and detection are based on SSLMs is shown in Figure 4b.
- THz time-domain spectroscopic ellipsometry (THz-TDSE) [135,136,137]: Using this method, THz pulses are incident at an angle close to the Brewster angle of the investigated material. Both p- and s-polarizations of the reflected waves are separately measured. Although not employed specifically for urine samples yet, THz-TDSE may be considered a potentially interesting technique for biomarker detection in urine, as it applies to highly absorbing materials such as aqueous samples [135] that are not easily studied by conventional THz-TDS in transmission mode. In addition, compared to THz-TDS in reflection mode, THz-TDSE does not require reference measurements, which may be subject to significant errors due to the high sensitivity to very small displacement errors. In the optical/IR range, ellipsometry is a widely used and established technique to study the optical properties and thicknesses of thin films but requires a rather complex analysis due to the non-coherent detection in this range. This can be avoided by combining the coherent detection in THz-TDS and ellipsometry [135]. Therefore, THz-TDSE allows for determining the complex optical properties (refractive index and absorption) of highly absorptive samples without measuring reference signals.
- Free Electron Laser (FEL)-based THz sources [138,139]: The most powerful sources in the THz wavelength range. They can produce extremely bright, coherent, wideband, tunable ultra-short pulses that are not achievable with other techniques. The FEL THz source working principle is based on the interaction of a relativistic electron beam and a periodic magnetic field structure called an undulator or a wiggler. The undulator forces the electrons to wiggle transversely, emitting photons of radiation that are monochromatic but incoherent. The radiation is amplified by an optical cavity or an external laser, creating a feedback loop that modulates the electron energy and density. This leads to a coherent emission of tunable radiation, powerful (pulse energies up to 100 μJ with peak electric fields up to 1 MV/cm), and ultra-short (pulses of few picoseconds or less). The FEL THz source can generate radiation in the 1 to 30 THz frequency range, which is useful for various applications such as imaging, spectroscopy, and material research. The detection techniques used for high-intensity THz waves generated by FELs are electro-optic (EO) sampling, field-streaking, or, more recently, THz Air Breakdown Coherent Detection (ABCD). FELs can enable novel investigations into complex systems, time-dependent interactions, and material dynamics in the THz range. Example applications are in non-linear physics (high energies), polarisation-sensitive imaging, metamaterial-based sensing, and spectroscopy of biomolecules. FELs can overcome the limitations of conventional THz sources, such as low power, narrow bandwidth, poor coherence, and lack of tunability. They can also overcome the challenges of THz detection, such as low sensitivity, slow response, and high noise. FELs can provide high spatial resolution and penetration depth for imaging biological samples, as well as high spectral resolution and sensitivity for identifying molecular signatures. They can also enable label-free and non-invasive analysis of biological samples, as well as dynamic and functional imaging of biological processes.
4. Terahertz Spectroscopic Analysis of Urine
| Chemical Compound | THz Method | Frequency Band | Sample Preparation | Research Purpose | Reference |
|---|---|---|---|---|---|
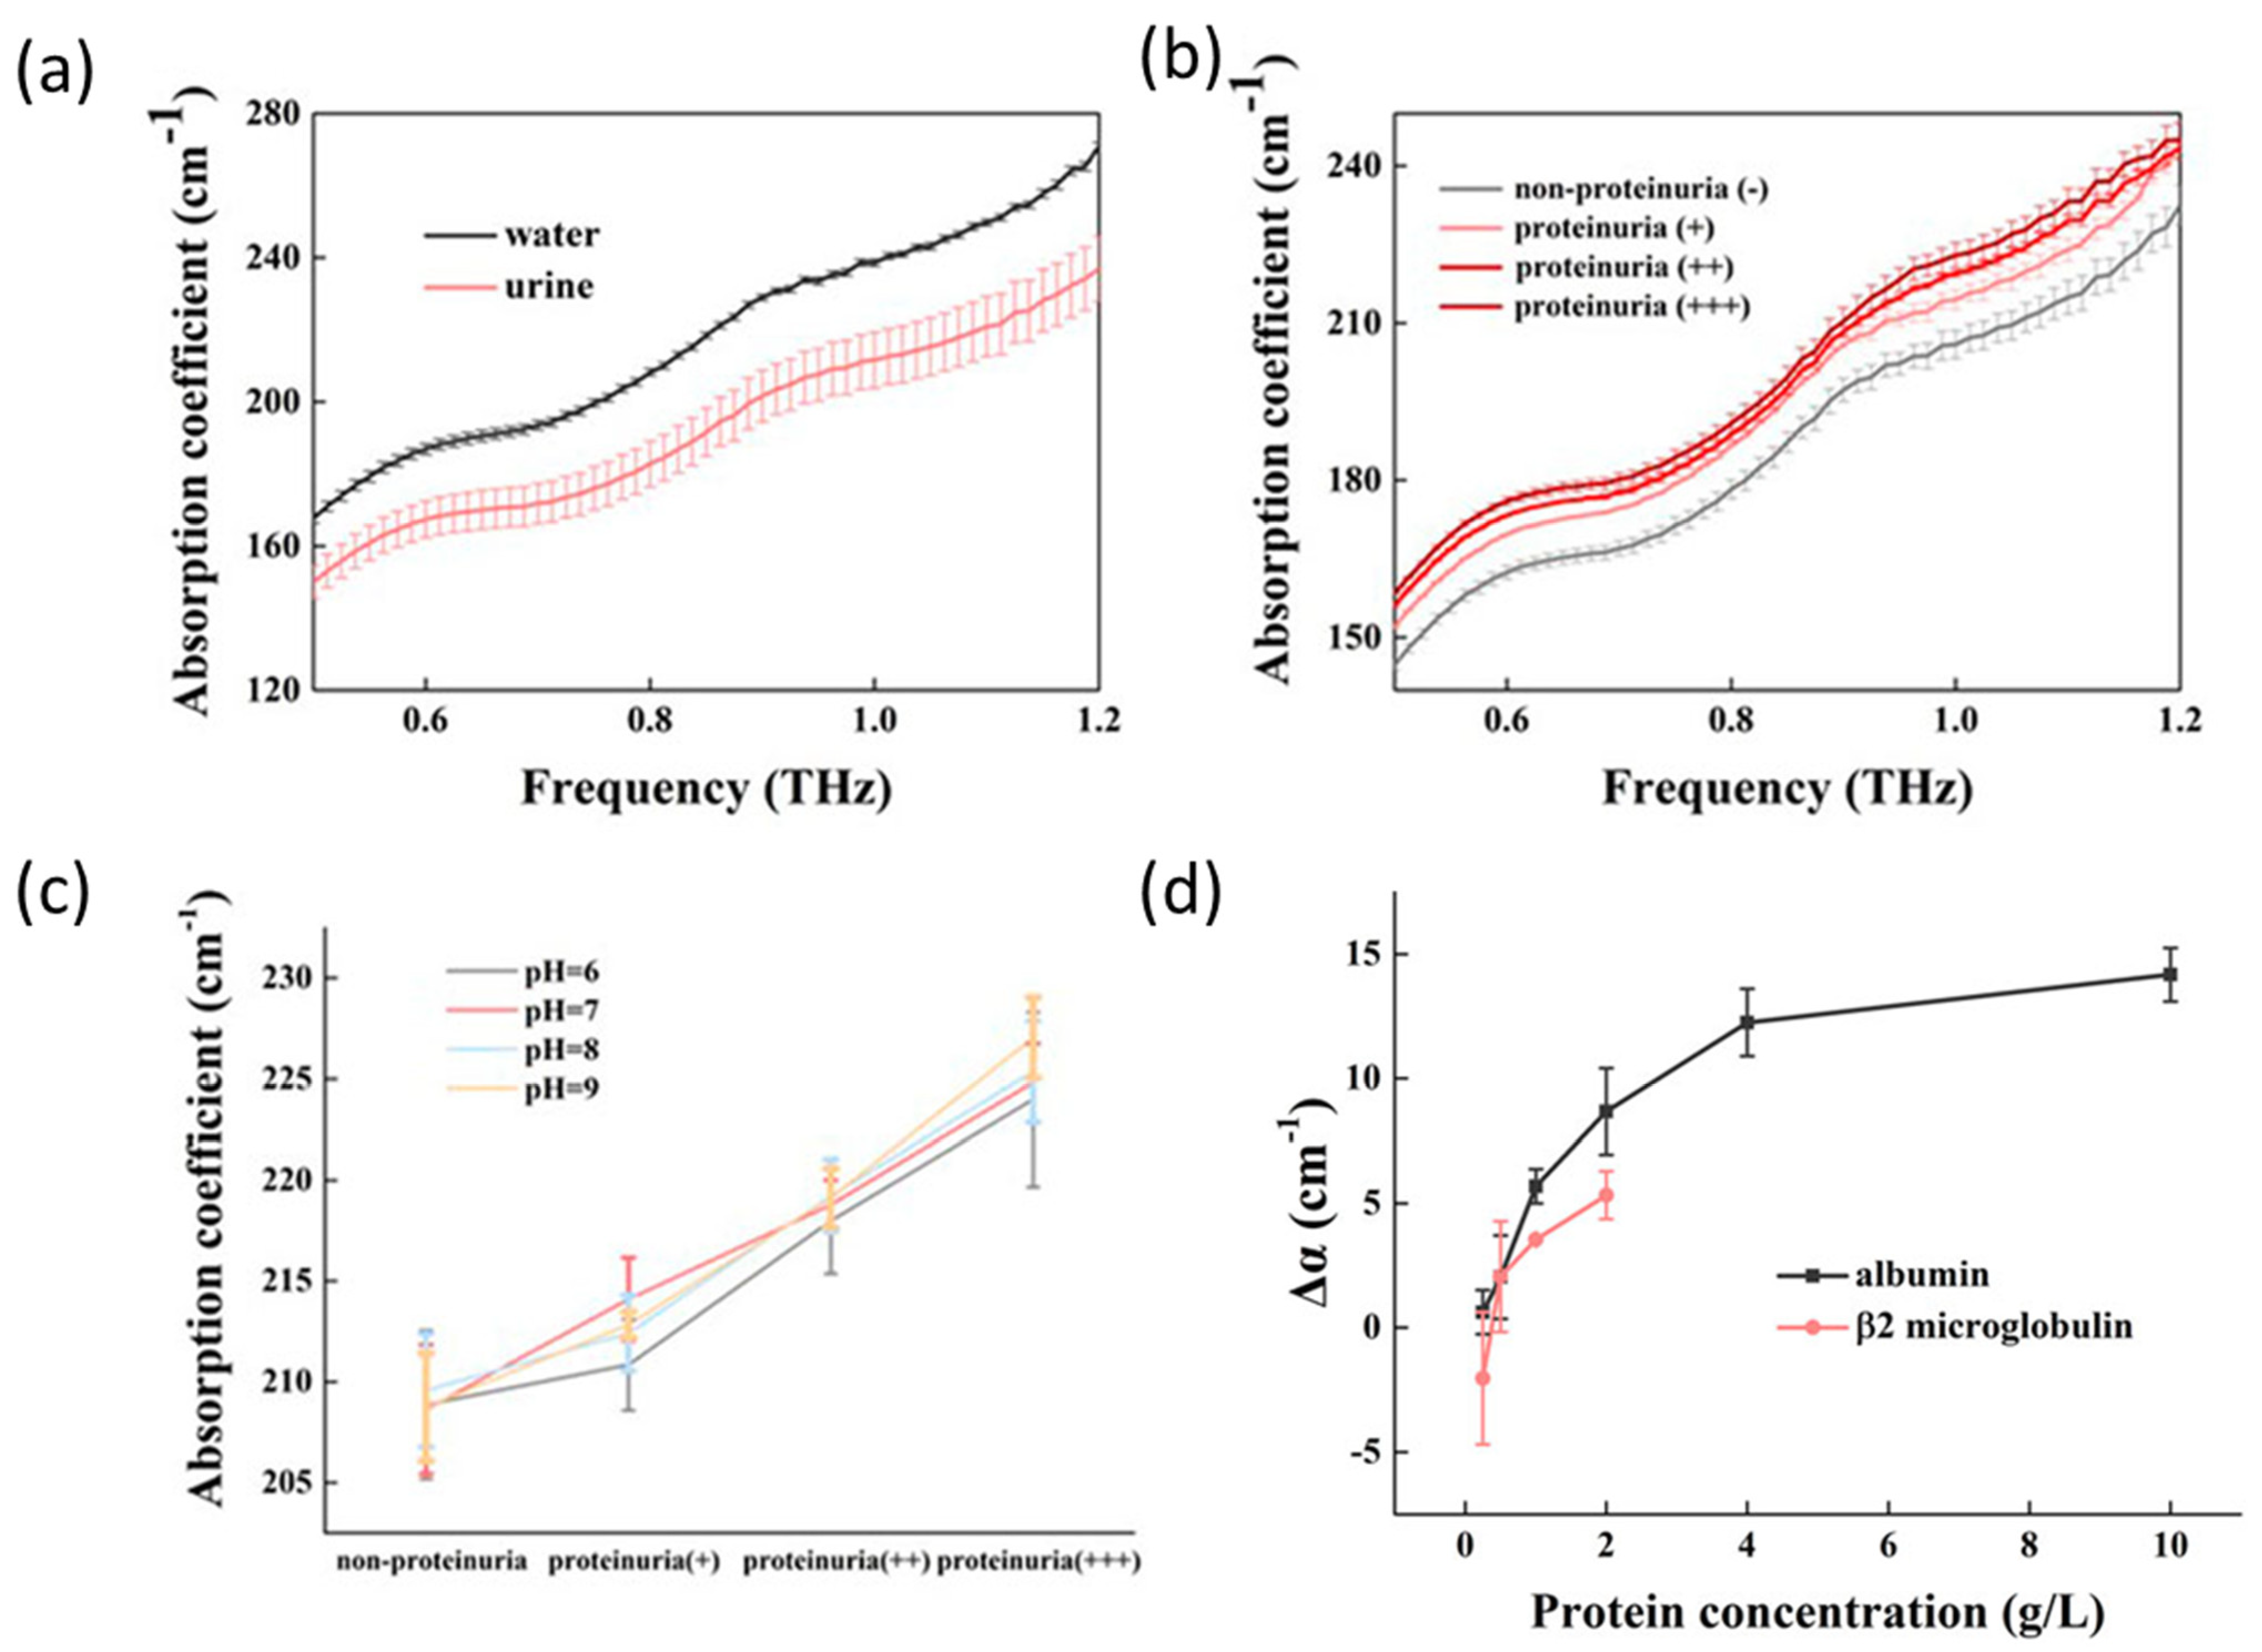
| β2-microglobulin and albumin | THz-TDS | 0.5–1.2 THz | 17.7 μL | proteinuria qualitative detection | [49] |
| albumin | PCA-ZnTe based THZ-TDS | 0.2–1.8 THz | 0.1 mm thick film of the liquid sample | Protein concentration in urine | [152] |
| homocysteine | THz-TDS | 0.2–2.8 THz | 0.14 mol/L in the form of a 1 mm thick tablet mixed with PE | absorption spectrum of homocysteine under different concentrations | [153] |
| glucose, albumin, urea | MM biosensor based on split-ring resonators | Tuneable: 0.2–2 THz 193 THz | 5–100 μm sample thickness 500 (nm/RIU) at 1–2 THz 136 (µm/RIU) at 193 THz | concentration of glucose, albumin, and urea in urine | [45] |
| glucose | photonic crystal ring resonator biosensor | 193 THz | of 0–15 gm/dl | concentration of glucose | [134] |
| acetone | high-resolution THz spectroscopy | 151.647 GHz | NA | acetone concentrations | [155] |
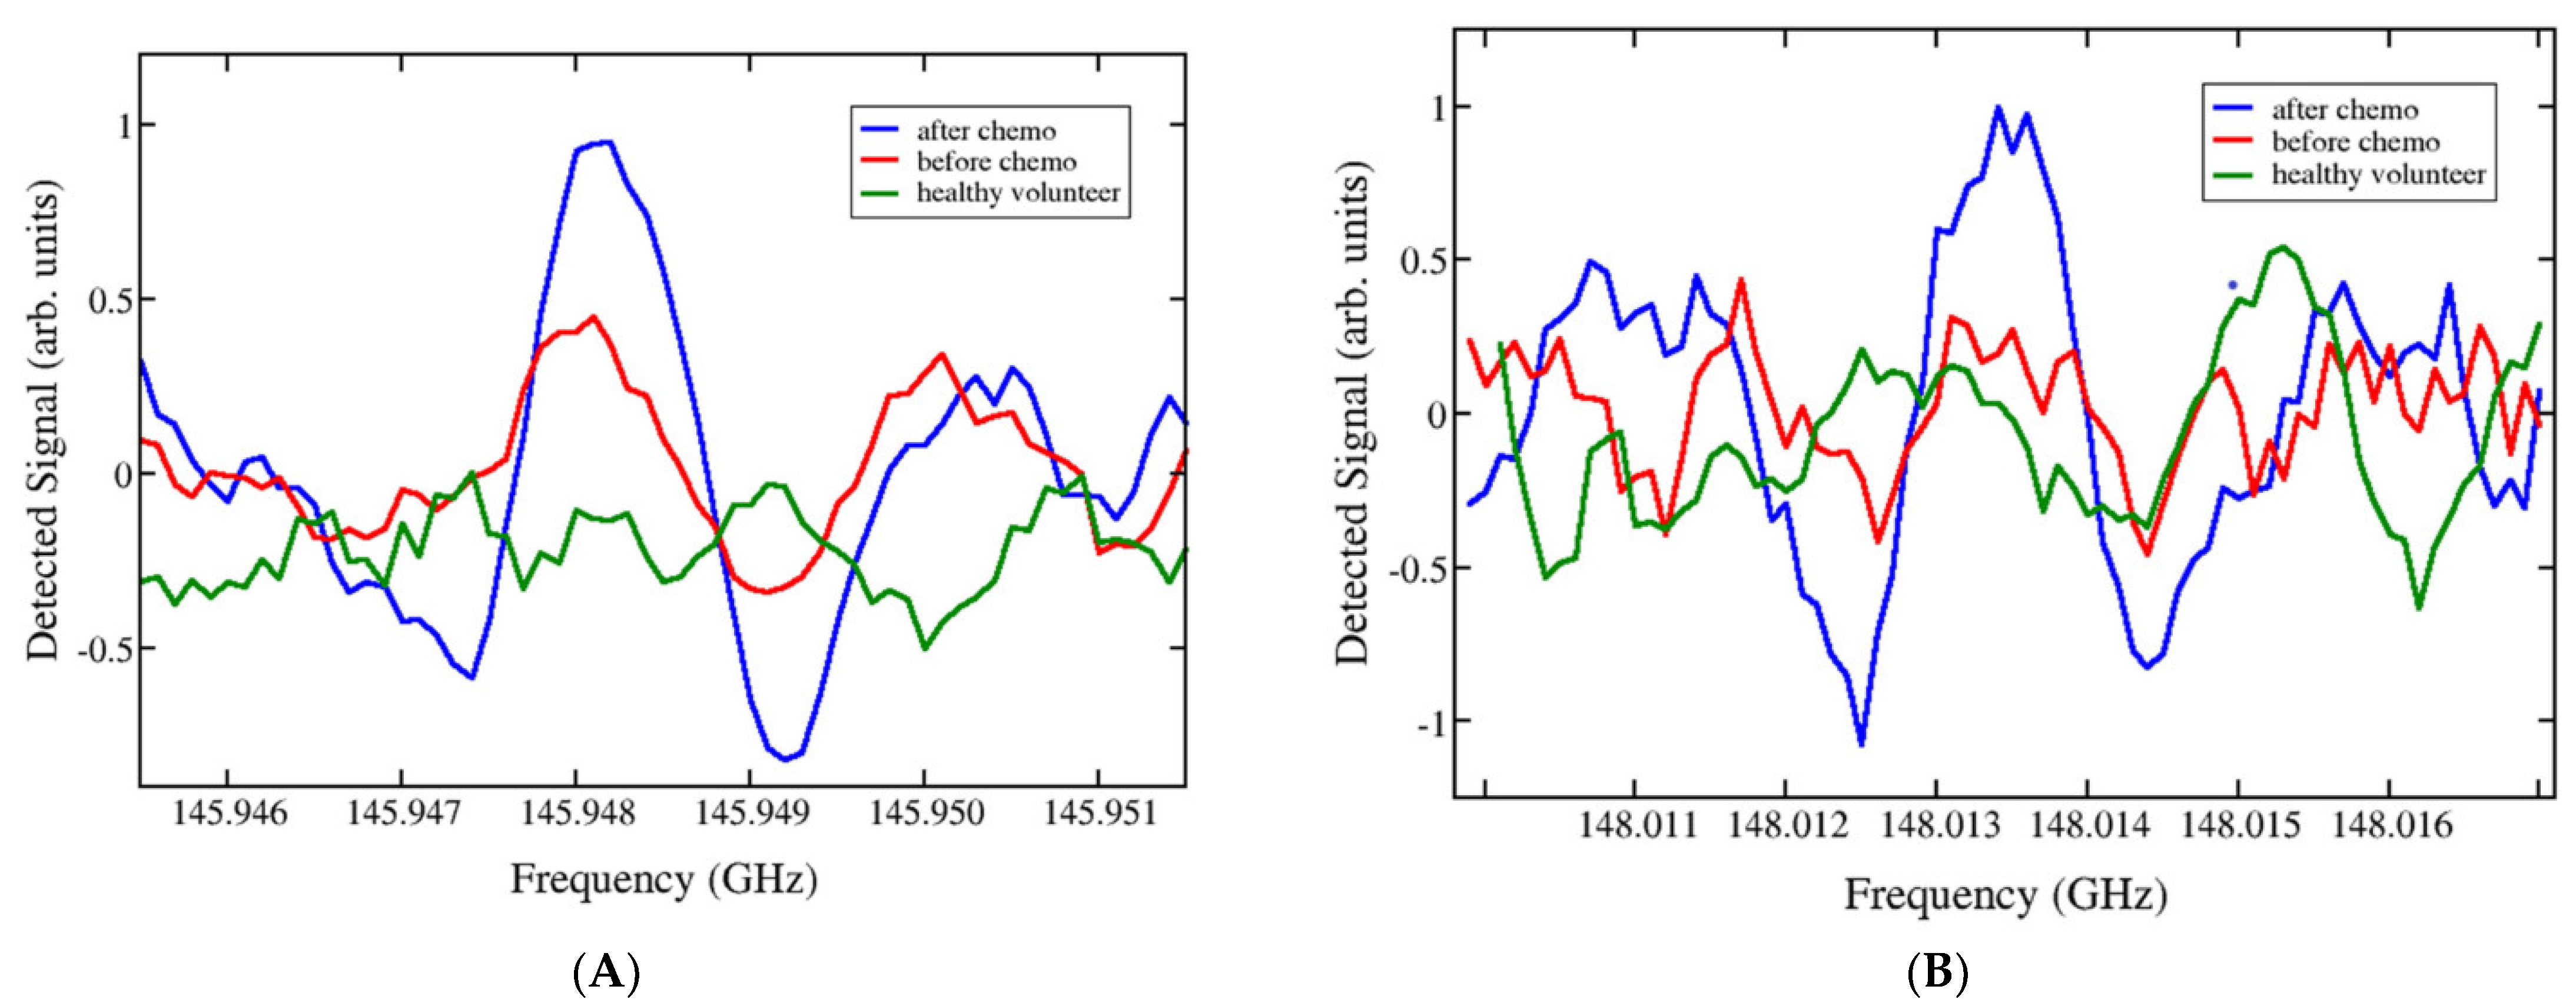
| multicomponent gas mixture | high-resolution THz gas spectroscopy (free-damping polarisation) | 150.537 GHz and 151.647 GHz | NA | composition of thermal decomposition products of urine before and after platinum-based chemotherapy | [146] |
| urea, creatinine, and glucose | ATR-FTIR | 4000–400 cm−1 (12–120 THz) | Aqueous solutions dry at room temperature | Glucose levels in rat urine samples | [26] |
| nitriles | high-resolution spectrometer based on Gunn generators and semiconductor superlattice multipliers and mixers | 4 distinct frequency ranges: 118–178 GHz 336–345 GHz 560–575 GHz 784–805 GHz | 1–2 mL urine was first frozen and dehydrated to form a thin film or crystallised residue, which was then evaporated and heated | dynamics of urine composition for cancer patients treated with chemotherapy | [50] |
| Gram-positive bacteria, Gram-negative bacteria, and fungi | ATR-THz | 0.1–5.0 THz | isolates from clinical samples of urine, diameter of 7 mm and a thickness of 100 µm | microbial identification from urine samples | [51] |
| urinary stones | FIR microspectroscopy in reflection mode | 4.5–20 THz | cross-sectioned urinary stone | urinary stone structure and chemical composition | [133] |
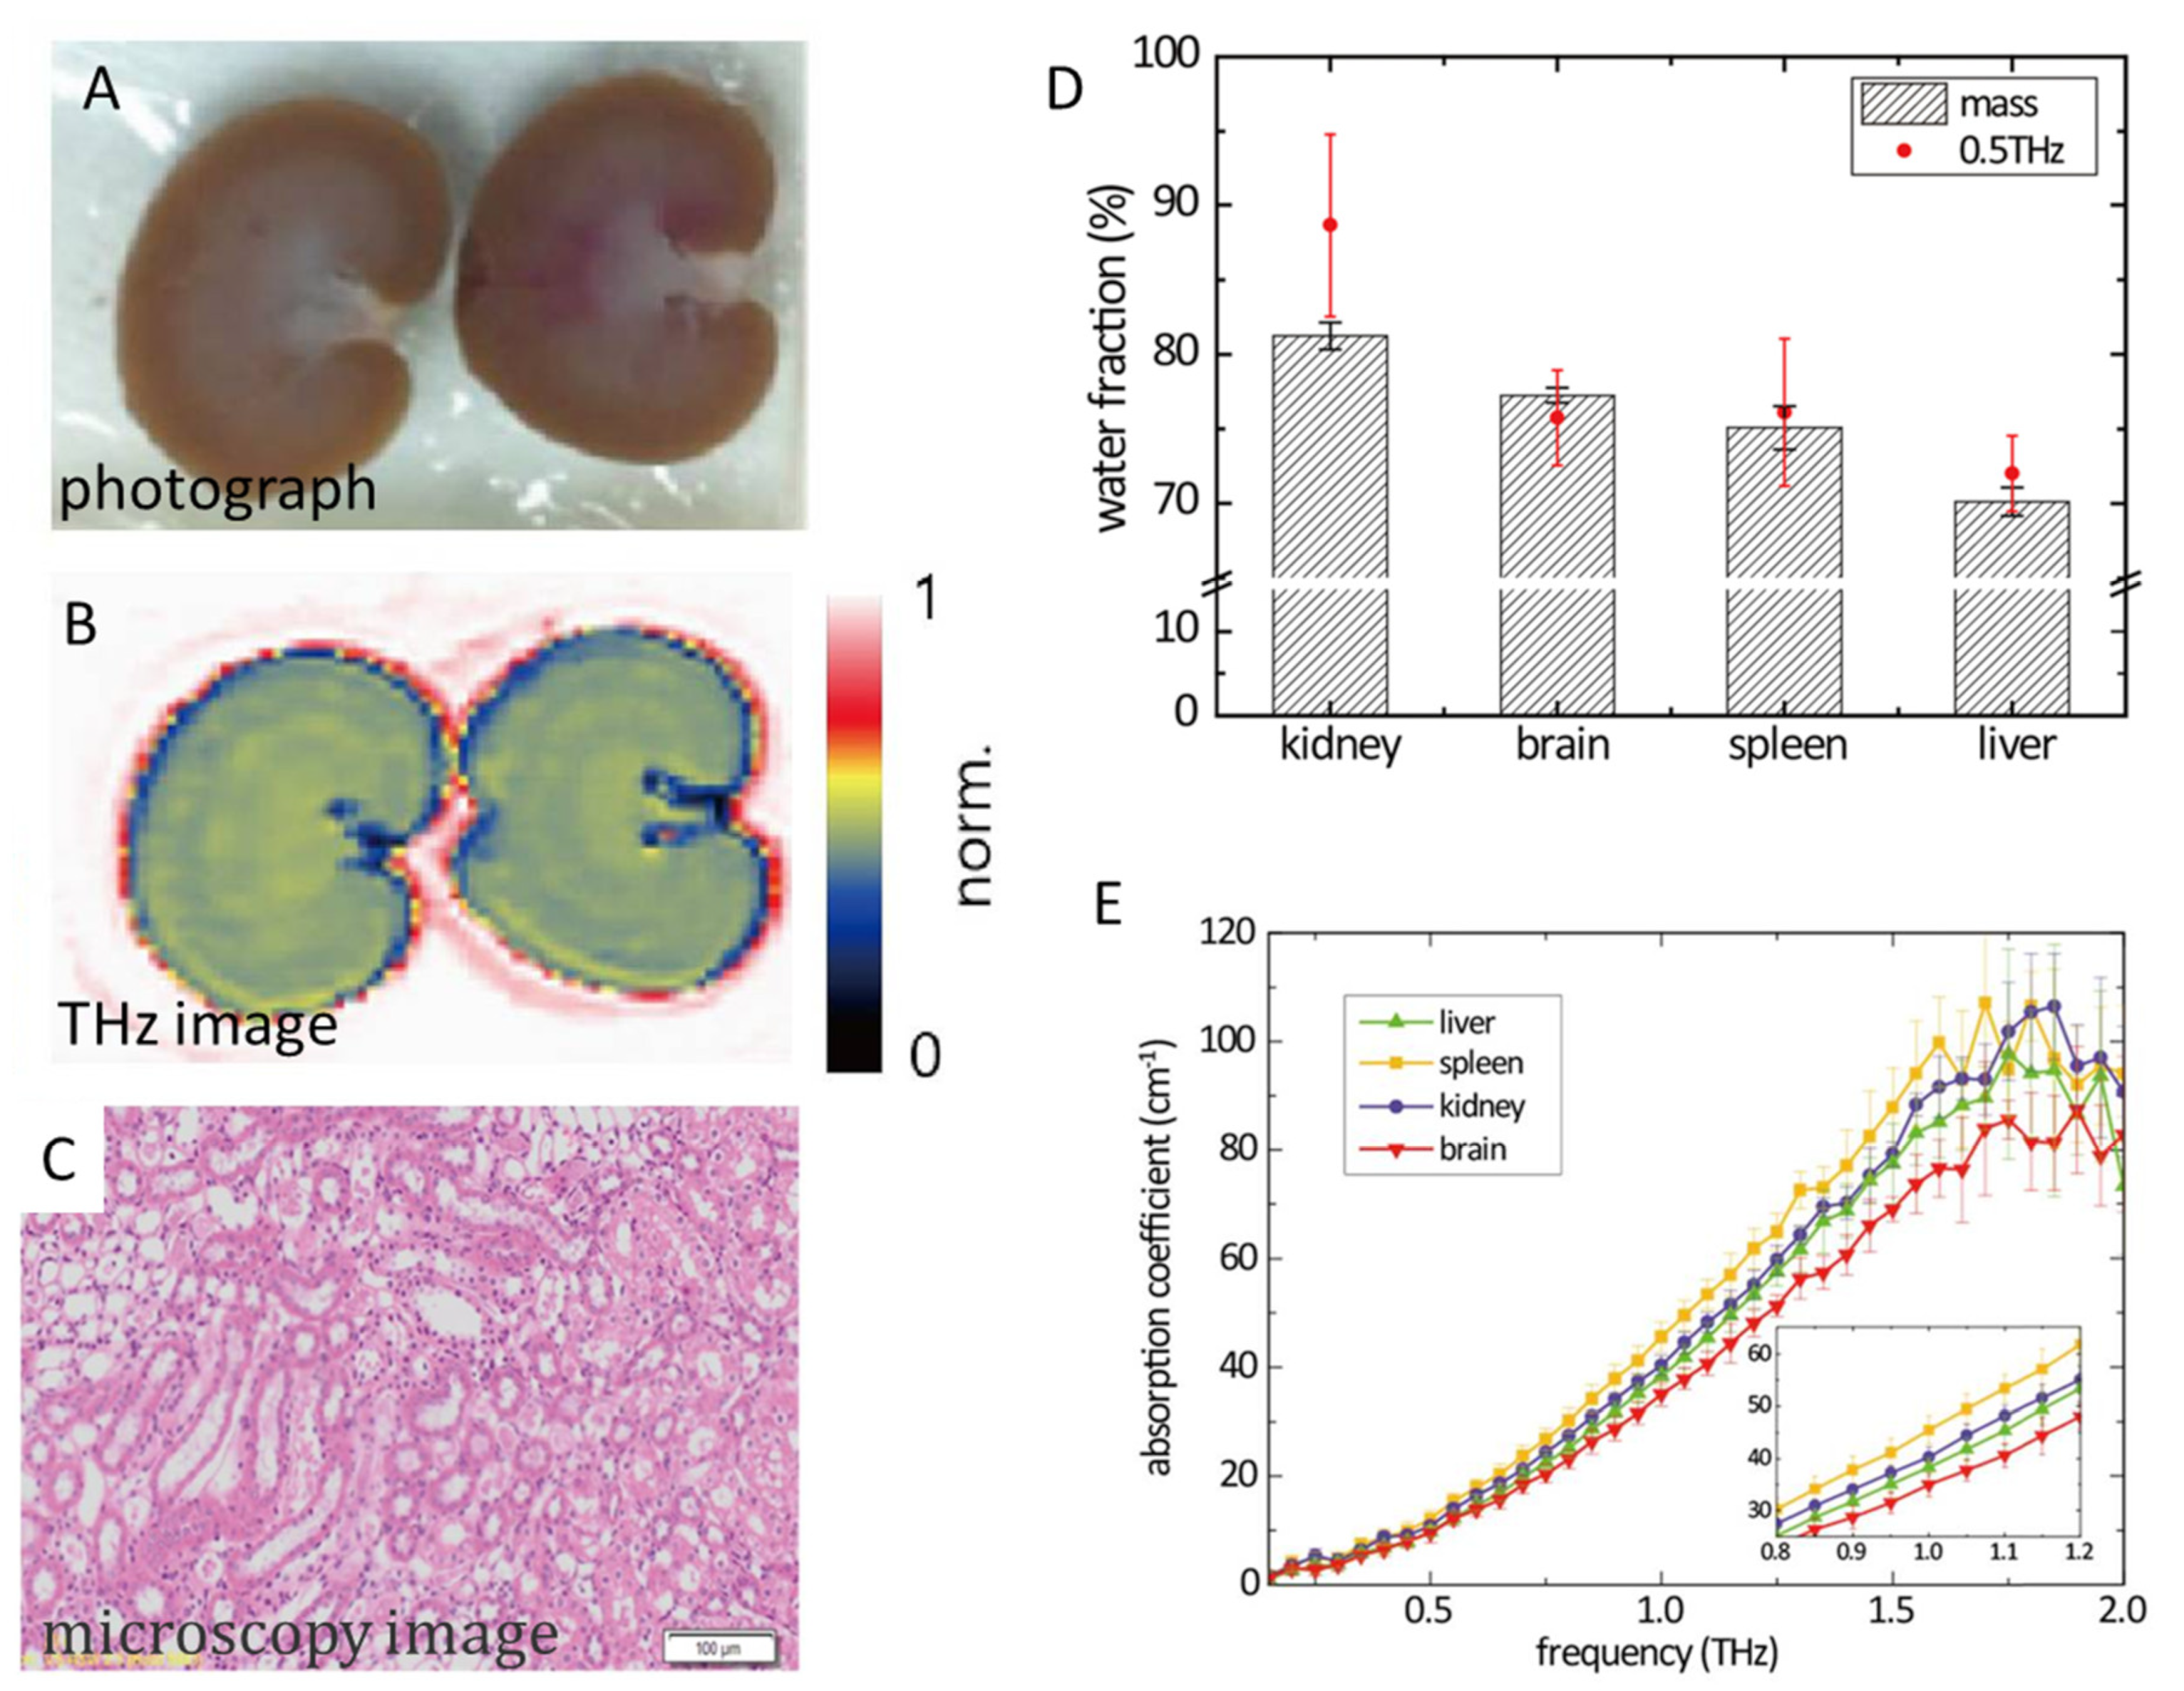
| water content | transmission-mode THz-TDS and reflection-mode THz imaging | 0.2–2.0 THz | Fresh and lyophilised fresh kidney tissues from Sprague Dawley rat | measuring water contents in kidney tissue | [157] |
| sulfur compounds (methanethiol) formic acid | THz-TDS THz high-resolution gas spectrometer | 0.2–1.4 THz (THz-TDS) 118 to 178 GHz (gas spectrometer) | vapours samples of dried rat kidney tissue in a pellet form | molecular content of rat kidney tissue during thermal decomposition to distinguish diabetic from non-diabetic samples; absorption rotational spectra of vapours | [9] |
| lysozyme (from hen egg white lysozyme) mouse urinary protein | NA (THz-TDS assumed) | 0.6–4.5 THz | lyophilised powders and single-crystal proteins in a pellet form | THz frequency response at different concentrations and temperature | [162] |
5. Conclusions and Future Directions for Detection of Urinary Metabolic Biomarkers by THz Systems
- Different labelling agents can be used to specifically improve the detection of metabolites in urine by THz spectroscopy, but this will lead to sample distortion. Adding different reagents to urine samples requires different time and financial costs. This still limits the use of THz spectroscopy in medical biomarker diagnostics.
- Different AI algorithms can extract effective information from large amounts of spectroscopic information regarding urine constituents, but some useful information may be lost in the process.
- Further optimisation of THz systems is necessary, especially in terms of signal-to-noise and frequency resolution improvement, to increase the sensitivity of detection and increase the frequency bandwidth to improve the selectivity for various substances since the signal of the target substance can still be overlaid with the signals of other substances in the urine samples. Urine samples contain components such as water, protein, lipids, fibres and other organic constituents, and target substances such as metabolic biomarkers often only occupy a small proportion, so the signal-to-noise ratio is very important for the detection of absorption peaks of target substances.
- For non-invasive cancer diagnosis, human liquid secretions such as urine are of increasing interest as the sample collection is very fast and non-invasive. It is easy to collect urine even at home, without the assistance of medical staff, with no restrictions on quantity and reproducibility. However, using urine for liquid biopsy requires the determination of pre-analytical parameters such as urine type, urine fraction, collected volume, collection method, preservation, collection time, etc. All these parameters can influence the THz spectroscopic measurements and the interpretation of the obtained results. Therefore, from this point of view, it is of utmost importance that future THz studies on urine samples are carried out, also considering all factors that may affect the reliability, validity, and reproducibility of the results. The influence of exogenous substances on urinary metabolites such as water, drugs, and food, which can cause strong interferences in THz urinalysis, must also be considered. An interesting THz study would be to investigate the influence of diet on urine metabolomics, which can certainly show changes in the THz spectra and the calculation of the absorption coefficient and refractive index.
- Although obtaining urine samples is a simple and non-invasive process, the way these samples are stored and handled requires specifics. For example, one THz study suggested that urine samples should be quickly stored in a medical refrigerator and analysed within a day [152]. This may eliminate the effects of prolonged storage of samples on the THz measurement itself. Sometimes, urine in liquid form is difficult to analyse, and urine samples should also be pre-treated using different methods of filtering, cleaning and drying [153], which can simplify the detection of metabolic biomarkers in solutions such as urine.
Author Contributions
Funding
Institutional Review Board Statement
Informed Consent Statement
Data Availability Statement
Conflicts of Interest
References
- Humphrey, R.; Trivedi, S. Murine Plasmacytoma Tumor-Cell Burden Measured In Vivo by Means of Guanido-C-14-Arginine Labeling of M Component Biomarker. J. Exp. Hematol. 1976, 4, 28. [Google Scholar]
- Webb, K.S.; Lin, G.H. Urinary Fibronectin: Potential as a Biomarker in Prostatic Cancer. Investig. Urol. 1980, 17, 401–404. [Google Scholar]
- Bodaghi, A.; Fattahi, N.; Ramazani, A. Biomarkers: Promising and Valuable Tools towards Diagnosis, Prognosis and Treatment of COVID-19 and Other Diseases. Heliyon 2023, 9, e13323. [Google Scholar] [CrossRef] [PubMed]
- Califf, R.M. Biomarker Definitions and Their Applications. Exp. Biol. Med. 2018, 243, 213–221. [Google Scholar] [CrossRef] [PubMed]
- Lucignani, G.; Neri, E. Integration of Imaging Biomarkers into Systems Biomedicine: A Renaissance for Medical Imaging. Clin. Transl. Imaging 2019, 7, 149–153. [Google Scholar] [CrossRef]
- Nikanjam, M.; Kato, S.; Kurzrock, R. Liquid Biopsy: Current Technology and Clinical Applications. J. Hematol. Oncol. J. Hematol. Oncol. 2022, 15, 131. [Google Scholar] [CrossRef]
- Yu, D.; Li, Y.; Wang, M.; Gu, J.; Xu, W.; Cai, H.; Fang, X.; Zhang, X. Exosomes as a New Frontier of Cancer Liquid Biopsy. Mol. Cancer 2022, 21, 56. [Google Scholar] [CrossRef]
- Jordaens, S.; Zwaenepoel, K.; Tjalma, W.; Deben, C.; Beyers, K.; Vankerckhoven, V.; Pauwels, P.; Vorsters, A. Urine Biomarkers in Cancer Detection: A Systematic Review of Preanalytical Parameters and Applied Methods. Int. J. Cancer 2023, 152, 2186–2205. [Google Scholar] [CrossRef]
- Lykina, A.A.; Anfertev, V.A.; Domracheva, E.G.; Chernyaeva, M.B.; Kononova, Y.A.; Toropova, Y.G.; Korolev, D.V.; Smolyanskaya, O.A.; Vaks, V.L. Terahertz High-Resolution Spectroscopy of Thermal Decomposition Gas Products of Diabetic and Non-Diabetic Blood Plasma and Kidney Tissue Pellets. J. Biomed. Opt. 2021, 26, 043008. [Google Scholar] [CrossRef]
- Yang, M.; Liu, X.; Tang, X.; Sun, W.; Ji, Z. LC-MS Based Urine Untargeted Metabolomic Analyses to Identify and Subdivide Urothelial Cancer. Front. Oncol. 2023, 13, 1160965. [Google Scholar] [CrossRef]
- Wang, W.; Rong, Z.; Wang, G.; Hou, Y.; Yang, F.; Qiu, M. Cancer Metabolites: Promising Biomarkers for Cancer Liquid Biopsy. Biomark. Res. 2023, 11, 66. [Google Scholar] [CrossRef] [PubMed]
- Gowda, G.A.N.; Raftery, D. NMR Based Metabolomics. Adv. Exp. Med. Biol. 2021, 1280, 19–37. [Google Scholar] [CrossRef]
- Beckonert, O.; Keun, H.C.; Ebbels, T.M.D.; Bundy, J.; Holmes, E.; Lindon, J.C.; Nicholson, J.K. Metabolic Profiling, Metabolomic and Metabonomic Procedures for NMR Spectroscopy of Urine, Plasma, Serum and Tissue Extracts. Nat. Protoc. 2007, 2, 2692–2703. [Google Scholar] [CrossRef]
- Emwas, A.-H.; Luchinat, C.; Turano, P.; Tenori, L.; Roy, R.; Salek, R.M.; Ryan, D.; Merzaban, J.S.; Kaddurah-Daouk, R.; Zeri, A.C.; et al. Standardizing the Experimental Conditions for Using Urine in NMR-Based Metabolomic Studies with a Particular Focus on Diagnostic Studies: A Review. Metabolomics 2015, 11, 872–894. [Google Scholar] [CrossRef] [PubMed]
- Emwas, A.-H.; Roy, R.; McKay, R.T.; Ryan, D.; Brennan, L.; Tenori, L.; Luchinat, C.; Gao, X.; Zeri, A.C.; Gowda, G.A.N.; et al. Recommendations and Standardization of Biomarker Quantification Using NMR-Based Metabolomics with Particular Focus on Urinary Analysis. J. Proteome Res. 2016, 15, 360–373. [Google Scholar] [CrossRef]
- Zhang, X.; Li, Q.; Xu, Z.; Dou, J. Mass Spectrometry-Based Metabolomics in Health and Medical Science: A Systematic Review. RSC Adv. 2020, 10, 3092–3104. [Google Scholar] [CrossRef] [PubMed]
- Zou, W.; She, J.; Tolstikov, V.V. A Comprehensive Workflow of Mass Spectrometry-Based Untargeted Metabolomics in Cancer Metabolic Biomarker Discovery Using Human Plasma and Urine. Metabolites 2013, 3, 787–819. [Google Scholar] [CrossRef]
- Martinez-Moral, M.-P.; Kannan, K. Analysis of 19 Urinary Biomarkers of Oxidative Stress, Nitrative Stress, Metabolic Disorders, and Inflammation Using Liquid Chromatography–Tandem Mass Spectrometry. Anal. Bioanal. Chem. 2022, 414, 2103–2116. [Google Scholar] [CrossRef]
- Liu, X.; Li, J.; Hao, X.; Sun, H.; Zhang, Y.; Zhang, L.; Jia, L.; Tian, Y.; Sun, W. LC–MS-Based Urine Metabolomics Analysis for the Diagnosis and Monitoring of Medulloblastoma. Front. Oncol. 2022, 12, 949513. [Google Scholar] [CrossRef]
- Nam, H.; Chung, B.C.; Kim, Y.; Lee, K.; Lee, D. Combining Tissue Transcriptomics and Urine Metabolomics for Breast Cancer Biomarker Identification. Bioinformatics 2009, 25, 3151–3157. [Google Scholar] [CrossRef]
- Ray, P.; Steckl, A.J. Label-Free Optical Detection of Multiple Biomarkers in Sweat, Plasma, Urine, and Saliva. ACS Sens. 2019, 4, 1346–1357. [Google Scholar] [CrossRef]
- Kamal, A.; Gulfraz, M.; Anwar, M.A.; Malik, R.N. Reverse Phase High Performance Liquid Chromatographic Method Development Based on Ultravioletvisible Detector for the Analysis of 1-Hydroxypyrene (PAH Biomarker) in Human Urine. Int. J. Occup. Med. Environ. Health 2015, 28, 399–403. [Google Scholar] [CrossRef]
- Birková, A.; Oboril, J.; Kréta, R.; Čižmárová, B.; Hubková, B.; Šteffeková, Z.; Genči, J.; Paralič, J.; Mareková, M. Human Fluorescent Profile of Urine as a Simple Tool of Mining in Data from Autofluorescence Spectroscopy. Biomed. Signal Process. Control 2020, 56, 101693. [Google Scholar] [CrossRef]
- Witzke, K.E.; Großerueschkamp, F.; Jütte, H.; Horn, M.; Roghmann, F.; von Landenberg, N.; Bracht, T.; Kallenbach-Thieltges, A.; Käfferlein, H.; Brüning, T.; et al. Integrated Fourier Transform Infrared Imaging and Proteomics for Identification of a Candidate Histochemical Biomarker in Bladder Cancer. Am. J. Pathol. 2019, 189, 619–631. [Google Scholar] [CrossRef] [PubMed]
- Ortega-Hernández, N.; Ortega-Romero, M.; Medeiros-Domingo, M.; Barbier, O.C.; Rojas-López, M. Detection of Biomarkers Associated with Acute Kidney Injury by a Gold Nanoparticle Based Colloidal Nano-Immunosensor by Fourier-Transform Infrared Spectroscopy with Principal Component Analysis. Anal. Lett. 2022, 55, 2370–2381. [Google Scholar] [CrossRef]
- Caixeta, D.C.; Lima, C.; Xu, Y.; Guevara-Vega, M.; Espindola, F.S.; Goodacre, R.; Zezell, D.M.; Sabino-Silva, R. Monitoring Glucose Levels in Urine Using FTIR Spectroscopy Combined with Univariate and Multivariate Statistical Methods. Spectrochim. Acta. A Mol. Biomol. Spectrosc. 2023, 290, 122259. [Google Scholar] [CrossRef]
- Vigo, F.; Tozzi, A.; Disler, M.; Gisi, A.; Kavvadias, V.; Kavvadias, T. Vibrational Spectroscopy in Urine Samples as a Medical Tool: Review and Overview on the Current State-of-the-Art. Diagnostics 2022, 13, 27. [Google Scholar] [CrossRef] [PubMed]
- Huttanus, H.M.; Vu, T.; Guruli, G.; Tracey, A.; Carswell, W.; Said, N.; Du, P.; Parkinson, B.G.; Orlando, G.; Robertson, J.L.; et al. Raman Chemometric Urinalysis (Rametrix) as a Screen for Bladder Cancer. PLoS ONE 2020, 15, e0237070. [Google Scholar] [CrossRef] [PubMed]
- Jeng, M.-J.; Sharma, M.; Lee, C.-C.; Lu, Y.-S.; Tsai, C.-L.; Chang, C.-H.; Chen, S.-W.; Lin, R.-M.; Chang, L.-B. Raman Spectral Characterization of Urine for Rapid Diagnosis of Acute Kidney Injury. J. Clin. Med. 2022, 11, 4829. [Google Scholar] [CrossRef] [PubMed]
- Moreira, L.P.; Silveira, L.; da Silva, A.G.; Fernandes, A.B.; Pacheco, M.T.T.; Rocco, D.D.F.M. Raman Spectroscopy Applied to Identify Metabolites in Urine of Physically Active Subjects. J. Photochem. Photobiol. B 2017, 176, 92–99. [Google Scholar] [CrossRef]
- Lucas, A.D.; Jones, A.D.; Goodrow, M.H.; Saiz, S.G.; Blewett, C.; Seiber, J.N.; Hammock, B.D. Determination of Atrazine Metabolites in Human Urine: Development of a Biomarker of Exposure. Available online: https://pubs.acs.org/doi/pdf/10.1021/tx00031a017 (accessed on 19 July 2023).
- Bradlow, H.L.; Sepkovic, D.W.; Klug, T.; Osborne, M.P. Application of an Improved ELISA Assay to the Analysis of Urinary Estrogen Metabolites. Steroids 1998, 63, 406–413. [Google Scholar] [CrossRef] [PubMed]
- Zheng, X.-M.; Yang, F.-Y.; Chen, X.; Yang, Y.-H.; Zhu, X.-R.; Chen, C.; Yang, J.-K. Development of a Sensitive and Reliable ELISA Kit of Urinary Haptoglobin to Predict Progress of Diabetic Kidney Disease. Diabetes Metab. Res. Rev. 2021, 37, e3432. [Google Scholar] [CrossRef] [PubMed]
- Shan, G.; Huang, H.; Stoutamire, D.W.; Gee, S.J.; Leng, G.; Hammock, B.D. A Sensitive Class Specific Immunoassay for the Detection of Pyrethroid Metabolites in Human Urine. Chem. Res. Toxicol. 2004, 17, 218–225. [Google Scholar] [CrossRef] [PubMed]
- Wang, Y.; Li, Z.; Barnych, B.; Huo, J.; Wan, D.; Vasylieva, N.; Xu, J.; Li, P.; Liu, B.; Zhang, C.; et al. Investigation of Small Size of Nanobody for Sensitive Fluorescence Polarization Immunoassay for Small Molecule: 3-Phenoxybenzoic Acid, an Exposure Biomarker of Pyrethroid Insecticides as a Model. J. Agric. Food Chem. 2019, 67, 11536–11541. [Google Scholar] [CrossRef] [PubMed]
- Kraemer, T.; Wennig, R.; Maurer, H.H. The Antispasmodic Drug Mebeverine Leads to Positive Amphetamine Results by Fluorescence Polarization Immunoassay (FPIA)—Studies on the Toxicological Analysis of Urine by FPIA and GC-MS. J. Anal. Toxicol. 2001, 25, 333–338. [Google Scholar] [CrossRef]
- Hendrickson, O.D.; Taranova, N.A.; Zherdev, A.V.; Dzantiev, B.B.; Eremin, S.A. Fluorescence Polarization-Based Bioassays: New Horizons. Sensors 2020, 20, 7132. [Google Scholar] [CrossRef]
- Sequeira-Antunes, B.; Ferreira, H.A. Urinary Biomarkers and Point-of-Care Urinalysis Devices for Early Diagnosis and Management of Disease: A Review. Biomedicines 2023, 11, 1051. [Google Scholar] [CrossRef]
- Hwang, C.; Lee, W.-J.; Kim, S.D.; Park, S.; Kim, J.H. Recent Advances in Biosensor Technologies for Point-of-Care Urinalysis. Biosensors 2022, 12, 1020. [Google Scholar] [CrossRef]
- Wang, H.; Zheng, F.; Xu, Y.; Mauk, M.G.; Qiu, X.; Tian, Z.; Zhang, L. Recent Progress in Terahertz Biosensors Based on Artificial Electromagnetic Subwavelength Structure. TrAC Trends Anal. Chem. 2023, 158, 116888. [Google Scholar] [CrossRef]
- Wang, G.; Zhu, F.; Lang, T.; Liu, J.; Hong, Z.; Qin, J. All-Metal Terahertz Metamaterial Biosensor for Protein Detection. Nanoscale Res. Lett. 2021, 16, 109. [Google Scholar] [CrossRef]
- EL-Wasif, Z.; Ismail, T.; Hamdy, O. Design and Optimization of Highly Sensitive Multi-Band Terahertz Metamaterial Biosensor for Coronaviruses Detection. Opt. Quantum Electron. 2023, 55, 604. [Google Scholar] [CrossRef] [PubMed]
- Terahertz Biosensing of Protein Based on a Metamaterial|IEEE Conference Publication|IEEE Xplore. Available online: https://ieeexplore.ieee.org/document/7824992 (accessed on 19 July 2023).
- Mehrotra, P.; Chatterjee, B.; Sen, S. EM-Wave Biosensors: A Review of RF, Microwave, Mm-Wave and Optical Sensing. Sensors 2019, 19, 1013. [Google Scholar] [CrossRef] [PubMed]
- Emaminejad, H.; Mir, A.; Farmani, A. Design and Simulation of a Novel Tunable Terahertz Biosensor Based on Metamaterials for Simultaneous Monitoring of Blood and Urine Components. Plasmonics 2021, 16, 1537–1548. [Google Scholar] [CrossRef]
- Matvejev, V.; Zhang, Y.; Stiens, J. High Performance Integrated Terahertz Sensor for Detection of Biomolecular Processes in Solution. IET Microw. Antennas Propag. 2014, 8, 394–400. [Google Scholar] [CrossRef]
- Yang, K.; Li, J.; Lamy de la Chapelle, M.; Huang, G.; Wang, Y.; Zhang, J.; Xu, D.; Yao, J.; Yang, X.; Fu, W. A Terahertz Metamaterial Biosensor for Sensitive Detection of MicroRNAs Based on Gold-Nanoparticles and Strand Displacement Amplification. Biosens. Bioelectron. 2021, 175, 112874. [Google Scholar] [CrossRef]
- Veeraselvam, A.; Mohammed, G.N.A.; Savarimuthu, K. A Novel Ultra-Miniaturized Highly Sensitive Refractive Index-Based Terahertz Biosensor. J. Light. Technol. 2021, 39, 7281–7287. [Google Scholar] [CrossRef]
- Xue, Z.; Mao, P.; Peng, P.; Yan, S.; Zang, Z.; Yao, C. Terahertz Spectra of Proteinuria and Non-Proteinuria. Front. Bioeng. Biotechnol. 2023, 11, 1119694. [Google Scholar] [CrossRef]
- Vaks, V.; Anfertev, V.; Chernyaeva, M.; Domracheva, E.; Yablokov, A.; Maslennikova, A.; Zhelesnyak, A.; Baranov, A.; Schevchenko, Y.; Pereira, M.F. Sensing Nitriles with THz Spectroscopy of Urine Vapours from Cancers Patients Subject to Chemotherapy. Sci. Rep. 2022, 12, 18117. [Google Scholar] [CrossRef]
- Yu, W.; Shi, J.; Huang, G.; Zhou, J.; Zhan, X.; Guo, Z.; Tian, H.; Xie, F.; Yang, X.; Fu, W. THz-ATR Spectroscopy Integrated with Species Recognition Based on Multi-Classifier Voting for Automated Clinical Microbial Identification. Biosensors 2022, 12, 378. [Google Scholar] [CrossRef]
- Vaks, V.; Domracheva, E.; Chernyaeva, M.; Anfertev, V.; Zhukova, E.S.; Shcherbatyuk, T.G. An Application of THz Gas High Resolution Spectroscopy Method for Investigation of Thermal Decomposition Products of Biological Liquid (Urine) of Rats with Dysbacteriosis. In Proceedings of the 2022 IEEE 8th All-Russian Microwave Conference (RMC), Moscow, Russia, 23–25 November 2022; pp. 31–34. [Google Scholar]
- Wishart, D.S.; Guo, A.; Oler, E.; Wang, F.; Anjum, A.; Peters, H.; Dizon, R.; Sayeeda, Z.; Tian, S.; Lee, B.L.; et al. HMDB 5.0: The Human Metabolome Database for 2022. Nucleic Acids Res. 2021, 50, D622–D631. [Google Scholar] [CrossRef]
- Bouatra, S.; Aziat, F.; Mandal, R.; Guo, A.C.; Wilson, M.R.; Knox, C.; Bjorndahl, T.C.; Krishnamurthy, R.; Saleem, F.; Liu, P.; et al. The Human Urine Metabolome. PLoS ONE 2013, 8, e73076. [Google Scholar] [CrossRef] [PubMed]
- da Costa, B.R.B.; De Martinis, B.S. Analysis of Urinary VOCs Using Mass Spectrometric Methods to Diagnose Cancer: A Review. Clin. Mass Spectrom. 2020, 18, 27–37. [Google Scholar] [CrossRef] [PubMed]
- Broza, Y.Y.; Zhou, X.; Yuan, M.; Qu, D.; Zheng, Y.; Vishinkin, R.; Khatib, M.; Wu, W.; Haick, H. Disease Detection with Molecular Biomarkers: From Chemistry of Body Fluids to Nature-Inspired Chemical Sensors. Chem. Rev. 2019, 119, 11761–11817. [Google Scholar] [CrossRef] [PubMed]
- Wen, Q.; Boshier, P.; Myridakis, A.; Belluomo, I.; Hanna, G.B. Urinary Volatile Organic Compound Analysis for the Diagnosis of Cancer: A Systematic Literature Review and Quality Assessment. Metabolites 2020, 11, 17. [Google Scholar] [CrossRef] [PubMed]
- Chakraborty, A.; Dasari, S.; Long, W.; Mohan, C. Urine Protein Biomarkers for the Detection, Surveillance, and Treatment Response Prediction of Bladder Cancer. Am. J. Cancer Res. 2019, 9, 1104–1117. [Google Scholar]
- Swensen, A.C.; He, J.; Fang, A.C.; Ye, Y.; Nicora, C.D.; Shi, T.; Liu, A.Y.; Sigdel, T.K.; Sarwal, M.M.; Qian, W.-J. A Comprehensive Urine Proteome Database Generated From Patients With Various Renal Conditions and Prostate Cancer. Front. Med. 2021, 8, 548212. [Google Scholar] [CrossRef]
- Pisitkun, T.; Johnstone, R.; Knepper, M.A. Discovery of Urinary Biomarkers. Mol. Cell. Proteom. 2006, 5, 1760–1771. [Google Scholar] [CrossRef]
- Herranz, R.; Oto, J.; Plana, E.; Fernández-Pardo, Á.; Cana, F.; Martínez-Sarmiento, M.; Vera-Donoso, C.D.; España, F.; Medina, P. Circulating Cell-Free DNA in Liquid Biopsies as Potential Biomarker for Bladder Cancer: A Systematic Review. Cancers 2021, 13, 1448. [Google Scholar] [CrossRef]
- Ren, S.; Ren, X.-D.; Guo, L.-F.; Qu, X.-M.; Shang, M.-Y.; Dai, X.-T.; Huang, Q. Urine Cell-Free DNA as a Promising Biomarker for Early Detection of Non-Small Cell Lung Cancer. J. Clin. Lab. Anal. 2020, 34, e23321. [Google Scholar] [CrossRef]
- Bazzell, B.G.; Rainey, W.E.; Auchus, R.J.; Zocco, D.; Bruttini, M.; Hummel, S.L.; Byrd, J.B. Human Urinary MRNA as a Biomarker of Cardiovascular Disease. Circ. Genomic Precis. Med. 2018, 11, e002213. [Google Scholar] [CrossRef]
- Urquidi, V.; Netherton, M.; Gomes-Giacoia, E.; Serie, D.; Eckel-Passow, J.; Rosser, C.J.; Goodison, S. Urinary MRNA Biomarker Panel for the Detection of Urothelial Carcinoma. Oncotarget 2016, 7, 38731–38740. [Google Scholar] [CrossRef] [PubMed]
- Iwasaki, H.; Shimura, T.; Kitagawa, M.; Yamada, T.; Nishigaki, R.; Fukusada, S.; Okuda, Y.; Katano, T.; Horike, S.; Kataoka, H. A Novel Urinary MiRNA Biomarker for Early Detection of Colorectal Cancer. Cancers 2022, 14, 461. [Google Scholar] [CrossRef] [PubMed]
- van de Vrie, M.; Deegens, J.K.; Eikmans, M.; van der Vlag, J.; Hilbrands, L.B. Urinary MicroRNA as Biomarker in Renal Transplantation. Am. J. Transplant. 2017, 17, 1160–1166. [Google Scholar] [CrossRef] [PubMed]
- De Matteis, S.; Bonafè, M.; Giudetti, A.M. Urinary Metabolic Biomarkers in Cancer Patients: An Overview. Methods Mol. Biol. 2021, 2292, 203–212. [Google Scholar] [CrossRef]
- Wang, R.; Kang, H.; Zhang, X.; Nie, Q.; Wang, H.; Wang, C.; Zhou, S. Urinary Metabolomics for Discovering Metabolic Biomarkers of Bladder Cancer by UPLC-MS. BMC Cancer 2022, 22, 214. [Google Scholar] [CrossRef] [PubMed]
- Fliser, D.; Novak, J.; Thongboonkerd, V.; Argilés, A.G.A.; Jankowski, V.; Girolami, M.A.; Jankowski, J.; Mischak, H. Advances in Urinary Proteome Analysis and Biomarker Discovery. J. Am. Soc. Nephrol. 2007, 18, 1057. [Google Scholar] [CrossRef]
- FDA-NIH Biomarker Working Group. BEST (Biomarkers, EndpointS, and Other Tools) Resource; Food and Drug Administration: Silver Spring, MD, USA, 2016.
- Kourou, K.; Exarchos, T.P.; Exarchos, K.P.; Karamouzis, M.V.; Fotiadis, D.I. Machine Learning Applications in Cancer Prognosis and Prediction. Comput. Struct. Biotechnol. J. 2015, 13, 8–17. [Google Scholar] [CrossRef]
- Gaidai, O.; Yan, P.; Xing, Y. Future World Cancer Death Rate Prediction. Sci. Rep. 2023, 13, 303. [Google Scholar] [CrossRef]
- Weir, H.K. Cancer Incidence Projections in the United States Between 2015 and 2050. Prev. Chronic. Dis. 2021, 18, E59. [Google Scholar] [CrossRef]
- Gasparri, R.; Sedda, G.; Caminiti, V.; Maisonneuve, P.; Prisciandaro, E.; Spaggiari, L. Urinary Biomarkers for Early Diagnosis of Lung Cancer. J. Clin. Med. 2021, 10, 1723. [Google Scholar] [CrossRef]
- Haznadar, M.; Cai, Q.; Krausz, K.W.; Bowman, E.D.; Margono, E.; Noro, R.; Thompson, M.D.; Mathé, E.A.; Munro, H.M.; Steinwandel, M.D.; et al. Urinary Metabolite Risk Biomarkers of Lung Cancer: A Prospective Cohort Study. Cancer Epidemiol. Biomark. Prev. 2016, 25, 978–986. [Google Scholar] [CrossRef]
- Carrola, J.; Rocha, C.M.; Barros, A.S.; Gil, A.M.; Goodfellow, B.J.; Carreira, I.M.; Bernardo, J.; Gomes, A.; Sousa, V.; Carvalho, L.; et al. Metabolic Signatures of Lung Cancer in Biofluids: NMR-Based Metabonomics of Urine. J. Proteome Res. 2011, 10, 221–230. [Google Scholar] [CrossRef] [PubMed]
- Silva, C.L.; Passos, M.; Câmara, J.S. Investigation of Urinary Volatile Organic Metabolites as Potential Cancer Biomarkers by Solid-Phase Microextraction in Combination with Gas Chromatography-Mass Spectrometry. Br. J. Cancer 2011, 105, 1894–1904. [Google Scholar] [CrossRef] [PubMed]
- Zahran, F.; Rashed, R.; Omran, M.; Darwish, H.; Belal, A. Study on Urinary Candidate Metabolome for the Early Detection of Breast Cancer. Indian J. Clin. Biochem. 2021, 36, 319–329. [Google Scholar] [CrossRef] [PubMed]
- Silva, C.L.; Olival, A.; Perestrelo, R.; Silva, P.; Tomás, H.; Câmara, J.S. Untargeted Urinary 1H NMR-Based Metabolomic Pattern as a Potential Platform in Breast Cancer Detection. Metabolites 2019, 9, 269. [Google Scholar] [CrossRef]
- Wittmann, B.M.; Stirdivant, S.M.; Mitchell, M.W.; Wulff, J.E.; McDunn, J.E.; Li, Z.; Dennis-Barrie, A.; Neri, B.P.; Milburn, M.V.; Lotan, Y.; et al. Bladder Cancer Biomarker Discovery Using Global Metabolomic Profiling of Urine. PLoS ONE 2014, 9, e115870. [Google Scholar] [CrossRef]
- Fujita, K.; Nonomura, N. Urinary Biomarkers of Prostate Cancer. Int. J. Urol. Off. J. Jpn. Urol. Assoc. 2018, 25, 770–779. [Google Scholar] [CrossRef]
- Yang, B.; Zhang, C.; Cheng, S.; Li, G.; Griebel, J.; Neuhaus, J. Novel Metabolic Signatures of Prostate Cancer Revealed by 1H-NMR Metabolomics of Urine. Diagnostics 2021, 11, 149. [Google Scholar] [CrossRef]
- Kdadra, M.; Höckner, S.; Leung, H.; Kremer, W.; Schiffer, E. Metabolomics Biomarkers of Prostate Cancer: A Systematic Review. Diagnostics 2019, 9, 21. [Google Scholar] [CrossRef]
- Khalid, T.; Aggio, R.; White, P.; De Lacy Costello, B.; Persad, R.; Al-Kateb, H.; Jones, P.; Probert, C.S.; Ratcliffe, N. Urinary Volatile Organic Compounds for the Detection of Prostate Cancer. PLoS ONE 2015, 10, e0143283. [Google Scholar] [CrossRef]
- Kwon, H.N.; Lee, H.; Park, J.W.; Kim, Y.-H.; Park, S.; Kim, J.J. Screening for Early Gastric Cancer Using a Noninvasive Urine Metabolomics Approach. Cancers 2020, 12, 2904. [Google Scholar] [CrossRef] [PubMed]
- Li, D.; Yan, L.; Lin, F.; Yuan, X.; Yang, X.; Yang, X.; Wei, L.; Yang, Y.; Lu, Y. Urinary Biomarkers for the Noninvasive Detection of Gastric Cancer. J. Gastric Cancer 2022, 22, 306–318. [Google Scholar] [CrossRef] [PubMed]
- Deng, L.; Ismond, K.P.; Liu, Z.; Constable, J.; Wang, H.; Alatise, O.I.; Weiser, M.R.; Kingham, T.P.; Chang, D. Urinary Metabolomics to Identify a Unique Biomarker Panel for Detecting Colorectal Cancer: A Multicentre Study. Cancer Epidemiol. Biomark. Prev. 2019, 28, 1283–1291. [Google Scholar] [CrossRef] [PubMed]
- Hipperson, L.; Hadden, W.J.; Nahm, C.B.; Gill, A.J.; Samra, J.S.; Dona, A.; Mittal, A.; Sahni, S. Urinary Metabolite Prognostic Biomarker Panel for Pancreatic Ductal Adenocarcinomas. Biochim. Biophys. Acta Gen. Subj. 2021, 1865, 129966. [Google Scholar] [CrossRef]
- Cartlidge, C.R.; Abellona U, M.R.; Alkhatib, A.M.A.; Taylor-Robinson, S.D. The Utility of Biomarkers in Hepatocellular Carcinoma: Review of Urine-Based 1H-NMR Studies–What the Clinician Needs to Know. Int. J. Gen. Med. 2017, 10, 431–442. [Google Scholar] [CrossRef]
- Guan, M.-C.; Ouyang, W.; Wang, M.-D.; Liang, L.; Li, N.; Fu, T.-T.; Shen, F.; Lau, W.-Y.; Xu, Q.-R.; Huang, D.-S.; et al. Biomarkers for Hepatocellular Carcinoma Based on Body Fluids and Feces. World J. Gastrointest. Oncol. 2021, 13, 351–365. [Google Scholar] [CrossRef]
- Shin, W.; Park, S.-Y.; Kang, S.; Lim, M.C.; Seo, S.-S. How to Manage Synchronous Endometrial and Ovarian Cancer Patients? BMC Cancer 2021, 21, 489. [Google Scholar] [CrossRef]
- Shao, X.; Wang, K.; Liu, X.; Gu, C.; Zhang, P.; Xie, J.; Liu, W.; Sun, L.; Chen, T.; Li, Y. Screening and Verifying Endometrial Carcinoma Diagnostic Biomarkers Based on a Urine Metabolomic Profiling Study Using UPLC-Q-TOF/MS. Clin. Chim. Acta 2016, 463, 200–206. [Google Scholar] [CrossRef]
- Njoku, K.; Chiasserini, D.; Jones, E.R.; Barr, C.E.; O’Flynn, H.; Whetton, A.D.; Crosbie, E.J. Urinary Biomarkers and Their Potential for the Non-Invasive Detection of Endometrial Cancer. Front. Oncol. 2020, 10, 559016. [Google Scholar] [CrossRef]
- Dinges, S.S.; Hohm, A.; Vandergrift, L.A.; Nowak, J.; Habbel, P.; Kaltashov, I.A.; Cheng, L.L. Cancer Metabolomic Markers in Urine: Evidence, Techniques and Recommendations. Nat. Rev. Urol. 2019, 16, 339–362. [Google Scholar] [CrossRef]
- Lu, J.-Y.; You, B.; Wang, J.-Y.; Jhuo, S.-S.; Hung, T.-Y.; Yu, C.-P. Volatile Gas Sensing through Terahertz Pipe Waveguide. Sensors 2020, 20, 6268. [Google Scholar] [CrossRef] [PubMed]
- Dey, I.; Jana, K.; Fedorov, V.Y.; Koulouklidis, A.D.; Mondal, A.; Shaikh, M.; Sarkar, D.; Lad, A.D.; Tzortzakis, S.; Couairon, A.; et al. Highly Efficient Broadband Terahertz Generation from Ultrashort Laser Filamentation in Liquids. Nat. Commun. 2017, 8, 1184. [Google Scholar] [CrossRef] [PubMed]
- Wang, F.; Sun, X.; Zan, J.; Li, M.; Liu, Y.; Chen, J. Terahertz Spectra and Weak Intermolecular Interactions of Nucleosides or Nucleoside Drugs. Spectrochim. Acta. A Mol. Biomol. Spectrosc. 2022, 265, 120344. [Google Scholar] [CrossRef] [PubMed]
- Liu, Y.; Zhou, T.; Cao, J.-C. Terahertz Spectral of Enantiomers and Racemic Amino Acids by Time-Domain-Spectroscopy Technology. Infrared Phys. Technol. 2019, 96, 17–21. [Google Scholar] [CrossRef]
- Wang, H.; Shi, W.; Hou, L.; Wang, Z.; Wu, M.; Li, C.; Li, C. Effect of THz Spectra of L-Arginine Molecules by the Combination of Water Molecules. iScience 2022, 25, 103788. [Google Scholar] [CrossRef]
- Korter, T.M.; Balu, R.; Campbell, M.B.; Beard, M.C.; Gregurick, S.K.; Heilweil, E.J. Terahertz Spectroscopy of Solid Serine and Cysteine. Chem. Phys. Lett. 2006, 418, 65–70. [Google Scholar] [CrossRef]
- Huang, H.; Shao, S.; Wang, G.; Ye, P.; Su, B.; Zhang, C. Terahertz Spectral Properties of Glucose and Two Disaccharides in Solid and Liquid States. iScience 2022, 25, 104102. [Google Scholar] [CrossRef]
- Ye, P.; Wang, G.; Yang, Y.; Meng, Q.; Wang, J.; Su, B.; Zhang, C. Terahertz Absorption Properties of Two Solid Amino Acids and Their Aqueous Solutions. Int. J. Opt. 2021, 2021, e9203999. [Google Scholar] [CrossRef]
- Bian, Y.; Zhu, Z.; Zhang, X.; Zeng, R.; Yang, B. Terahertz Spectroscopy for Quantitatively Elucidating the Crystal Transformation of Chiral Histidine Enantiomers to Racemic Compounds. Food Chem. 2023, 406, 135043. [Google Scholar] [CrossRef]
- Puc, U.; Abina, A.; Jeglič, A.; Zidanšek, A.; Kašalynas, I.; Venckevičius, R.; Valušis, G. Spectroscopic Analysis of Melatonin in the Terahertz Frequency Range. Sensors 2018, 18, 4098. [Google Scholar] [CrossRef]
- Allen, J.L.; Sanders, T.J.; Plathe, R.; Appadoo, D.; Horvat, J.; Lewis, R.A. Temperature-Dependent Terahertz Spectroscopy of l-Phenylalanine. Spectrochim. Acta. A Mol. Biomol. Spectrosc. 2021, 260, 119922. [Google Scholar] [CrossRef] [PubMed]
- Chen, T.; Zhang, Q.; Li, Z.; Hu, F. Intermolecular Weak Interactions of Crystalline Purine and Uric Acid Investigated by Terahertz Spectroscopy and Theoretical Calculation. J. Lumin. 2020, 223, 117198. [Google Scholar] [CrossRef]
- King, M.D.; Hakey, P.M.; Korter, T.M. Discrimination of Chiral Solids: A Terahertz Spectroscopic Investigation of l- and Dl-Serine. Available online: https://pubs.acs.org/doi/epdf/10.1021/jp911863v (accessed on 27 July 2023).
- Dai, Z.; Xu, X.; Gu, Y.; Li, X.; Wang, F.; Lian, Y.; Fan, K.; Cheng, X.; Chen, Z.; Sun, M.; et al. A Terahertz Study of Taurine: Dispersion Correction and Mode Couplings. J. Chem. Phys. 2017, 146, 124119. [Google Scholar] [CrossRef] [PubMed]
- Yu, B.; Zeng, F.; Yang, Y.; Xing, Q.; Chechin, A.; Xin, X.; Zeylikovich, I.; Alfano, R.R. Torsional Vibrational Modes of Tryptophan Studied by Terahertz Time-Domain Spectroscopy. Biophys. J. 2004, 86, 1649–1654. [Google Scholar] [CrossRef] [PubMed]
- Hu, M.; Tang, M.; Wang, H.; Zhang, M.; Zhu, S.; Yang, Z.; Zhou, S.; Zhang, H.; Hu, J.; Guo, Y.; et al. Terahertz, Infrared and Raman Absorption Spectra of Tyrosine Enantiomers and Racemic Compound. Spectrochim. Acta. A Mol. Biomol. Spectrosc. 2021, 254, 119611. [Google Scholar] [CrossRef] [PubMed]
- Zhao, Y.; Li, Z.; Liu, J.; Hu, C.; Zhang, H.; Qin, B.; Wu, Y. Intermolecular Vibrational Modes and H-Bond Interactions in Crystalline Urea Investigated by Terahertz Spectroscopy and Theoretical Calculation. Spectrochim. Acta. A Mol. Biomol. Spectrosc. 2018, 189, 528–534. [Google Scholar] [CrossRef]
- Aitekenov, S.; Gaipov, A.; Bukasov, R. Review: Detection and Quantification of Proteins in Human Urine. Talanta 2021, 223, 121718. [Google Scholar] [CrossRef]
- Laíns, I.; Duarte, D.; Barros, A.S.; Martins, A.S.; Carneiro, T.J.; Gil, J.Q.; Miller, J.B.; Marques, M.; Mesquita, T.S.; Barreto, P.; et al. Urine Nuclear Magnetic Resonance (NMR) Metabolomics in Age-Related Macular Degeneration. J. Proteome Res. 2019, 18, 1278–1288. [Google Scholar] [CrossRef]
- Ramirez, C.A.M.; Stringfellow, H.; Naik, R.; Crosbie, E.J.; Paraskevaidi, M.; Rehman, I.U.; Martin-Hirsch, P. Infrared Spectroscopy of Urine for the Non-Invasive Detection of Endometrial Cancer. Cancers 2022, 14, 5015. [Google Scholar] [CrossRef]
- Finlayson, D.; Rinaldi, C.; Baker, M.J. Is Infrared Spectroscopy Ready for the Clinic? Anal. Chem. 2019, 91, 12117–12128. [Google Scholar] [CrossRef]
- Yu, M.-C.; Rich, P.; Foreman, L.; Smith, J.; Yu, M.-S.; Tanna, A.; Dibbur, V.; Unwin, R.; Tam, F.W.K. Label Free Detection of Sensitive Mid-Infrared Biomarkers of Glomerulonephritis in Urine Using Fourier Transform Infrared Spectroscopy. Sci. Rep. 2017, 7, 4601. [Google Scholar] [CrossRef] [PubMed]
- Weisenstein, C.; Wigger, A.K.; Richter, M.; Sczech, R.; Bosserhoff, A.K.; Bolívar, P.H. THz Detection of Biomolecules in Aqueous Environments—Status and Perspectives for Analysis Under Physiological Conditions and Clinical Use. J. Infrared Millim. Terahertz Waves 2021, 42, 607–646. [Google Scholar] [CrossRef]
- Lin, S.; Chen, J.; Liu, W.; Peng, Z.; Chen, Z.; Hu, F. Detection of Biomarkers Using Terahertz Metasurface Sensors and Machine Learning. Appl. Opt. 2023, 62, 1027–1034. [Google Scholar] [CrossRef] [PubMed]
- Abina, A.; Korošec, T.; Puc, U.; Zidanšek, A. Review of Bioplastics Characterisation by Terahertz Techniques in the View of Ensuring a Circular Economy. Photonics 2023, 10, 883. [Google Scholar] [CrossRef]
- Smith, P.R.; Auston, D.H.; Nuss, M.C. Subpicosecond Photoconducting Dipole Antennas. IEEE J. Quantum Electron. 1988, 24, 255–260. [Google Scholar] [CrossRef]
- Fattinger, C.; Grischkowsky, D.R. A Cherenkov Source for Freely-Propagating Terahertz Beams. IEEE J. Quantum Electron. 1989, 25, 2608–2610. [Google Scholar] [CrossRef]
- Grischkowsky, D.; Keiding, S.; van Exter, M.; Fattinger, C. Far-Infrared Time-Domain Spectroscopy with Terahertz Beams of Dielectrics and Semiconductors. JOSA B 1990, 7, 2006–2015. [Google Scholar] [CrossRef]
- Puc, U.; Bach, T.; Günter, P.; Zgonik, M.; Jazbinsek, M. Ultra-Broadband and High-Dynamic-Range THz Time-Domain Spectroscopy System Based on Organic Crystal Emitter and Detector in Transmission and Reflection Geometry. Adv. Photonics Res. 2021, 2, 2000098. [Google Scholar] [CrossRef]
- Hu, B.B.; Nuss, M.C. Imaging with Terahertz Waves. Opt. Lett. 1995, 20, 1716–1718. [Google Scholar] [CrossRef]
- Pickwell, E.; Wallace, V.P. Biomedical Applications of Terahertz Technology. J. Phys. Appl. Phys. 2006, 39, R301. [Google Scholar] [CrossRef]
- Humphreys, K.; Loughran, J.P.; Gradziel, M.; Lanigan, W.; Ward, T.; Murphy, J.A.; O’Sullivan, C. Medical Applications of Terahertz Imaging: A Review of Current Technology and Potential Applications in Biomedical Engineering. In Proceedings of the 26th Annual International Conference of the IEEE Engineering in Medicine and Biology Society, San Francisco, CA, USA, 1–5 September 2004; Volume 1, pp. 1302–1305. [Google Scholar]
- Menikh, A.; MacColl, R.; Mannella, C.A.; Zhang, X.-C. Terahertz Biosensing Technology: Frontiers and Progress. ChemPhysChem 2002, 3, 655–658. [Google Scholar] [CrossRef] [PubMed]
- Berry, E.; Fitzgerald, A.J.; Zinov’ev, N.N.; Walker, G.C.; Homer-Vanniasinkam, S.; Sudworth, C.D.; Miles, R.E.; Chamberlain, J.M.; Smith, M.A. Optical Properties of Tissue Measured Using Terahertz-Pulsed Imaging. In Proceedings of the Medical Imaging 2003: Physics of Medical Imaging, San Diego, CA, USA, 15–20 February 2003; Volume 5030, pp. 459–470. [Google Scholar]
- Jazbinsek, M.; Puc, U.; Abina, A.; Zidansek, A. Organic Crystals for THz Photonics. Appl. Sci. 2019, 9, 882. [Google Scholar] [CrossRef]
- Lewis, R.A. Terahertz Imaging and Spectroscopy Methods and Instrumentation. In Encyclopedia of Spectroscopy and Spectrometry, 3rd ed.; Lindon, J.C., Tranter, G.E., Koppenaal, D.W., Eds.; Academic Press: Oxford, UK, 2017; pp. 422–426. ISBN 978-0-12-803224-4. [Google Scholar]
- Neu, J.; Schmuttenmaer, C.A. Tutorial: An Introduction to Terahertz Time Domain Spectroscopy (THz-TDS). J. Appl. Phys. 2018, 124, 231101. [Google Scholar] [CrossRef]
- Morais, C.L.M.; Lima, K.M.G.; Singh, M.; Martin, F.L. Tutorial: Multivariate Classification for Vibrational Spectroscopy in Biological Samples. Nat. Protoc. 2020, 15, 2143–2162. [Google Scholar] [CrossRef] [PubMed]
- Engdahl, A. Microspectroscopic Infrared Specular Reflection Studies of Multi-Component Urinary Stones at Beamline D7 at the MAX IV Laboratory, Lund Sweden. In Proceedings of the 2015 40th International Conference on Infrared, Millimeter, and Terahertz waves (IRMMW-THz), Hong Kong, China, 23–28 August 2015; pp. 1–2. [Google Scholar]
- Robinson, S.; Dhanlaksmi, N. Photonic Crystal Based Biosensor for the Detection of Glucose Concentration in Urine. Photonic Sens. 2017, 7, 11–19. [Google Scholar] [CrossRef]
- Mazaheri, Z.; Koral, C.; Andreone, A.; Marino, A. Terahertz Time-Domain Ellipsometry: Tutorial. JOSA A 2022, 39, 1420–1433. [Google Scholar] [CrossRef]
- Ketelsen, H.; Mästle, R.; Liebermeister, L.; Kohlhaas, R.; Globisch, B. THz Time-Domain Ellipsometer for Material Characterization and Paint Quality Control with More Than 5 THz Bandwidth. Appl. Sci. 2022, 12, 3744. [Google Scholar] [CrossRef]
- Agulto, V.C.; Iwamoto, T.; Kitahara, H.; Toya, K.; Mag-usara, V.K.; Imanishi, M.; Mori, Y.; Yoshimura, M.; Nakajima, M. Terahertz Time-Domain Ellipsometry with High Precision for the Evaluation of GaN Crystals with Carrier Densities up to 1020 cm−3. Sci. Rep. 2021, 11, 18129. [Google Scholar] [CrossRef]
- Jeong, Y.U.; Jang, K.-H.; Bae, S.; Pathania, V.; Mun, J.; Lee, K. Prospects of a Terahertz Free-Electron Laser for Field Application. J. Korean Phys. Soc. 2022, 80, 367–376. [Google Scholar] [CrossRef]
- Koral, C.; Mazaheri, Z.; Papari, G.P.; Andreone, A.; Drebot, I.; Giove, D.; Masullo, M.R.; Mettivier, G.; Opromolla, M.; Paparo, D.; et al. Multi-Pass Free Electron Laser Assisted Spectral and Imaging Applications in the Terahertz/Far-IR Range Using the Future Superconducting Electron Source BriXSinO. Front. Phys. 2022, 10, 725901. [Google Scholar] [CrossRef]
- Jeong, K.; Huh, Y.-M.; Kim, S.-H.; Park, Y.; Son, J.-H.; Oh, S.J.; Suh, J.-S. Characterization of Blood Using Terahertz Waves. J. Biomed. Opt. 2013, 18, 107008. [Google Scholar] [CrossRef] [PubMed]
- Reid, C.B.; Reese, G.; Gibson, A.P.; Wallace, V.P. Terahertz Time-Domain Spectroscopy of Human Blood. IEEE J. Biomed. Health Inform. 2013, 17, 774–778. [Google Scholar] [CrossRef] [PubMed]
- Lykina, A.A.; Nazarov, M.M.; Konnikova, M.R.; Mustafin, I.A.; Vaks, V.L.; Anfertev, V.A.; Domracheva, E.G.; Chernyaeva, M.B.; Kistenev, Y.V.; Vrazhnov, D.A.; et al. Terahertz Spectroscopy of Diabetic and Non-Diabetic Human Blood Plasma Pellets. J. Biomed. Opt. 2021, 26, 043006. [Google Scholar] [CrossRef] [PubMed]
- Kistenev, Y.; Borisov, A.; Titarenko, M.; Baydik, O.; Shapovalov, A. Diagnosis of Oral Lichen Planus from Analysis of Saliva Samples Using Terahertz Time-Domain Spectroscopy and Chemometrics. J. Biomed. Opt. 2018, 23, 1–8. [Google Scholar] [CrossRef] [PubMed]
- Tabib–Azar, M. Terahertz Detection of Deoxyribonucleic Bases, Viruses and Nano Particles. In Proceedings of the 2022 IEEE Sensors, Dallas, TX, USA, 30 October–2 November 2022; pp. 1–4. [Google Scholar]
- Knyazkova, A.I.; Yunusova, N.V.; Tugutova, E.A.; Ilyasova, E.E.; Sandykova, E.A.; Zasedatel, V.S. THz Laser Spectroscopy Exosome Analysis of Saliva and Blood Plasma. In Proceedings of the International Conference on Atomic and Molecular Pulsed Lasers XIII, Tomsk, Russia, 10–15 September 2017; Volume 10614, pp. 382–387. [Google Scholar]
- Vaks, V.L.; Domracheva, E.G.; Chernyaeva, M.B.; Anfertev, V.A.; Maslennikova, A.V.; Zheleznyak, A.V.; Knyazeva, T.D.; Rodionov, M.A.; Maiorov, A.I. Application of a High-Resolution Terahertz Gas Spectroscopy Method to Compositional Analysis of Thermal Decomposition Products of Human Fluids (Urine). J. Opt. Technol. 2022, 89, 243–249. [Google Scholar] [CrossRef]
- Tripathi, S.R.; Miyata, E.; Ishai, P.B.; Kawase, K. Morphology of Human Sweat Ducts Observed by Optical Coherence Tomography and Their Frequency of Resonance in the Terahertz Frequency Region. Sci. Rep. 2015, 5, 9071. [Google Scholar] [CrossRef]
- Hashimoto, K.; Ishai, P.B.; Bründermann, E.; Tripathi, S.R. Dielectric Property Measurement of Human Sweat Using Attenuated Total Reflection Terahertz Time Domain Spectroscopy. Biomed. Opt. Express 2022, 13, 4572–4582. [Google Scholar] [CrossRef]
- Peng, Y.; Shi, C.; Zhu, Y.; Gu, M.; Zhuang, S. Terahertz Spectroscopy in Biomedical Field: A Review on Signal-to-Noise Ratio Improvement. PhotoniX 2020, 1, 12. [Google Scholar] [CrossRef]
- Bethea, M.; Forman, D.T. Beta 2-Microglobulin: Its Significance and Clinical Usefulness. Ann. Clin. Lab. Sci. 1990, 20, 163–168. [Google Scholar]
- Bolisetty, S.; Agarwal, A. Urine Albumin as a Biomarker in Acute Kidney Injury. Am. J. Physiol. Ren. Physiol. 2011, 300, F626–F627. [Google Scholar] [CrossRef]
- Yang, S.; Liu, S.; Zuo, J.; Zhang, C. Research of Biological Liquid Albumin Based on Terahertz Time Domain Spectroscopy. In Proceedings of the Infrared, Millimeter-Wave, and Terahertz Technologies IV, Beijing, China, 12–14 October 2016; Volume 10030, pp. 456–462. [Google Scholar]
- Li, T.; Ma, H.; Peng, Y.; Chen, X.; Zhu, Z.; Wu, X.; Kou, T.; Song, B.; Guo, S.; Liu, L.; et al. Gaussian Numerical Analysis and Terahertz Spectroscopic Measurement of Homocysteine. Biomed. Opt. Express 2018, 9, 5467–5476. [Google Scholar] [CrossRef] [PubMed]
- Davies, A.G. Development of a Portable Coherent THz Spectroscopy System for Medical Diagnosis. Available online: https://gow.epsrc.ukri.org/NGBOViewGrant.aspx?GrantRef=GR/N20386/01 (accessed on 20 July 2023).
- Vaks, V.L.; Domracheva, E.G.; Pripolzin, S.I.; Chernyaeva, M.B. High Resolution Terahertz Spectroscopy for Medical, Biological and Agricultural Applications. EPJ Web Conf. 2018, 195, 10014. [Google Scholar] [CrossRef]
- Vaks, V.; Anfertev, V.; Chernyaeva, M.; Domracheva, E.; Shcherbatyuk, T.G.; Zhukova, E.S. Analysis of Rodent’s Urine Vapors with Using THz High Resolution Spectrometer for Revealing the Markers of Dysbacteriosis. Int. Conf. Adv. Laser Technol. ALT 2022, 217. [Google Scholar] [CrossRef]
- Lee, K.; Jeoung, K.; Kim, S.H.; Ji, Y.; Son, H.; Choi, Y.; Huh, Y.-M.; Suh, J.-S.; Oh, S.J. Measuring Water Contents in Animal Organ Tissues Using Terahertz Spectroscopic Imaging. Biomed. Opt. Express 2018, 9, 1582–1589. [Google Scholar] [CrossRef] [PubMed]
- Globus, T.; Dorofeeva, T.; Sizov, I.; Gelmont, B.; Lvovska, M.; Khromova, T.; Chertihin, O.; Koryakina, Y. Sub-THz Vibrational Spectroscopy of Bacterial Cells and Molecular Components. Am. J. Biomed. Eng. 2012, 2, 143–154. [Google Scholar] [CrossRef]
- Yang, X.; Yang, K.; Luo, Y.; Fu, W. Terahertz Spectroscopy for Bacterial Detection: Opportunities and Challenges. Appl. Microbiol. Biotechnol. 2016, 100, 5289–5299. [Google Scholar] [CrossRef]
- Wang, J.; Peng, L.; Han, D.; Zheng, T.; Chang, T.; Cui, H.-L. Label-Free Detection and Identification of Single Bacteria via Terahertz near-Field Imaging. Front. Microbiol. 2023, 14, 1195448. [Google Scholar] [CrossRef]
- Yoon, S.A.; Cha, S.H.; Jun, S.W.; Park, S.J.; Park, J.-Y.; Lee, S.; Kim, H.S.; Ahn, Y.H. Identifying Different Types of Microorganisms with Terahertz Spectroscopy. Biomed. Opt. Express 2019, 11, 406–416. [Google Scholar] [CrossRef]
- Tych, K.M.; Burnett, A.D.; Wood, C.D.; Malham, R.W.; Li, L.; Cunningham, J.E.; Pearson, A.R.; Paci, E.; Linfield, E.H.; Davies, A.G. Terahertz Time-Domain Spectroscopy of Lysozyme and Mouse Urinary Protein Single Crystals. In Proceedings of the 2013 38th International Conference on Infrared, Millimeter, and Terahertz Waves (IRMMW-THz), Mainz, Germany, 1–6 September 2013; pp. 1–2. [Google Scholar]


| Urinary Biomarker | Compound Class | Cancer Type (HMDB) | THz Spectrum | Reference |
|---|---|---|---|---|
| Acetone | Ketones | Breast cancer Lung cancer | 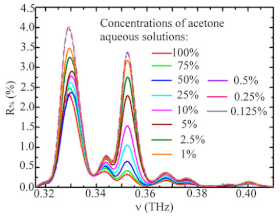 | [95] |
 * acetone (blue line) | [96] | |||
| Adenosine | Purine nucleosides | NA | 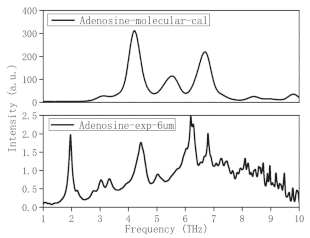 * Reprinted with permission | [97] |
| D-Alanine L-Alanine | Amino acids | Bladder cancer Lung cancer Colorectal cancer | 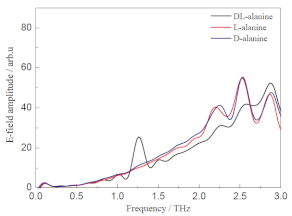 * Reprinted with permission | [98] |
| L-Arginine | Amino acids | Colorectal cancer | 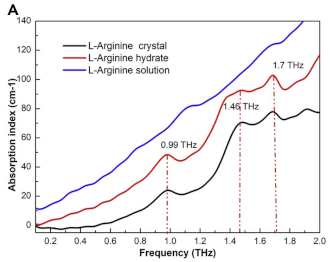 | [99] |
| L-Cysteine | Amino acids | Bladder cancer | 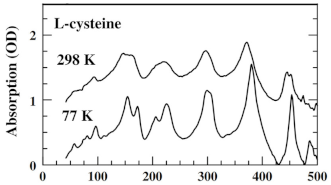 * Reprinted with permission | [100] |
| Glucose | Carbohydrates | Bladder cancer | 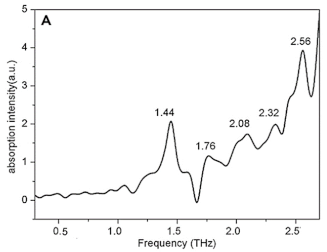 | [101] |
| Glycine | Amino acids | Bladder cancer Lung cancer |  | [102] |
| L-Histidine D-Histidine | Amino acids | Colorectal cancer |  * Reprinted with permission | [103] |
| L-Leucine | Amino acids | Bladder cancer Colorectal cancer |  * Reprinted with permission | [98] |
| Melatonin | Indoles | NA |  | [104] |
| L-Phenylalanine | Amino acids | Bladder cancer |  * Reprinted with permission | [105] |
| Purine | Purines | NA |  * Reprinted with permission | [106] |
| Serine | Amino acids | Bladder cancer Colorectal cancer |  * Reprinted with permission from [107]. Copyright 2010 American Chemical Society | [107] |
| Taurine | Organosulfonic acids | Lung cancer | 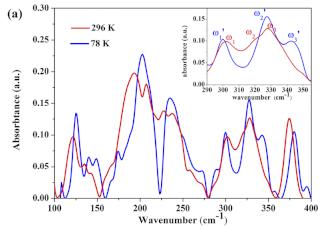 * Reprinted with permission | [108] |
| Tryptophan | Indoles and derivatives | Colorectal cancer Bladder cancer | 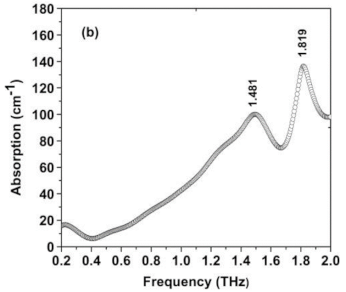 | [109] |
| L-Tyrosine | Amino acids | Colorectal cancer Bladder cancer |  * Reprinted with permission | [110] |
| Urea | Ureas | Colorectal cancer Hepatocellular carcinoma Breast cancer |  * Reprinted with permission | [111] |
| Uric acid | Purines and purine derivatives | Bladder cancer | 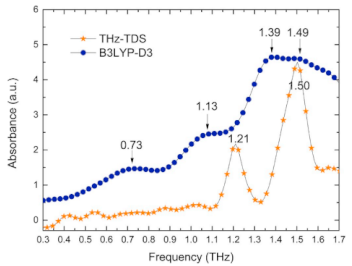 * Reprinted with permission | [106] |
| L-Valine | Amino acids | Lung cancer Colorectal cancer Bladder cancer | 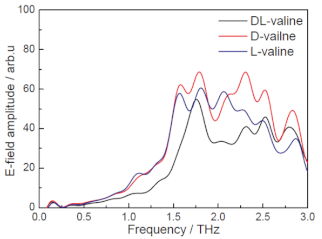 * Reprinted with permission | [98] |
| D-Valine | NA |
| Spectroscopic Technique | EM Spectrum Range | Main Advantages | Use in Biomarker Analysis |
|---|---|---|---|
| UV-Vis spectroscopy | 200 to 800 nm | fast and convenient performed directly on the sample without adding an external label provides a linear relationship between concentration and absorbance | protein, enzyme and metabolites quantification |
| IR spectroscopy | 2500 to 15,000 nm | without biomolecule labelling rapid interpretation of the data obtained, combined with the use of computers and statistical computing systems | vibrational transitions in molecules intra- and intermolecular interactions/bonds presence of specific functional groups in molecules |
| NMR spectroscopy | 0 to 1000 MHz (depending on the nuclei being analyzed) | reusability of samples, high reproducibility and minimal sample preparation requirements | identify chemical composition and changes in the structure of urinary biomarkers multidimensional metabolic profiling of cells, tissues, and biological fluids |
| Fluorescence spectroscopy | 300 to 800 nm (depending on the used fluorophores) | high sensitivity and selectivity (using specific fluorescent probes or markers) | detect and quantify biomarkers like antibodies, antigens, or specific proteins detect changes in the biomolecule structure |
| THz Method | Main Advantages | Usability in Urinary Biomarkers Analysis |
|---|---|---|
| ATR-FTIR spectroscopy | unlabeled, rapid, non-destructive and relatively inexpensive analysis portable device without extensive sample preparation better sensitivity, particularly for samples with low absorbance or small quantities | identify biomolecules detect changes in the biomolecule structure identify chemical bonds and functional groups |
| THz-TDS spectroscopy | simultaneous measurement of the amplitude and phase of the THz field absorption coefficient and refractive index calculations without Kramers–Kronig relations | sample thickness molecular structure, including the presence of functional groups, degree of crystallinity, molecule conformation, intramolecular and intermolecular dynamics 2D and 3D imaging of materials spectroscopic imaging |
| THz-ATR spectroscopy | more sensitive in measuring highly absorbing biological samples | analysing highly absorptive or scattering samples and samples with limited thickness |
| FIR microspectroscopy | complementary technique to other analytical methods simultaneous information on composition and morphology analysis of rough samples | molecular composition and properties of materials analyse metabolic fingerprints or profiles of biological samples chemical imaging of heterogeneous samples |
| Photonic crystals-based biosensor | high sensitivity to changes in the surrounding refractive index or the presence of specific molecules highly selective, target and detect particular analytes or biomolecules of interest in complex samples operate with very small sample volumes can be integrated into lab-on-a-chip devices and microfluidic systems | detect changes in refractive index on their surfaces concentration measurement real-time monitoring of binding events miniaturization |
| Non-stationary THz high-resolution spectrometer | real-time measurements easy-to-obtain samples unique identification of a wide range of detectable compounds suitability for any patient regardless of their state without cryocooling in the low THz range | analysis of gases and vapours of liquids after evaporation or thermal decomposition |
| THz-TDSE | applicable to highly absorbing materials such as aqueous samples no reference measurements | study the complex optical properties and thicknesses of thin films |
| FEL-based THz system | powerful sources coherent emission of radiation that is tunable, powerful and ultra-short radiation in the 1 to 30 THz frequency range high spatial resolution and penetration depth for imaging high spectral resolution and sensitivity for identifying molecular signatures label-free and non-invasive analysis | dynamic and functional imaging of biological processes |
Disclaimer/Publisher’s Note: The statements, opinions and data contained in all publications are solely those of the individual author(s) and contributor(s) and not of MDPI and/or the editor(s). MDPI and/or the editor(s) disclaim responsibility for any injury to people or property resulting from any ideas, methods, instructions or products referred to in the content. |
© 2023 by the authors. Licensee MDPI, Basel, Switzerland. This article is an open access article distributed under the terms and conditions of the Creative Commons Attribution (CC BY) license (https://creativecommons.org/licenses/by/4.0/).
Share and Cite
Abina, A.; Korošec, T.; Puc, U.; Jazbinšek, M.; Zidanšek, A. Urinary Metabolic Biomarker Profiling for Cancer Diagnosis by Terahertz Spectroscopy: Review and Perspective. Photonics 2023, 10, 1051. https://doi.org/10.3390/photonics10091051
Abina A, Korošec T, Puc U, Jazbinšek M, Zidanšek A. Urinary Metabolic Biomarker Profiling for Cancer Diagnosis by Terahertz Spectroscopy: Review and Perspective. Photonics. 2023; 10(9):1051. https://doi.org/10.3390/photonics10091051
Chicago/Turabian StyleAbina, Andreja, Tjaša Korošec, Uroš Puc, Mojca Jazbinšek, and Aleksander Zidanšek. 2023. "Urinary Metabolic Biomarker Profiling for Cancer Diagnosis by Terahertz Spectroscopy: Review and Perspective" Photonics 10, no. 9: 1051. https://doi.org/10.3390/photonics10091051
APA StyleAbina, A., Korošec, T., Puc, U., Jazbinšek, M., & Zidanšek, A. (2023). Urinary Metabolic Biomarker Profiling for Cancer Diagnosis by Terahertz Spectroscopy: Review and Perspective. Photonics, 10(9), 1051. https://doi.org/10.3390/photonics10091051


