Abstract
Acoustic emission (AE) testing is a widely used nondestructive testing method for the early detection of failures in materials and structures. In this paper, an AE detection sensor combining optical fiber sensing with laser self-mixing interference (SMI) technology is proposed. A multi-coil optical fiber ring wound round a cylindrical acrylic skeleton was designed in order to sense the deformation caused by AE elastic waves, which was then demodulated using self-mixing interference technology. Finite element analyses were conducted in order to investigate the deformation of fiber under acoustic sources. AE signals induced via ball-dropping impact experiments were successfully detected by the proposed experimental system. The proposed SMI optical fiber AE sensing system has the advantages of being free from electromagnetic interference and having a simple structure, low implementation cost and high measurement resolution and sensitivity.
1. Introduction
The phenomenon of transient elastic wave generation, caused by local energy release from the deformation and cracking of materials under stress, is called acoustic emission (AE) and is an important mechanism of structural failure. AE nondestructive testing is a well-known technique for detecting elastic waves generated by structural defects and can carry out continuous structural monitoring during the service life of infrastructure [1]. Since it was proposed for the first time, AE testing technology has been widely used in the detection of structural integrity in aerospace, machinery manufacturing and other fields [2].
The most common and mature AE detection sensor is a piezoelectric sensor [3]. Optical fiber sensors are new types of AE sensors that have appeared in recent years. Optical fiber sensors are usually preferred for harsh environments as they are free from electromagnetic interference, have the ability to be embedded in a material without changing its material properties, and easily form a sensor network, although piezoelectric sensors can be also used in some special treatments, e.g., enclosing the piezoelectric crystals in a ceramic casing or using waveguides together with piezoelectric sensors [4,5,6]. Common optical fiber AE sensors include fiber Bragg grating (FBG) sensor, fiber Fabry–Perot cavity acoustic emission sensor, and so on [7]. These sensors face some challenges in AE detection. For example, the main principle of an FBG sensor is to detect the Bragg wavelength shift caused by AE. However, AE signal generally has a small energy and a high frequency, and so complex signal processing algorithms or sophisticated wavelength detection instruments are needed to detect Bragg wavelength shift. Conversely, optical fiber Fabry–Perot cavity acoustic emission sensors are usually difficult to produce and expensive [8].
In 2018, a fiber ring sensor for AE measurement was developed and demonstrated with high sensitivity, although it did need complex demodulation processing to demodulate AE signals [8]. At the same time, self-mixing interference (SMI) has been demonstrated as a newly emerging technology for sensing acoustic waves [9,10,11]. In particular, we have used SMI for AE measurement, showing a wide frequency band that meets the requirements of AE detection. However, the sensitivity must still be improved [12]. SMI is an emerging nondestructive sensing technology and is often used to measure various physical parameters such as distance, displacement and velocity [13,14,15,16]. When the external conditions lead the change of the phase of the feedback light, the output light intensity of the laser will exhibit interference fringes similar to the Michelson interference, and so such a structure is often called self-mixing interferometer [17,18,19,20]. In a self-mixing interferometer, the mixing interference takes place inside the laser internal cavity. Once interference happens, the interference signals can be obtained from anywhere along the optical path as the entire optical field becomes a unified field. In addition, a low-cost commercial laser diode (LD) is often used as a light source, and a photodiode (PD) is enclosed inside the LD that can be used to detect SMI signals [21]. Therefore, in a self-mixing interferometric system, the low-cost LD acts as a light source, sensing element and detection device. As a result, this configuration shows the merits of simple structure, low implementation cost, and high measurement resolution [22,23,24]. However, in SMI-based measurements, one challenge is determining how to efficiently obtain feedback light carrying information of external objects back into the laser cavity and the other is establishing how to improve the measurement sensitivity [25].
In this work, combining optical fiber sensing and SMI technologies, we designed an all-fiber SMI-based sensor for use in AE detection. The low propagation loss of optical fiber with the fiber end coated by reflective film ensures that enough feedback light reenters the laser intra-cavity. On top of that, a multi-coil optical fiber ring wound on a cylindrical acrylic skeleton was designed as a probe to sense the AE signals with the aim of further improving the AE detection sensitivity. The SMI technology is used to demodulate the AE signals. The designed AE sensor integrates the advantages of the fiber ring and SMI technology, forming an effective AE measurement solution with a simple structure, high sensitivity, easy demodulation processing and low implementation cost. The remaining part of this paper is organized as follows. First, the measurement principle is introduced. Then, finite element analysis simulation on the fiber ring probe is presented. After that, experiments to detect AE signals induced by ball-dropping are presented to show the feasibility of the proposed sensing system. Finally, the whole work is summarized.
2. Measurement Principle
The schematic diagram of the proposed system is shown in Figure 1. An LD with pigtail fiber is used as the laser source. The sensing element is a multi-coil optical fiber ring wound on a cylindrical acrylic skeleton, which acts as a probe. When an AE event is generated, the AE wave propagates to the cylinder with a complex wave of various forms, causing the deformation of the optical fiber ring wrapped around it and then causing a change of optical phase. Through the self-mixing effect, the LD output light intensity changes. The AE signal can be measured by measuring the change of light intensity, i.e., the SMI signals. The SMI signals are detected by the PD integrated inside the LD.
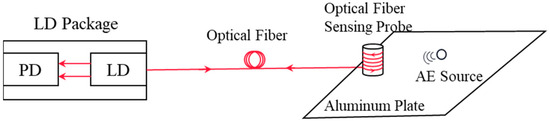
Figure 1.
Schematic diagram of the designed SMI coiled optical fiber sensor. LD: laser diode, PD: photodiode, AE: acoustic emission.
The variation of the optical phase in this case can be expressed as follows [12]:
where is the effective refractive index of the optical fiber without deformation, is laser wavelength without optical feedback, is the effective photo-elastic constant where is the Poisson’s ratio, and and , are Pockel’s strain-optic tensor coefficients. is the deformation of the sensing fiber. When an AE event occurs, deformation will be induced to the optical fiber, and a variation of optical phase is then generated. When the fiber coil and the skeleton are designed, all parameters in Equation (1) are fixed, except for the AE-induced deformation of fiber . Herein, the optical phase variation is directly proportional to . Once we obtain , the AE-induced strain is detected with the expression as , where is the length of the sensing fiber.
SMI is a coherent detection scheme that depends on the self-mixing effect, i.e., when the emitting laser meets the external object that is to be measured, a part of the laser carrying information of the external object returns to the laser cavity along the original path and mixes with the laser inside the cavity, thus inducing an optical phase change and modulating the laser power [26]. The optical phase change is then able to be demodulated from the laser intensity variation. The mathematical model of an SMI system is as follows [27]:
In Equation (2), C is the defined optical feedback coefficient [28]
where , are the amplitude reflection coefficients of the LD-emitting facet and external target respectively; τin is the laser internal-cavity round trip time; and τ is the light external round trip time between the LD-emitting facet and external target. η is the coupling efficiency, and α is the line width enhancement factor. The optical feedback coefficient C is an important parameter that determines the working state of the system and the waveform of the interference signal [29,30]. In Equation (2), and are the external optical phases with and without feedback, respectively. When an AE wave propagates to the skeleton with fiber, the fiber will have a deformation or strain and the optical phase will vary according to Equation (1). Equation (3) is called the interference function. In Equation (4), I(t) is the laser intensity; I0 is the laser intensity without the perturbation of optical feedback; and m is the modulation index (typical value is about 10−3). The usual physical quantity to be measured is contained in , and the output light intensity signal I(t) is directly measured in our experiment. AE signal information is also contained in the variation part of , denoted by . By extracting , the AE-induced strain information can be retrieved, and then the integrity of the measured structure and material and the pathological condition can be used in dynamic nondestructive testing.
In SMI sensing schemes, optical feedback coefficient C affects the waveform of an SMI signal and the stability of an SMI system [31,32]. Figure 2 shows the simulated SMI signals with different optical feedback coefficients. It can be seen that the SMI signal is in a linear relationship with the optical phase variation when C is properly set, as shown in Figure 2d, where the SMI signal replicates the shape of the optical phase variation . In this study, we use the state of Figure 2d to demodulate the AE signal as the SMI is directly proportional to the AE signal in this case without requiring further signal processing. For the details of controlling the SMI system operating in this state, researchers can refer to our previous work [12]. When the SMI system operates in this state, the variation part of the laser intensity or SMI signal can be expressed as:
where is related to , , and . In this case, the AE-induced strain is directly proportional to the laser intensity variation, and it can be obtained after calibration is.
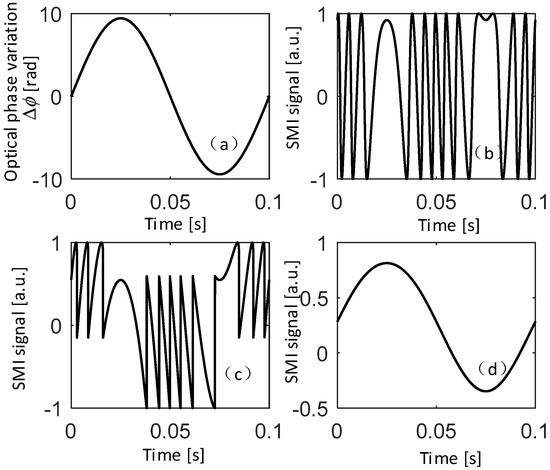
Figure 2.
Simulated SMI signals with different optical feedback coefficients, (a) the optical phase variation, (b–d) the corresponding SMI signals with C = 0.5, C = 3, and C = 25 respectively.
3. Finite Element Analysis
In order to analyze the optical phase variation sensitivity induced by AE signals, we designed a finite element analysis model, as shown in Figure 3. We simulated the strain information on the common straight fiber and coiled fiber wound on the skeleton induced by the same AE source. Figure 3a is for a piece of common straight fiber and Figure 3b is for the coiled fiber wound on a skeleton. In Figure 3b, the skeleton is an acrylic cylinder that is glued to an aluminum plate. A sound source is set on the aluminum plate about 2.0 cm away from both the straight fiber and coiled fiber. When sound waves reach the interface between the AE sensor skeleton and the aluminum plate, waveform conversion, reflection and refraction occur. A portion of the waves goes into the skeleton and the other part stays on the aluminum plate. AE waves entering the skeleton undergo waveform transformation, reflection, and repeated refraction.
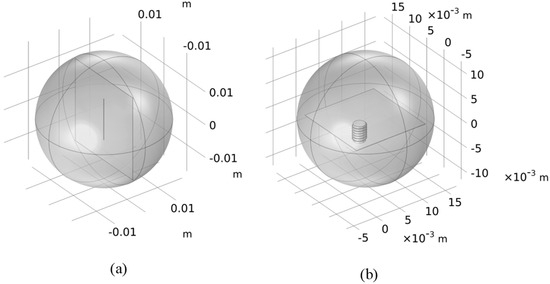
Figure 3.
(a) straight fiber sensing model, (b) coiled fiber sensing model.
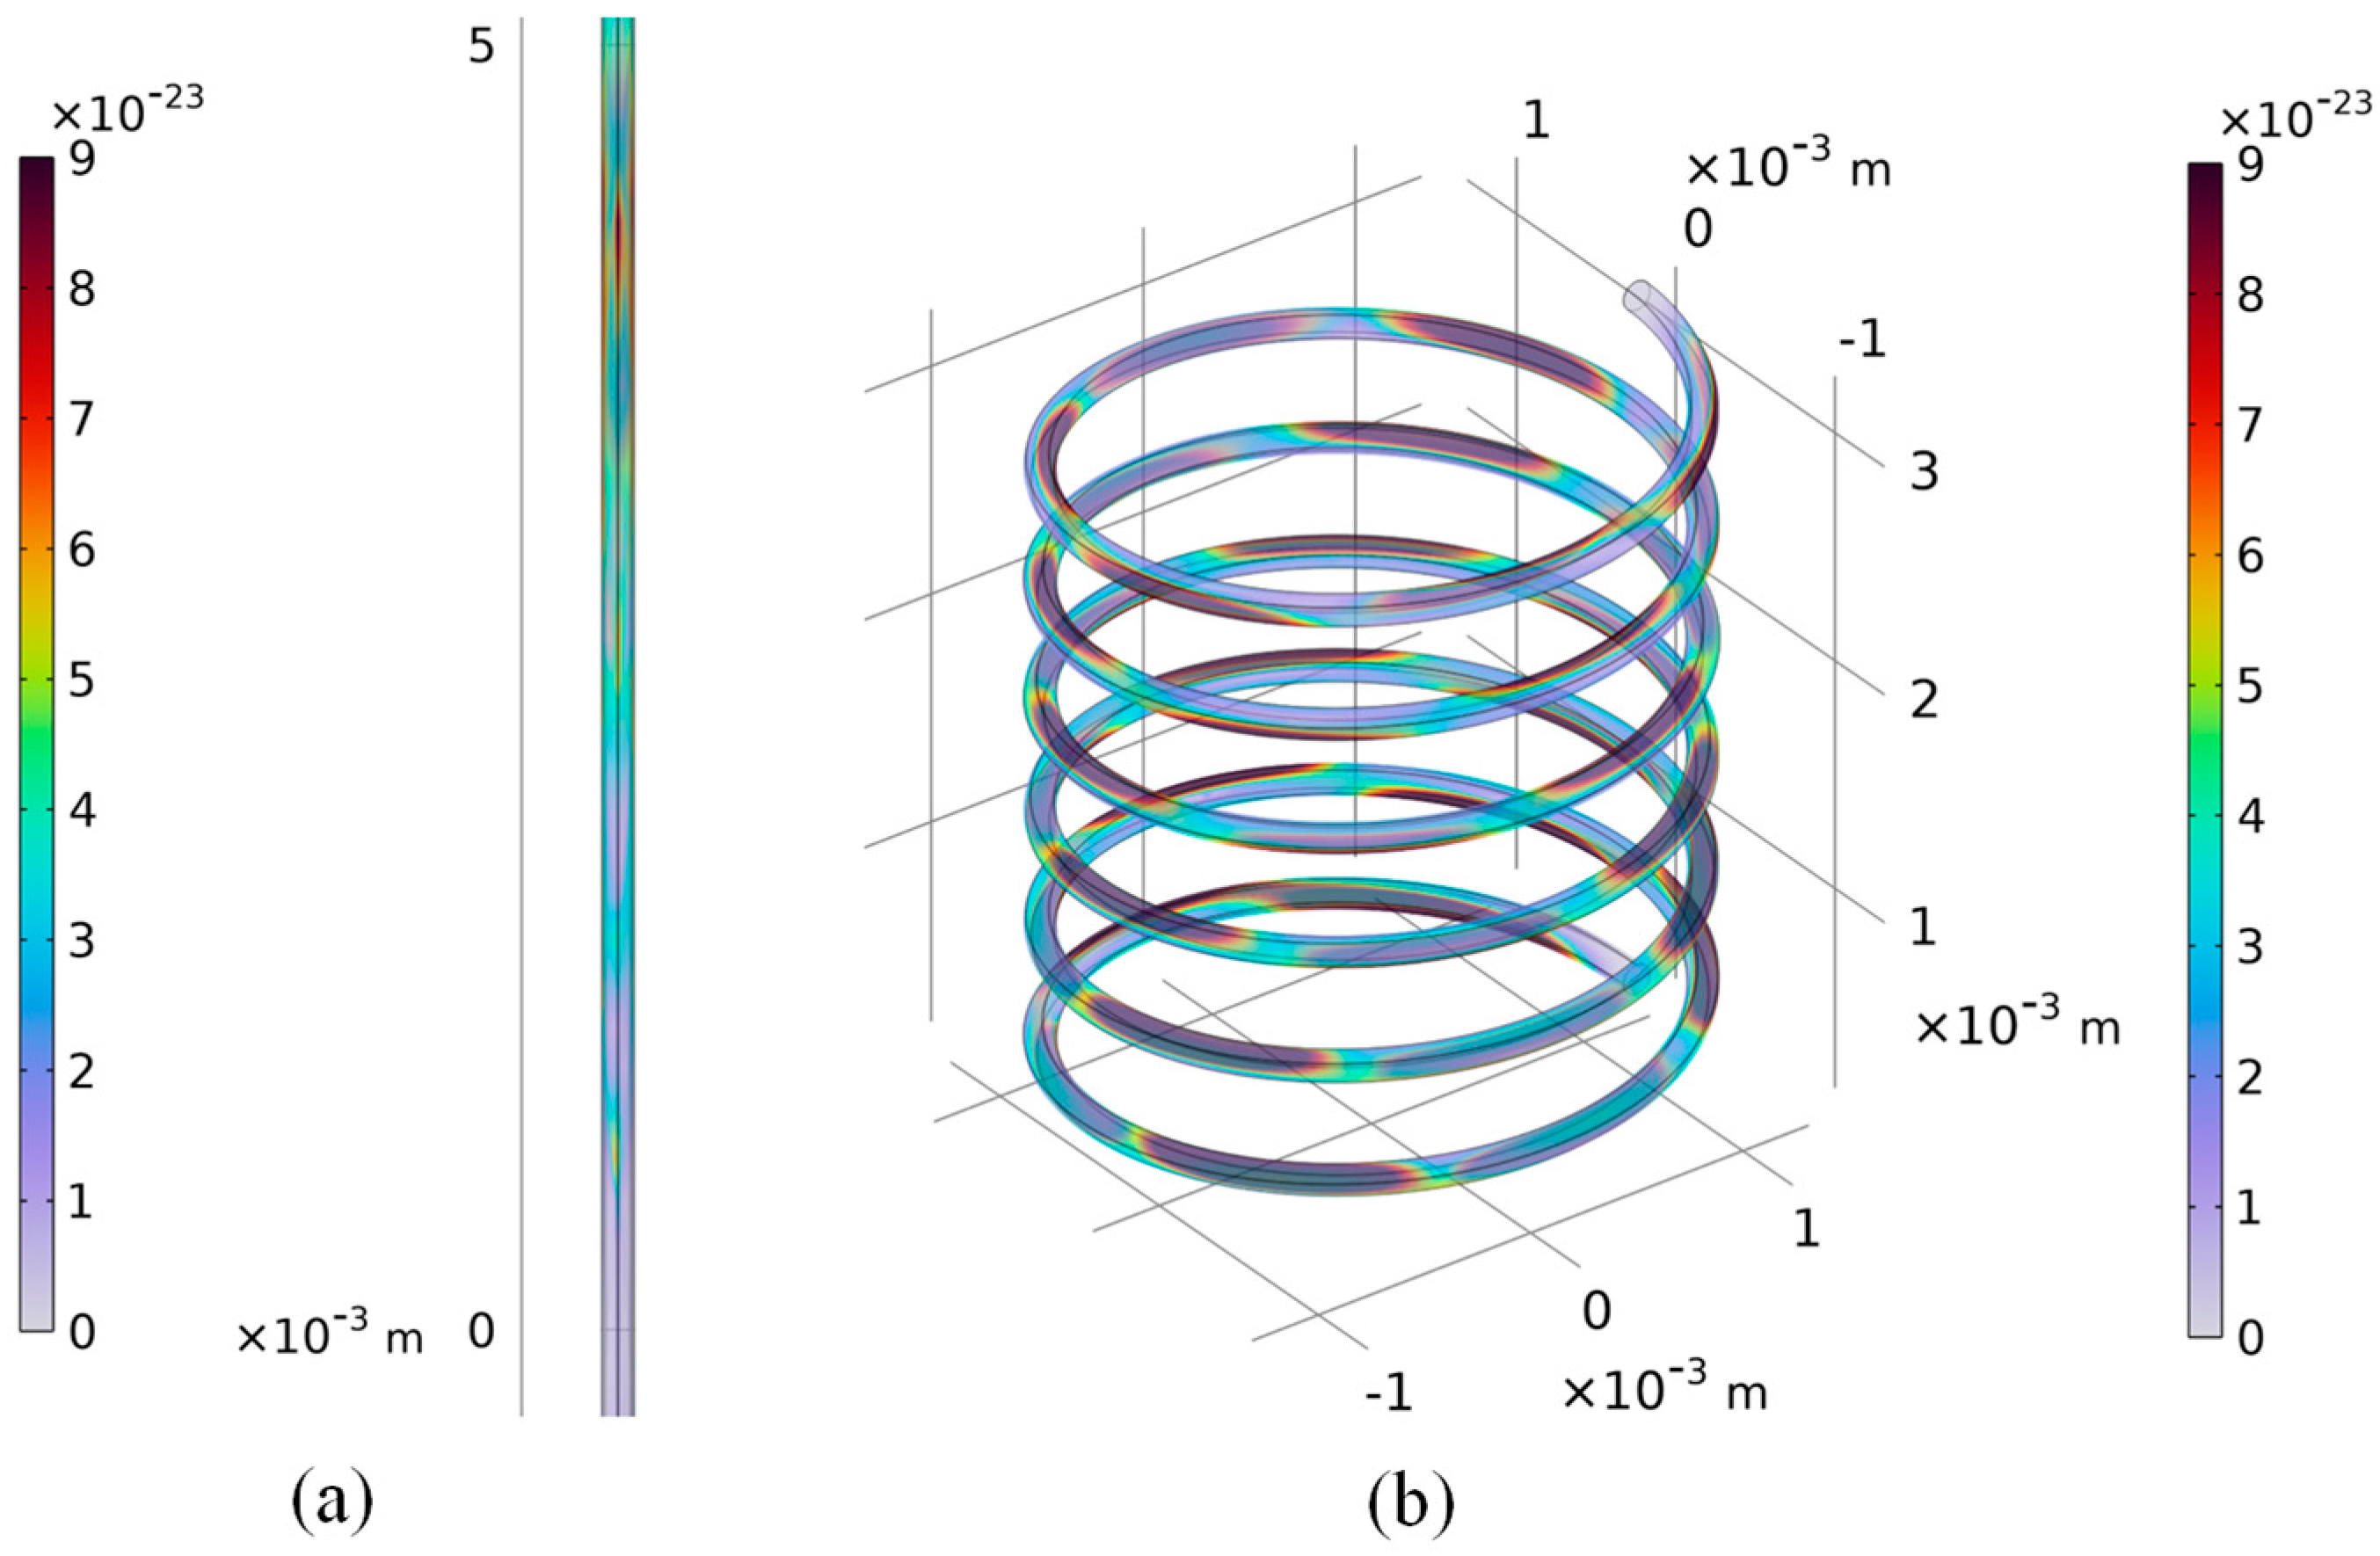
Figure 4 shows the comparison of the strain results produced in the straight fiber optic and fiber ring under the excitation of the same sound source at 150 kHz. The simulation results show that the induced strain of the coiled fiber is much stronger than that of the ordinary straight fiber, indicating that the sensitivity of the coiled fiber ring to the AE source is much higher than the of the ordinary straight fiber.
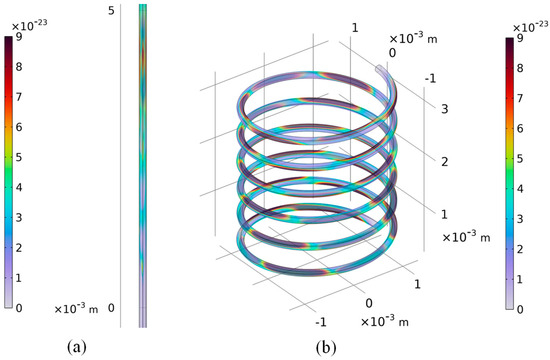
Figure 4.
Induced strain on (a) the straight optical fiber, (b) the coiled optical fiber.
4. Experiments
Figure 5 is the schematic diagram of the designed experiment testing system. The testing system is assembled on an optical table (Thorlabs, Newton, NJ, USA, TF1225A6) and anti-vibration support frame (Thorlabs, Newton, NJ, USA, T1225D). The laser source is a commercial pigtailed LD (Thorlabs, Newton, NJ, USA, LP1550-SAD2). The LD package contains an integrated PD, meaning that it can detect SMI signals while acting as the light source. The maximum output power of LD is 2 mW, and the typical wavelength is 1550 nm. The LD is driven by an LD controller with an operating current of 25 mA. The total length of the optical fiber is 200.0 cm, and the total length of the coiled sensing optical fiber is about 50.0 cm. The fiber is wrapped around an acrylic cylinder with a diameter of 10.0 mm and height of 50.0 mm. The skeleton is finally glued on the top of a 30 × 15 × 0.3 cm aluminum plate. The end of the coiled sensing fiber is coated with reflective film to ensure that there is sufficient optical feedback light into the laser cavity. Note that the optical fiber should be bent to tightly wind on the acrylic cylinder. Although the optical fiber is elastic within a certain range, care should be taken when wrapping it on the cylinder to avoid damaging the fiber. Adhesive tape is used at two ends of the cylinder to prevent the fiber from falling off. An optical fiber variable attenuator is used to adjust the optical feedback coefficient to in order satisfy the requirement of keeping the SMI system operating in the state shown in Figure 2d. A commercial piezoelectric AE sensor (Digital Wave Corporation, Centennial, CO, USA B1025) is also used as the reference sensor for comparison, and this has a diameter of 9.3 mm and height of 12.8 mm. The signals obtained by both are simultaneously captured and displayed using a digital oscilloscope.
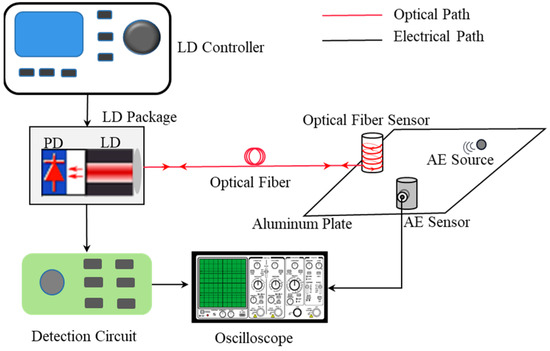
Figure 5.
The schematic diagram of the experimental testing setup.
The feasibility of the proposed SMI fiber ring sensor for AE detection was then tested. The AE signal generation method was the metal ball falling impact technique, which is a widely used method of stimulating AE events [33]. The metal ball has a diameter of 15 mm and a falling height of 20 cm. The impact point is 5 cm away from both the coiled sensing optical fiber sensor and the piezo AE sensor. Note that the balls impact the aluminum plate only once for each experiment. The frequency bandwidth of the commercial AE sensor is 20 kHz–2 MHz. Hence, the output of SMI coiled optical sensors is also filtered using a 20 kHz–2 MHz digital bandpass filter for comparison.
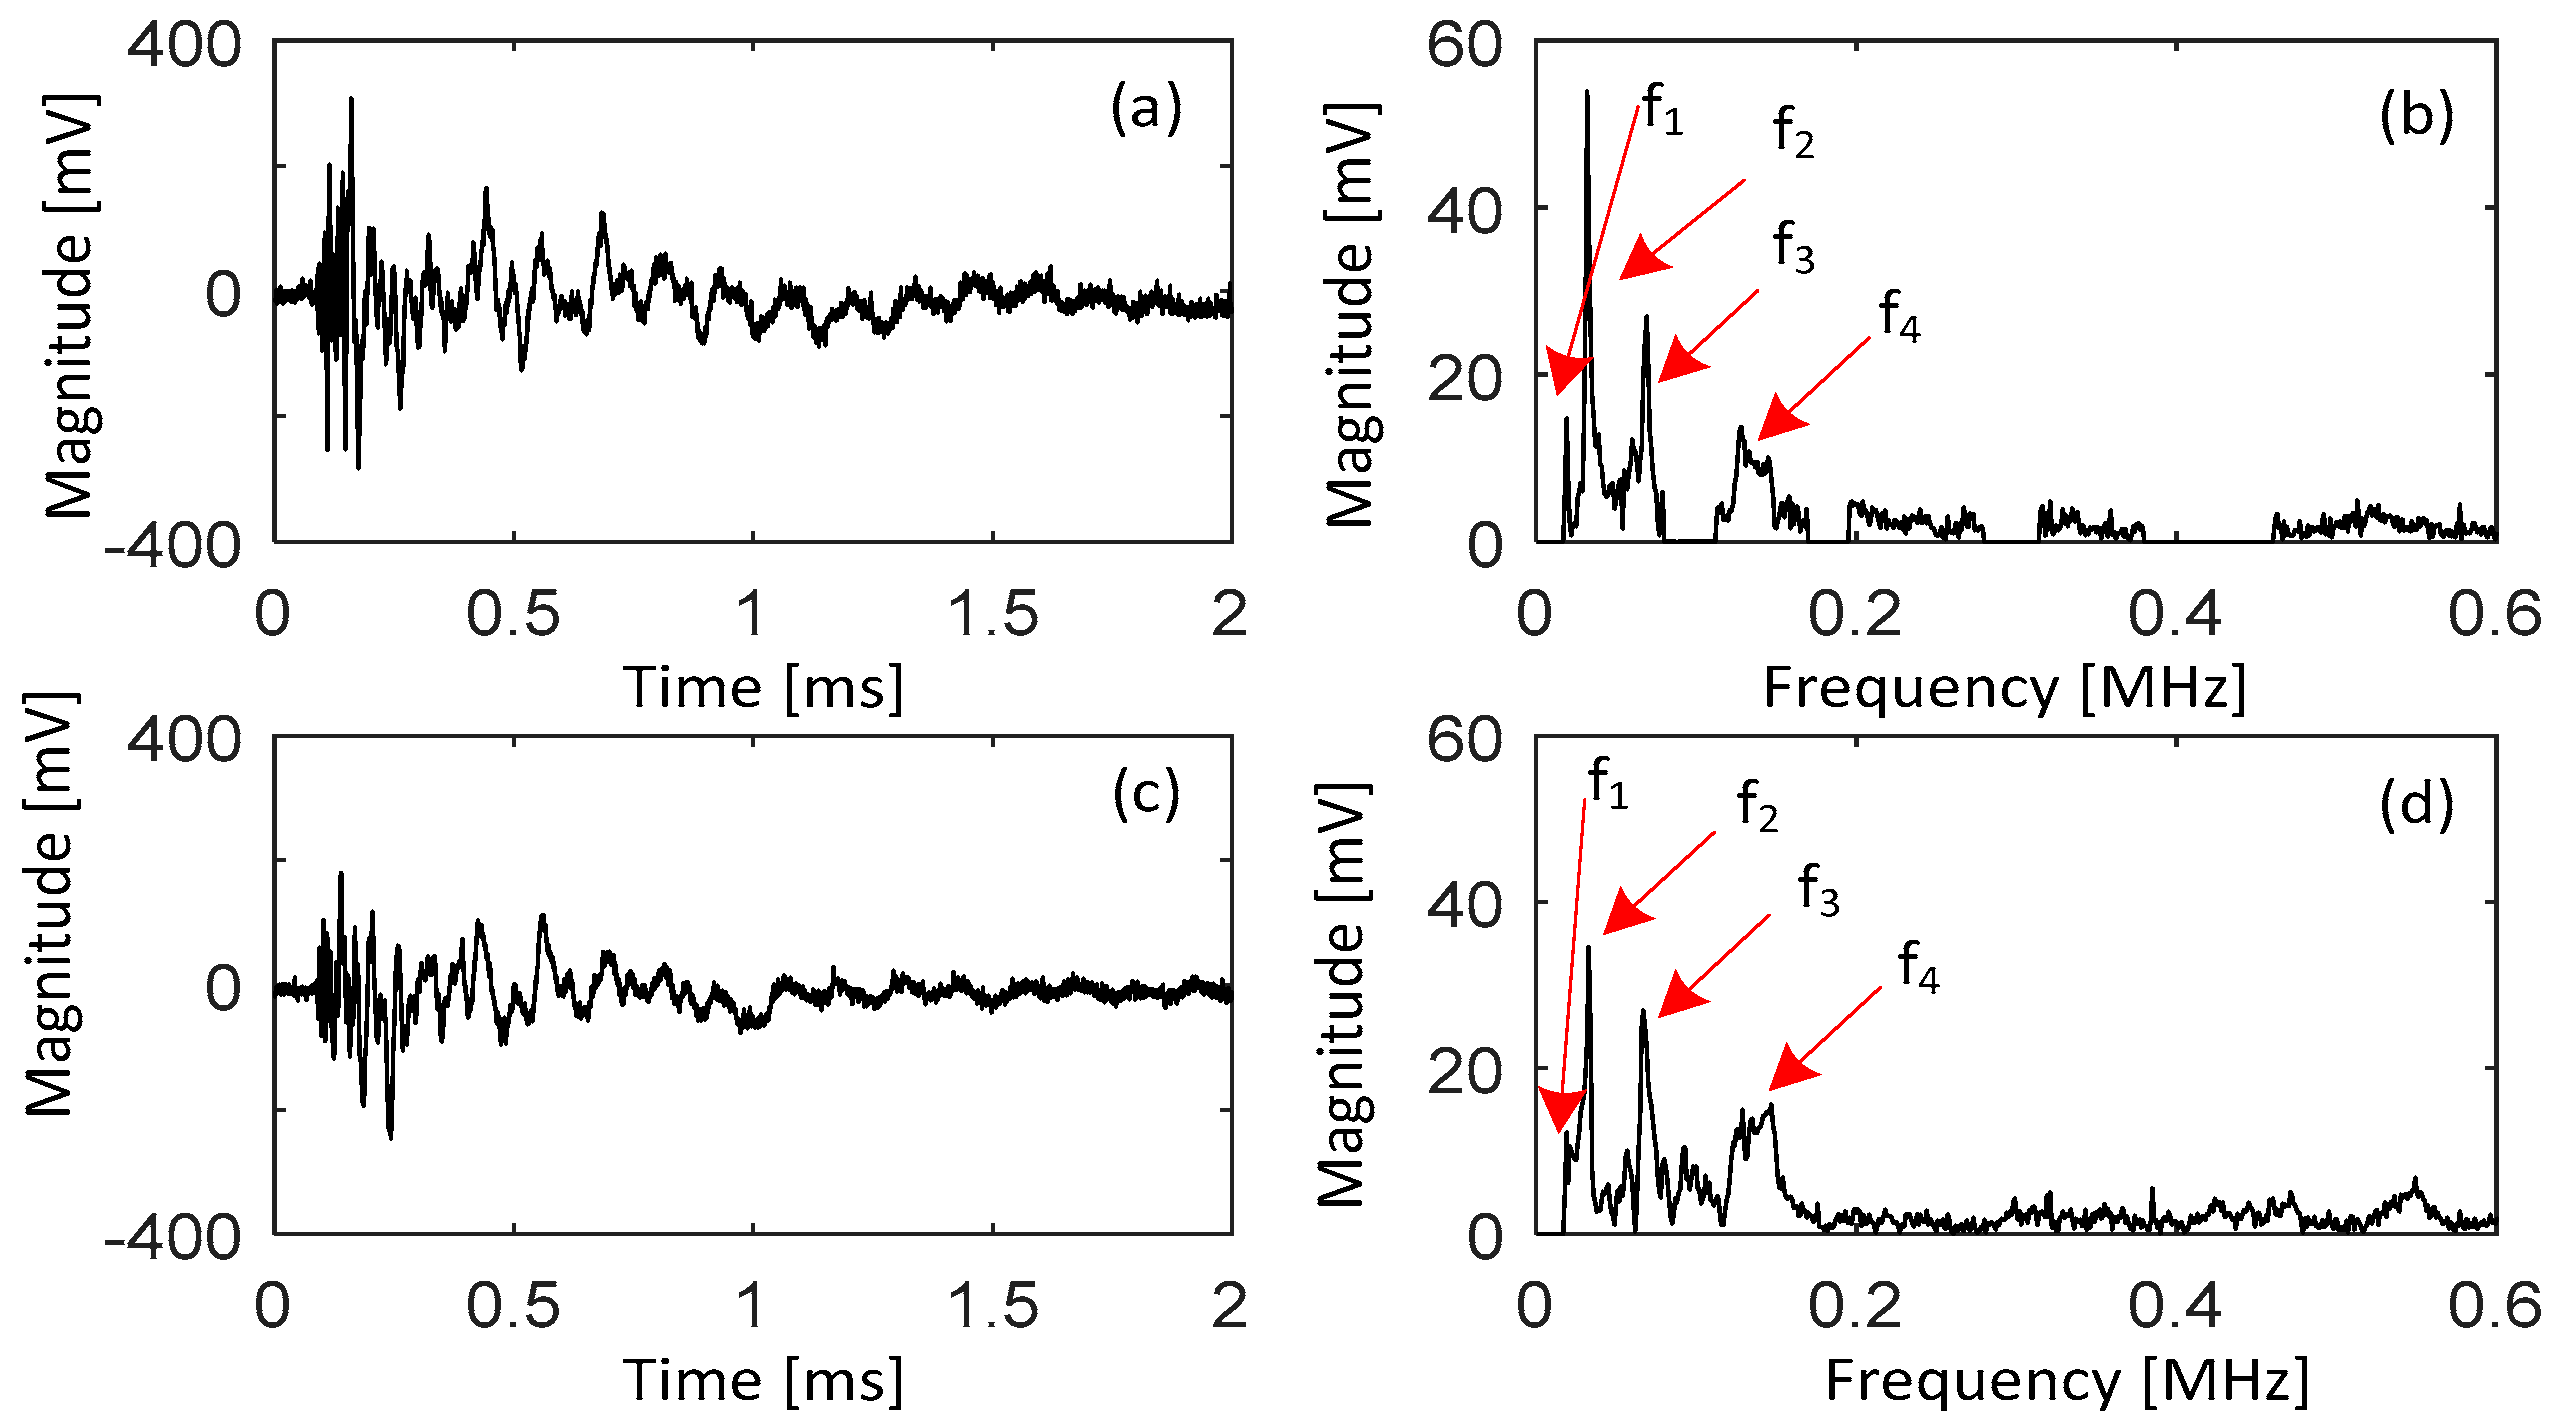
Figure 6 shows the experiment results, where Figure 6a is the AE signal detected by the proposed SMI coiled fiber sensor, and Figure 6c is the signal detected by the commercial AE sensor. Figure 6b,d are, respectively, the corresponding Fourier magnitude spectra. These two sensors simultaneously detected the AE signals caused by the metal ball falling impact during the time around 0–1 ms. The peak frequency of the AE event is near 32 kHz in the spectrum diagram. From the comparison in Figure 6, it can be concluded that the detection results of the SMI coiled fiber sensor are highly similar to those of the commercial sensor. The slight differences in the detected results may be caused by the hysteresis of the piezoelectric sensor, as well as by the different linearities, noise floors and pre-amplification gains of the two sensor systems. It is noteworthy that the commercial AE sensor has a displacement sensitivity of near 35 kHz, while the SMI coiled fiber sensor has been tested with a sensitivity of . So, the AE-induced displacement to the commercial AE sensor is about 13 nm, while the induced displacement of the coiled sensing fiber is about 1 . This is larger than the value of the AE sensor thanks to the multi-coil structure. Nevertheless, it can be seen from the above experiments that the measurement results of the proposed SMI fiber ring sensor have almost the same shape and equivalent output voltage amplitude to those of the piezoelectric acoustic emission sensor. This demonstrates that AE detection of the designed SMI coiled fiber sensor is feasible, showing comparable AE detection capability to piezoelectric sensors and providing a new cost-effective solution for AE detection. Also, it should be noted that the effect of the environmental temperatures on the fiber was not considered at that point.
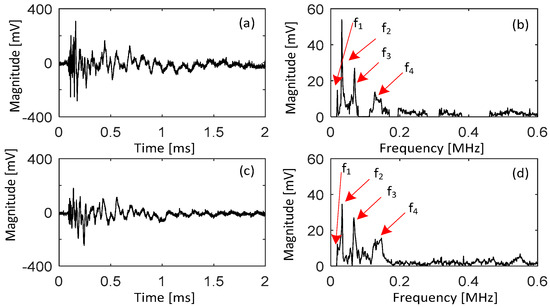
Figure 6.
The detected experimental AE signal, (a,c) are the AE signals detected by the SMI coiled optical fiber sensor and commercial AE sensor respectively, (b,d) are the corresponding magnitude spectra of (a,c) respectively.
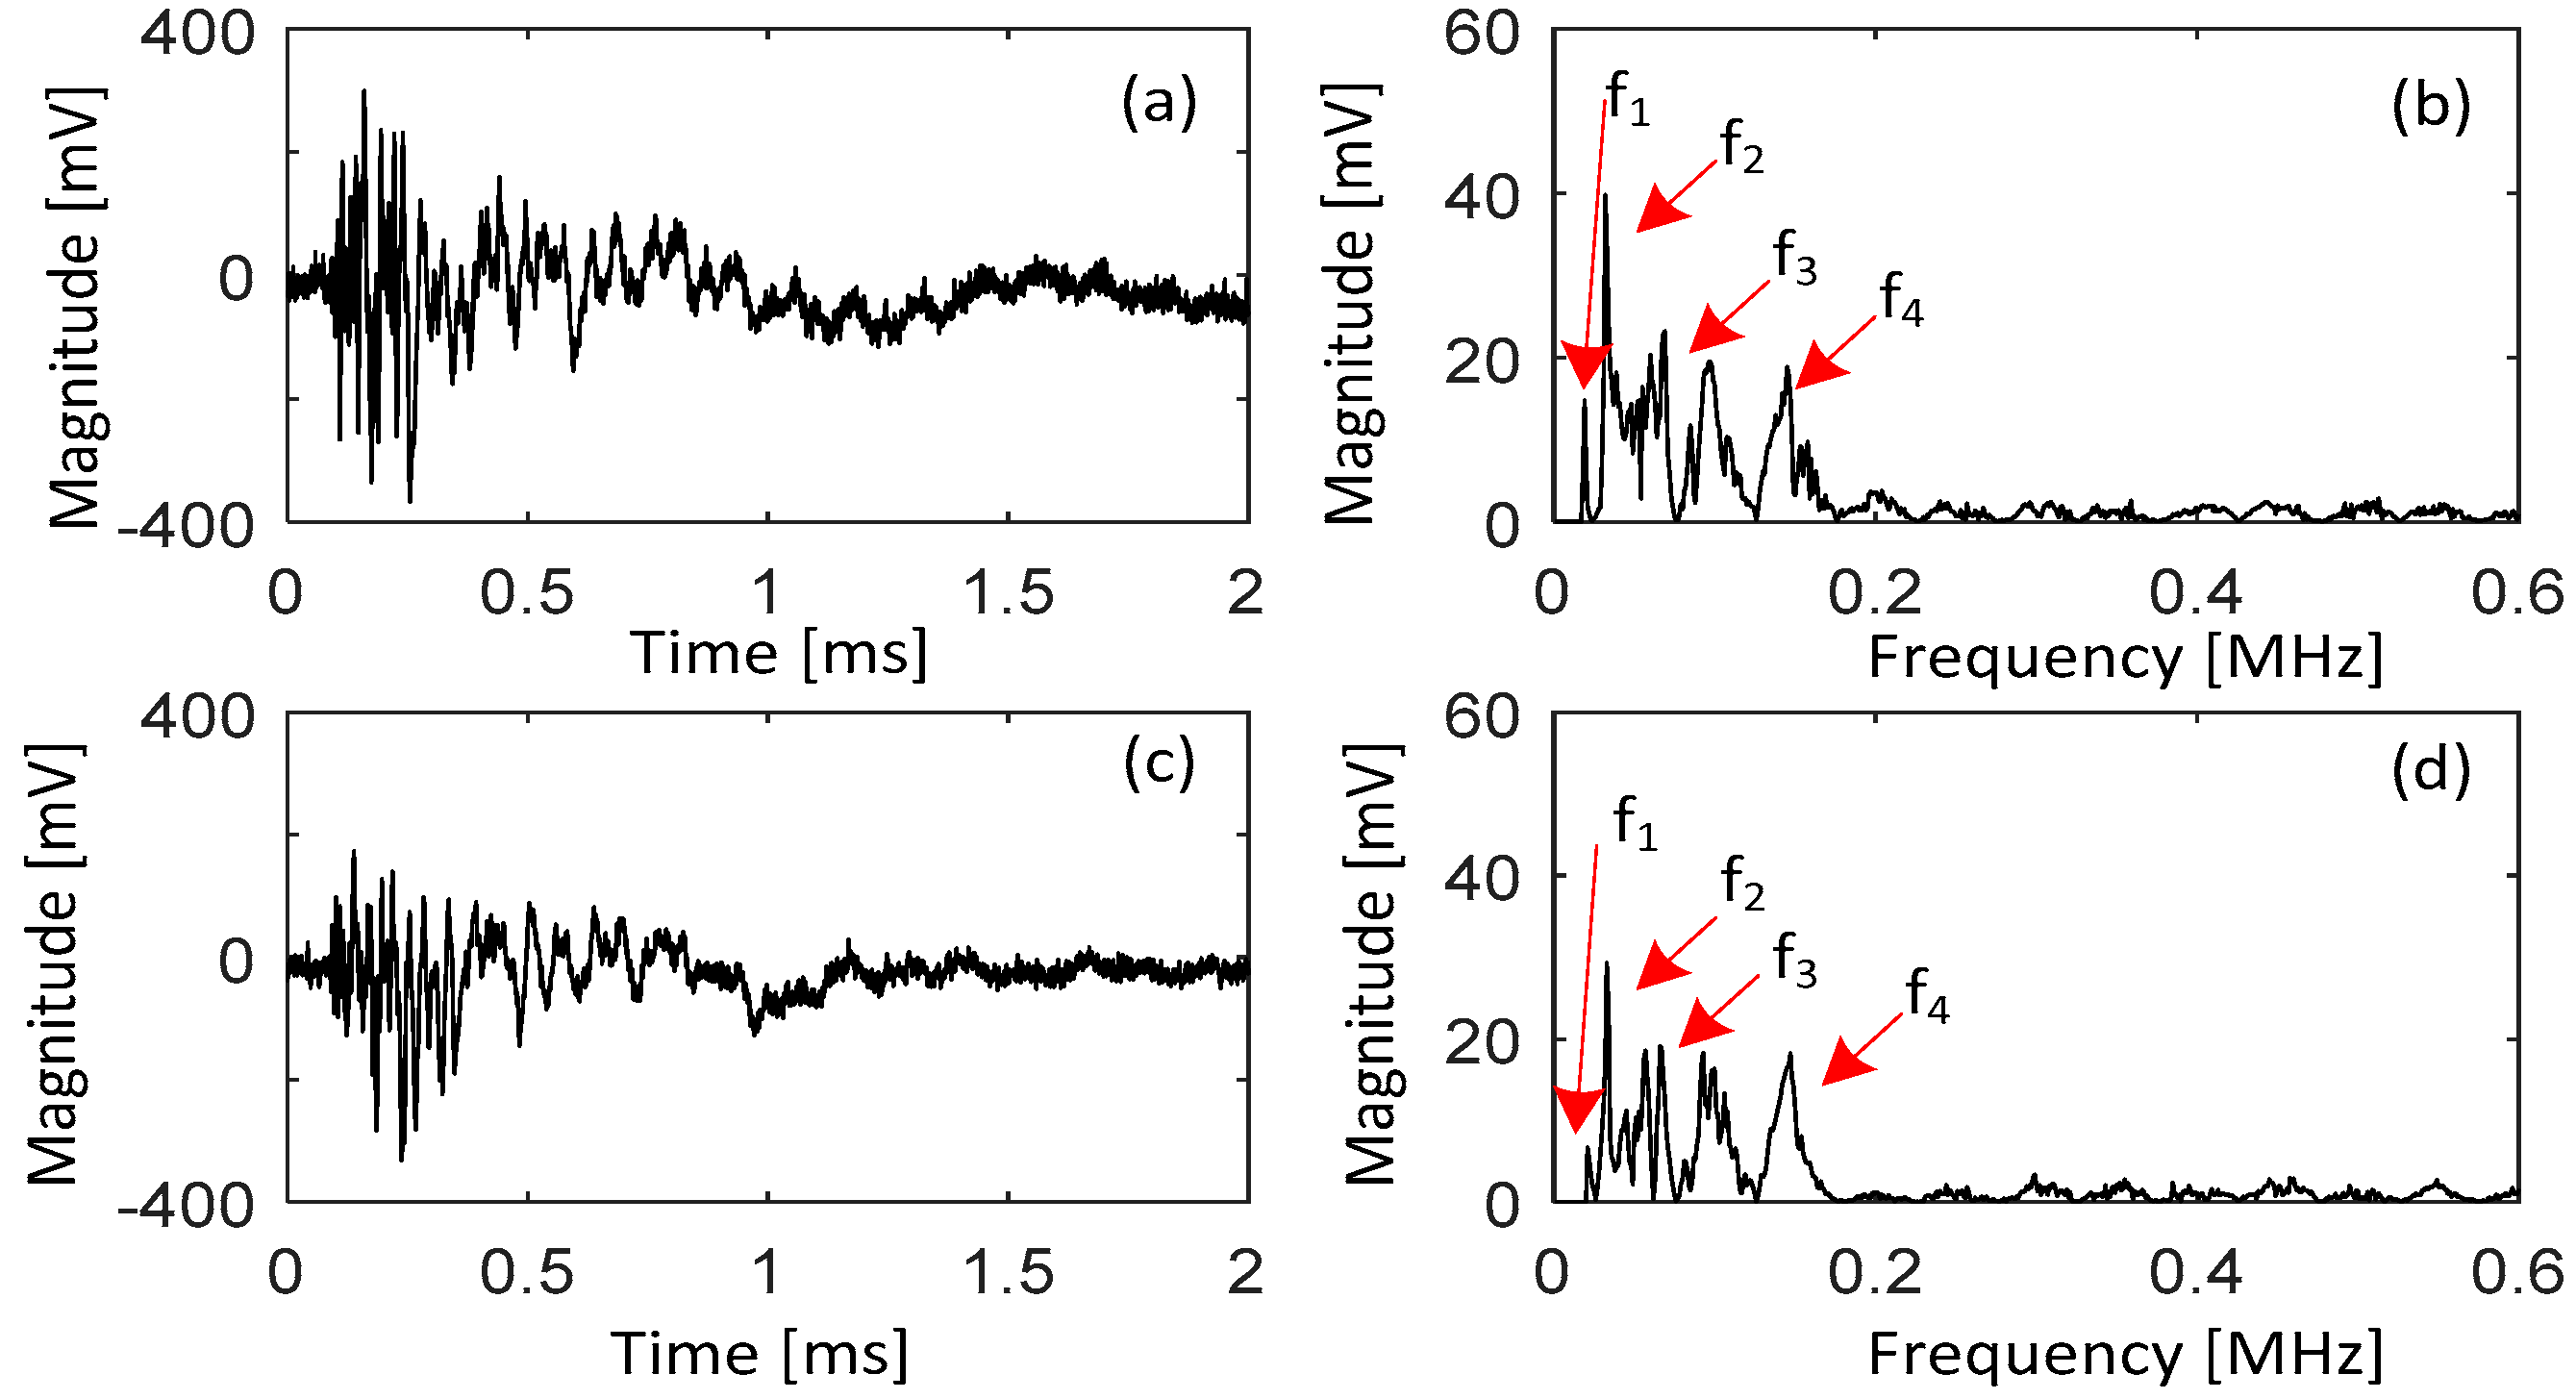
A further experiment with two ball drops was performed. These two balls were dropped from the same heights at the same time but on different impact points. Namely, one was 5 cm and the other was 10 cm from the sensors. The signals detected by these two sensors are shown in Figure 7. It can be seen that the detected AE signals from the SMI coiled fiber sensor are still similar to those of the commercial sensor. As compared with the results in Figure 6, it can be found that the AE signals from two balls dropping show similar frequency range, with the same peak frequency around 32 kHz but more complex time domain waveforms. In Figure 6 and Figure 7, four frequencies are marked, i.e., f1 = 23 kHz, f2 = 32 kHz, f3 = 69 kHz, and f4 = 150 kHz. It can be found that the frequency range is from f1 to f4 for all the detected AE signals. The maximum frequency component is at f2. In Figure 7, new frequency components can be found between f2 and f3, f3 and f4 as compared with Figure 6. These new frequency components are from the second ball dropping, which may induced by the microstructure non-uniformity of the aluminum plate.
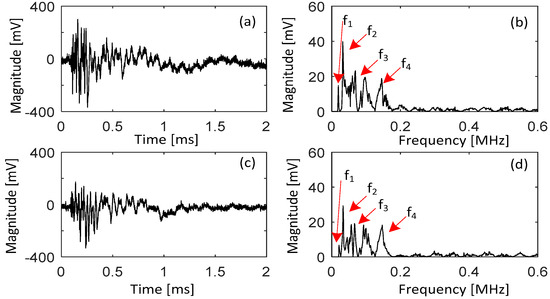
Figure 7.
The detected experimental AE signal, (a,c) are the AE signals detected by the SMI coiled optical fiber sensor and commercial AE sensor, respectively; (b,d) are the corresponding magnitude spectra of (a,c), respectively.
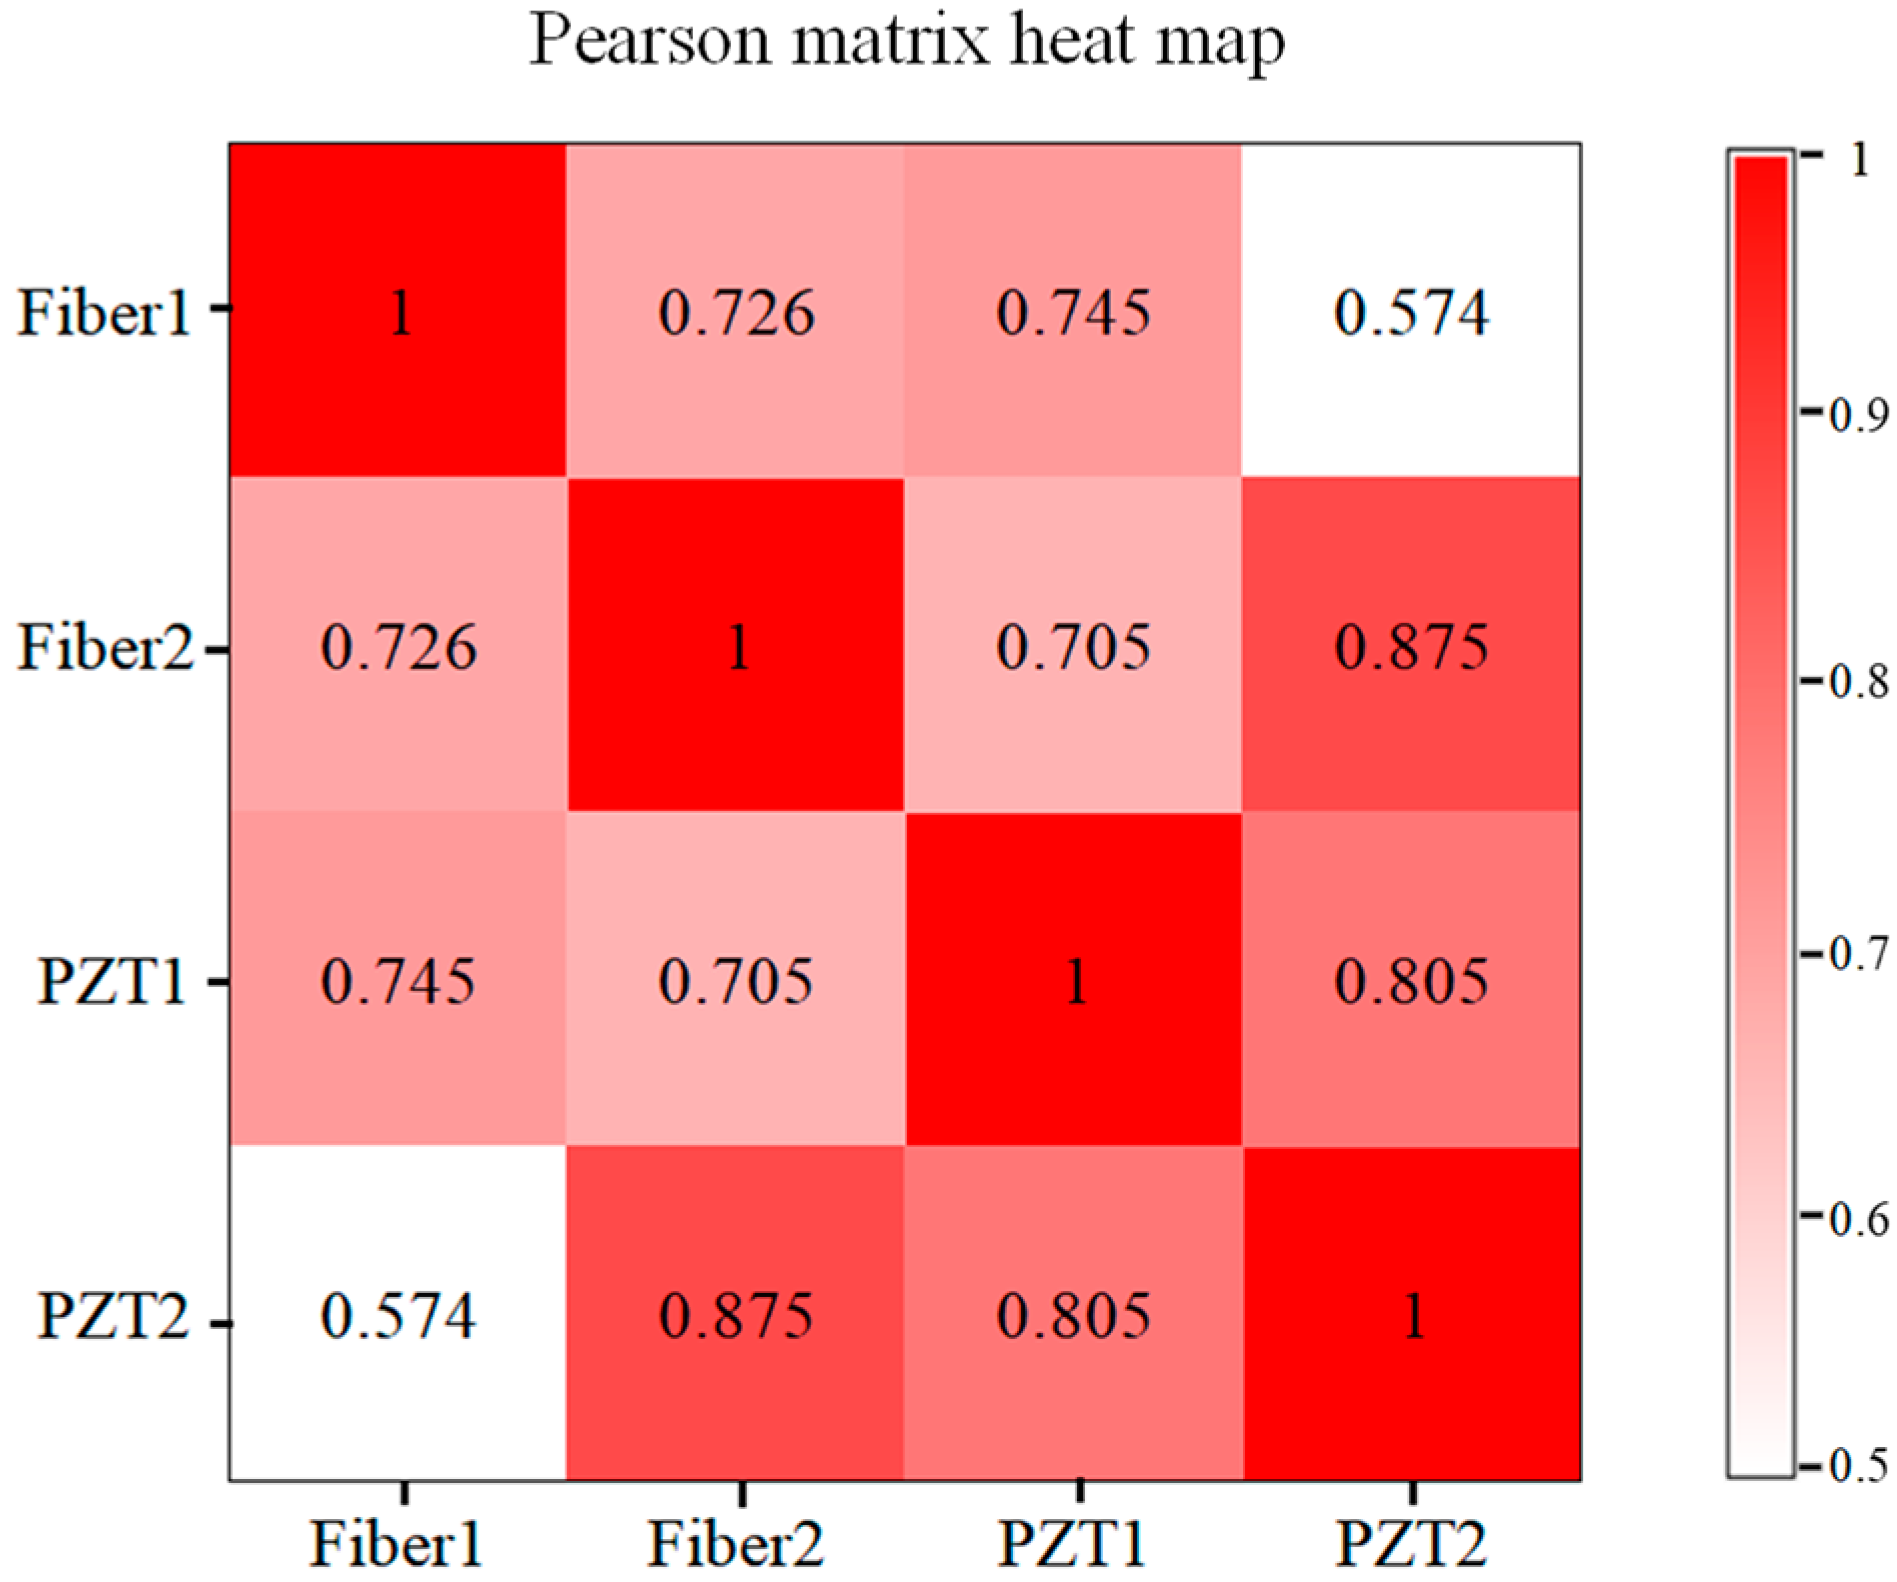
In order to further verify the feasibility and stability of the proposed coiled optical fiber sensor, Pearson correlation analysis, which is a statistical data test designed to reflect the degree of similarity between two variables, has been performed on the experimental signals. The Pearson correlation coefficients between the four groups of empirical data in Figure 6 and Figure 7 have been calculated and are shown in Figure 8, where Fiber1 and Fiber2 correspond to the spectra results for the proposed fiber sensor from the one-ball dropping and two-ball dropping, and PZT1 and PZT2 are for the commercial piezoelectric AE sensor. All the data passed the significance test. The Pearson correlation coefficients between the data from the SMI coiled fiber sensor and commercial AE sensor are 0.745 and 0.875, respectively, for one-ball and two-ball dropping, demonstrating that the proposed fiber sensor has comparable AE detection capability to the commercial piezoelectric sensor. Conversely, the Pearson correlation coefficients between the data from one-ball and two-ball dropping are 0.725 and 0.805, respectively, for each sensor, which demonstrates the strong correlation between the AE signals from one-ball and two-ball dropping. It might be explained by the notion that the detected AE signals for two-ball dropping are the superposition of two AE signals of one-ball dropping, being similar to the interference of two sound waves. Hence, another experiment was carried out to demonstrate this point.

Figure 8.
Heat map of Pearson correlation coefficients.
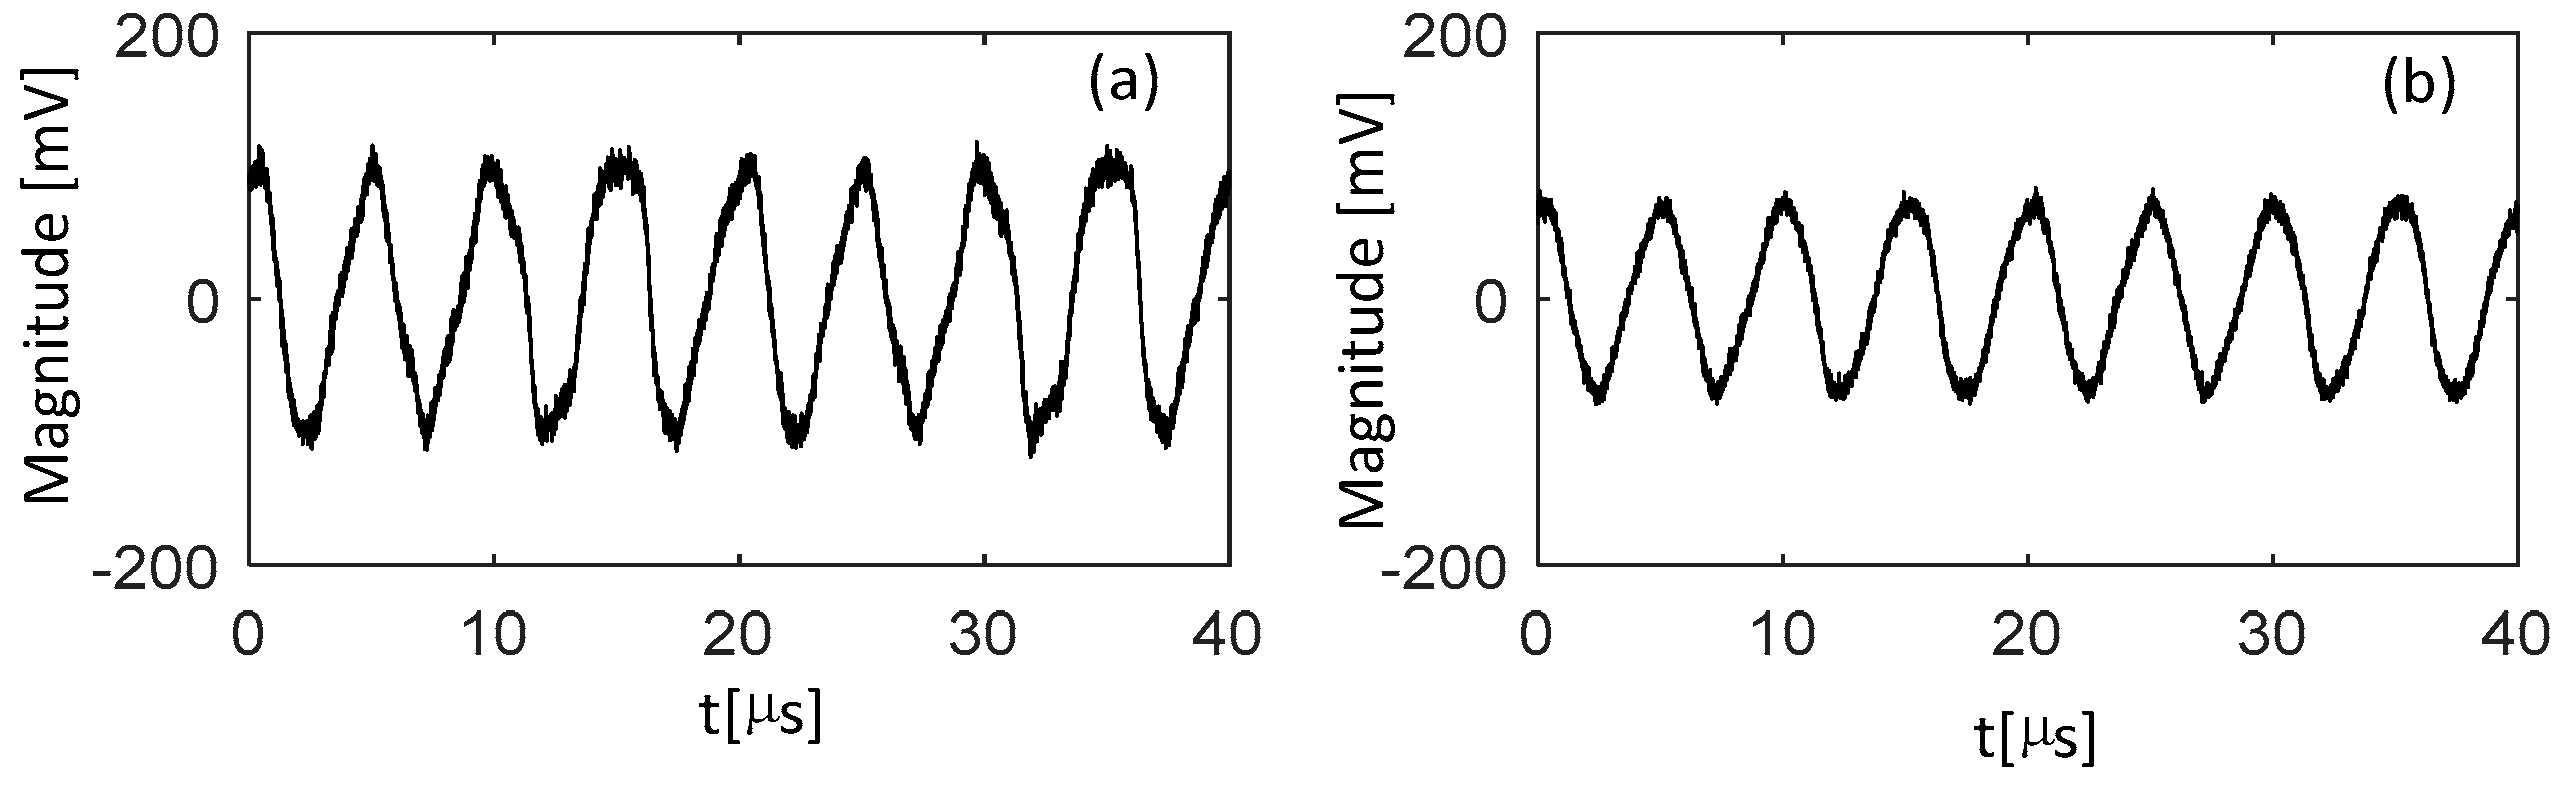
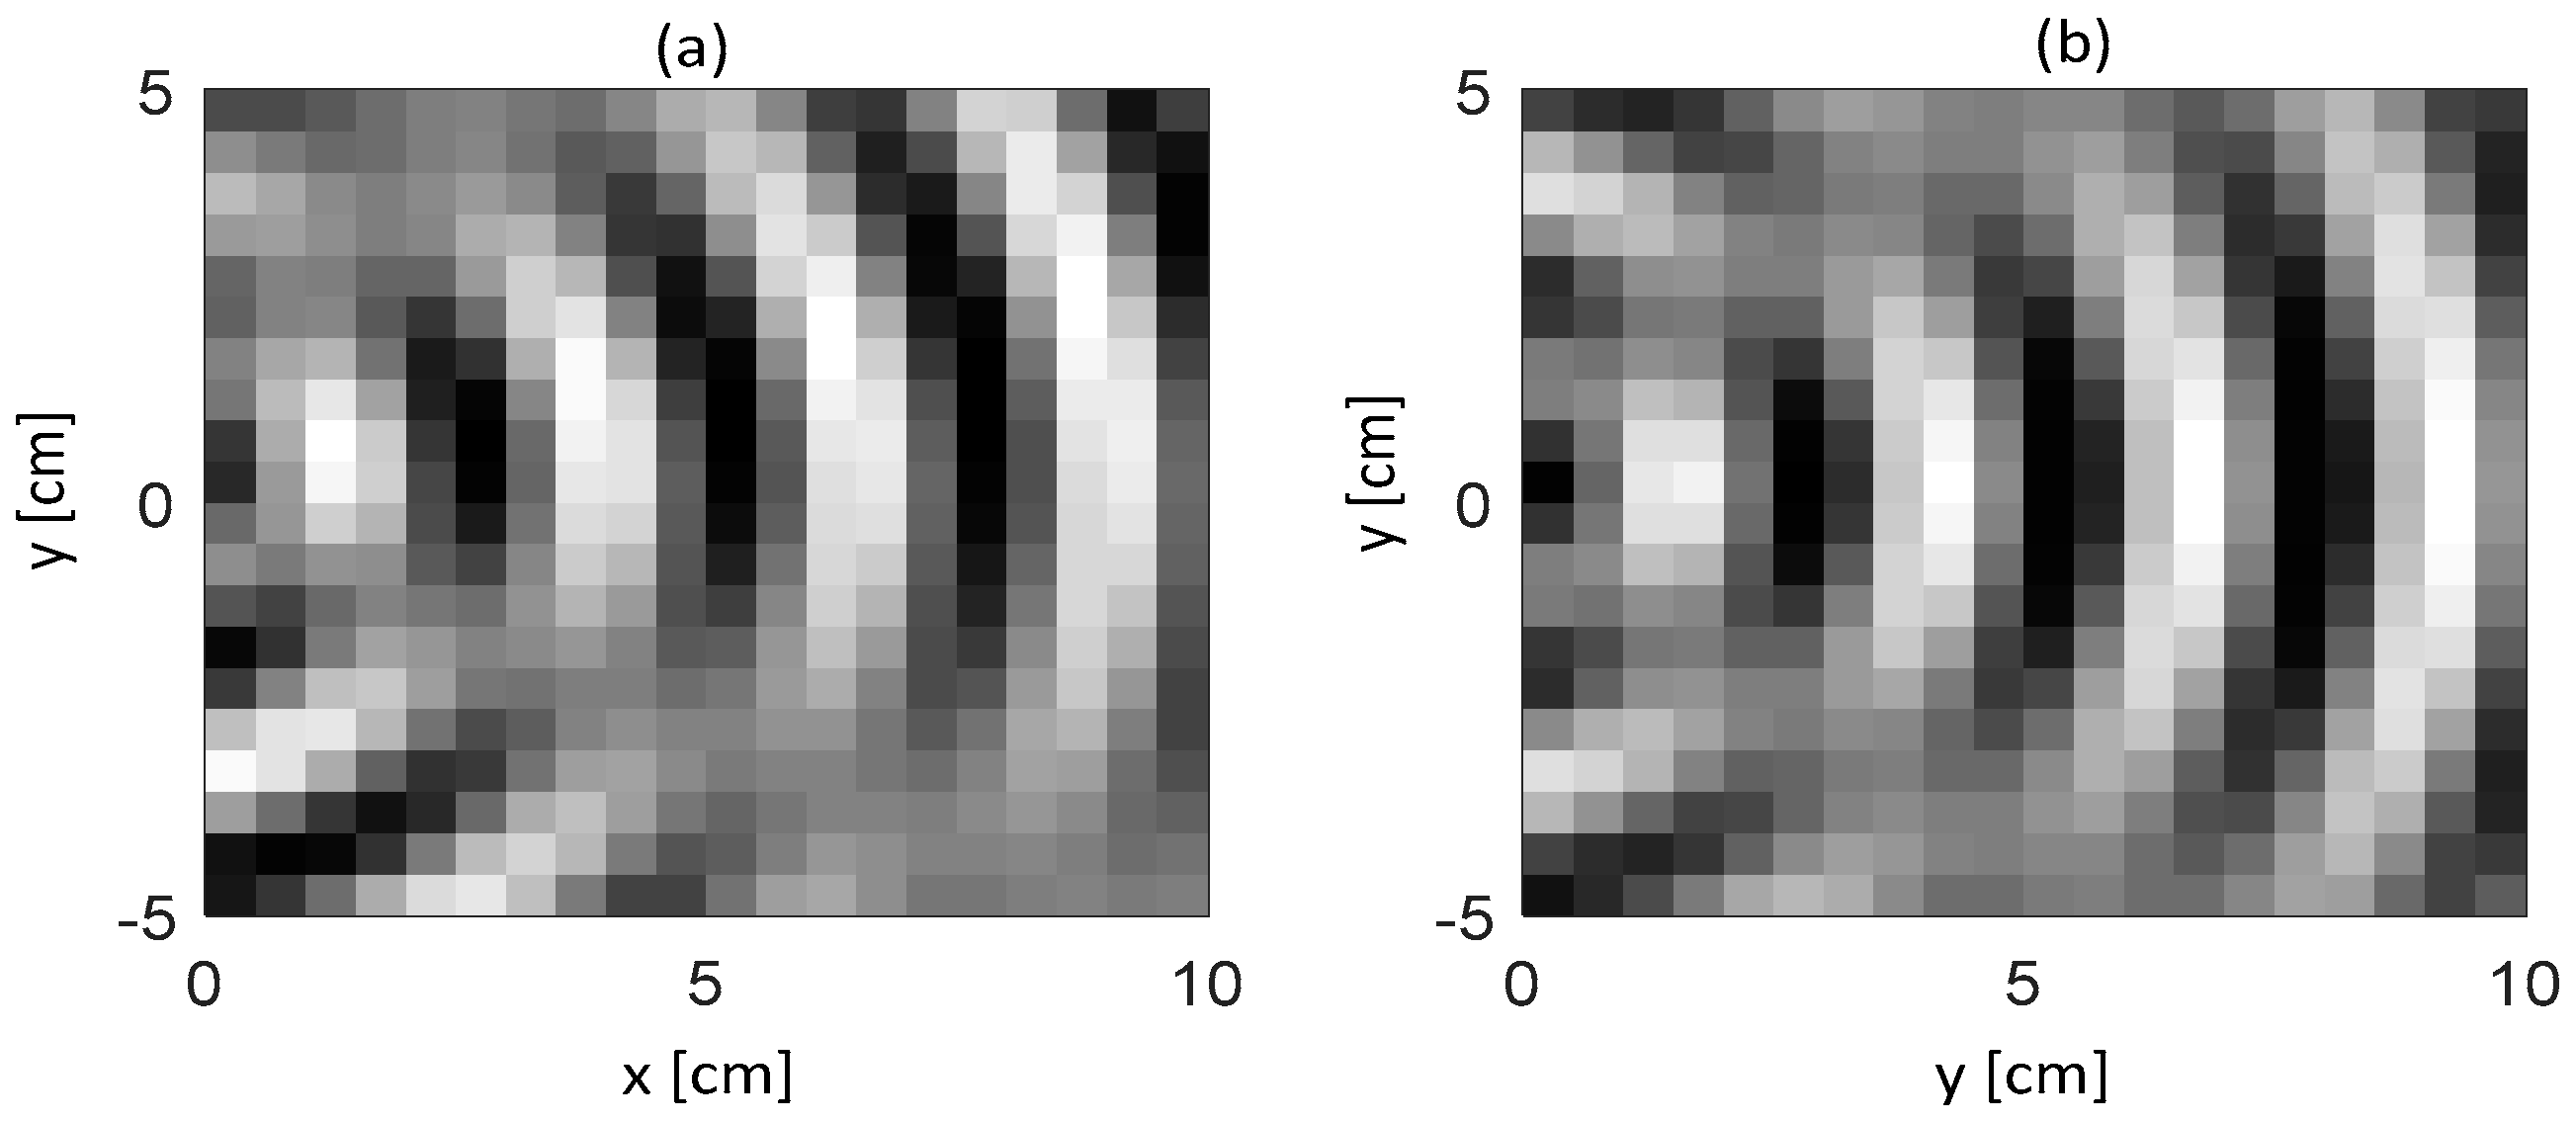
To clearly verify the interference between the two sound waves, two ultrasonic transducers with resonant frequencies of 200 kHz were used as the sound sources. Figure 9 shows the detected signals from the proposed coiled fiber sensor and commercial sensor when one ultrasonic transducer was placed onto the surface of the aluminum plate 5 cm away from the sensors. Then, the interference of two sound waves was analyzed. Figure 10 is the interference image obtained from the fiber sensor and commercial AE sensor. Here, the sensors were scanned in an area of 10 × 10 cm with a step of 0.5 cm. Thus, the image is composed of 21 × 21 pixels. The two ultrasonic transducers were placed at the positions (−1, 1) and (−1, −1) respectively. Although limited pixels were included in Figure 10, obvious interference features could be observed.
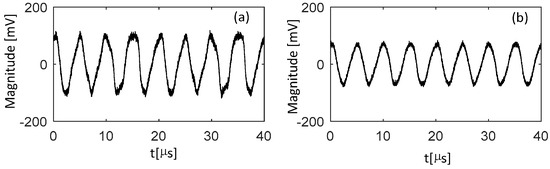
Figure 9.
The detected signal from (a) optical fiber sensor, (b) commercial AE sensor, with ultrasonic transducers.
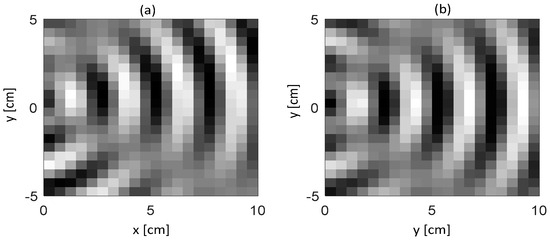
Figure 10.
Interference image with two ultrasonic transducers obtained from (a) optical fiber sensor, (b) commercial AE sensor.
5. Conclusions
A coiled optical fiber acoustic emission detection system based on SMI demodulation has been developed. Firstly, the theoretical model of the system was analyzed, and then the finite element analysis and simulation were carried out. The simulation results show that the sensitivity of the coiled fiber ring is much higher than that of the ordinary straight fiber. The acoustic emission signals induced by falling metal ball were detected simultaneously by using the proposed SMI coiled fiber sensor and a commercial piezoelectric AE sensor. On top of that, acoustic signals from ultrasonic transducers were captured and the interference images of acoustic signals from two ultrasonic transducers were obtained. The experimental results show that the SMI coiled fiber sensor has a comparative acoustic emission detection capability to the piezoelectric sensor. Compared with the traditional AE measurement system, it combines the advantages of optical fiber and SMI technology, i.e., this system is simple in structure and high in measurement sensitivity. It can be used to measure acoustic emission signals in order to detect early structural failures, providing a feasible low-cost alternative to the existing piezoelectric AE sensors.
Author Contributions
Conceptualization, L.Y. and B.L.; methodology, L.Y., Y.Y. and B.L.; software, L.Y., Y.Y. and B.L.; validation, L.Y.; writing—original draft preparation, L.Y. and B.L.; writing—review and editing, B.L., Y.Y., P.T., H.J., J.W. and T.T.; visualization, L.Y. and B.L.; supervision, B.L.; project administration, B.L.; funding acquisition, B.L. All authors have read and agreed to the published version of the manuscript.
Funding
This research was funded by the National Natural Science Foundation of China, grant number 62005234.
Data Availability Statement
The data presented in this study are available on request from the corresponding author. The data are not publicly available since the data also forms parts of an ongoing study.
Conflicts of Interest
The authors declare no conflict of interest.
References
- Jinachandran, S.; Rajan, G. Fibre Bragg Grating Based Acoustic Emission Measurement System for Structural Health Monitoring Applications. Materials 2021, 14, 897. [Google Scholar] [CrossRef]
- Zhao, L.; Kang, L.; Yao, S. Research and Application of Acoustic Emission Signal Processing Technology. IEEE Access 2019, 7, 984–993. [Google Scholar] [CrossRef]
- Rajan, G. Optical Fiber Sensors: Advanced Techniques and Applications; CRC Press: Boca Raton, FL, USA, 2015. [Google Scholar]
- Tsuda, H.; Sato, E.; Nakajima, T.; Nakamura, H.; Arakawa, T.; Shiono, H.; Minato, M.; Kurabayashi, H.; Sato, A. Acoustic emission measurement using a strain-insensitive fiber Bragg grating sensor under varying load conditions. Opt. Lett. 2009, 34, 2942–2944. [Google Scholar] [CrossRef]
- Jinachandran, S.; Ning, Y.; Wu, B.; Li, H.; Xi, J.; Prusty, B.G.; Rajan, G. Cold Crack Monitoring and Localization in Welding Using Fiber Bragg Grating Sensors. IEEE Trans. Instrum. Meas. 2020, 69, 9228–9236. [Google Scholar] [CrossRef]
- Lopez-Higuera, J.M.; Cobo, L.R.; Incera, A.Q.; Cobo, A. Fiber Optic Sensors in Structural Health Monitoring. J. Light. Technol. 2011, 29, 587–608. [Google Scholar] [CrossRef]
- de Oliveira, R.; Ramos, C.A.; Marques, A.T. Health monitoring of composite structures by embedded FBG and interferometric Fabry–Pérot sensors. Comput. Struct. 2008, 86, 340–346. [Google Scholar] [CrossRef]
- Wei, P.; Han, X.; Xia, D.; Liu, T.; Lang, H. Novel Fiber-Optic Ring Acoustic Emission Sensor. Sensors 2018, 18, 215. [Google Scholar] [CrossRef]
- Jha, A.; Azcona, F.; Royo, S. Cost-effective laser feedback sensor for nanometric scale acoustic perturbations. Opt. Eng. 2018, 57, 074110. [Google Scholar] [CrossRef]
- Bertling, K.; Perchoux, J.; Taimre, T.; Malkin, R.; Robert, D.; Rakić, A.D.; Bosch, T. Imaging of acoustic fields using optical feedback interferometry. Opt. Express 2014, 22, 30346–30356. [Google Scholar] [CrossRef]
- Urgiles Ortiz, P.F.; Perchoux, J.; Luna Arriaga, A.; Jayat, F.; Bosch, T. Visualization of an acoustic stationary wave by optical feedback interferometry. Opt. Eng. 2018, 57, 051502. [Google Scholar] [CrossRef]
- Liu, B.; Ruan, Y.; Yu, Y. All-Fiber Laser-Self-Mixing Sensor for Acoustic Emission Measurement. J. Light. Technol. 2021, 39, 4062–4068. [Google Scholar] [CrossRef]
- Guo, D.; Jiang, H.; Shi, L.; Wang, M. Laser self-mixing grating interferometer for MEMS accelerometer testing. IEEE Photonics J. 2018, 10, 6800609. [Google Scholar] [CrossRef]
- Zhu, D.; Zhao, Y.; Tu, Y.; Li, H.; Xu, L.; Yu, B.; Lu, L. All-fiber laser feedback interferometer using a DBR fiber laser for effective sub-picometer displacement measurement. Opt. Lett. 2021, 46, 114–117. [Google Scholar] [CrossRef] [PubMed]
- Wang, Y.; Xu, X.; Dai, Z.; Hua, Z.; Lin, C.; Hou, Y.; Zhang, Q.; Wang, P.; Tan, Y. Frequency-swept feedback interferometry for noncooperative-target ranging with a stand-off distance of several hundred meters. PhotoniX 2022, 3, 21. [Google Scholar] [CrossRef]
- Norgia, M.; Melchionni, D.; Pesatori, A. Self-mixing instrument for simultaneous distance and speed measurement. Opt. Lasers Eng. 2017, 99, 31–38. [Google Scholar] [CrossRef]
- Huang, Z.; Hu, X.; Li, Q.; Jin, X.; Xu, B.; Wang, D.; Liu, X.; Zhang, T.; Zhang, Z.; Chen, G.; et al. Phase-Shifted Quadrature-Phase demodulation based on a Multi-Longitudinal mode laser Self-Mixing sensor for displacement measurement. Measurement 2023, 206, 112323. [Google Scholar] [CrossRef]
- Zhang, Z.; Jiang, C.; Shen, L.; Li, C.; Huang, Z. Vibration Measurement Based on the Local Maximum Detection Algorithm for Laser Self-Mixing Interferometry. IEEE Access 2020, 8, 63462–63469. [Google Scholar] [CrossRef]
- Kou, K.; Wang, C.; Lian, T.; Weng, J. Fringe slope discrimination in laser self-mixing interferometry using artificial neural network. Opt. Lasers Technol. 2020, 132, 106499. [Google Scholar] [CrossRef]
- Wang, B.; Liu, B.; An, L.; Tang, P.; Ji, H.; Mao, Y. Laser Self-Mixing Sensor for Simultaneous Measurement of Young’s Modulus and Internal Friction. Photonics 2021, 8, 550. [Google Scholar] [CrossRef]
- Taimre, T.; Nikolić, M.; Bertling, K.; Lim, Y.L.; Bosch, T.; Rakić, A.D. Laser feedback interferometry: A tutorial on the self-mixing effect for coherent sensing. Adv. Opt. Photonics 2015, 7, 570–631. [Google Scholar] [CrossRef]
- Ge, S.; Lin, Y.; Chen, H.; Kong, X.; Zhu, D.; Dong, Z.; Wang, X.; Huang, W. Signal extraction method based on spectral processing for a dual-channel SMI vibration sensor. Opt. Lasers Eng. 2023, 164, 107531. [Google Scholar] [CrossRef]
- Khan, J.I.; Zabit, U. Deformation Method of Self-Mixing Laser Sensor’s Feedback Phase for Estimation of Optical Feedback Coupling Factor and Displacement. IEEE Sens. J. 2021, 21, 7490–7497. [Google Scholar] [CrossRef]
- Annovazzi-Lodi, V.; Merlo, S.; Norgia, M.; Spinola, G.; Vigna, B.; Zerbini, S. Optical detection of the Coriolis force on a silicon micromachined gyroscope. J. Microelectromech. Syst. 2003, 12, 540–549. [Google Scholar] [CrossRef]
- Ruan, Y.; Liu, B.; Yu, Y.; Xi, J.; Guo, Q.; Tong, J. High sensitive sensing by a laser diode with dual optical feedback operating at period-one oscillation. Appl. Phys. Lett. 2019, 115, 011102. [Google Scholar] [CrossRef]
- Liang, H.; Wang, Y.; Kan, L.; Xu, K.; Dong, T.; Wang, W.; Gao, B.; Jiang, C. Wearable and Multifunctional Self-Mixing Microfiber Sensor for Human Health Monitoring. IEEE Sens. J. 2023, 23, 2122–2127. [Google Scholar] [CrossRef]
- Yu, Y.; Fan, Y.; Liu, B. Self-mixing interferometry and its applications. In Optical Design and Testing VII; International Society for Optics and Photonics: Bellingham, WA, USA, 2016; p. 100210U. [Google Scholar]
- Yu, Y.; Xi, J.; Chicharo, J.F.; Bosch, T.M. Optical Feedback Self-Mixing Interferometry with a Large Feedback Factor C: Behavior Studies. IEEE J. Quantum Electron. 2009, 45, 840–848. [Google Scholar] [CrossRef]
- An, L.; Liu, B. Measuring parameters of laser self-mixing interferometry sensor based on back propagation neural network. Opt. Express 2022, 30, 19134–19144. [Google Scholar] [CrossRef]
- Liu, B.; Ruan, Y.; Yu, Y. Determining System Parameters and Target Movement Directions in a Laser Self-Mixing Interferometry Sensor. Photonics 2022, 9, 612. [Google Scholar] [CrossRef]
- Bertling, K.; Qi, X.; Taimre, T.; Lim, Y.L.; Rakić, A.D. Feedback Regimes of LFI Sensors: Experimental Investigations. Sensors 2022, 22, 9001. [Google Scholar] [CrossRef]
- Liu, B.; Wang, B.; Ruan, Y.; Yu, Y. Suppression of undamped relaxation oscillation in a laser self-mixing interferometry sensing system. Opt. Express 2022, 30, 11254–11265. [Google Scholar] [CrossRef]
- Jinachandran, S.; Basu, A.; Li, H.; Xi, J.; Prusty, B.G.; Rajan, G. The Study of the Directional Sensitivity of Fiber Bragg Gratings for Acoustic Emission Measurements. IEEE Sens. J. 2019, 19, 6771–6777. [Google Scholar] [CrossRef]


Disclaimer/Publisher’s Note: The statements, opinions and data contained in all publications are solely those of the individual author(s) and contributor(s) and not of MDPI and/or the editor(s). MDPI and/or the editor(s) disclaim responsibility for any injury to people or property resulting from any ideas, methods, instructions or products referred to in the content. |
© 2023 by the authors. Licensee MDPI, Basel, Switzerland. This article is an open access article distributed under the terms and conditions of the Creative Commons Attribution (CC BY) license (https://creativecommons.org/licenses/by/4.0/).