Abstract
The straddle-type monorail is an electric-powered public vehicle widely known for its versatility and ease of maintenance. The finger-band is a critical connecting structure for the straddle-type monorail, but issues such as loose bolts are inevitable over time. Manual inspection is the primary method for detecting bolt looseness in the finger-band, but this approach could be more efficient and resistant to missed detections. In this study, we conducted a straddle-type monorail finger-band-anomaly-monitoring experiment using Distributed Acoustic Sensing (DAS), a distributed multi-point-monitoring system widely used in railway monitoring. We analyzed track vibration signals’ time-domain and frequency-domain characteristics under different monorail operating conditions. Our findings revealed the following: 1. DAS can effectively identify the monorail’s operating status, including travel direction, starting and braking, and real-time train speed measurement. 2. Time-domain signals can accurately pinpoint special track structures such as turnouts and finger-bands. Passing trains over finger-bands also results in notable energy reflections in the frequency domain. 3. After the finger-band bolts loosen, there is a significant increase in vibration energy at the finger-band position, with the degree of energy increase corresponding to the extent of loosening.
1. Introduction
As one of the railway systems, the straddle-type monorail plays a crucial role in modern infrastructure by connecting cities and driving economic growth. Ensuring the safety and reliability of these systems is paramount. Timely detection of anomalies within the tracks is a crucial aspect of this effort. Anomalies such as track damage, loose bolts, and structural defects pose significant risks to train operations, potentially leading to derailments, accidents, and service disruptions. Consequently, developing robust and efficient methods for detecting railway anomalies is critical.
The railway anomaly detection field has made significant progress over the years, and researchers have explored various techniques to address the challenges associated with identifying these issues. Non-destructive testing methods, such as ultrasonic and eddy current testing, have been used to detect defects in railway tracks. However, these methods often require specialized equipment and skilled operators, which limits their scalability and real-time applicability.
Recently, machine-learning and deep-learning algorithms have become effective tools for detecting anomalies in railway systems. These algorithms are useful for analyzing large amounts of data to identify patterns that may indicate anomalies, allowing for early detection and maintenance. Various studies have delved into using unsupervised learning techniques for railway anomaly detection. For example, Da Silva Ferreira et al. compared the performance of k-means, self-organizing maps, and auto-encoders, concluding that auto-encoders outperformed the other methods regarding detection accuracy [1]. Additionally, Zheng et al. introduced a method that integrates fastener localization, abnormal sample generation, and state inspection, achieving an impressive detection accuracy rate of 99.9% [2].
In previous studies, various supervised and semi-supervised learning techniques were investigated for detecting anomalies in railways. Gao et al. presented an automated method for detecting anomalies in trackside equipment using GPS and image-matching techniques [3]. Furthermore, Guo et al. introduced a framework that combines semi-supervised and multi-domain learning [4]. These studies highlight the potential of machine-learning algorithms for railway anomaly detection. However, they also acknowledge the challenges of managing false-positives and the potential risk of missing some abnormal cases.
The detection of loose bolts is a crucial part of monitoring railway anomalies. Loose bolts can cause serious problems, such as rail detachment, track instability, and potential derailments. Therefore, developing effective methods for detecting loose bolts is essential for ensuring railway safety [5]. While many studies have been on detecting track damage and geometric defects, the specific challenge of detecting loose bolts has not received as much attention.
Significant progress has been made in the detection of bolt loosening. Various techniques have been developed and improved. Initially, researchers studied the effects of loosening on structural vibrations. He and Zhu and Huda et al. used modal analysis and non-contact vibration-testing methods to identify changes in natural frequencies and damping ratios, which could indicate potential loosening [6,7]. This method mainly focused on detecting alterations in the high-frequency range.
To complement vibration analysis, ultrasound- and sound-based techniques have emerged as valuable tools. Chaki et al. used ultrasonic waves to assess bolt looseness by monitoring wave propagation characteristics, offering a non-destructive and efficient method [8]. Kong et al. and Wang et al. further explored sound analysis, using tapping sound and acoustic energy, to determine bolt tightness levels [9,10]. These methods provided alternative perspectives on bolt-looseness detection.
The emergence of neural networks and deep learning has significantly changed the detection of loosened bolts. Yuan et al. introduced a prediction method based on a BP neural network that analyzes audio signals to predict bolt loosening. Building on this work, Wang and Song proposed a percussion-based method using 1D-MACLSTM networks for classifying the state of bolt looseness [11]. It eliminated the need for manual feature extraction and showed superior performance in noisy environments, highlighting the adaptability of deep-learning approaches.
Vision-based monitoring has become a promising method for detecting bolt looseness. Sun et al. developed a binocular vision-based system to detect bolt looseness in train components, achieving high precision and repeatability [12]. They used image processing and depth perception to analyze bolt tightness. Pan et al. took it further by using PAC-code stickers on bolt heads to determine rotation angles and assess loosening states [13]. This method combined unique identification with precise angle measurement for a robust and efficient solution. Wang et al. introduced a new approach to detecting bolt looseness using machine vision [14]. Their method integrated the top and side features of bolts to improve accuracy. Wu et al. proposed a method that combined a high-resolution cross-scale transformer and monocular vision measurement [15]. Xue et al. suggested a method based on patch antennas to measure bolt elongation by analyzing the shift in resonant frequency. This provides an accurate and quantitative assessment of bolt looseness [16,17]. Han et al. presented a multi-source visual sensor that combines 2D intensity and 3D depth information to detect the tightness of rail fasteners. This method exceeds the limitations of traditional 2D-image-based approaches [18]. It removes the need for manual feature extraction and demonstrates superior performance in noisy environments, highlighting the adaptability of deep learning methods.
The focus has been primarily on detecting looseness in single-point bolts. However, the expense and numerous challenges associated with achieving multi-point measurements through repeated single-point measurements are significant [19]. It is, therefore, essential to devise a method that enables distributed, multi-point, and extended monitoring of rail anomalies, ultimately enhancing the safety and reliability of railway systems.
DAS is known for its high spatial resolution, extensive frequency range, and precise measurements. It helps in the distributed, long-term, and dynamic measurement of vibration signals along railway tracks [20]. Thus, this study uses DAS to measure vibration signals during instances of track abnormality and analyzes their distinct features. The findings contribute to establishing a foundational framework for identifying track anomalies resulting from bolt loosening. This will advance the detection and maintenance of railway systems.
In this paper, we first review the current research on detecting anomalies in straddle-type monorail tracks and loosening bolts. Section 2 introduces the DAS equipment used in this study and provides relevant information about the monitored track, detailing the experimental design and procedures. Section 3 analyzes the DAS monitoring results of track vibration signals under various operational states of the train. In Section 4, we discuss the observed phenomena and outline plans for future research. Finally, in Section 5, we summarize the main conclusions of this paper.
2. Methodology
2.1. Experimental Apparatus
2.1.1. HD-DAS
Figure 1 depicts the structure of the high-definition distributed acoustic sensing (HD-DAS) device. This system offers real-time monitoring, high density, high accuracy, and high fidelity. In the context of rail vibration monitoring, the HD-DAS system can be installed on the tracks to monitor rail vibration continuously. The deployment of high-density monitoring points offers more precise information on vibration distribution. The system’s high-precision monitoring capabilities assist in accurately reconstructing rail vibration waveforms. With a wide frequency range of 0–2000 Hz, the system allows for comprehensive monitoring of rail vibration signals through fiber optic cables for remote monitoring. Moreover, the high dynamic range ensures the accurate reproduction of rail vibration signals.
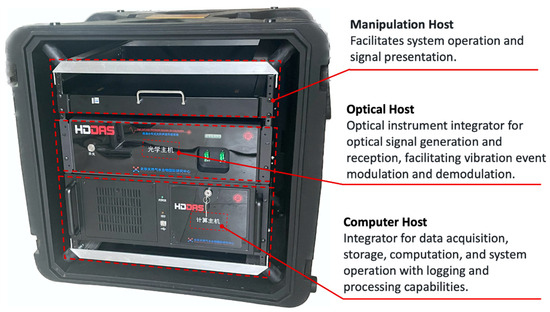
Figure 1.
HD-DAS device illustration.
The HD-DAS system is a dual-pulse heterodyne phase-sensitive optical time-domain reflectometry (Φ-OTDR) [21,22,23,24]. It operates by transmitting two pulses with frequencies f1 and f2, offset in time by Δt along the fiber, generating backscattered Rayleigh signals. Vibration events cause a phase change in the pulses, modulated into the interference signal between the two pulses. The designed heterodyne demodulation algorithm is then employed to extract this vibration-induced phase change, allowing for the detection of the events and the recovery of their waveforms. The shared noise characteristics of the two pulses traveling along the same fiber enable a substantial improvement in the signal-to-noise ratio through heterodyne demodulation, thereby achieving high-precision vibration detection and waveform recovery [23].
The relationship between the phase change φ (unit of rad) and the strain change τ (unit of pε) of the HD-DAS system can be formulated as follows [21]:
where n = 1.5 is the effective refractive index of optical fiber, L = 7 m is the gauge length, λ = 1550 nm is the wavelength, P11 = 0.121 and P12 = 0.270 are the elastic-optic constants, and μ = 0.17 is the Poisson’s ratio. Therefore, the relationship between the phase change and the strain change is τ = 2.1 × 10⁴φ.
The HD-DAS is structured around several pivotal components (Figure 2).
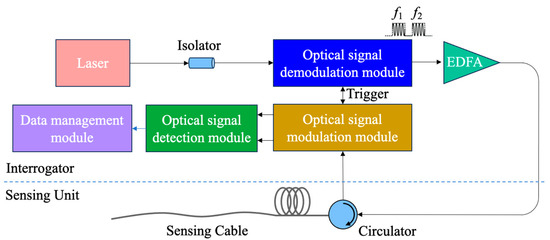
Figure 2.
Structure of HD-DAS system (Redrawn from Ref. [21]).
The setup includes an optical signal modulation module that generates heterodyne modulation pulse pairs. An erbium-doped fiber amplifier (EDFA) amplifies these modulation pulses. A circulator injects the modulation pulses into the sensing fiber and directs the scattered light back to the signal detection module. The signal detection module detects the scattered light and uses a heterodyne demodulation algorithm to extract phase change information. The sensing fiber is a critical component that collects acoustic signals and distributes many sensing channels along its length. A dedicated heterodyne demodulation module is tasked with demodulating the phase changes to obtain high-precision phase signals. Lastly, a data management module records and processes these phase signals to extract essential acoustic event information. The integrated system of components facilitates the comprehensive all-fiber acoustic signal detection process, which encompasses modulation, amplification, injection, detection, and demodulation steps, thereby enabling the effective realization of acoustic event detection and analysis.
2.1.2. Experimental Rail
We conducted the experiments in the straddle-type monorail test facility under Bombardier Transportation Systems Ltd. The experimental track, extending over a length of 300 m, featured multiple finger-band expansion joints connecting the rail beams. Additionally, the track incorporated two turnouts, as depicted in Figure 3.
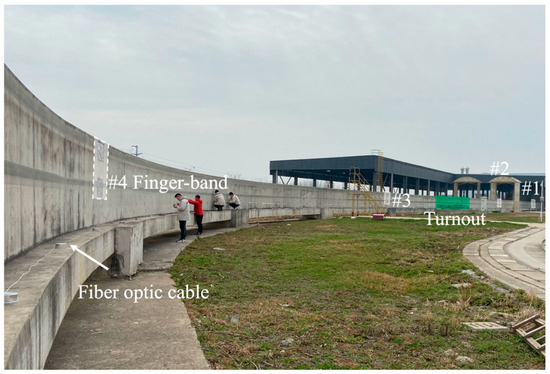
Figure 3.
Actual photo of experimental factory area: white dashed lines indicate finger-bands, green dashed boxes indicate turnouts, and white arrows point to fiber optics.
Figure 4 provides a schematic illustration of the experimental system. The track configuration includes two straight segments and a curved track. The rail beams are joined by five finger-band connectors, with turnouts between the #2 and #3 finger-band joints following the #5 finger-band joint. The fiber optic cable is terminated at its leading end with the HD-DAS system, while the trailing end is extended to the terminal point of the track.
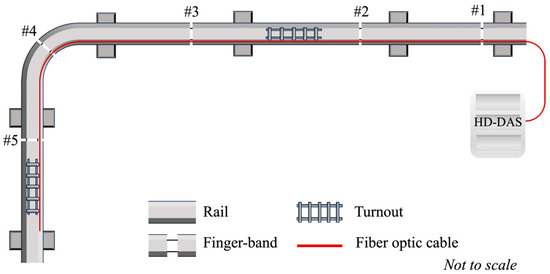
Figure 4.
Schematic of the experimental rail system.
Along the interior of the rail beams, we installed monitoring fibers. The fibers were subjected to stretching to ensure tensioning and subsequently secured in place with robust adhesive tape, as illustrated in Figure 5.
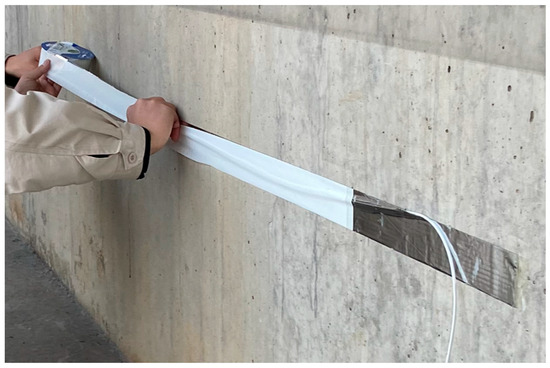
Figure 5.
Field image of fiber optic cable deployment.
2.2. Experimental Scheme
Firstly, based on DAS, we conducted experiments to measure the speed of a monorail train and to analyze the characteristics of track vibration signals under conditions of finger-band loosening. Initially, we recorded track vibrations at the train’s 3 km/h and 4.5 km/h speeds—the analysis of the vibration signals allowed for the measurement of the train’s actual speed.
As depicted in Figure 6, we selectively loosened three bolts on the finger-band that is oriented in the direction of train travel, which coincides with the direction of the fiber optic cable’s trailing end. Then, we monitored the track-vibration signal characteristics at a constant train speed of 4.5 km/h, with the #4 finger-band exhibiting degrees of loosening equivalent to 1 and 2 buckles. In this way, the impact of finger-band loosening on the vibrational signature of the track has been monitored.
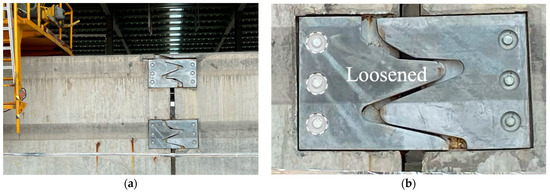
Figure 6.
Actual photo of finger-band assembly: (a) shows the overall finger-band assembly, while (b) is an enlarged view highlighting the finger-band details. In (b), the white dashed lines indicate loosened screws, with the screws of both pairs of finger-bands being loosened to the same extent.
2.3. Experimental Procedure
In the initial phase of the experimental setup, we affixed the fiber-optic cable to the interior surface of the rail beam, as detailed earlier. Once the fiber was adequately secured, we conducted a connectivity test to verify its functionality. After confirming the integrity of the fiber installation, we initiated the monorail train operation system, keeping the train stationary at the starting point to capture the background noise of the system.
Following the noise recording, we set the train’s speed to 3 km/h and documented the vibration signals emitted during the train’s forward journey. Upon reaching the terminal point, the train was directed to return, maintaining a consistent 3 km/h speed. This process continued until the train completed the round trip and arrived at the original starting point. Consistent with the previous procedure, following the completion of the experiment at a train speed of 3 km/h, we conducted a subsequent trial with the train operating at an increased speed of 4.5 km/h.
Upon completing the speed measurement experiments, we conducted experiments focused on monitoring signals indicative of finger-band loosening. Considering that the #4 finger-band is positioned at the curved track, which poses a greater operational risk for the train than the straight sections, we chose this finger-band for our initial analysis [25,26]. We started by loosening the bolts of the #4 finger-band by one buckle. Then, we dispatched the train from the starting point at a controlled speed of 4.5 km/h while employing DAS to capture the vibration signals emitted during the traversal. In a subsequent step, we increased the loosening by an additional buckle. We maintained the train’s speed at 4.5 km/h to assess and compare the differential effects of the varying degrees of loosening on the signals.
3. Experimental Results and Analysis
The waterfall plots depicted in Figure 7 provide a comprehensive visualization of the track-vibration signals recorded by the DAS system under various train speeds. Analyzing these plots, it becomes apparent that the gradient of the velocity characteristic curve, derived from the DAS-captured vibration signals, can be effectively utilized to measure the train’s speed of progression with a high degree of accuracy.
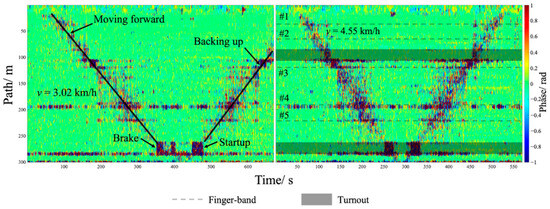
Figure 7.
DAS waterfall plots at 3 km/h and 4.5 km/h speeds.
In this study, the DAS system successfully recorded train speeds of 3.02 km/h and 4.55 km/h, which are in exact agreement with the predetermined speeds of the train. This correlation validates the reliability and precision of the DAS system in monitoring and measuring train speed.
Furthermore, the waterfall plots provide a means for visually discerning the train’s operational states, including moving forward, reversing, braking, and starting up, as illustrated. This visualization enhances the interpretability of the data, allowing for a clearer understanding of the train’s dynamic behavior.
Moreover, the waterfall plots facilitate identifying and localizing specific track features, such as finger-band joints and turnouts. And, due to the #4 finger-band’s location at a curve, there is a certain level of noise response in the vicinity of this area, which is inferred to be caused by the structural connections of the curve. Analyzing the distinctive patterns in the vibration signals makes it easy to identify these track structures’ presence and location.
To investigate the impact of bolt looseness in the finger-band on track-vibration signals, we analyzed both the time-domain and frequency-domain signals recorded by the DAS system. Figure 8 presents the wavelet synchro-squeezed transform (WSST) results for the DAS signal under varying degrees of bolt looseness. Figure 8a–c depict the WSST results when the train passes over the #4 finger-band with the bolts fastened, bolts loosened by one buckle, and bolts loosened by two buckles. The WSST analysis reveals that the train passing over the finger-band exhibited no distinct features before the bolts were loosened. However, after bolts were loosened, the WSST showed a marked increase in vibrational energy response, with the degree of bolt looseness correlating positively with the intensity of the energy response.
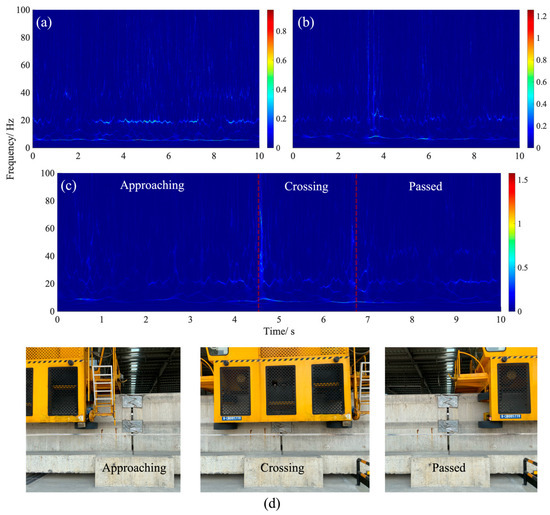
Figure 8.
WSST diagram and relative position of monorail and finger-band: (a) bolts fastened, (b) one buckle loosened, (c) two buckles loosened. (a–c) represent the configurations with the bolt fastened, one buckle unfastened, and two buckles unfastened, respectively. In (c), the two red dashed lines divide the WSST into three sections: approaching, crossing, and passed. (d) shows the relative position of the monorail to the finger-band, corresponding to the three sections in (c).
Figure 8c,d further dissect the phenomenon. It is evident that when bolts are loosened, the train’s passage over the finger-band leads to enhanced vibrations, manifested as distinct energy bands in the WSST. These energy bands correspond to the relative positioning of the train and the finger-band. The absence of the first energy band indicates that the train has yet to reach the loosened finger-band. The appearance of the first energy band coincides with the front of the train making contact with the finger-band. The region between the first and second energy bands represents the duration of the train crossing the finger-band. The emergence of the second energy band signifies that the rear wheels of the train have passed the finger-band.
By analyzing the Power Spectral Density (PSD) of the vibration signals generated during the train’s passage over the finger-band, as shown in Figure 9, it can be seen that the predominant vibration frequencies are concentrated below the 100 Hz threshold. This observation is corroborated by the previous discussions, which categorized the primary frequency bands of the vibration signals into two distinct intervals, 0–20 Hz and 20–50 Hz. Furthermore, the effect of finger-band loosening on the signal is more pronounced in the 20–50 Hz frequency band. This way, 20–50 Hz is treated as the characteristic frequency band.
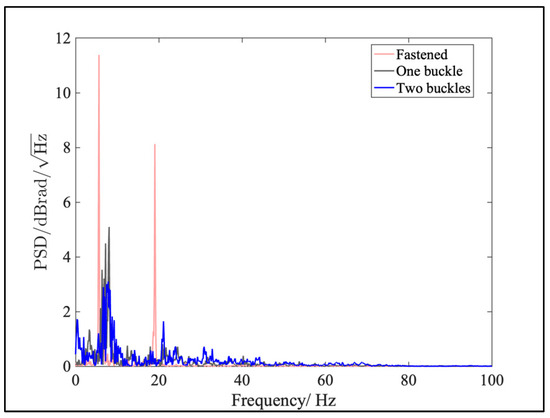
Figure 9.
PSD for different bolt-loosening conditions.
The PSD curves exhibit a bimodal pattern, with two distinct peak frequency value characteristics of the vibration patterns. Furthermore, upon loosening the finger-band, it is observed that both peak frequencies of the PSD curves shift towards higher frequencies, and their amplitudes diminish. This shift in peak frequencies suggests a change in the dominant vibration frequencies due to the altered condition of the finger-band.
However, despite the changes in peak frequencies and amplitude, the overall PSD values across the entire frequency spectrum exhibit an increase. This observation suggests that the loosening of the finger-band has resulted in a redistribution of vibration energy across the frequency spectrum, with a potential increase in the vibration energy at higher frequencies.
The sum of PSD values across the entire frequency range and within the specific 20–50 Hz band was aggregated, as illustrated in Figure 10. Upon loosening the finger-band, the cumulative PSD values in both the entire frequency range and the 20–50 Hz band showed a marked increase. Moreover, the degree of loosening directly influenced the magnitude of this increase; the more the finger-band was loosened, the more pronounced the rise in the cumulative PSD values. Additionally, the relative contribution of the 20–50 Hz band to the total PSD within the entire frequency range increased post-loosening, indicating a shift in the distribution of vibration energy towards higher frequencies.
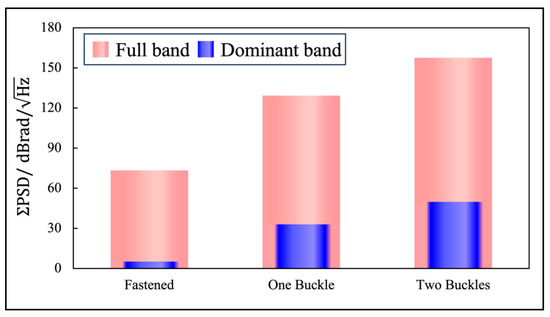
Figure 10.
Accumulated PSD across different frequency ranges for various bolt-loosening conditions: ΣPSD represents accumulated PSD.
The analysis indicated that the 20–50 Hz power spectral density (PSD) band was susceptible to the condition of the finger-band. When the finger-band was loosened, the vibration energy within this band shifted towards higher frequencies, resulting in a significant increase in the cumulative PSD values. This shift was more pronounced than the overall increase across the entire frequency range, as evidenced by the steeper rise in the PSD values within the 20–50 Hz band post-loosening.
Furthermore, the analysis revealed that the proportion of the cumulative PSD within the 20–50 Hz band to the total PSD across the entire frequency range increased after the finger-band was loosened. This suggests that the loosening of the finger-band had a more pronounced effect on the vibration energy within the 20–50 Hz band compared to other frequency bands. This finding aligns with the notion that the 20–50 Hz band is more sensitive to changes in the finger-band’s condition, making it a more reliable indicator of the finger-band’s condition.
To further analyze the energy characteristics of the vibration signals, we analyzed the time-domain signals when the train passed over the #4 finger-band, calculating the root mean square (RMS) of the vibration amplitudes, as depicted in Figure 11. A distinct increase in RMS is observed following the loosening of the finger-band. As shown in Figure 11a, when the finger-band is loosened by one buckle across the entire frequency range, there is no significant increase in RMS. However, when loosened by two buckles, the RMS value sharply increased.
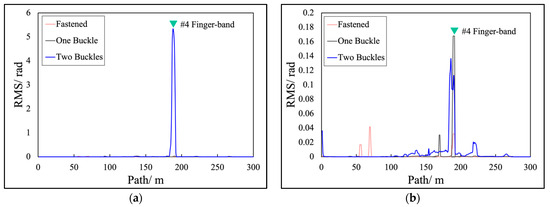
Figure 11.
RMS across different frequency ranges for various bolt-loosening conditions: (a) full frequency range and (b) 20–50 Hz frequency band.
For the characteristic frequency band, specifically within the 20–50 Hz range, we calculated the RMS, as shown in Figure 11b. When the finger-band is fastened, there are multiple peaks in the RMS at the #2 and #4 finger-band joints and the first turnout, suggesting potential anomalies at these locations. After loosening one buckle, a higher peak appears at the #4 finger-band, with a smaller peak at the curve. Moreover, the multiple peaks present when the finger-band is fastened, except for the peak at the #4 location, disappeared, which is attributed to the stronger vibration at the #4 location after the finger-band loosening, absorbing and masking the energy from other structures, resulting in a prominent RMS peak.
When the finger-band is loosened by two buckles, a peak in RMS is also observed at the #4 location, but the RMS distribution exhibits multiple anomalies. We hypothesize that this is due to the significant impact on the train’s movement caused by the substantial loosening of the #4 finger-band, leading to abnormal behavior. Complex vibrations are generated at the track connections, which, when superimposed, produce anomalous vibration signals that rapidly propagate along the track to other locations.
In summary, the loosening of the finger-band leads to abnormal RMS values across the entire frequency range and within the characteristic frequency band. Additionally, a higher RMS peak is observed at the loosening location. It suggests that the loosening of the finger-band alters the distribution of vibration energy along the track, resulting in a concentration of power at the loosened region.
In summary, the DAS signal analysis process for monorail trains established in this article is as shown as Figure 12.
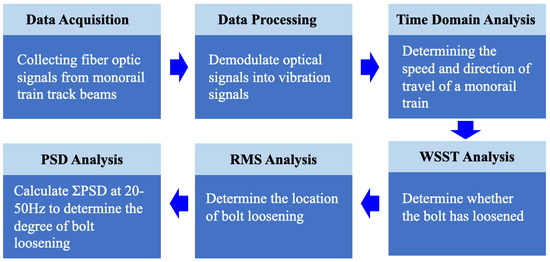
Figure 12.
Signal-processing flowchart.
4. Discussion
We observed an obvious vibration response at the connection structures, specifically the finger-bands and turnouts. The vibration amplification around the structures is noticeable even when the train is not running, as depicted in Figure 13. This phenomenon occurs because the operational noise of the system stimulates the vibration of the rail beam. Rail beams are rigid, and the connections are regions of reduced stiffness, which are more prone to resonance [27]. When the train is not moving, the operating system remains active and generates noise signals concentrating on the connection structures.
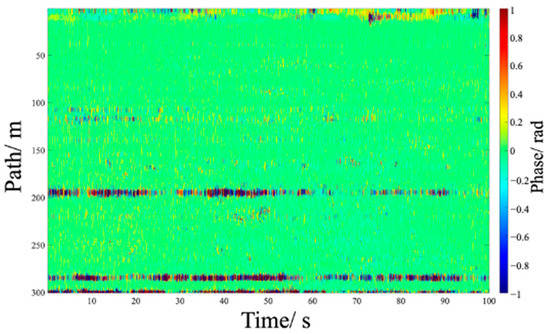
Figure 13.
DAS waterfall plot for experimental system’s noise floor.
Most vibration signals fall within two frequency ranges during the spectral analysis: 0–20 Hz and 20–50 Hz. The noise floor is primarily present in the 0–20 Hz range, as shown in Figure 14. To improve the accuracy of the analysis and reduce the impact of noise, we chose to focus on the 20–50 Hz range. Within this range, the main components of the signal are amplified, while the noise level is reduced. This allows for more precise identification and analysis of the signal characteristics, resulting in more convincible data.
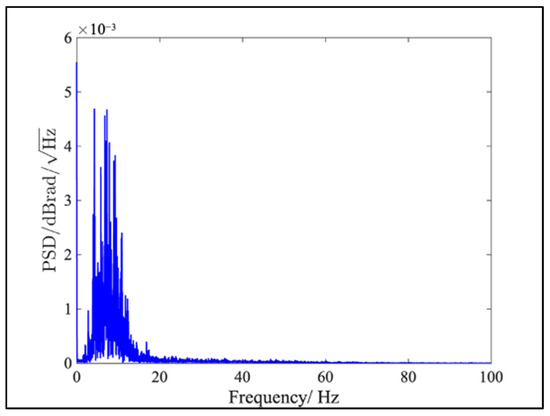
Figure 14.
DAS PSD plot for experimental system’s noise floor.
In this study, we have limited the tests to two specific train speeds: 3 km/h and 4.5 km/h, which is a relatively narrow scope of investigation. Primarily, we avoided excessively high speeds to ensure comprehensive monitoring and detailed analysis of the vibration signals. This is because a fast train would have shortened the measurement period, potentially leading to critical signals being missed. Secondly, given the need for finger-band loosening within the experimental framework, using higher speeds could have increased safety risks and impeded the smooth running of the experiment. In addition, the limitations imposed by the performance of our equipment made high-speed testing infeasible. Conversely, the use of prolonged speeds could have rendered the signals indistinct, thereby compromising the accuracy of our data.
Considering these factors, we have formulated plans to enhance our equipment and refine our testing methods for upcoming experiments. Our objective is to conduct experiments at a broader range of train speeds, expanding the breadth of our research and bolstering the reliability of our findings. By gathering data across various train speeds, we aim to gain a deeper understanding of the influence of speed on our experimental outcomes.
We selected only the #4 finger-band for loosening, leaving the other finger-bands unchanged. We made this decision because we believe that loosening the #4 finger-band at a curve poses a higher risk, making its analysis more representative. We also considered the safety implications of loosening multiple finger-bands simultaneously, which could introduce significant safety hazards. Additionally, we minimized potential interference from turnouts because there was no turnout near the #4 finger-band. We also evaluated the risks associated with prolonged loosening experiments, as extended loosening could potentially cause harm to both the train and the track, leading to damage or hazards. In future experiments, we plan to explore longer intervals between loosening experiments and conduct comprehensive inspections after each one to ensure safety. Moreover, we aim to supplement the experiments by loosening finger-bands at other locations to enhance the comprehensiveness of our results. We also plan to incorporate experiments involving loosening other structural components related to the finger-bands, such as turnouts, to improve the generalizability of our findings.
We changed how we tighten the bolts that secure the finger-band to the rail beam. However, we found that our initial method could have been more precise. The tightening of the bolts needed to be more consistent, resulting in varying looseness levels after the operation. To improve this, we plan to use torque wrenches in our future research to ensure that each bolt is tightened with the same amount of force. When loosening the bolts, we will follow a specific standard to ensure each bolt is loosened to the intended level. These adjustments will make our experiment more precise and the results more reliable.
When the finger-bands were fastened, the vibration-signal energy at specific connection points on the track was relatively high. This can be attributed to the structural design’s inherent sensitivity to vibration. Precisely, it reflects a resonance phenomenon induced by the discontinuity of the track structure or the variability in local stiffness [28].
The changes in vibration energy distribution, observed after loosening the finger-band, indicate a shift in the track’s dynamic response. When one buckle was partially loosened, the vibration energy previously concentrated at the connection structures decreased, while the energy around the loosened finger-band increased. This happened because the loosening of the finger-band reduced its stiffness, making the connecting structures relatively stiffer, thus decreasing the vibration energy there [29]. Additionally, the concentration of vibration energy in the surrounding area increased the RMS in that region.
Upon complete loosening of the finger-band by two buckles, the vibration energy in the vicinity of the loosened region further escalated, with the energy at the actual loose location being even higher. This can be attributed to the further reduction in the stiffness of the finger-band, which led to an even more significant increase in the relative stiffness of the connecting structures, resulting in a further decrease in vibration energy at these locations. Additionally, the concentration of vibration energy in the surrounding area intensified, further increasing the RMS value in that region. This phenomenon manifests the intensified energy transfer and redistribution caused by the localized stiffness alterations within the track structure [30].
It was observed that as the degree of finger-band loosening increased, the distribution range of vibration energy underwent a significant change. This phenomenon can be attributed to four key factors: changes in stiffness, energy transmission, structural response, and the break of dynamic balance [31,32,33,34]. The loosening of the bolt resulted in a reduction in the stiffness of the finger-band, which in turn affected the overall stiffness distribution of the entire rail beam. When the finger-band was initially loosened by one turn, the change in stiffness may have had a limited impact on the overall vibration response of the rail beam, thus causing the vibration energy to concentrate primarily in the original high-energy regions. However, as the degree of loosening increased, the reduction in stiffness became more pronounced, leading to a more pronounced concentration of vibration energy in the vicinity of the loosened location and subsequently expanding the distribution range of vibration energy. The reduction in stiffness near the loosened location promoted the concentration of vibration energy in that region.
Nevertheless, the impact range remained limited due to the need for an effective energy transmission path formed by the change in stiffness. With further loosening of the finger-band, the additional reduction in stiffness allowed vibration energy to be transmitted more effectively across the rail beam, thereby expanding the range of its influence. As the bolt looseness increased, the structural response of the rail beam became more complex. Initially, when the finger-band was loosened by one buckle, the structural response may have still been within the linear range. However, after two turns of loosening, the response may have entered a non-linear region, potentially leading to significant changes in energy distribution. During the bolt-loosening process, the dynamic balance of the rail beam may have changed. Initially, the change may not have been significant, but after two buckles of loosening, the dynamic balance may have undergone a considerable shift, further affecting the distribution of vibration energy.
In summary, as the finger-band loosening increased, the reduction in rail beam stiffness affected the vibration energy distribution near the loosened location. It influenced the rail beam’s overall vibration response. The energy transfer and redistribution caused by the change in stiffness are the reasons for the expansion of the distribution range of vibration energy, especially more pronounced after two buckles of loosening.
We propose conducting larger-scale tests to validate the universality and regularity of our experimental findings. The current testing, limited to a monorail train, may need to be revised to fully uncover the complex dynamic behaviors of train cars in multi-train combinations. Therefore, it is necessary to conduct tests involving multiple train cars to assess the impact of varying numbers of vehicles on vibration signals. This approach will facilitate a more comprehensive understanding of the vibration characteristics of rail beams under different loading conditions, thereby providing more accurate guidance for rail maintenance and optimization. Moreover, our research should be more aligned with real-world scenarios because railway operations typically involve trains of multiple cars. By testing train cars of different numbers, we obtained more representative data, thereby enhancing the practicality and effectiveness of our research. Therefore, we recommend expanding the scope of our research to include tests with multiple train cars in subsequent studies to validate our experimental results further and ensure that our findings can be better applied in practical engineering practices.
5. Conclusions
We used the HD-DAS monitoring system to understand DAS-based rail anomaly monitoring better. We captured vibration signals on a monorail train track at various train speeds and different levels of bolt loosening within the finger-band assembly. Our analysis showed that the time-domain signals from DAS can accurately measure train speed and determine the train’s operational states, such as starting, braking, moving forward, and reversing. These signals also help identify and locate specific track features, like turnouts and finger-bands. We observed a significant increase in the energy of the DAS vibration signals when bolts in the finger-band are loose, with the energy increase corresponding to the degree of loosening. These findings improve the ability to detect, locate, and assess rail track anomalies, contributing to the maintenance and safety of railway systems.
Author Contributions
Conceptualization, K.Z. and H.K.; methodology, K.Z.; software, X.H.; validation, S.W., M.Z. and H.L.; formal analysis, H.L.; investigation, K.Z.; resources, X.H.; data curation, H.L.; writing—original draft preparation, K.Z.; writing—review and editing, K.Z.; visualization, S.W.; supervision, X.H.; project administration, H.K.; funding acquisition, X.H and K.Z. All authors have read and agreed to the published version of the manuscript.
Funding
This research was funded by the Technology Innovation Center for Carbon Sequestration and Geological Energy Storage, the Ministry of Natural Resources, and the Chinese Academy of Geological Sciences grant number MNRCCUS062302, and the National Natural Science Foundation of China (NSFC) grant number 62105007, and the Financial Support from China Geological Survey grant number DD20221703.
Informed Consent Statement
Not applicable.
Data Availability Statement
The datasets presented in this article are not readily available because the data are part of an ongoing study.
Conflicts of Interest
The authors declare no conflict of interest.
References
- Da Silva Ferreira, M.; Vismari, L.F.; Cugnasca, P.S.; De Almeida, J.R.; Camargo, J.B.; Kallemback, G. A comparative analysis of unsupervised learning techniques for anomaly detection in railway systems. In Proceedings of the 2019 18th IEEE International Conference on Machine Learning and Applications (ICMLA), Boca Raton, FL, USA, 16–19 December 2019; IEEE: Boca Raton, FL, USA, 2019; pp. 444–449. [Google Scholar]
- Zheng, S.; Wang, Y.; Li, L.; Chen, X.; Peng, L.; Shang, Z. A railway fastener inspection method based on abnormal sample generation. Comput. Model. Eng. Sci. 2024, 139, 565–592. [Google Scholar] [CrossRef]
- Gao, L.; Jiu, Y.; Wei, X.; Wang, Z.; Xing, W. Anomaly Detection of Trackside Equipment Based on GPS and Image Matching. IEEE Access 2020, 8, 17346–17355. [Google Scholar] [CrossRef]
- Guo, X.; Wei, X.; Guo, M.; Wei, X.; Gao, L.; Xing, W. Anomaly detection of trackside equipment based on semi-supervised and multi-domain learning. In Proceedings of the 2020 15th IEEE International Conference on Signal Processing (ICSP), Beijing, China, 6–9 December 2020; IEEE: Beijing, China, 2020; pp. 268–273. [Google Scholar]
- Chelimilla, N.; Chinthapenta, V.R.; Kali, N.; Korla, S. Review on recent advances in structural health monitoring paradigm for looseness detection in bolted assemblies. Struct. Health Monit. 2023, 22, 4264–4304. [Google Scholar] [CrossRef]
- He, K.; Zhu, W.D. Detecting Loosening of Bolted Connections in a Pipeline Using Changes in Natural Frequencies. In Proceedings of the Volume 1: 23rd Biennial Conference on Mechanical Vibration and Noise, Parts A and B, Washington, DC, USA, 28–31 August 2011; ASMEDC: Washington, DC, USA, 2011; pp. 525–533. [Google Scholar]
- Huda, F.; Kajiwara, I.; Hosoya, N.; Kawamura, S. Bolt loosening analysis and diagnosis by non-contact laser excitation vibration tests. Mech. Syst. Signal Process. 2013, 40, 589–604. [Google Scholar] [CrossRef]
- Chaki, S.; Corneloup, G.; Lillamand, I.; Walaszek, H. Combination of Longitudinal and Transverse Ultrasonic Waves for In Situ Control of the Tightening of Bolts. J. Press. Vessel Technol. 2007, 129, 383–390. [Google Scholar] [CrossRef]
- Kong, Q.; Zhu, J.; Ho, S.C.M.; Song, G. Tapping and listening: A new approach to bolt looseness monitoring. Smart Mater. Struct. 2018, 27, 07LT02. [Google Scholar] [CrossRef]
- Wang, F.; Song, G. Bolt-looseness detection by a new percussion-based method using multifractal analysis and gradient boosting decision tree. Struct. Health Monit. 2020, 19, 2023–2032. [Google Scholar] [CrossRef]
- Wang, F.; Song, G. Looseness detection in cup-lock scaffolds using percussion-based method. Autom. Constr. 2020, 118, 103266. [Google Scholar] [CrossRef]
- Sun, Y.; Li, G.; Zhang, J.; Qian, D. Prediction of the strength of rubberized concrete by an evolved random forest model. Adv. Civ. Eng. 2019, 2019, 5198583. [Google Scholar] [CrossRef]
- Pan, Y.; Ma, Y.; Dong, Y.; Gu, Z.; Wang, D. A Vision-Based Monitoring Method for the Looseness of High-Strength Bolt. IEEE Trans. Instrum. Meas. 2021, 70, 3101316. [Google Scholar] [CrossRef]
- Wang, S.; Wu, J.; Zhao, Z.; Du, Y.; Ding, S.; Du, F. Bolt loosening angle detection based on binocular vision. Meas. Sci. Technol. 2023, 34, 035401. [Google Scholar] [CrossRef]
- Wu, T.; Shang, K.; Dai, W.; Wang, M.; Liu, R.; Zhou, J.; Liu, J. High-resolution cross-scale transformer: A deep learning model for bolt loosening detection based on monocular vision measurement. Eng. Appl. Artif. Intell. 2024, 133, 108574. [Google Scholar] [CrossRef]
- Xue, S.; Wang, H.; Xie, L.; Li, X.; Zheng, Z.; Wan, G. Bolt loosening detection method based on double-layer slotted circular patch antenna. Struct. Health Monit. 2024, 2024, 14759217241227992. [Google Scholar] [CrossRef]
- Xue, S.; Li, X.; Xie, L.; Yi, Z.; Wan, G. A bolt loosening detection method based on patch antenna with overlapping sub-patch. Struct. Health Monit. 2022, 21, 2231–2243. [Google Scholar] [CrossRef]
- Han, Q.; Wang, S.; Fang, Y.; Wang, L.; Du, X.; Li, H.; He, Q.; Feng, Q. A Rail Fastener Tightness Detection Approach Using Multi-source Visual Sensor. Sensors 2020, 20, 1367. [Google Scholar] [CrossRef]
- Cafiso, S.; D’Agostino, C.; Delfino, E.; Graziano, A.D.; Fox-Ivey, R.; Laurent, J. Laser triangulation measurement system: Application on railway track. In Bearing Capacity of Roads, Railways and Airfields; CRC Press: Boca Raton, FL, USA, 2018. [Google Scholar]
- Milne, D.; Masoudi, A.; Ferro, E.; Watson, G.; Le Pen, L. An analysis of railway track behaviour based on distributed optical fibre acoustic sensing. Mech. Syst. Signal Process. 2020, 142, 106769. [Google Scholar] [CrossRef]
- He, X.; Wu, X.; Wang, L.; Liang, Q.; Gu, L.; Liu, F.; Lu, H.; Zhang, Y.; Zhang, M. Distributed optical fiber acoustic sensor for in situ monitoring of marine natural gas hydrate production for the first time in the Shenhu area, China. China Geol. 2022, 5, 322–329. [Google Scholar] [CrossRef]
- He, X.; Pan, Y.; You, H.; Lu, Z.; Gu, L.; Liu, F.; Yi, D.; Zhang, M. Fibre optic seismic sensor for down-well monitoring in the oil industry. Measurement 2018, 123, 145–149. [Google Scholar] [CrossRef]
- He, X.; Xie, S.; Liu, F.; Cao, S.; Gu, L.; Zheng, X.; Zhang, M. Multi-event waveform-retrieved distributed optical fiber acoustic sensor using dual-pulse heterodyne phase-sensitive OTDR. Opt. Lett. 2017, 42, 442. [Google Scholar] [CrossRef]
- He, X.; Cao, Z.; Ji, P.; Gu, L.; Wei, S.; Fan, B.; Zhang, M.; Lu, H. Eliminating the Fading Noise in Distributed Acoustic Sensing Data. IEEE Trans. Geosci. Remote Sens. 2023, 61, 5906510. [Google Scholar] [CrossRef]
- Haryanto, B.; Nuramin, M.; Karmiadji, D.W.; Perkasa, M.; Anwar, A.; Prasetiyo, B.; Irawadi, Y.; Ivano, O.; Heryana, Y.; Hardiman, I. Verification of a new prototype design of bogie monorail frame with variation of static loading. Mech. Eng. Soc. Ind. 2023, 3, 78–85. [Google Scholar]
- Xu, H.; Xu, D.; Zheng, C.; Bai, X.; Li, W. Development and Testing of a Friction-Driven Forestry Electric Monorail Car. Forests 2023, 14, 263. [Google Scholar] [CrossRef]
- Eroğlu, M.; Koç, M.A.; Esen, İ.; Kozan, R. Realistic modelling for analysis of train-structure and ballasted-track interaction for high-speed trains. J. Vib. Eng. Technol. 2023, 12, 7065–7097. [Google Scholar] [CrossRef]
- Xu, C.; Luo, H.; Gan, X.; Liu, M.; Guo, H. Research on coupled vibrations between the low-to-medium speed maglev train and a long-span continuous beam bridge. Structures 2023, 56, 104927. [Google Scholar] [CrossRef]
- Zhouzhou, X.; Zixue, D.; Zhen, Y.; Junchao, Z. Research on vehicle-bridge vertical coupling dynamics of monorail based on multiple road excitations. Mechanics 2020, 26, 301–310. [Google Scholar] [CrossRef]
- Xue, Y.; Ye, F.; Peng, L. Experimental study of rail beam joint bolt loosening impact on rail structure vibration in high-speed maglev maintenance base. Urban Mass Transit 2024, 27, 17–21. [Google Scholar]
- Olfa, K.; Bertrand, C.; Slim, A.M.; Alain, D.; Mohamed, H. Experimental Study of the Loosening Phenomenon of an Assembly with Multi Fixations Under Vibration in the Transversal Direction. In Advances in Condition Monitoring of Machinery in Non-Stationary Operations; Del Rincon, F.A., Rueda, V.F., Chaari, F., Zimroz, R., Haddar, M., Eds.; Applied Condition Monitoring; Springer International Publishing: Cham, Switzerland, 2019; Volume 15, pp. 260–268. ISBN 978-3-030-1ss1219-6. [Google Scholar]
- Ramsi, R.M.; Rusli, M.; Bur, M. The Analysis of Loosening of Bolt Connection Due to Structural Vibration Through Changes in Dynamic Characteristics. J. Tek. Mesin 2023, 16, 56–62. [Google Scholar] [CrossRef]
- Samantaray, S.; Mittal, S.; Mahapatra, P.; Kumar, S. An impedance-based structural health monitoring approach for looseness identification in bolted joint structure. J. Civ. Struct. Health Monit. 2018, 8, 809–822. [Google Scholar] [CrossRef]
- Hu, Y.; Tan, A.C.; Liang, C.; Li, Y. Failure analysis of fractured motor bolts in high-speed train due to cardan shaft misalignment. Eng. Fail. Anal. 2021, 122, 105246. [Google Scholar] [CrossRef]
Disclaimer/Publisher’s Note: The statements, opinions and data contained in all publications are solely those of the individual author(s) and contributor(s) and not of MDPI and/or the editor(s). MDPI and/or the editor(s) disclaim responsibility for any injury to people or property resulting from any ideas, methods, instructions or products referred to in the content. |
© 2024 by the authors. Licensee MDPI, Basel, Switzerland. This article is an open access article distributed under the terms and conditions of the Creative Commons Attribution (CC BY) license (https://creativecommons.org/licenses/by/4.0/).